Results from the EPICAL-2 Ultra-High Granularity Electromagnetic Calorimeter Prototype
Abstract
A prototype of a new type of calorimeter has been designed and constructed, based on a silicon-tungsten sampling design using pixel sensors with digital readout. It makes use of the Alpide sensor developed for the ALICE Inner Tracking System (ITS) upgrade. A binary readout is possible due to the pixel size of . This prototype has been successfully tested with cosmic muons and with test beams at DESY and the CERN SPS. We report on performance results obtained at DESY, showing good energy resolution and linearity, and compare to detailed MC simulations. Also shown are preliminary results of the high-energy performance as measured at the SPS. The two-shower separation capabilities are discussed.
keywords:
digital calorimeter1 Introduction
The paradigm of digital calorimetry is the measurement of a high-energy particle by counting shower particles. Proof-of-principle studies have been performed with the Epical-1 prototype based on MIMOSA pixel sensors and are reported in [1]. In these proceedings, we report results from the next-generation prototype, Epical-2, which uses ALPIDE sensors. The project is closely related to an ongoing development of a protonCT detector [2] and uses the same technology for the active layers containing the ALPIDE sensors. It simultaneously serves as fundamental R&D on digital calorimetry and as a contribution to provide one of the technologies for the FoCal detector proposed [3] for the ALICE experiment at the CERN LHC.
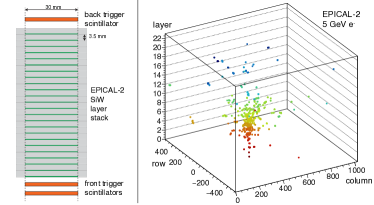
The new prototype is a SiW sampling detector with 24 layers of active cross section and a thickness of approximately each, consisting of tungsten absorbers and pairs of Si sensors. It utilises the ALPIDE CMOS pixel sensors developed at CERN for the ALICE ITS2 [4], which consists of a matrix of pixels of area . The state-of-the-art sensors allow for a readout speed of Epical-2 suitable for a modern particle physics experiment like ALICE, unlike the previous prototype. As the sensor is designed for tracking, one of the aims of this project is to study its suitability for calorimetry. The individual sensors of the detector have been calibrated and aligned using measurements with cosmic muons. Here, a selection of results on the test beam performance of Epical-2 is presented, from measurements at DESY in 2019, and from a preliminary analysis of data taken at the SPS in 2021. For comparison, detailed MC simulations have been performed with [5]. More details on the detector and the analysis can be found in an upcoming publication [6].
Fig. 1 shows an event display of a measurement of a single electron of 5 GeV. The fired pixels are shown at their position as a function of depth in terms of layer number and of transverse dimensions in terms of pixel row and column. One can clearly observe the characteristic development of a shower, with a narrow distribution in early layers, a maximum density after a few layers and a broadening in later layers. The average behaviour of the spatial distributions is consistent with the expectations from simulations. It is also apparent that fluctuations are significant for this low energy. The exploitation of the rich information content of these measurements has only started.
2 Performance at Low Energy
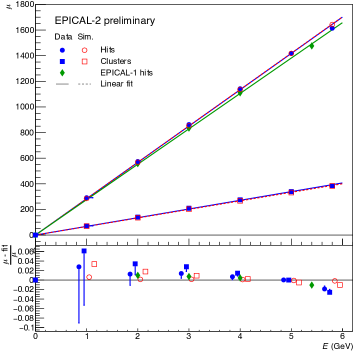
Both the number of hits (fired pixels) and the number of clusters (groups of adjacent hits) have been used as observables for the energy response. Fig. 2 shows the mean value of these observables as a function of beam energy. Naturally, is lower than . Both observables show a linear rise with beam energy, and the MC simulation agrees well with the experimental data. The data points are fitted with a linear function constrained to an intercept of 0, which for experimental data is taken from pedestal measurements. The lower panel of Fig. 2 shows the relative difference of the data points to the corresponding fit. The results from simulation for agree perfectly with this linear fit. The measured data for the same observable show a small deviation from linearity. As there is a possible deviation of the mean value of the true energy [8, 9], we have attempted to incorporate this into error bars, but these are difficult to estimate in particular at the highest energy. This suggests that the observed non-linearity is to a large extent related to the test beam properties. This is further supported by the agreement of similar measurements with a different detector (green symbols for EPICAL-1). In both experimental data and simulations, shows a slightly larger non-linearity, which is very likely due to cluster overlap.
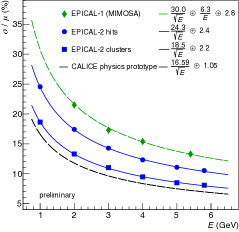
The energy resolution is shown in Fig 3 and is compared to two other experimental results. The resolution obtained from is already significantly better than the one from the previous prototype, as expected because that detector suffered from a number of non-working sensors. Interestingly, the resolution obtained from is significantly better than the one from . Apparently, the observable is less sensitive to single particle response fluctuations, which lead to variations of the cluster size, and thus to additional fluctuations in . The data are fitted with the function traditionally used to describe the energy dependence of the resolution of calorimeters:
| (1) |
and the results are indicated in the figure. The fits agree well with the data. The noise term is not needed for Epical-2, because, unlike for Epical-1, the noise is negligible. Finally, the data are also compared to results from the CALICE silicon-tungsten ECAL physics prototype [7], a state-of-the-art calorimeter with analog readout, which shows only slightly better resolution than our prototype. It should be noted that the present results are not corrected for the intrinsic momentum spread of the test beam.
3 Performance at High Energy
Recently, measurements with the detector prototype have also been performed with a mixed particle beam at the CERN SPS. The observable shows already first signs of non-linearity at low energy, and the effect of cluster overlap is expected to become more important for increasing hit density, and thus implicitly for higher beam energy. Therefore, for a first analysis of high energy measurements, only has been used. Fig. 4 shows the distributions of at a beam energy of 80 GeV. Three different maxima are observed: at there is a minimum-ionising peak with a Landau-like tail to large values, there is a broad peak around due to showering hadrons and a sharp peak for due to electrons. This interpretation is supported by the decomposition of the spectrum into the contributions for different particles as predicted by the MC simulations and shown in the figure. The description by simulation is very good, even to the level of very rare events with particles producing only very few hits seen to the left of the MIP. It is apparent that the electron component is well separated, so that an independent analysis is possible. For the results below, we restrict the analysis to a interval around the electron peak, where the hadron contamination should be of the order of or smaller.
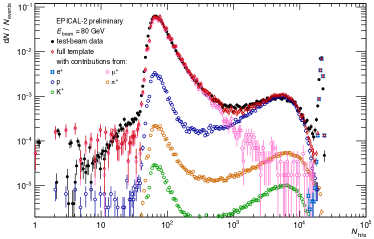
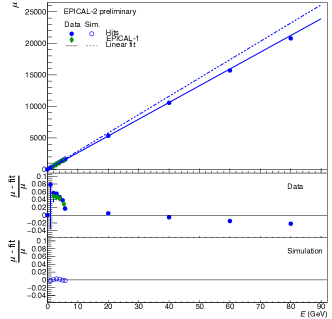
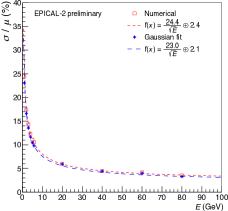
Fig. 5 shows the mean value of the response as a function of beam energy. Now, in addition to the results discussed above, preliminary results from measurements at the SPS H6 test beam up to are shown. Again, linear fits are performed. As only low-energy data points were available from simulations at this point, the corresponding linear fit is the same as in Fig. 3, while the fit to measured data has changed due to the additional data points. The bottom panel again shows the relative deviation from linearity – the stronger deviation of the measured low energy points is due to the different fit used here.
Again, data show good linearity when taking into account that the non-linearity at low energy is mostly due to the beam energy uncertainty. The small deviations from linearity at high energy could be due to saturation of the apparent hit density in the shower core. We expect that this can be corrected on an event-by-event basis, but such a study is beyond the scope of these proceedings. Likely, a similar correction can be performed for to make that observable also usable at high energy.
Fig. 6 shows the energy resolution when using , now also extended to higher energy with preliminary results. The behaviour of this observable from low energy is confirmed, demonstrating good energy resolution. This analysis is likely more sensitive to a possible contamination by hadrons, but we expect further corrections to be small.
4 High-Granularity Potential
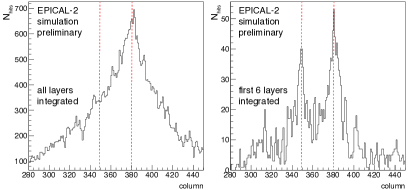
While the above results demonstrate that the general calorimetric performance of the new technology is good, they do not make full use of its particular strength. Detailed information of the event-by-event distributions of showers (as shown e.g. Fig. 1) is available, but analysis exploiting this is still ongoing. Usage of that information may allow further improvement of the reconstruction of showers. It will in particular allow the separation of overlapping showers at very small distances. This can be demonstrated from simulations of such a case, as shown in Fig. 7, where hit distributions are given for a single simulated event containing one electron of 250 GeV and a second one of 30 GeV vertically separated by . The distributions are shown as a function of pixel column integrated over the other transverse coordinate (pixel row). For the left panel, the distributions were integrated over the full depth of the detector, i.e. all sensor layers. Just a single peak of the more highly energetic electron is observed here, no hint of the lower energy electron is visible. For the right panel, only the first 6 layers were used for longitudinal integration. In this case, two peaks are observed, one each at the position of incidence of one of the incoming particles. Clearly, already with such a simple measure, Epical-2 can easily discriminate two close-by showers at distances of the order of 1 mm, which would be perceived as a single shower in a conventional calorimeter. Using individual layers, the digital pixel technology will ensure this kind of performance also for the future FoCal detector in ALICE.
A fully digital pixel calorimeter, like Epical-2, will allow one to perform much more powerful analysis of showers. An analysis of the three-dimensional shower distribution is possible event by event, likely pushing the two-shower separation power to even smaller distances, possibly improving the energy measurement beyond what is shown here via an explicit correction for saturation and allowing for the subtraction of e.g. the contribution of a minimum-ionizing particle overlapping an electromagnetic shower. More in general, the device should have extremely high potential for the use of particle flow algorithms [10].
5 Conclusion
Epical-2, a prototype of an electromagnetic digital pixel calorimeter, has been constructed and successfully tested with cosmics and in test beams. The detector has performed extremely well, with low noise and good uniformity. The chosen sensor, the ALPIDE, has shown its suitability for the calorimetric environment. Simulations using the framework describe the behaviour of the device up to a high level of detail.
Results from a detailed analysis of low-energy measurements are presented. The basic calorimetric performance, in terms of energy linearity and resolution, is very good. Of the two observables employed, provides better resolution, but is slightly worse in terms of linearity. Efforts are under way to find the optimal energy reconstruction. With the current algorithms, the resolution at low energy is comparable to the state of the art of analog SiW calorimeters.
Results at high energy, as observed from a preliminary analysis, are consistent with the behaviour at low energy, confirming the good performance. These results are obtained using a mixed particle beam, so a hadron contamination is not fully excluded, although we expect it to be very small. Further advancements of reconstruction algorithms may be more important to achieve optimum performance for high-energy showers. The current knowledge gives confidence that the technology will meet the requirements for pixel layers in FoCal. While the basic calorimetric performance is comparable to the state of the art, the technology will clearly be superior in terms of two-shower separation. Much more detailed analysis of e.g. the event-by-event behaviour of shower shapes can be performed and will be the scope of future publications.
Acknowledgments
We would like to thank J.A. Hasenbichler for providing the results of the TCAD simulations, J. Schambach for the multi-channel transition board design, and M. Bonora and M. Lupi for help in installation/implementation and adaptation of FPGA firmware and software. We also thank the test beam coordinators and the supporting people at DESY and the CERN SPS for the usage of the test beam, and M. Stanitzki for useful discussions. This work was partially supported by the Nederlandse Organisatie voor Wetenschappelijk Onderzoek (NWO), Netherlands.
References
References
- [1] A. P. de Haas, et al., The FoCal prototype — an extremely fine-grained electromagnetic calorimeter using CMOS pixel sensors, JINST 13 (01) (2018) P01014. doi:10.1088/1748-0221/13/01/P01014.
- [2] J. Alme, et al., A High-Granularity Digital Tracking Calorimeter Optimized for Proton CT, Front. Phys. 8 (2020) 568243. doi:10.3389/fphy.2020.568243.
-
[3]
C. Alice Collaboration, Letter
of Intent: A Forward Calorimeter (FoCal) in the ALICE experiment,
CERN-LHCC-2020-009.
URL https://cds.cern.ch/record/2719928?ln=en - [4] G. Aglieri Rinella, et al., The ALPIDE pixel sensor chip for the upgrade of the ALICE Inner Tracking System, Nucl. Instrum. Meth. A 845 (2017) 583–587. doi:10.1016/j.nima.2016.05.016.
- [5] S. Spannagel, et al., Allpix2: A modular simulation framework for silicon detectors, Nucl. Instrum. Meth. A 901 (2018) 164–172. doi:https://doi.org/10.1016/j.nima.2018.06.020.
- [6] J. Alme, et al., Performance of the Electromagnetic Pixel Calorimeter Prototype Epical-2, to be submitted to JINST.
- [7] C. Adloff, et al., Response of the CALICE Si-W electromagnetic calorimeter physics prototype to electrons, Nucl. Instrum. Meth. A 608 (2009) 372–383. arXiv:0811.2354, doi:10.1016/j.nima.2009.07.026.
- [8] R. Diener, et al., The DESY II test beam facility, Nucl. Instrum. Meth. A 922 (2019) 265–286. doi:10.1016/j.nima.2018.11.133.
- [9] M. Stanitzki, private communication (2022).
- [10] J.-C. Brient, H. Videau, The Calorimetry at the future e+ e- linear collider, eConf C010630 (2001) E3047. arXiv:hep-ex/0202004.