Emergence of a new H i 21-cm absorption component at 1.1726 towards the ray blazar PKS 2355-106
Abstract
We report the emergence of a new H i 21-cm absorption at = 1.172635 in the damped absorber (DLA) towards the -ray blazar PKS 2355-106 (1.639) using science verification observations (June 2020) from the MeerKAT Absorption Line Survey (MALS). Since 2006, this DLA is known to show a narrow H i 21-cm absorption at = 1.173019 coinciding with a distinct metal absorption line component. We do not detect significant H i 21-cm optical depth variations from this known H i component. A high resolution optical spectrum (August 2010) shows a distinct Mg i absorption at the redshift of the new H i 21-cm absorber. However, this component is not evident in the profiles of singly ionized species. We measure the metallicity ([Zn/H] = (0.770.11) and [Si/H]= (0.960.11)) and depletion ([Fe/Zn] = (0.630.16)) for the full system. Using the apparent column density profiles of Si ii, Fe ii and Mg i we show that the depletion and the (Mg i)/(Si ii) column density ratio systematically vary across the velocity range. The region with high depletion tends to have slightly larger (Mg i)/(Si ii) ratio. The two H i 21-cm absorbers belong to this velocity range. The emergence of = 1.172635 can be understood if there is a large optical depth gradient over a length scale of 0.35 pc. However, the gas producing the = 1.173019 component must be nearly uniform over the same scale. Systematic uncertainties introduced by the absorption line variability has to be accounted for in experiments measuring the variations of fundamental constants and cosmic acceleration even when the radio emission is apparently compact as in PKS 2355-106.
keywords:
quasars: absorption lines –quasars:individual PKS 2355-106 – galaxies: ISM1 Introduction
The H i 21-cm absorption is an excellent probe of cold neutral gas. In the Galaxy, observations of H i 21-cm absorption towards high-velocity pulsars and extended sources have revealed structures in the diffuse interstellar medium (ISM; e.g., Frail et al., 1994; Heiles, 1997; Brogan et al., 2005; Roy et al., 2012). These provide important inputs to pressure-equilibrium based models of the ISM. Beyond our Galaxy, such studies are limited to a handful of sight lines towards extended radio sources or gravitationally lensed systems or sources with large proper motions (e.g., Wolfe et al., 1982; Kanekar & Chengalur, 2001; Srianand et al., 2013; Dutta et al., 2016; Gupta et al., 2018). The scarcity is due to a combination of small number of known H i 21-cm absorbers and paucity of suitable low-frequency receivers for milliarcsecond scale spectroscopy using the Very Long Baseline Interferometry (VLBI). It is anticipated that these limitations will be overcome in near future by ongoing Square Kilometre Array (SKA) precursor surveys (Gupta et al., 2017; Allison et al., 2022) and the availability of SKA-VLBI (Paragi et al., 2015). The variability of extragalactic H i 21-cm absorption lines over the timescales of decades is also relevant for the measurements of variations in fundamental constants of physics and cosmic acceleration (Darling, 2012).
The MeerKAT Absorption Line Survey (MALS) is one of the large survey projects being carried out with MeerKAT (see Gupta et al., 2017, for details). The survey is well underway and details of the MALS targets and the full survey footprint to search for H i 21-cm and OH 18-cm absorption are summarized in Gupta et al. (2021a). As part of MALS science verification, we observed the quasar PKS 2355-106 (hereafter, J23581020). This sightline is known to host a damped absorber (DLA; (H i) cm-2) at = 1.1730 that was pre-selected based on the presence of the strong Mg ii absorption in the SDSS spectrum. The H i 21-cm absorption from this absorber was first reported by Gupta et al. (2007) using the Giant Metrewave Radio Telescope (GMRT) observations. Subsequently, Rahmani et al. (2012) presented a higher resolution GMRT spectrum (0.9 km s-1) and an optical echelle spectrum (6 km s-1) of J23581020 obtained using the Ultra-Violet Echelle spectrograph at the Very Large Telescope (VLT/UVES). They showed that the absorption profiles of singly ionized species like Si ii and Fe ii span over 150 km s-1. They fitted these profiles with 11 independent Voigt profile components with one of them [at = 1.1730227(29)] coinciding well (i.e within 0.5 km s-1) with the redshift of the H i 21-cm absorption [at = 1.1730188(24)]. This was used to place a stringent constraint on the time variations of = , where , and are proton g-factor, electromagnetic fine-structure constant and proton-to-electron mass ratio, respectively. None of the other absorption components have shown detectable H i 21-cm absorption in any of the GMRT spectra.
Ellison et al. (2012) observed this quasar with HST/COS (Hubble Space Telescope’s Cosmic Origins spectrograph) and confirmed the absorber to be a DLA with log (HI) = 21.00.1. Assuming radio and optical sightlines are co-spatial, this was used together with the observed H i 21-cm optical depth to constrain the harmonic mean spin-temperature of the gas to K . This suggests that most of the low ionization absorption components seen in the optical spectrum originate from warmer gas or contains only a small fraction of the total (H i).
The quasar J23581020 is classified as a blazar of flat spectrum radio quasar (FSRQ) type with detectable -ray emission (Ackermann et al., 2015). The observed synchrotron peak frequency () is consistent with the object being a low frequency synchrotron peaker. While the quasar is classified as non-variable in -rays, it shows substantial variability at 15 GHz (Richards et al., 2014) and optical bands Hovatta et al. (2014). All these are consistent with the presence of a relativistic jet close to our line of sight.
J23581020 has been observed several times with the Very Long Baseline Array (VLBA) of the NRAO111The National Radio Astronomy Observatory is a facility of the National Science Foundation operated under cooperative agreement by Associated Universities, Inc. as part of the International Celestial Reference Frame (ICRF) observations in S- (2.3 GHz) and X-bands (8.4 GHz). Based on positional stability and lack of extensive intrinsic source structure, J23581020 is identified as one of the “defining sources” of the ICRF catalog (Fey et al., 2015). Gaussian fits recover more than 99% of the flux density from the central dominant component (Fomalont et al., 2000; Fey & Charlot, 2000). Truebenbach & Darling (2017) have measured a proper motion of as yr-1 along the right ascension and as yr-1 along the declination. The VLBA observations at 1.4 GHz (Gupta et al., 2012) and 605 MHz, i.e., the redshifted frequency of the H i 21-cm absorption (Ellison et al., 2012) revealed J23581020 to be compact with almost all the emission being associated with an unresolved component. VLBI space observatory program (VSOP) data of J23581020 obtained at 5 GHz suggests a compact core component of 0.2 Jy within 0.2 mas(Dodson et al., 2008). Recently, Petrov & Kovalev (2017) have reported an off-set of -0.89 mas along RA and -0.40 mas along DEC between VLBA and Gaia coordinates with a probability of 0.29 for this offset to occur by chance. This suggests that the optical and radio sightlines towards J23581020 are most likely co-spatial.
Here, we present detailed comparison of H i 21-cm absorption profiles obtained towards J23581020 over a period of about 15 years. Our high signal-to-noise ratio (S/N) MeerKAT science verification data presented here reveal a new narrow H i 21-cm absorption line within the velocity range covered by the low ionization absorption lines. We discuss the implications of this to the derived average spin temperature of the absorption system and the nature of components showing H i 21-cm absorption. Here and throughout the paper we use flat cold dark matter (CDM) cosmology with = 0.69, = 0.31 and = 0.674. All relative velocities used in this work are defined with respect to = 1.173019. We use solar photospheric abundances from Asplund et al. (2021).
2 Observations and Data Reduction
The field centered at J23581020 was observed using the MeerKAT-64 array as part of MALS science verification on June 02, 2020. The 32K mode of the SKA Reconfigurable Application Board (SKARAB) correlator was configured to split the total observable bandwidth of 544 MHz centered at 815.9917 MHz into 32768 frequency channels. In the vicinity of the redshifted H i 21-cm line frequency corresponding to =1.173, the channel separation of 16.602 kHz corresponds to a velocity spacing of 7.6 km s-1. Of the 64 antennas, 54 participated in these observations. The total on-source time of 120 min on J23581020 was split into six scans of 20 mins at different hour angles to improve the uv-coverage. The total duration of the observing run, which also included two other quasars with known absorption lines, was 320 min. The correlator dump time was 8 sec and the data were acquired for all four polarization products. J1939-6342 was observed for flux density scale, delay and bandpass calibrations. The compact radio sources J2348-1631 and J0022+0014 were periodically observed for complex gain calibration.
The MeerKAT data were processed using the Automated Radio Telescope Imaging Pipeline (ARTIP; we refer the reader to Gupta et al., 2021b, for details). The steps specific to UHF-band processing of MALS data are described in Combes et al. (2021). The spectral line processing through ARTIP partitions the frequency band into 15 spectral windows (referred as SPW0 to SPW14) with an overlap of 256 frequency channels. Here, we are concerned only with the data products i.e., the Stokes- continuum image and the continuum subtracted spectral line image cube corresponding to SPW2 covering 629.0 - 667.2 MHz. The continuum image and the spectral line cube were made using the Briggs’ robust = 0 weighting of the visibilities using the CASA task tclean. The continuum image at 648.0 MHz has a restoring beam of 20.117.2′′ with a position angle of . The rms noise close to the target source is 100 Jy beam-1. The radio source is compact with a peak flux density of 418.81.0 mJy, which matches well with the previous estimates of 420-440 mJy from our GMRT observations. The quoted uncertainty corresponds to the error from the single Gaussian component fit. The typical flux density accuracy at these low frequencies is expected to be about 5%. The rms in the spectrum extracted from the image cube at the pixel corresponding to the peak intensity of the radio source is 0.9 mJy beam channel-1.
The details of various GMRT spectra used here are provided in our earlier papers (Gupta et al., 2007, 2009, 2012; Rahmani et al., 2012). The details of the optical high resolution spectrum of J23581020 used in this study can be found in Rahmani et al. (2012). While Rahmani et al. (2012) mainly used these data for constraining variations in fundamental constants of physics, here we use the spectrum to probe the physical state of the gas and inhomogeneity in metal depletion and ionization state.
3 H i 21-cm absorption

As expected, we detect the known H i 21-cm narrow absorption at = 1.173019 (hereafter “component-1”). In addition, we also detect another H i 21-cm absorption at = 1.172635 (hereafter “component-2”). The normalised spectrum obtained with MeerKAT is shown in the bottom panel of Fig. 1. This figure also shows the earlier spectra of J23581020 obtained by us with GMRT. We also examined the stokes- spectra of other two quasars included in the same MeerKAT observing run. These do not show any absorption at 653.771 MHz whereas the absorption feature consistently appears in the XX and YY spectra of J23581020. Thus, we rule out the possibility of component-2 to be due to Radio Frequency Interference (RFI).
First we focus on the newly detected H i 21-cm absorption component (i.e., component-2). We fit the H i 21-cm absorption from this component with a single Gaussian and obtained = 1.172635 and FWHM of 11.13 km s-1. The integrated optical depth (over the frequency range 653.75-653.80 MHz) is 0.1610.030 km s-1(i.e., 5.4 detection). The measured Gaussian FWHM is consistent with the kinetic temperature (and hence the spin temperature, ) of the gas being less than 2700 K. If we assume the covering factor () of the absorbing gas to be unity (but see below), as has been used in all previous studies, we constrain the H i column density in component-2 to (H i) = 3 (K) cm-2. If we use the upper limit on mentioned above we derive (H i) cm-2.
The frequency range of component-2 is covered in the first two GMRT observations, but not in the highest resolution spectra obtained in our 2010 observations. In the spectrum obtained during 30-7-2006 (second panel in Fig. 1), that has the best S/N and resolution compared to the one obtained during 23-05-2006, we find the integrated H i 21-cm optical depth of 0.0510.039 km s-1 over the above mentioned frequency range for component-2. In this spectrum, the component-2 seen in the MeerKAT spectrum should have been detected at level.
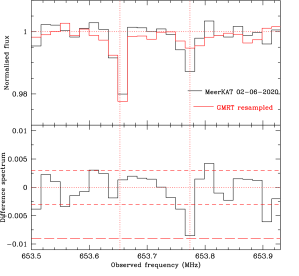
To investigate any possible variability in the H i 21-cm optical depth of component-2, we re-sampled the GMRT spectra (first two epochs) to the frequency scale of the MeerKAT spectrum (shown in Fig. 2). In the top panel, we compare the two spectra and show the difference between them in the bottom panel. It is evident that in the case of component-1 the line intensity variations are well in the range (dashed horizontal lines). However, at the location of the absorption peak for component-2 we find the difference to be 0.00850.0029 km s-1 (2.9 level). Therefore, with the present data we confirm the variability at 2.9 level. Such variability in H i 21-cm absorption is seen towards Blazars (see for example, Briggs & Wolfe, 1983; Kanekar & Chengalur, 2001; Kanekar et al., 2014) or gravitationally lensed systems (see for example, Muller & Guélin, 2008; Schulz et al., 2015) and is primarily related to the small size of the absorbing gas coupled with large proper motion in the background radio source. We return to this in section 5.
| Telescope | Date | va | ||
|---|---|---|---|---|
| d-m-y | (km s-1) | (mJy b-1) | (km s-1) | |
| GMRT | 23-05-2006 | 3.6 | 443 | |
| 30-07-2006 | 1.8 | 420 | ||
| 28-06-2010 | 0.9 | 449c | ||
| MeerKAT | 02-06-2020 | 7.9 | 419 |
In the following we discuss the absorption from component-1. The H i 21-cm absorption is known to be narrow and sampled only by two channels (each of width 7.6 km s-1) in our MeerKAT spectrum. The details of H i 21-cm absorption at different epochs are summarized in Table. 1. It is also evident from the table that the peak continuum flux density of J23581020 close to the redshifted H i 21-cm frequency has not changed by more than 7% over the period 2006 - 2020. We do not find any statistically significant optical depth variation between the first two GMRT spectra and our MeerKAT spectrum (typically over an elapsed time of 5.3 yrs in the quasar’s frame). The table also suggests a difference in the H i 21-cm optical depth between our GMRT observations in 2010 and MeerKAT data. However, caution is required since this is likely an artifact of the under-sampling of absorption profile in the MeerKAT spectrum. A single component Gaussian fit to the highest resolution GMRT data obtained in 2010 yields the line width of km s-1. This provides an upper limit of 1260 K for the kinetic temperature as well as . The maximum (H i) that can be accommodated in this component is 3.9 cm-2.
The wide frequency coverage of our MeerKAT spectrum allows us to search for H i 21-cm absorption over the redshift range 0.32-1.53. We do not find any other H i 21-cm absorption apart from the above discussed system. In this redshift range we also detect intervening C iv absorption systems at = 1.1624, 1.4101, 1.4106, 1.4111 and 1.4126 in our UVES spectrum. Unfortunately our MeerKAT spectrum does not cover the frequency range of the associated H i 21-cm absorption with J23581020. The presence of associated ionized gas is confirmed by the strong C iv absorption seen at = 1.1624. The examination of other spectral windows, reveal non-detections of OH absorption at the systemic redshift of the quasar (or at the redshift of associated C iv absorber) and corresponding to the H i 21-cm absorption discussed above.
4 Associated UV absorption lines
4.1 H i absorption and
As mentioned before, a total H i column density of log (H i) = 21.00.1 was measured using the DLA seen in the HST-COS spectrum. Had we observed J23581020 only with MeerKAT we would have obtained the total H i 21-cm integrated optical depth of 0.3840.035 km s-1 over the two components. This gives a K, which is a factor 1.5 times less than what has been reported by Ellison et al. (2012) (i.e., = K). The detection of component-2 suggests the radio and optical sightlines are probing slightly different volumes of gas even when the background source appears to be compact at 10 mas scales. In that case one can not unambiguously constrain even when we have total (H i) measurements from DLA observations.
4.2 Metallicity & depletion

If the optical and radio sightlines are different, in a simplistic case, one expects a lack of absorption at the redshift of component-2 in the optical spectrum. In Fig. 3, we show the velocity plot of H i 21-cm absorption and some metal transitions. Joint fit to singly ionized species performed by Rahmani et al. (2012) (red curves in Fig. 3) does not reveal a distinct component at the expected position of component-2. However, we detect a distinct absorption at the expected position in the case of Mg i absorption. While decomposing the absorption lines into Voigt profile components is a standard practice, in reality the absorption at a given velocity can be contributed by gas distributed at different physical locations having appropriate radial velocities in projection (see for example, Marra et al., 2021). Before discussing the origin of component-2 in detail we summarize the basic properties of the overall system and the two H i 21-cm components obtained using our UVES spectrum.
Rahmani et al. (2012) have obtained total column densities using multiple component Voigt profile fitting. The overall profile of absorption lines from singly ionized species are best fitted with 11 Voigt profile components (vertical dashed lines in Fig. 3) and the derived total column densities are, log (Mn ii) = 12.920.04, log (Zn ii) = 12.790.04, log (Si ii) = 15.550.04 and log (Fe ii) = 15.030.04. When we use log (H i) = 21.00.1 and solar abundance from Asplund et al. (2021) we get [Mn/H]=, [Zn/H]=, [Fe/H]= and [Si/H] = . The average depletion across the profile can be quantified using [Fe/Zn] = . We also find the average [Fe/Si] = . The depletion measured for Fe, Si and Mn are consistent with what is seen for “warm disk + halo gas” of the Milky Way (see figure 6 of Savage & Sembach, 1996).
In the case of “component-1" of H i 21-cm absorption, we find that a metal line absorption component (seen in neutral, singly ionized ions and Al iii) aligns well with the 21-cm absorption (see Fig. 6). For this component, the measured column densities are: log (Mn ii)= 12.100.04, log (Fe ii) = 14.030.03, log (Si ii) = 14.750.04, and log (Zn ii) = 12.080.05. This gives [Fe/Zn] = , [Mn/Zn]= and [Fe/Si] = . Thus the depletion in “component-1” is higher than the average depletion of the system by 0.20-0.30 dex. Due to inverse dependence on , the H i 21-cm absorption is biased towards low temperature regions. It is known that H2 bearing gas i.e., absorption components having higher density and lower temperature tend to show more depletion compared to the overall metal absorption in DLAs (see for example, Petitjean et al., 2002; Rodríguez et al., 2006; Noterdaeme et al., 2017). Thus, our findings are in line with higher depletion in the cooler regions of the absorbing gas.
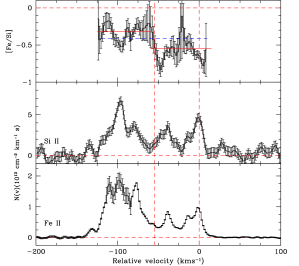
Multi-component Voigt profile fits to the singly-ionized lines do not identify an independent component at the location of the “component-2” of the H i 21-cm absorption. This suggests that the column density of metal ions is low there, either because of the low (H i) or because of high depletion. To explore this we constructed the apparent column density profiles (Savage & Sembach, 1991) for Fe ii and Si ii. In the case of Fe ii we use all the available transitions to construct the apparent column density profile capturing the line saturation accurately. These are shown in Fig. 4. In the case of Si ii we mainly use Si ii1808 line. We measure [Fe/Si], assuming these elements are mostly in the singly ionized state, for each velocity bin and plot them in the top panel of Fig. 4. It is evident that [Fe/Si] varies across the profile. The blue horizontal dashed line in this plot shows the average [Fe/Si] obtained using the measured total column densities. We find most of the gas at relative velocities less than -62 km s-1 [this accounts for 68% of the total (Fe ii)] showing [Fe/Si] value above this mean value. Gas at velocities greater than -62 km s-1 [which includes gas producing the two H i 21-cm absorption] show [Fe/Si] below the overall mean. This suggests the presence of gas with two sets of depletion separated in velocity space. Unfortunately we could not perform such an analysis for Zn ii, Mn ii or Cr ii as these absorption lines are weaker and hence errors in (v) are large.
It is also evident from this figure that [Fe/Si] in the velocity range of component-1 is above the mean value measured over the full profile. The gas in the relative velocity range 62 km s-1 is consistent with the mean [Fe/Si] measured (red horizontal line). This is not the case at the location of component-2. However the maximum depletion [Fe/Si] is measured within 6 km s-1 to this component. In summary, within measurement uncertainties, we identify two distinct velocity ranges over which the depletion pattern is well separated. Both H i 21-cm absorption discussed here are in the velocity range showing higher depletion.
4.3 Ionization state
.
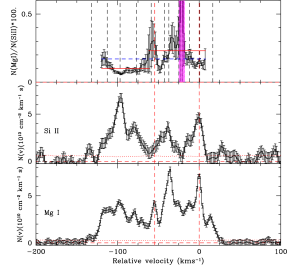
The ratio of Mg ii to Mg i column densities is governed by the electron density, , gas temperature and photoionization rate, . As Mg ii lines are highly saturated one can use Si ii column density for this purpose. In Fig. 5 we plot the apparent column density profile of Mg i and Si ii and their ratio (over the velocity range where Si ii1808 line is detected). Like in the case of depletion, this ratio shows a clear trend. In the velocity range -62 km s-1 the ratio (Mg i)/(Si ii) tends to be lower than the mean value. Whereas the ratio tends to be higher than the mean value for higher velocities (i.e -62 km s-1).
In the second panel from the bottom of Fig. 3 we show the fits to the Mg i absorption lines. The Voigt profile fit to Mg i was performed independent of the fits to the singly ionized species. Interestingly, Mg i absorption profile follows most of the strong components of the singly ionized species. The total column density of Mg i is log (Mg i) = 12.850.07. This gives the average log [(Mg i)/(Si ii)] of .
From the bottom panel it is evident that Mg i absorption is detected for “component-1” of H i 21-cm absorption. We measure, log (Mg i) = 12.350.13. This gives log [(Mg i)/(Si ii)]= for this component. This means that the gas responsible for “component-1” on average has at least a factor 2 lower value (albeit with large errors) of with being the recombination rate. Clear detection of C i absorption (see Fig. 6), with log (C i) = 12.960.05, only from this component supports this conclusion. We also obtain a 3 upper limit of log (C i*)12.44. Note the upper limit on the column density ratio (C i*)/(C i) is consistent with what has been measured for H2 bearing DLA components at high-z (see figure 12 of Srianand et al., 2005). We obtain an upper limit of hydrogen density ( 51 cm-3) by assuming a gas temperature of 100 K, the excitation is mainly due to cosmic microwave background and collisions with neutral hydrogen (cross sections taken from Launay & Roueff, 1977) and the spontanous decay is the only deexcitation process.
For component-2 we measure log (Mg i) = 11.590.23 and log (C i)12.34 (). The large error in (Mg i) comes from the large error in the b-parameter due to the line being narrow and blended with other components. From the Si ii1808 line profile we obtain an upper limit, log (Si ii)14.25. This suggests log [(Mg i)/(Si ii)]2.66. This limit allows for the physical conditions in component-2 to be similar to that of component-1.
It is evident from this figure that the Mg i absorption component at the relative velocity of 14.5 km s-1 does not show detectable Si ii1808 absorption (see also Fig. 3). Based on the voigt profile fits we find log [(Mg i)/(Si ii)] = 0.28. Despite this we do not detect H i 21-cm absorption from this component. This component contains only 1% of the observed total column density of Si ii and Fe ii. Thus the non-detection of H i 21-cm absorption from this component with a signature of low ionization could be related to low total H i column density.
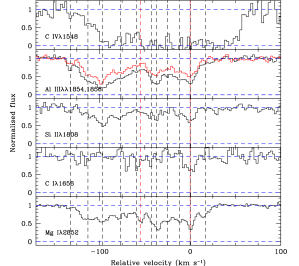
In Fig. 6 we compare the velocity profile of absorption from different ionization states. The absorption profiles of Al iii roughly follow the singly ionized species. As typical of DLAs (Fox et al., 2007), the C iv profile is much wider and not necessarily following the low ionization species. However, what is more interesting is that the C iv profile is symmetric around the low ionization components that show higher depletion and low ionizing conditions (i.e 62 to +10 km s-1). In the velocity range 120 to 100 km s-1the C iv absorption seems very weak while in the velocity range 20-50 km s-1C iv absorption is detected without strong absorption from low ionization species.
5 Results and discussions
Time variability of H i 21-cm absorption is a good tool to probe the small scale structures in the absorbing gas. The present understanding is that the ISM is a magnetized medium where the turbulent cascade, driven by a local energy source and acting jointly with phenomena such as thermal instability, is the source of these structures (see Stanimirović & Zweibel, 2018, for a detailed review). Similarly, VLBA spectroscopy has revealed parsec scale structures in some intervening H i 21-cm absorbers (see Srianand et al., 2013). Presence of very compact cold H2 bearing components in some DLAs is established through partial coverage (Balashev et al., 2011; Klimenko et al., 2015) and time-variability (Boissé et al., 2015) in the optical spectrum.
Here, we report the emergence of a new H i 21-cm absorption component at = 1.172635 towards the blazar J23581020. There are currently three known cases of variability in the H i 21-cm absorption from high redshift intervening absorbers. All of them are toward blazars. These are (i) = 0.525 toward the BL Lac object AO 0235+167 (Wolfe et al., 1982), (ii) = 0.3127 toward FSRQ PKS 1127-145 (Kanekar & Chengalur, 2001) and (ii) = 2.0395 toward FSRQ PKS 0458-020 (Kanekar et al., 2014). There are a few things in common between these DLAs: (i) large measured (H i) compared to typical DLAs (i.e log (H i)21.70); (ii) metal lines are wide spread (with km s-1) and (iii) the background sources are detected in ray emission.
In the case of AO 0235+167 and PKS 1127-145, the H i 21-cm absorption is detected in several components spread over 100 km s-1. All these components show time-variability in the H i 21-cm optical depth without significant velocity shifts over a range of time-scales. In the case of PKS 0458-020, the H i 21-cm absorption is spread over 50 km s-1 and the quoted variability is based on three epoch observations. Multiple component structures at the mas scale are clearly visible in the case of FSRQs PKS 0458-020 and PKS 1127-145 (see for example, Fomalont et al., 2000). The absorber towards J23581020 also exhibits widespread metal absorption lines and high (H i). The quasar is also detected at -rays. The only difference with respect to above mentioned three cases is the narrow width i.e., = 12.5 km s-1 (component-1) of H i 21-cm absorption.
There are three possibilities considered in the literature to understand variability in H i 21-cm absorption. These are (i) changes in the line-of sight column density due to the proper motion of the background source; (ii) inter-stellar scintillation (ISS) and (iii) changes in the physical conditions in the absorbing gas. Given the time-scales involved and the low transition probabilities of H i 21-cm line driving the changes in i.e., the possibility (iii) is unlikely. As the radio continuum at the redshifted 21-cm wavelength has not varied by more than 7% during our observations we conclude that the observed variability is not driven by ISS.
Here, we consider only the possibility-(i) i.e., optical depth variations caused by the superluminal motion of radio components associated with the background radio source i.e., blazar. This is motivated by the core-jet morphology exhibited by J23581020 at high frequencies. In the VLBA images at 5 GHz and 8.6 GHz, 98% of the total flux density is contained the radio core and there is an indication of a weak component 1-2 mas (8-15 pc) away (Fomalont et al., 2000). An additional component 8 mas from the core is also detected in lower frequency 2.3 GHz image (Fey & Charlot, 2000). The radio structure is unresolved in the 1.4 GHz VLBA image with a deconvolved size of 30 pc (Gupta et al., 2012). The variations in substructure in radio continuum at parsec scales, which may be more prominent at lower frequencies due to the steeper spectral index of the jet component, may be responsible for observed variation in H i 21-cm absorption profile.
Indeed, Truebenbach & Darling (2017) measured a proper motion of RA = arcsec yr-1 and DEC = arcsec yr-1. The time-elapsed in the quasar frame between our GMRT and MeerKAT observations is yrs. We expect a displacement of 40 arcsec during this period. Such a motion corresponds to a shift in the line of sight of 0.35 pc at the redshift of the H i 21-cm absorber, implying a strong gradient in H i 21-cm optical depth for component-2 over this scale. Meanwhile, the absorbing gas correspoding to component-1 would have no such large gradient in optical depth over similar scales. Uncorrelated variability between different H i 21-cm absorption components have been seen in previous cases, suggesting the presence of structures at different spatial scales in the absorbing gas.
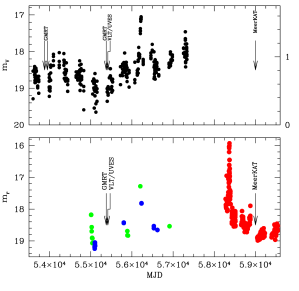
The publicly available optical light curves from Zwicky transient factory (ZTF; Bellm et al., 2019b, a) also show that J23581020 has gone through an eruption event around July 2018 when the quasar got brighter by about 2 magnitudes in both - and -bands (shown in Fig. 7). While our MeerKAT spectroscopic observations occurred a couple of years after that event, all the VLBA low frequency continuum observations that we use to discuss the radio morphology were obtained much before that event. Therefore, it will be interesting to see whether there was any structural change in the radio emission of J23581020 after the strong brightening seen in July 2018.
If synchrotron emission has appreciable contributions to the optical continuum emission then we expect the UV absorption lines to show time variability. While the presence of broad emission lines may indicate the UV continuum in J23581020 being dominated by disk emission, it will be interesting to investigate the time variability using high resolution optical spectrum. In particular it is interesting to investigate the presence (and variability) of partial coverage.
The anticipated increase in the number of H i 21-cm absorbers and the availability of SKA will make it feasible to carry out large scale studies to detect variations in fundamental constants of physics and cosmic acceleration. Outcome of these experiments depends on high frequency stability of the instruments and absorption features. Presence of variability in absorption profiles will introduce systematic uncertainties. This can be minimized by avoiding H i 21-cm absorbers detected towards blazars and use large sample of systems. In the latter case one hopes the systematics introduced is random and gets canceled when we have a large sample. The H i 21-cm absorption surveys being carriedout using MeerKAT and ASKAP will provide such a large sample.
Acknowledgements
We thank MeerKAT and GMRT staff for their support during the observations. The MeerKAT telescope is operated by the South African Radio Astronomy Observatory, which is a facility of the National Research Foundation, an agency of the Department of Science and Innovation. GMRT is run by the National Centre for Radio Astrophysics of the Tata Institute of Fundamental Research. The MeerKAT data were processed using the MALS computing facility at IUCAA (https://mals.iucaa.in/releases). KM acknowledges support from the National Research Foundation of South Africa.
Data Availability
The data used in this work are obtained using MeerKAT (SSV-20180516-NG-02) and GMRT. Raw data will become available for public use in accordance with the observatory policy. The MeerKAT data products will be publicly released through the survey website: https://mals.iucaa.in.
References
- Ackermann et al. (2015) Ackermann M., et al., 2015, ApJ, 810, 14
- Allison et al. (2022) Allison J. R., et al., 2022, Publ. Astron. Soc. Australia, 39, e010
- Asplund et al. (2021) Asplund M., Amarsi A. M., Grevesse N., 2021, A&A, 653, A141
- Balashev et al. (2011) Balashev S. A., Petitjean P., Ivanchik A. V., Ledoux C., Srianand R., Noterdaeme P., Varshalovich D. A., 2011, MNRAS, 418, 357
- Bellm et al. (2019a) Bellm E. C., et al., 2019a, PASP, 131, 018002
- Bellm et al. (2019b) Bellm E. C., et al., 2019b, PASP, 131, 068003
- Boissé et al. (2015) Boissé P., Bergeron J., Prochaska J. X., Péroux C., York D. G., 2015, A&A, 581, A109
- Briggs & Wolfe (1983) Briggs F. H., Wolfe A. M., 1983, ApJ, 268, 76
- Brogan et al. (2005) Brogan C. L., Zauderer B. A., Lazio T. J., Goss W. M., DePree C. G., Faison M. D., 2005, AJ, 130, 698
- Combes et al. (2021) Combes F., et al., 2021, arXiv e-prints, p. arXiv:2101.00188
- Darling (2012) Darling J., 2012, ApJ, 761, L26
- Dodson et al. (2008) Dodson R., et al., 2008, ApJS, 175, 314
- Dutta et al. (2016) Dutta R., Gupta N., Srianand R., O’Meara J. M., 2016, MNRAS, 456, 4209
- Ellison et al. (2012) Ellison S. L., Kanekar N., Prochaska J. X., Momjian E., Worseck G., 2012, MNRAS, 424, 293
- Fey & Charlot (2000) Fey A. L., Charlot P., 2000, ApJS, 128, 17
- Fey et al. (2015) Fey A. L., et al., 2015, AJ, 150, 58
- Fomalont et al. (2000) Fomalont E. B., Frey S., Paragi Z., Gurvits L. I., Scott W. K., Taylor A. R., Edwards P. G., Hirabayashi H., 2000, ApJS, 131, 95
- Fox et al. (2007) Fox A. J., Petitjean P., Ledoux C., Srianand R., 2007, A&A, 465, 171
- Frail et al. (1994) Frail D. A., Weisberg J. M., Cordes J. M., Mathers C., 1994, ApJ, 436, 144
- Gupta et al. (2007) Gupta N., Srianand R., Petitjean P., Khare P., Saikia D. J., York D. G., 2007, ApJ, 654, L111
- Gupta et al. (2009) Gupta N., Srianand R., Petitjean P., Noterdaeme P., Saikia D. J., 2009, MNRAS, 398, 201
- Gupta et al. (2012) Gupta N., Srianand R., Petitjean P., Bergeron J., Noterdaeme P., Muzahid S., 2012, A&A, 544, A21
- Gupta et al. (2017) Gupta N., et al., 2017, preprint, (arXiv:1708.07371)
- Gupta et al. (2018) Gupta N., et al., 2018, MNRAS, 476, 2432
- Gupta et al. (2021a) Gupta N., et al., 2021a, arXiv e-prints, p. arXiv:2107.09705
- Gupta et al. (2021b) Gupta N., et al., 2021b, ApJ, 907, 11
- Heiles (1997) Heiles C., 1997, ApJ, 481, 193
- Hovatta et al. (2014) Hovatta T., et al., 2014, MNRAS, 439, 690
- Kanekar & Chengalur (2001) Kanekar N., Chengalur J. N., 2001, MNRAS, 325, 631
- Kanekar et al. (2014) Kanekar N., et al., 2014, MNRAS, 438, 2131
- Klimenko et al. (2015) Klimenko V. V., Balashev S. A., Ivanchik A. V., Ledoux C., Noterdaeme P., Petitjean P., Srianand R., Varshalovich D. A., 2015, MNRAS, 448, 280
- Launay & Roueff (1977) Launay J. M., Roueff E., 1977, A&A, 56, 289
- Marra et al. (2021) Marra R., et al., 2021, MNRAS, 508, 4938
- Muller & Guélin (2008) Muller S., Guélin M., 2008, A&A, 491, 739
- Noterdaeme et al. (2017) Noterdaeme P., et al., 2017, A&A, 597, A82
- Paragi et al. (2015) Paragi Z., et al., 2015, Advancing Astrophysics with the Square Kilometre Array (AASKA14), p. 143
- Petitjean et al. (2002) Petitjean P., Srianand R., Ledoux C., 2002, MNRAS, 332, 383
- Petrov & Kovalev (2017) Petrov L., Kovalev Y. Y., 2017, MNRAS, 467, L71
- Rahmani et al. (2012) Rahmani H., Srianand R., Gupta N., Petitjean P., Noterdaeme P., Vásquez D. A., 2012, MNRAS, 425, 556
- Richards et al. (2014) Richards J. L., Hovatta T., Max-Moerbeck W., Pavlidou V., Pearson T. J., Readhead A. C. S., 2014, MNRAS, 438, 3058
- Rodríguez et al. (2006) Rodríguez E., Petitjean P., Aracil B., Ledoux C., Srianand R., 2006, A&A, 446, 791
- Roy et al. (2012) Roy N., Minter A. H., Goss W. M., Brogan C. L., Lazio T. J. W., 2012, ApJ, 749, 144
- Savage & Sembach (1991) Savage B. D., Sembach K. R., 1991, ApJ, 379, 245
- Savage & Sembach (1996) Savage B. D., Sembach K. R., 1996, ApJ, 470, 893
- Schulz et al. (2015) Schulz A., Henkel C., Menten K. M., Muller S., Muders D., Bagdonaite J., Ubachs W., 2015, A&A, 574, A108
- Srianand et al. (2005) Srianand R., Petitjean P., Ledoux C., Ferland G., Shaw G., 2005, MNRAS, 362, 549
- Srianand et al. (2013) Srianand R., Gupta N., Rahmani H., Momjian E., Petitjean P., Noterdaeme P., 2013, MNRAS, 428, 2198
- Stanimirović & Zweibel (2018) Stanimirović S., Zweibel E. G., 2018, ARA&A, 56, 489
- Truebenbach & Darling (2017) Truebenbach A. E., Darling J., 2017, ApJS, 233, 3
- Wolfe et al. (1982) Wolfe A. M., Briggs F. H., Davis M. M., 1982, ApJ, 259, 495