Service Modeling and Delay Analysis of Packet Delivery over a Wireless Link
Abstract
For delay analysis of packet delivery over a wireless link, several novel ideas are introduced. One is to construct an equivalent non-lossy queueing model to ease the analysis, enabled by exploiting empirical models of packet error rate, packet service time and packet loss rate obtained from measurement. The second is to exploit a classical queueing theory result to approximate the mean delay. For estimating the delay distribution, the newly developed stochastic network calculus (SNC) theory is made use of, forming the third idea. To enable this SNC based analysis, a stochastic service curve characterization of the link is introduced, relying on a packet service time model obtained from the empirical models. The focused link is a 802.15.4 wireless link. Extensive experimental investigation under a wide range of settings was conducted. The proposed ideas are validated with the experiment results. The validation confirms that the proposed approaches, integrating both empirical and analytical modes, are effective for service modeling and delay analysis. This suggests an integrated approach, now found previously, for quantitative understanding of the delay performance of packet delivery over a wireless link.
I Introduction
Many IoT (Internet of Things) applications are time-sensitive, requiring quality of service (QoS), particularly in terms of throughput, delay and loss guarantees, from the underlying wireless network. Due to the stochastic nature of wireless channel, it is challenging for a wireless link to reliably deliver data packets in real-time. In the literature, a huge amount of research effort and results can be found for modeling and analyzing the performance of wireless links. The majority focuses on throughput-related performance metrics such as Shannon capacity [1] where delay is not taken into account. For delay and loss analysis, queueing models have been adopted where the service process may be characterized by the throughput process or from some Markov characterization of the channel process [2] [3]. In these investigations, delay is typically attributed to traffic concurrency and queuing and loss due to to buffer overflow, and to simplify analysis, queues are often assumed to have infinite buffer space where buffer overflow is approximated by the exceeding probability of the backlog higher than a threshold [2]. In real networks, however, there are other factors that can contribute to the delay and/or loss of a packet. They include finite block length coding-caused inherent error, other reasons-caused decoding errors, collision with other packets on the air, exceeding the allowed re-transmission times, etc. Taking all these factors into account can easily make the analysis formidably difficult or even intractable (e.g., see [4] for an example analysis and [5] for more discussion).
Specifically, there are many existing theoretical analysis and modeling works that focus on delay guarantee analysis for packet delivery over wireless links, such as probabilistic delay bound analysis by applying the stochastic network calculus theory [6, 7, 8], and combining models from Markov processes and queuing theory [9]. Those delay analysis models require a number of simplifications and assumptions, e.g., knowing the distribution of the service time, which, however, may not always be satisfied or known in real-world wireless transmission. Hence, only relying on such analytical results to estimate the link performance is not enough.
There are also empirical measurement-based studies for packet delay and loss [10], [11], [12] and [13]. However, most of them only consider one traffic pattern (e.g. periodic or Poisson) and some fixed stack parameter settings on the performance. Due to this, they usually lack deep analysis for the joint effect of multiple parameters on the delay or loss performance. As one step forward, in our previous works [14, 15, 16], we made a set of extensive experimental studies for performance investigation of wireless links. Based on the obtained experimental datasets, we have comprehensively investigated the effects of typical parameters from PHY, MAC and Application Layer on the link performance and presented several empirical models to quantify the joint effects of the stack parameters [14, 15, 16]. However, these models focus on throughput [14] and packet loss rate [15, 16], leaving delay largely untouched.
To bridge the gap, we introduce in this paper a novel, integrated approach for service modeling and delay analysis of a wireless link, which combines empirical models obtained from the measurement study with and analytical models from the classical queueing theory [9] and the stochastic network calculus (SNC) theory [6, 7, 8]. Specifically, for delay analysis, we propose a non-loss equivalent queuing model integrating measurement-based empirical models. Built upon the equivalent model, we explore an existing queueing analysis result for mean delay estimation. In addition, for delay distribution performance, we propose a SNC-based analytical approach. Central to this approach is the novel idea of finding the stochastic service curve characterization of the wireless link based on empirical models obtained from measurements. Both average delay and delay distribution models are validated with measurement data. The delay performance of the wireless link is further examined and discussed under different input traffic patterns.
The rest of this paper is structured as follows. Section II introduces our measurement setup, parameter configurations, and packet delivery scheme. Section III reports empirical models based on statistical analysis of measurement results. Section IV introduces the non-loss queueing model and the classical queueing theory result for mean delay, where comparisons of analytical and measurement results are conducted to validate both the queueing model and the mean delay. Section V introduces a SNC based approach to estimate the delay distribution, where validation under different traffic arrival patterns is also provided. Finally, we conclude the paper in Section VI.
II The Experiment Setup
II-A The wireless link and stack parameter configuration
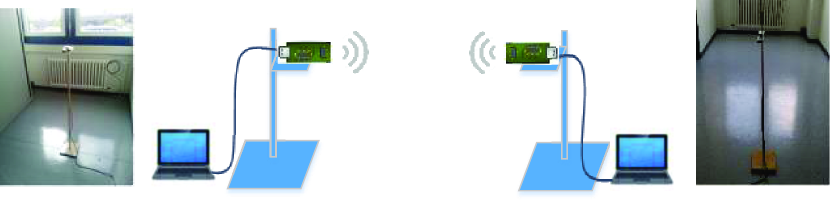
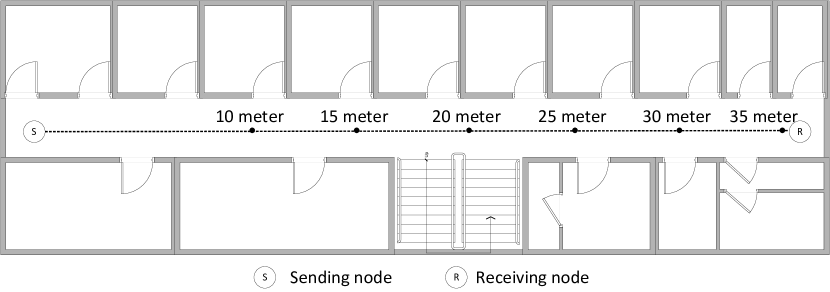
We consider a 802.15.4 link. To obtain an in-depth understanding of its service and delay performance, we conducted an extensive set of experiments in an indoor office building environment. We employed a sender-receiver pair of TelosB motes, each equipped with a TI CC2420 radio using the IEEE 802.15.4 stack implementation in TinyOS. As shown in Figure 1, the experiments were conducted in a long hallway. Each mote was fixed on a wooden stand of 0.7-meter high and the positions of nodes. For each experiment, we maintained line-of-sight (LoS) between the two motes. During the experiments, university students and employees may walk in the hallway.
In each experiment, the sender sends packets to the receiver under a particular stack parameter configuration. For each stack parameters configuration, 7 key parameters residing at different layers are considered. Specifically, at the PHY layer are the distance () between nodes and the transmission power level (). At the MAC layer are the maximum number of transmissions (), the retry delay time for a new retransmission (), and the maximum queue size () of the queue on top of the MAC layer used to buffer packets when they are waiting for (re-)transmission. At the Application layer are the packet inter-arrival time () and the packet payload size (). This setup is the same as used in our previous investigation [14], where more detailed information about these parameters’ settings can be found. Different from [14], in the present paper, we are interested in service and delay characteristics of the link.
II-B The data delivery scheme
The IEEE 802.15.4 standard [17] enables wireless connectivity between ultra-low power devices in wireless personal area networks (WPAN). The IEEE 802.15.4-standard both defines the physical layer and the medium access layer. Using the industrial scientific medical (ISM) band of 2.4 GHz, direct-sequence spread spectrum (DSSS) and phase shift keying (O-QPSK) modulation scheme at the PHY layer achieves a data rate of 250 kbps.The MAC layer defines two different channel access methods: beacon enabled and non-beacon enabled modes. In this paper, a non-beacon-enabled unslotted CSMA/CA mechanism is considered. The unslotted CSMA/CA procedure including backoff procedure and packet retransmission proceeds based on acknowledgments. Each time a generated data packet will wait for a random backoff time to check whether the channel is busy or not before to be transmitted. If the channel is idle during the backoff period, the device transmits its data packet. When the channel is busy, the random backoff procedure is repeated. When retransmissions are enabled, the destination node must send an acknowledgement (ACK) just after receiving a data frame, otherwise data frame will be retransmitted up to MACMAXFRAMERETRIES times, and then dropped.
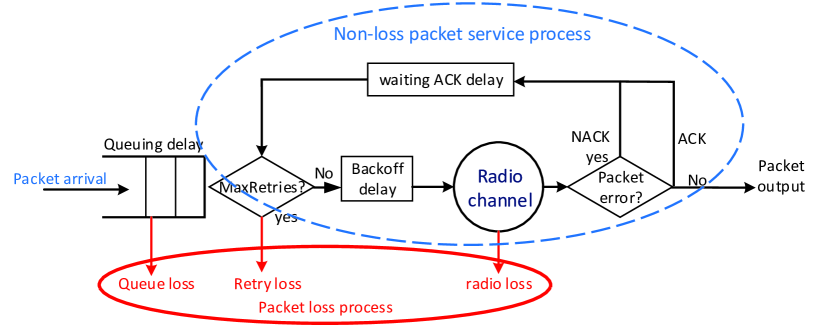
TinyOS [18], an operating system for embedded wireless sensor networks, used to implement the actual data delivery is slightly different from the parameters specified in IEEE802.15.4. In our experimental study, the packet delivery scheme is implemented in TinyOS 2.1, as illustrated in Figure 2. At the PHY layer, TinyOS allows the user to configure the radio transmit power to eight different levels from 3 to 31 (transmit power ranges from -25dB to 0dB) at compile time and during run-time. On top of the MAC layer, a buffer with maximum length is implemented to queue the application packets. Once a queue is full, newly arriving packets are dropped. The packets in the queue are served based on the FIFO (First In First Out) policy. Each time the sender node wishes to transmit data frames, it shall wait for a random backoff period (initialBackoff). If the channel is found to be idle, following the random backoff period, the device shall transmit its data. After the frame is sent, a copy of each transmitted packet is temporarily kept in a “waiting buffer” until the ACK of that packet is received. After a maxAckWaitDuration time, if NACK received, it triggers a retransmission until that the maximum number of retransmissions is reached and the packet is discarded. Between each retry the amount of delay time can be specified by TinyOS as retry delay. Once an ACK is received, the packet is removed from the waiting buffer and a new packet is transmitted. As Figure 2 shows, a packet loss may be due to queueing, retry and radio loss. The packet delay mainly includes transport and retry delays. The transport delay is subdivided into queueing, backoff, ACK duration and transmission delays. The transmission delay is defined as the time from a packet’s first generated until its successful arrival at the receiver (i.e., it includes all retransmission delays).
In total, close to 50 thousand parameter configurations were experimented and detailed transmission information of more than 250 million packets was collected, which provides statistical information for modeling the data delivery performance. A related dataset has been made publicly available [19].
III Measurement-Based Empirical Models
In this section, based on measurement results, statistical empirical models for packet error rate, service time and loss rate are presented. The measurement dataset for periodic packet arrival traffic pattern is used as the basis. The obtained empirical models will be applied in later delay analysis. All these statistical results are reported with 95% confidence level.
III-A Packet error rate (PER)
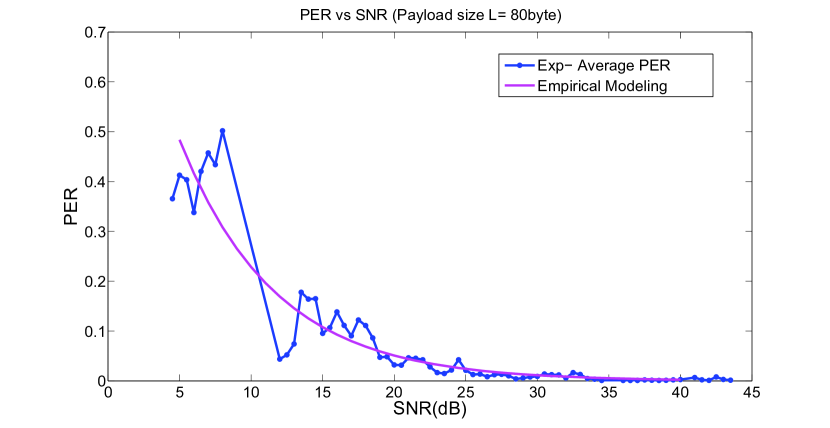
PER is the ratio of the number of unacknowledged data packets to the total number of transferred packets. By curve fitting over the measured average PER data as shown in Figure 3, PER can be modeled as an exponential function of Single-to-Noise Ratio (SNR) and packet payload as:
| (1) |
with and for our tested environment.
III-B Packet service time
The packet service time, denoted as , is defined as the time interval between when a packet is sent and when it is received by the receiver node. Specifically, the packet service time depends on (1) – the one-time hardware SPI bus loading time of a data frame; (2) – the time to transmit a frame consisting of packet payload and overhead; (3) – MAC layer delay consisting of two parts: and , where is the turn around time (which is set to be in our experiments) and is the average value of initial backoff period (which is set to be ); (4) – the ACK frame transmission time if ACK frame is received, and based on prior tests ; (5) – the maximum software ACK waiting period (set to be ); (6) – the number of transmissions to deliver each packet; (7) – the delay between two consecutive retransmissions.
There are two cases in per-packet service time, denoted as and respectively, depending on whether a packet is successfully transmitted (i.e., ACK received):
-
•
If (with ACK),
(2) -
•
If (with non-ACK),
(3)
where
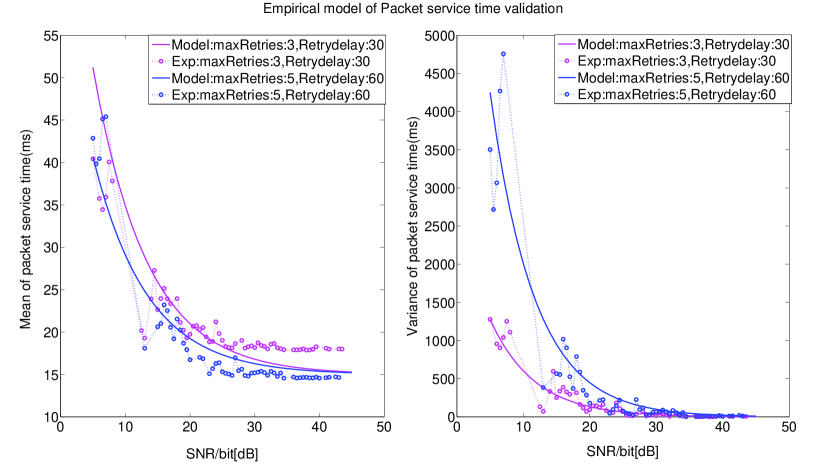
Due to the random nature of wireless transmission, the actual numbers of retransmission of a packet is a random value. Hence the packet service time is also random. From the measurement results, we found that the mean and variance of packet service time, denoted as and respectively, are sensitive to the maximum number of transmissions , payload size , the delay between two consecutive retransmissions and SNR. Through curve fitting, empirical models for them are
| (4) | |||||
| (5) |
The fitting results are depicted in Figure 4.
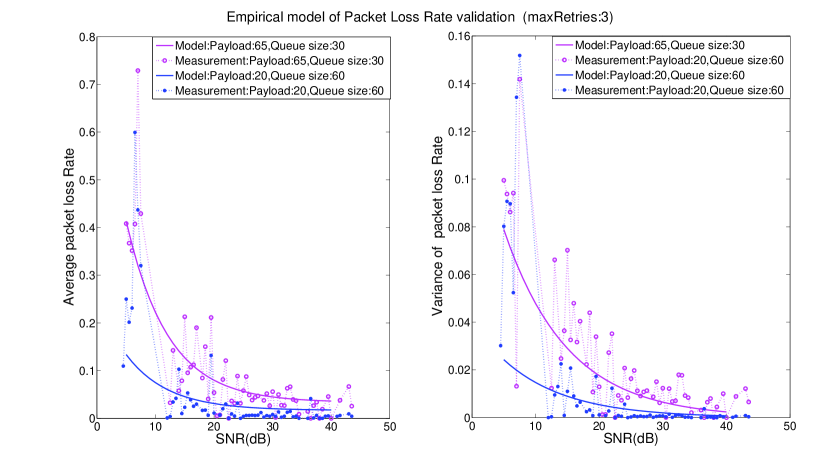
III-C Packet loss rate (PLR)
Packet loss over a wireless link is mainly caused by poor link quality and limited buffer size. The former may result in the drop of a packet after the maximum transmission attempts have been tried. The latter will cause a packet being dropped when its arrival sees a full buffer. Note that PLR differs from PER. The difference is that while PER considers all transmissions including retransmissions, PLR only count it one time for each data packet no matter whether it may have been retransmitted multiple times.
For PLR, we also consider its mean and variance, denoted as and respectively. It is found that they are functions of payload size , SNR, buffer length , and maximum transmission attempts . By curve fitting as shown in Figure 5, the mean and variance of packet loss rate can be approximately modeled as
| (6) | |||||
| (7) |
IV Queueing Model for Delay Analysis
In comparison to estimating packet loss rate, which can be easily done by counting the numbers of packets sent and received, estimating delay particularly its distribution tail or delay quantile, which is crucial for time-critical applications, is more challenging. This is not only because measuring delay requires time-synchronisation among nodes in the system and accurate time information from both the sender and the receiver, but also because estimating the delay distribution tail requires much higher number of packets to be involved and the tail can vary significantly with respect to different traffic patterns.
To address this difficulty, our approach is to construct a queueing model on which delay analysis can be performed, including finding the delay tail distribution. In this section, we introduce the queueing model and validate the model using mean delay. In the next section, we further introduce how to estimate the delay tail and compare the analytical such results with measurement results under different traffic patterns.
IV-A Equivalent queueing model
For a system as shown in Figure 2, while looking simple, it is actually highly difficult or even intractable to conduct its delay analysis (e.g., see [4] for an example analysis and [5] for more discussion).
In order to simplify the analysis we introduce an equivalent queueing model. The basic idea is to treat the system as a blackbox from the receiver view, where all received packets have been successfully delivered without the lost packets. As such, we model the transmission process of successfully received packets over the wireless link as a non-loss queuing system as shown in Figure 6.
Specifically, as illustrated in Figure 6, the (successfully received) packets arriving to the equivalent system are served in the FIFO manner with an infinite size buffer for possible queueing. Let and respectively represent the original packet arrival process and the loss process. Then, the packet arrival process after considering lost packets becomes . In addition, we let represent the service time process of successfully received packets.
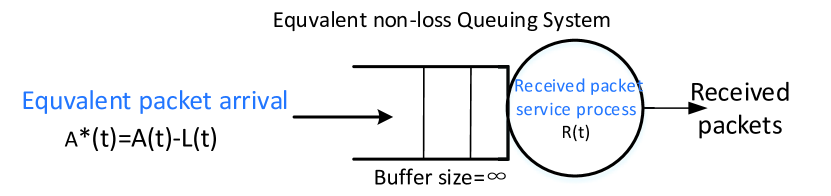
Given the mean and variance of packet loss rate (PLR), the mean and variance of the equivalent packet arrival rate, respectively denoted as and , can be found as:
| (8) | |||||
| (9) |
where denotes average packet inter-arrival time of the original packet arrival process.
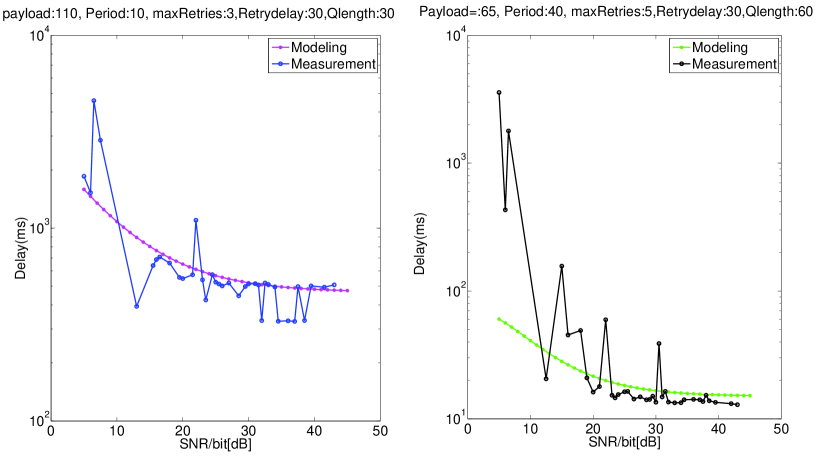
IV-B Model validation using mean delay
For a system that is not overloaded and hence has finite waiting time, let denote the mean arrival rate and its variance, and the mean service time and its variance. The following approximation for waiting time in queue is from the queueing theory, e.g. see [9]:
| (10) |
where is the traffic intensity of the system. With (10), the mean system delay is simply:
| (11) |
For the equivalent system, is the equivalent average packet arrival rate that can be found from (8) and its variance from (9), and and can be found from (4) and (5) respectively. With these, the mean delay can be analytically estimated from (11).
Figure 7 compares mean delay results obtained through experiment and through the analytical model above under different parameter settings. It can be observed that a good agreement between the two results can be found in most cases. This confirms the effectiveness of the proposed equivalent and its validity for mean delay analysis. For the delay from measurement results has larger variation in small SNR region, we remark that this is due to lack of delay samples in this SNR region under our experiment environment.
V Investigation on Delay Distribution
For applications requiring reliable real time data packet delivery, average delay is often not enough and the concern is more on the delay distribution, or more specifically the tail of the distribution, i.e., . However, for delay distribution of a system, there are few results from the classical queueing theory [9]. In the following, a new queueing theory, known as stochastic network calculus [6, 7], is resorted.
V-A Stochastic network calculus background
Stochastic network calculus is a queuing theory for stochastic performance guarantee analysis of communication networks [6, 7]. It is built upon two fundamental concepts, which are stochastic arrival curve (SAC) for traffic modeling and stochastic service curve (SSC) for server modeling [7]. There are several definition variations of SAC and SSC. In this paper, the following are adopted [7].
Definition 1.
(Stochastic Arrival Curve) A traffic flow is said to have a stochastic arrival curve with bounding function , if its arrival process satisfies, for any and all there holds:
| (12) |
where denotes the cumulative amount of traffic of the flow from time to time , .
Definition 2.
(Stochastic Service Curve) A system is said to have a stochastic service curve with bounding function , if for all and all there holds:
| (13) |
where , denotes the cumulative output traffic amount up to time .
Theorem 1.
(Stochastic delay bound) For a system, if the input has a stochastic arrival curve and the system provides a stochastic service curve to the input, as defined above respectively, and the arrival process is independent of the service process, then for the delay, the following bound holds [7]:
| (14) |
where, with denotes , represents the maximum horizontal distance between curves and , and is the Stieltjes convolution operation .
In the literature, the SACs of various types of traffic processes have been found [7, 8]. Examples are as follows. For a periodic arrival process with period length , and . For a Poisson arrival process with rate , and for any . For a Markov On-Off arrival process, in which, the source generates no arrivals at state Off and produces constant rate traffic at state On with rate , and the transition rate from state On to state Off is and the transition rate from state Off to state On is , and .
Assuming i.i.d. packet service times, the SSC has the following expressions [8]:
| (15) | |||||
| (16) |
with for , where denotes the packet length and the moment generating function (MGF) of packet service time , i.e., for any .
With these SAC and SSC results, the corresponding stochastic delay bounds for different types of arrival process are readily obtained from Theorem 1.
V-B Service modeling of the wireless link
To apply SNC results to delay distribution analysis of the wireless link, the discussion above indicates that we need to find a stochastic service curve for the link. To this aim, equations (15) and (16) are the bridge, where a variable that needs to be decided is the rate .
In order to obtain , we have to first find the MGF of packet service time. Since the distribution of the packet service time is unknown and difficult to obtain directly, we consider the following approach by making use of the empirical model for Packet Error Rate (PER) obtained from measurement.
As introduced in Sec.III, the per-packet service/transmission time is determined by the random variable , i.e., the number of transmissions per packet. The probability that a packet is not transmitted successfully is determined by PER , which is also the packet retransmission probability. In contrast, for each transmission attempt the successful probability is . As a result, has truncated geometric distribution with limit on the maximum number of transmissions per packet, from which the distribution of per-packet service time is readily found.
Specifically, we have
| (19) | |||||
| (22) |
where is approximated by (1), and and are given in (2) and (3) respectively. Further, according to the definition of moment generation function, an approximation of packet service time MGF is given by:
| (23) |
where is in a small neighborhood of zero.
Applying (V-B) to (15) and (16), a stochastic service curve of the link is obtained, based on which delay distribution analysis can be further conducted with Theorem 1.
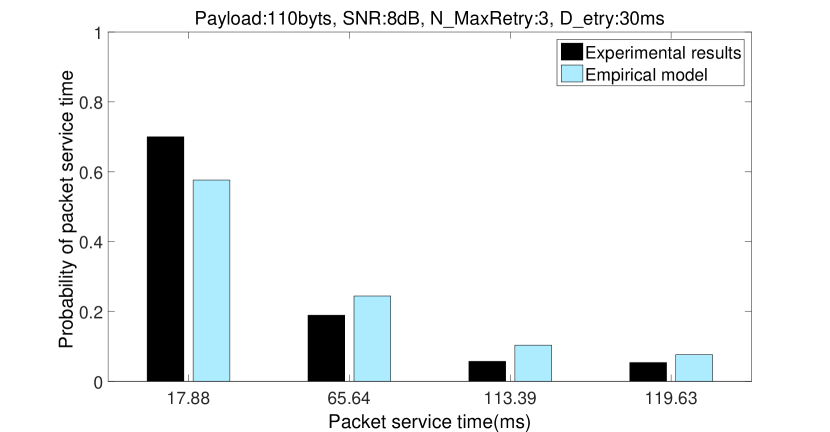
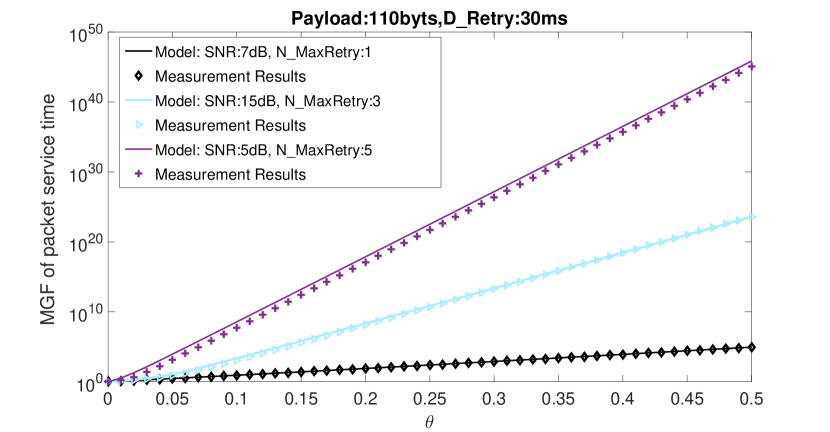
Validation: To verify the distribution and MGF empirical approximation model of packet service time, we analyzed the statistics of measured packet service time under different parameter settings. We compared results from the model (V-B) with those from statistical analysis of the per-packet service time measured in different parameter configurations. As illustrated in Figure 8, the truncated geometric distribution matches the measurement data well, meaning that the distributions of packet service time can be approximately modeled by PER and truncated geometric distribution. Further, by using statistic analysis of the measured per-packet service time, the MGF of packet service time can be computed. Figure 9 shows the comparison between computed MGF of measured packet service time and the proposed model as the different parameter setting. As Figure 9 illustrated, the approximated MGF is in good agreement with the measured result.
V-C Model validation using delay distribution
In Section IV-B, we have used mean delay to validate the equivalent queueing model for delay analysis. In the present subsection, we investigate the validity of the model using delay distribution.
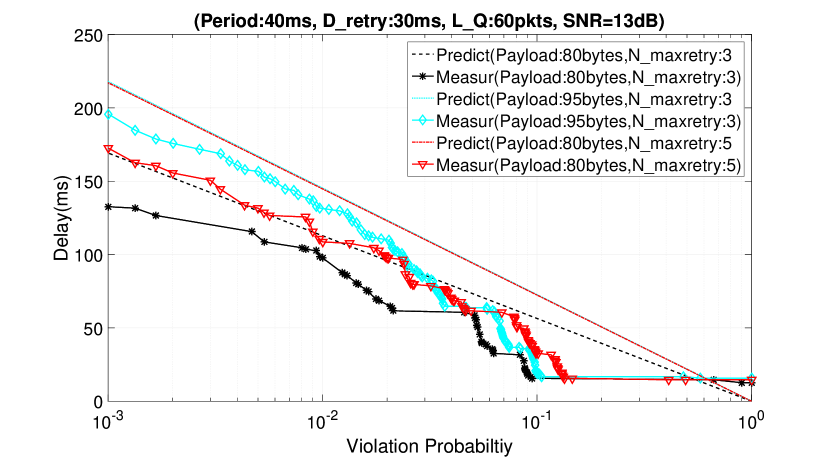
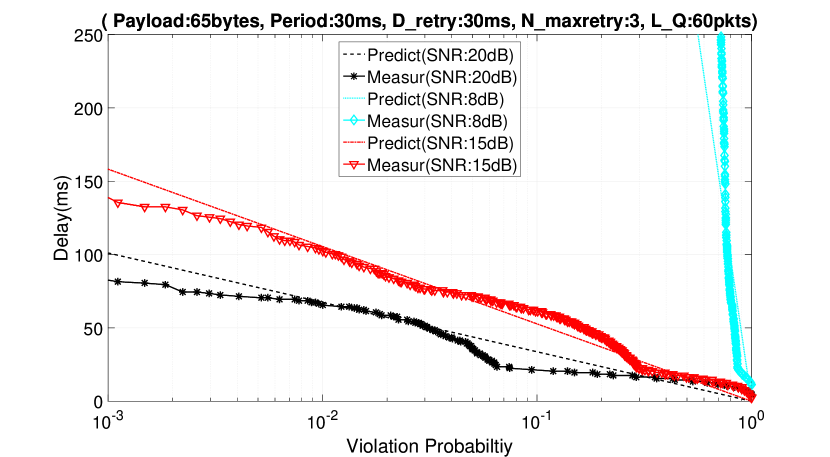
The results of validation are illustrated in Figure 10 and Figure 11. As can be observed, the predicted distributions based on analysis agree well with the measurement results for all cases. A cause of the slight difference in the matching is the MGF approximation model of packet service time, which has been used in deriving SSC and delay distribution bound. The results also show that higher traffic load (larger payload size and shorter packet inter-arrival time) and smaller SNR lead to increase in the delay, which is also predicted by our model. In addition, Figure 10 shows that by reducing the maximum number of transmission attempts the delay becomes smaller but will lead to lowering the reliability. Furthermore, increasing and reducing payload size together make the analytical delay distribution bounds closer to each other, which is also validated by experimental results.
V-D Further results
In the remaining, we show analytical delay distribution results based on the proposed equivalent queueing model, the empirical MGF based stochastic service curve characterization of the link and the stochastic network calculus theory, and compare with experimental results to conversely validate the analytical approximation model. Two additional traffic pattens are considered: Poisson traffic and Markov On-Off traffic. Their stochastic arrival curves have been given in Section V-A, with which, the corresponding delay distribution bounds are readily obtained from Theorem 1. For all performance bounds in the following figures, the free parameters are optimized numerically.
To validate the analytical approximation model, measurement results are also presented for delay distribution, for which additional experiments were conducted on the indoor wireless link using these traffic patterns. The distance between two nodes is 15m and the transmit power level for sender node is varied from 11 to 31. The packet delay for 3, 000 packets is recorded for each experiment.
V-D1 Poisson traffic
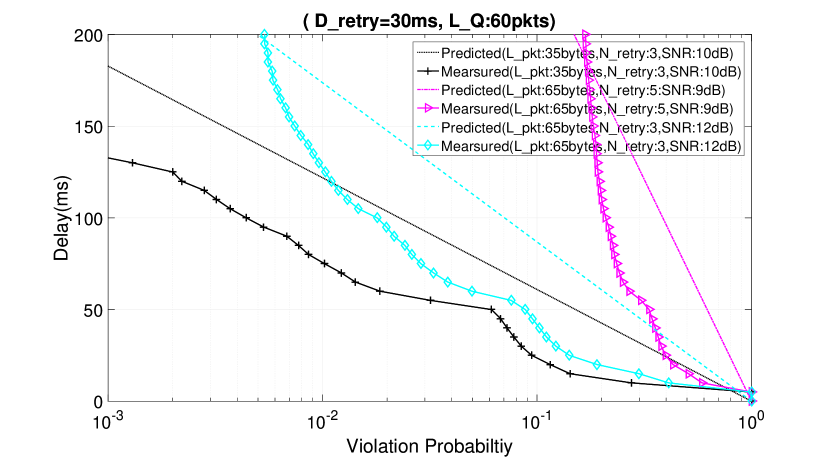
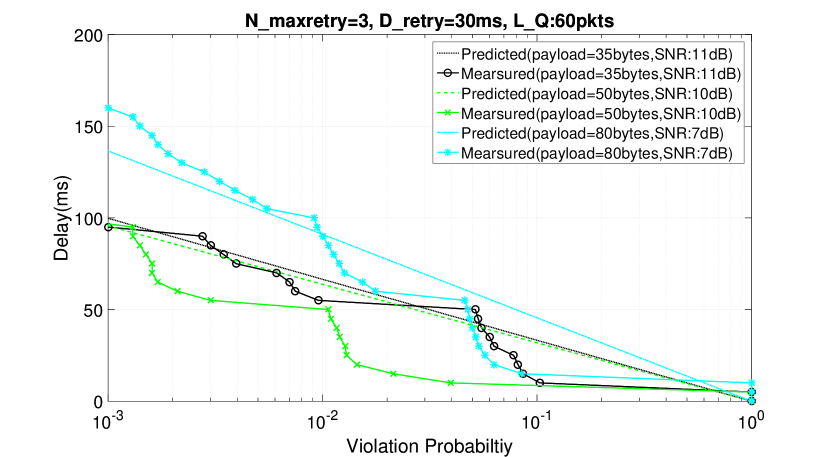
Figure 12 shows the CCDFs of measured delay along with the predictions by our analytical delay bounds. It shows that the predictions are closely along and in the same order of magnitude as the experiment results. It can be observed that the predictions, as analytical bounds, approximate with the measurements. The results shown in Figure 12 also reveal that heavier traffic (larger payload) leads to longer delay and lower reliability as can be observed from the analysis. However, for the same traffic, by reducing the maximum number of transmission attempts and increasing SNR, the delay decreases and reliability increases. Overall, Figure 12 shows that the delay performance under Poisson traffic can be effectively predicted, bounding the delay distribution, by our SNC-based analysis.
V-D2 Two state Markov On-Off traffic
To further check the applicability of our SNC-based delay distribution analysis, another traffic pattern, Markov On-Off, is considered. In this Markov modulated packet arrival process, pkts/s, pkts/s and periodic packet arrival rate pkts/s during state On. The results of both analytical and experiment results are illustrated in Figure 13. The figure shows that the delay bounds of the analytical model approximatively agree with the experiment results. The results suggest that increasing transmit power (to achive higher SNR) and reducing the packet payload significantly improve the delay performance as also captured by the analytical evaluations. Overall, it can be observed that our analytical model also performs well under Markov on-off traffic.
VI Conclusion
In this paper, we investigated the performance of packet delivery over a point-to-point 802.15.4 wireless link. Exploiting measurement results, two methods, respectively based on the classical queueing theory and the newly established stochastic network calculus (SNC) theory, have been introduced to estimate / predict the delay performance. Specifically, to ease delay analysis, an equivalent non-loss queueing model is constructed. Then, a classical queueing theory result is utilized to estimate the mean delay performance. Afterwards, SNC is applied to estimate the delay distribution performance, for which, a method to model the service time is introduced. In all these, i.e., queueing model, mean delay analysis, service time modeling and delay distribution analysis, measurement results have played crucial roles. They have not only been analyzed to establish empirical models that are utilized in these steps, but also been compared with results from the analysis, under a wide range of settings. The comparisons, showing a good match between analytical results and measurement results, give a clear indication on the effectiveness and validity of the proposed equivalent model, the classical queueing theory based mean delay analysis and the SNC based delay distribution analysis.
References
- [1] David Tse and Pramod Viswanath, Fundamentals of Wireless Communication, Cambridge University Press, 2005.
- [2] Dapeng Wu and R. Negi, “Effective Capacity: A Wireless Link Model for Support of Quality of Service,” IEEE Transactions on Wireless Communications, 2(4), pp. 630-643, 2003.
- [3] K. Zheng, F. Liu, L. Lei, C. Lin and Yuming Jiang, “Stochastic Performance Analysis of a Wireless Finite-State Markov Channel,” IEEE Transactions on Wireless Communications, 12(2), pp. 782-793, 2013.
- [4] J.-w. Cho, and Yuming Jiang, “Fundamentals of the Backoff Process in 802.11: Dichotomy of the Aggregation,” IEEE Transactions on Information Theory, 2015
- [5] Yuming Jiang, “Wireless Network Calculus: Extension Application of Stochastic Network Calculus to Wireless Networks,” Dagstuhl Seminar 15112: Network Calculus, Germany, March 2015.
- [6] Y. Jiang. A Basic Stochastic Network Calculus, ACM SIGCOMM, 2006.
- [7] Y. Jiang and Y. Liu, Stochastic Network Calculus, Springer, 2008.
- [8] Y. Jiang. A Note on Applying Stochastic Network Calculus, preprint, 2010.
- [9] Leonard Kleinrock, Queueing Systems, Volume 2: Computer Applications. Wiley, 1976.
- [10] G. Ferrari, P. Medagliani, S. D. Piazza, and M. Martalò, “Wireless sensor networks: Performance analysis in indoor scenarios,” EURASIP J. Wirel. Commun. Netw.,2007.
- [11] J. Wang, W. Dong, Z. Cao, and Y. Liu, “On the delay performance analysis in a large-scale wireless sensor network,” in IEEE RTSS, 2012.
- [12] N. Dopico, C. Gil-Soriano, I. Arrazola, and S. Zazo, “Analysis of ieee 802.15.4 throughput in beaconless mode on micaz under tinyos 2,” in IEEE VTC, 2010.
- [13] W. Dong, Y. Liu, Y. He, T. Zhu, and C. Chen, “Measurement and analysis on the packet delivery performance in a large-scale sensor network,” Networking, IEEE/ACM Transactions on, 2013.
- [14] S. Fu, Y. Zhang, Y. Jiang, C. Hu, C.-Y. Shih, and P. Marron, “Experimental study for multi-layer parameter configuration of WSN links,” in IEEE ICDCS, 2015.
- [15] S. Fu, Y. Zhang, M. Ceriotti, Yuming Jiang, M. Packeiser, and P. Marron, “Modeling packet loss rate of IEEE 802.15.4 links in diverse environmental conditions”, IEEE WCNC, 2018
- [16] Y. Zhang, S. Fu, Y. Jiang, M. Ceriotti, M. Packeiser, and P. Marron, “An LQI-Based Packet Loss Rate Model for IEEE 802.15.4 Links”, IEEE PIMRC, 2018
- [17] “IEEE standard 802.15.4-2003,” IEEE Std P802.15.4/D3, 2005.
- [18] T. Wiki., “Cc2420 hardware and software acks,” http://http://tinyos.stanford.edu/tinyos-wiki/index.php/PacketLink.
- [19] S. Fu and Y. Zhang, “CRAWDAD data set due/packet-delivery (v. 2015-03-30),” Downloaded from http://crawdad.org/due/packet-delivery/, Mar. 2015.