Evidence against superconductivity in flux trapping experiments on hydrides under high pressure On magnetic field screening and expulsion in hydride superconductors
Abstract
It has recently been reported that hydrogen-rich materials under high pressure trap magnetic flux, a tell-tale signature of superconductivity e22 . Here we point out that under the protocol used in these experiments the measured results indicate that the materials trap magnetic flux. Instead, the measured results are either experimental artifacts or originate in magnetic properties of the sample or its environment unrelated to superconductivity, Together with other experimental evidence analyzed earlier, this clearly indicates that these materials are not superconductors.
In a second part, we discuss magnetic field screening and expulsion.
I introduction
Following the paper “Conventional superconductivity at 203 kelvin at high pressures in the sulfur hydride system”, published in 2015 sh3 , several other hydrogen rich materials under high pressure have been reported in recent years to be high-temperature superconductors based on observed drops in resistance versus temperature eremetsp ; eremetslah ; zhaolah ; hemleylah ; hemleylah2 ; yttrium2 ; yttrium ; yttriumdias ; thorium ; pr ; layh10 ; roomt ; ceh ; snh ; bah ; cah ; cah2 . Many more such materials have been determined to be conventional high-temperature superconductors based on theoretical evidence semenok ; review1 ; review2 ; theory1 ; theory2 ; theory3 . However, little magnetic evidence has so far been provided in support of the claims of superconductivity sh3 ; e2021p ; e2022 ; nrs ; huang , and what evidence does exist has been strongly called into question hm3 ; hm4 ; hm7 ; huangmine .
In particular, these materials show no trace of magnetic flux expulsion, i.e. the Meissner effect, when cooled in the presence of a magnetic field sh3 ; e2021p ; e2022 . They also apparently are able to screen very large applied magnetic fields nrs . This has been interpreted as indicating that the materials are “hard superconductors” with very strong pinning centers that prevent both flux penetration and flux expulsion e2021p ; e2022 ; nrs . We have argued that if that is the case the materials should also trap large magnetic fields hm5 , and that observation of flux trapping would provide definitive evidence that the materials can sustain persistent currents, hence are indeed superconductors hm5 .
Experiments aimed at detecting flux trapping were recently performed by Minkov et al. and the results analyzed and reported in Ref. e22 . Ref. e22 interprets the measured data as clearly indicating that the materials are superconductors. Instead, we analyze here the information presented in Ref. e22 and conclude that it proves the absence of superconductivity in these materials.
II experimental protocols
The flux trapping experiments on sulfur hydride () e22 were performed under zero-field-cooling (ZFC) conditions for 13 values of applied field ranging from 0 to , and under field cooling (FC) conditions for one field value only, . The results for both protocols for field 4T were reported to agree e22 . In the ZFC protocol, the sample was cooled to low temperatures in zero magnetic field, a magnetic field was then applied and gradually increased to reach value , then after 1 hour the external field was gradually decreased to zero, then the resulting magnetic moment was measured with a SQUID magnetometer.
figt1-eps-converted-to
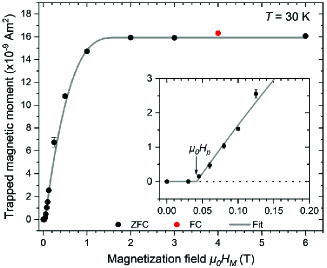
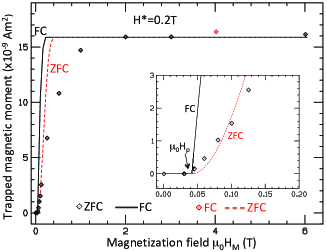
Fig. 1 shows the experimental data and a theoretical fit to the data given in Ref. e22 . Note in particular that the measured magnetic moment rises linearly from zero when the applied field exceeds the threshold value both for the experimental data and for the theoretical fit.
The experimental results were reportedly analyzed in Ref. e22 assuming the Bean model bean controls the behavior of fields and currents in the material. From the experimental results, Ref. e22 inferred the parameters:
=threshold value of the applied field where it begins to penetrate the sample at low temperatures. Assuming demagnetization , this implies a lower critical field value .
= minimum applied field that reaches the center of the sample (called “full penetration field”), with assumed sample diameter and height , .
The measured moment was found to increase with magnetic field up to a maximum value of approximately for when the applied magnetic field was or larger. Following the Bean model, Ref. e22 concluded that
| (1) |
from which the value of was extracted.
The theoretical fit performed in Ref. e22 assumed the magnetic moment is given by (with the critical current)
| (2a) | |||
| (2b) |
so that , .
III our analysis
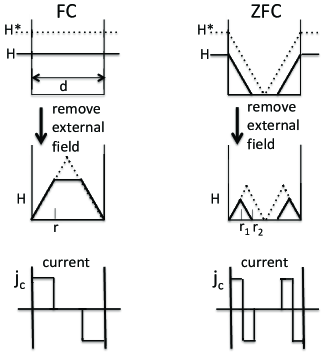
Just as Ref. e22 , we assume the validity of the Bean model. However we disagree that Eqs. (2a), (2b) used by the authors of e22 is the proper way to calculate the trapped magnetic moment under ZFC conditions. Instead, we argue that Eq. (2a) is the proper way to calculate the trapped moment under FC conditions, provided Eq. (2b) is replaced by
| (3) |
for , for , with . This is illustrated in the left panels of Fig. 2. For ZFC conditions instead, the diagrams shown in the right panels of Fig. 2 apply. For that case, the magnetic moment is given by
| (4) |
where, for
| (5a) | |||
| (5b) |
For , is given by Eq. (5a) and , and for , .
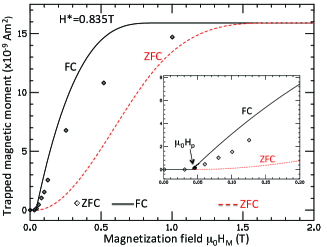
Fig. 3 shows what these expressions predict for the trapped magnetic moment versus magnetization field for the parameters assumed in Ref. e22 . Most importantly, the moment rises from zero under FC conditions and for ZFC conditions. As seen in the inset, for small fields the ZFC moment is very much smaller than the FC moment and in stark disagreement with the experimental observations.
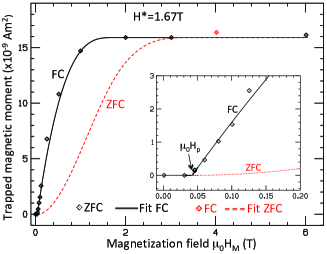
The experimental results of Ref. e22 are actually well fit by our FC calculation for all values of the magnetization field if we take the value of to be twice as large as inferred in Ref. e22 , i.e. . This is shown in Fig. 4. We conclude that this agreement is accidental, since the experimental protocol was ZFC for all but one experimental point e22 .
In order to try to fit the low field ZFC experimental data to the ZFC calculation we would have to take a much smaller value of . Fig. 5 shows the results for , chosen to fit as well as possible the low field data. In addition to not fitting the low field data very well, the higher field data deviate strongly from the theoretical ZFC curve. For this assumed value of the trapped moment saturates for (Eq. (1)), in clear contradiction with the experimental data that show no saturation till .
IV discussion
Is it possible that under the ZFC protocol of the experiment with the field applied for 1 hour, the field could penetrate sufficiently so as to mimic the FC protocol? It is not possible, because Ref. e22 also measured the rate of flux creep and there was negligible flux creep over a 1 hour period even at temperatures as high as 165K. Also, according to the NRS experiment nrs the flux didn’t penetrate over times substantially larger than 1 hour.
Therefore, the experimental results of Ref. e22 shown in Fig. 1 of this paper are incompatible with the interpretation that the magnetic moment observed originates in flux trapping. If the magnetic moment had originated in flux trapping, it would rise quadratically from zero as function of the magnetization field under the ZFC conditions of the experiment, not linearly as observed. Therefore, the experiment indicates that there is no flux trapping in this material, . As argued in Refs. hm7 ; hm5 , if the material doesn’t trap flux, and in addition it does not expel flux, then the material is not a superconductor.
The question then arises, what is the origin of the magnetic moments measured in Ref. e22 shown in Fig. 1? We suggest they are either experimental artifacts associated with the experimental apparatus used (SQUID magnetometer) or magnetic moments of localized spins originating either in the sample or in the diamond anvil cell environment (gasket, etc). It is also possible that the measurements could signal unexpected collective magnetic behavior of hydrogen-rich materials under high pressure, as suggested in Ref. fm .
To confirm the results of our analysis we suggest that it would be of interest to repeat the measurements of Ref. e22 under FC conditions. We expect that the results will be similar to the results under ZFC conditions, in contradiction with what is expected from trapped flux shown in Figs. 3 and 4, namely a marked difference between FC and ZFC behavior, and consistent with the hypothesis that the origin of the magnetic moments measured is localized spins rather than delocalized supercurrents. We suggest that it would also be informative to perform these experiments using FC and ZFC protocols for a known hard superconductor and verify the expected qualitatively different behavior shown in Figs. 3 and 4.
Finally, we would like to point out that the interpretation of the measurements of magnetic moment of Ref. e22 as originating in flux trapping with appear to be in contradiction with the magnetic moment measurements presented in Ref. e2021p . For example, according to the former (see our Fig. 2 top right panel) for an applied field the magnetic field should still be excluded from more than of the sample even at temperature (see Fig. 1c of e22 ). Instead, the magnetic moment measurements shown in Fig. 3a of Ref. e2021p indicate that the diamagnetism has essentially disappeared at that point.
Acknowledgements.
FM was supported in part by the Natural Sciences and Engineering Research Council of Canada (NSERC) and by an MIF from the Province of Alberta. We are grateful to the authors of Ref. e22 and particularly V. Minkov for clarifying information.References
- (1) V. S. Minkov, V. Ksenofontov, S. L. Budko, E. F. Talantsev and M. I. Eremets, “Trapped magnetic flux in hydrogen-rich high-temperature superconductors”, arXiv:2206.14108v1 (2022).
- (2) A.P. Drozdov, M.I. Eremets, I. A.Troyan, V. Ksenofontov and S. I. Shylin, ‘Conventional superconductivity at 203 kelvin at high pressures in the sulfur hydride system’, Nature 525, 73-76 (2015).
- (3) A.P. Drozdov, M. I. Eremets and I. A. Troyan, “Superconductivity above 100 K in PH3 at high pressures”, arXiv:1508.06224 (2015).
- (4) A.P. Drozdov et al., ‘Superconductivity at 250 K in lanthanum hydride under high pressures’, Nature 569, 528-531 (2019).
- (5) F. Hong et al, “Superconductivity of Lanthanum Superhydride Investigated Using the Standard Four-Probe Configuration under High Pressures”, Chin. Phys. Lett. 37, 107401 (2020).
- (6) M. Somayazulu et al., ‘Evidence for superconductivity above 260 K in lanthanum superhydride at megabar pressures’, Phys. Rev. Lett. 122, 027001 (2019).
- (7) A. D. Grockowiak et al, “Hot Hydride Superconductivity above 550 K”, Front. Electron. Mater, 04 March 2022.
- (8) P. P. Kong et al, “Superconductivity up to 243 K in the yttrium-hydrogen system under high pressure”, Nat Commun 12, 5075 (2021).
- (9) Y. A. Troyan et al., “Anomalous high-temperature superconductivity in ”, Adv. Mater. 2006832 (2021).
- (10) E. Snider et al, “Synthesis of Yttrium Superhydride Superconductor with a Transition Temperature up to 262 K by Catalytic Hydrogenation at High Pressures”, Phys. Rev. Lett. 126, 117003 (2021).
- (11) D. V. Semenok et al., “Superconductivity at 161 K in thorium hydride : Synthesis and properties”, Materials Today 33, 36-44 (2020).
- (12) D. Zhou et al, “Superconducting praseodymium superhydrides”, Science Advances 6, eaax6849 (2020).
- (13) D. V. Semenok et al, “Superconductivity at 253 K in lanthanum-yttrium ternary hydrides”, Materials Today 48, 18 (2021).
- (14) E. Snider et al., ‘Room-temperature superconductivity in a carbonaceous sulfur hydride’, Nature 586, 373 (2020).
- (15) W. Chen et al, “High-Temperature Superconducting Phases in Cerium Superhydride with a up to 115 K below a Pressure of 1 Megabar”, Phys. Rev. Lett. 127, 117001 (2021).
- (16) F. Hong et al, “Possible superconductivity at in tin hydride under high pressure”, Materials Today Physics 22, 100596 (2022).
- (17) W. Chen et al, “Synthesis of molecular metallic barium superhydride: pseudocubic , Nature Comm. 12, 273 (2021).
- (18) L. Ma et al, “High-Temperature Superconducting Phase in Clathrate Calcium Hydride up to 215 K at a Pressure of 172 GPa”, Phys. Rev. Lett. 128, 167001 (2022).
- (19) Z. W. Li et al, “Superconductivity above 200 K discovered in superhydrides of calcium’, Nat Commun 13, 2863 (2022).
- (20) D. V. Semenok et al, “On Distribution of Superconductivity in Metal Hydrides”, Current Opinion in Solid State and Materials Science 24, 100808 (2020) and references therein.
- (21) C. J. Pickard, I. Errea and M. I. Eremets, “Superconducting Hydrides Under Pressure”, Ann. Rev. Cond. Matt. Phys. 11, pp 57-76 (2020) and references therein.
- (22) J. A. Flores-Livas et al., “A perspective on conventional high-temperature superconductors at high pressure: Methods and materials”, Physics Reports 856, 1-78 (2020).
- (23) L. Boeri and B. Bachelet, “Viewpoint: the road to room-temperature conventional superconductivity”, J. Phys. Cond. Matt. 31, 234002 (2019).
- (24) Y. Quan, S. S. Ghosh, and W. E. Pickett, “Compressed hydrides as metallic hydrogen superconductors”, Phys. Rev. B 100, 184505 (2019).
- (25) E. Zurek and T. Bi, “High-temperature superconductivity in alkaline and rare earth polyhydrides at high pressure: A theoretical perspective”, J. Chem. Phys. 150, 050901 (2019).
- (26) V. S. Minkov et al, “Magnetic field screening in hydrogen-rich high-temperature superconductors”, Nat Commun 13, 3194 (2022).
- (27) M. I. Eremets et al, “High-temperature superconductivity in hydrides: experimental evidence and details”, J Supercond Nov Magn 35, 965 (2022).
- (28) I. Troyan et al, “Observation of superconductivity in hydrogen sulfide from nuclear resonant scattering”, Science 351, 1303 (2016).
- (29) X. Huang et al, “High-temperature superconductivity in sulfur hydride evidenced by alternating-current magnetic susceptibility”, Nat. Sci. Rev. 6, 713 (2019).
- (30) J. E. Hirsch and F. Marsiglio, “Meissner effect in nonstandard superconductors”, Physica C 587, 1353896 (2021).
- (31) J. E. Hirsch and F. Marsiglio, “Absence of magnetic evidence for superconductivity in hydrides under high pressure”, Physica C 584, 1353866 (2021).
- (32) J. E. Hirsch and F. Marsiglio, “Clear evidence against superconductivity in hydrides under high pressure”, arXiv:2110.07568 (2021), to be published in MRE.
- (33) J. E. Hirsch, “Faulty evidence for superconductivity in ac magnetic susceptibility of sulfur hydride under pressure”, National Science Review 9, nwac086 (2022).
- (34) J. E. Hirsch and F. Marsiglio, “Flux trapping in superconducting hydrides under high pressure”, Physica C 589, 1353916 (2021).
- (35) Reference e22 states “The trapped magnetic moment was determined as the difference between the measured magnetic moment after magnetization cycle and the residual magnetic moment, which arises from the body of the miniature DAC above the corresponding (see Supplementary Figure 1).” Therefore a subtraction is involved in the magnetic moment data presented in Ref. e22 .
- (36) C. P. Bean, “Magnetization of High-Field Superconductors”, Rev. Mod. Phys. 36, 31 (1964).
-
(37)
J. E. Hirsch,
“Ferromagnetism in metallic hydrogen”,
Phys. Lett. A
141, 191-195 (1989);
“Superconductivity and hydromagnetism”,
Physica B 163, 291-298 (1990).
Second part starts on next page
V second part
The above manuscript was posted on arxiv on 14 Jul 2022 and published in
J Supercond Nov Magn 35, 3141–3145 (2022). What follows is a new manuscript, under consideration for publication in Nature Communications
as “Matters Arising”,
submitted to arxiv on 11/14/2022, that arxiv decided should be combined with the
above manuscript to allow posting.
On magnetic field screening and expulsion in hydride superconductors
Ref. e2021pn presents evidence for magnetic field screening and “subtle” evidence for magnetic field expulsion in hydrides under high pressure, which is argued to support the claim that these materials are high temperature superconductors. We point out here that data presented in Ref. e2021pn appear to be inconsistent (i) with one another, (ii) with other measurements reported by the same authors on the same samples e2015n ; e2021n , and (iii) with expected behavior of standard superconductors. This suggests that these magnetic phenomena reported for these materials are not associated with superconductivity, undermining the claim that these materials are high temperature superconductors.
In 2015, Eremets and coworkers reported high temperature superconductivity in sulfur hydride (hereafter ) under pressure e2015n , starting the hydride superconductivity epoch. Since then to the present, considerable evidence for superconductivity in various pressurized hydrides has been presented based on resistance measurements troyan22n , however little magnetic evidence for superconductivity has been reported so far. In their original paper e2015n Eremets and coworkers presented some magnetic evidence based on SQUID measurements. After a long hiatus, new evidence was presented this year in Nat. Comm. 13, 3194 (2022) e2021pn . That evidence is the subject of this comment. We focus here on the magnetic measurements reported for sulfur hydride (), but exactly the same considerations apply to the same measurements reported for lanthanum hydride () in Ref. e2021pn , the only other hydride material for which magnetic measurements have been reported to date.
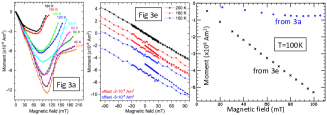
Figure 6 left and center panels reproduce Fig. 3a and Fig. 3e of ref. e2021pn . To the best of our understanding from carefully reading the paper, both panels show in their light-blue and blue curves respectively the same quantity: magnetic moment versus magnetic field, for the same sample at the same temperature (100K) and same pressure (155 GPa). The middle blue curve in the center panel is the virgin curve, which starts (when properly shifted vertically, as shown in Fig. S10 of e2021pn ) with zero moment for zero applied field. It should be the same as the light blue curve labeled 100K on the left panel. Yet the curves look very different. The left panel curve shows an upturn for magnetic field beyond 95mT while the center panel curve show no upturn. When plotting both curves on the same scale in the right panel in Fig. 6 it is apparent that they are very different in magnitude and shape.
It should also be noted that the rapid decrease in the magnitude of the magnetic moments beyond the minimum points of the curves shown in Fig. 6 left panel is inconsistent with what is expected for a type II superconductor with very large upper critical field tinkhamt2n , estimated in Ref. e2021pn to be . For example, at should be above . When corrected for demagnetization factor estimated as in Ref. e2021pn , it implies that the curve labeled should evolve smoothly from its value attained at approaching zero at or beyond . This is qualitatively inconsistent with the behavior seen in Fig. 6 left panel that shows that the magnetic moment magnitude has already decreased to less than of its maximum value for a field as small as . Furthermore, in the presence of strong pinning, which Ref. e2021pn claims has to exist in order to explain the absence of flux expulsion in their samples, the decay of the induced diamagnetic moment should be even slower than for an ideal type II superconductor bean ; senoussin , hence very much slower than what is shown in Fig. 6 left panel.
We also point out that the magnitude of diamagnetic moment versus temperature under zero field cooling reported in Ref. e2021pn Figs. 2e and S1 left middle panel differs by a factor of 4 or more from the same quantity reported in 2015 in Ref. e2015n Figs. 4a and extended data Fig. 6c for samples estimated to be of similar size, with the earlier result showing the larger moment. While in field cooling experiments one may expect substantial variations in magnetic moment depending on sample quality, this is not expected to be the case for zero field cooling experiments.
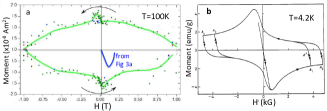
Figure 7 shows as a blue curve the magnetic moment versus magnetic field at temperature 100K from the left panel of Fig. 6, i.e. Fig. 3a of Ref. e2021pn , compared with the magnetic moment versus magnetic field for a hysteresis cycle at the same temperature for the same sample at the same pressure reported in Fig. 4a of Ref. e2021n , that was used to obtain the critical current data shown in Fig. S5 of Ref. e2021pn . The blue curve on the left panel of Fig. 7 should be the virgin curve for this hysteresis cycle, joining smoothly the green curve, as is universally seen in such measurements for superconductors. One such typical example is shown on the right panel of Fig. 7, from Ref. senoussin . It can be seen that the blue curve on the left panel shows no hint of joining the green curve. In other words, these measured results on the same sample for the same temperature and pressure measured in the same laboratory e2021pn ; e2021n are completely incompatible with one another under the assumption that they arise from superconductivity in the sample.
Ref. e2021pn says that it uses a background subtraction procedure. However, neither is the background signal given in Ref. e2021pn nor is the procedure used clearly explained. Perhaps, more information on the data processing that has been performed would help explain some of the anomalies pointed out above. But even with such clarification we believe that the above analysis indicates that the reported magnetic measurements e2021pn are inconsistent with the assumption that they originate in superconductivity. Instead, we suggest that they originate in localized magnetic moments associated with the samples, the diamond anvil cell environment, and/or the measuring apparatus.
The signature property of superconductors, that cannot be mimicked by localized magnetic moments, is the Meissner effect, the ability to magnetic fields when cooled in a field (FC). In Ref. e2021pn , the authors claim to find “subtle Meissner effect in FC measurements at 2 mT” indicated by the light blue curve shown in their Fig. S1 middle left panel. However, when the same data are plotted in Fig. SI1 middle left panel of Ref. e2021n without the light blue curve, no evidence for a Meissner effect is seen. While for some standard superconductors with strong pinning the percentage of flux expulsion (Meissner fraction) can be very small for larger fields, it rapidly increases for small fields, as shown e.g. in Refs. meissner1n ; meissner3n ; thick2n ; meissner4n . The Meissner fraction is expected to depend on the ratio meissner2n , and for is estimated to be e2021pn , which is more than an order of magnitude larger than lower critical fields for standard superconductors with high such as cuprates and pnictides. So the field 2mT of Fig. S1 of Ref. e2021pn is equivalent to a field of less than 2 Oe for those other materials, for which a sizable Meissner fraction is found meissner1n ; meissner3n ; thick2n ; meissner4n . It should also be noted that in Ref. e2015n Extended Data Fig. 6 (c) the authors plotted magnetic moment under FC for magnetic fields down to 0.2mT showing no evidence for a Meissner effect. Additionally, the Meissner fraction is expected to increase as the thickness of the sample decreases thick1n ; thick2n , and the samples used in these high pressure experiments are rather thin.
Elsewhere we have also called attention to the facts that (i) Fig. SI1 of Ref. e2021pn lower left panel shows that the ZFC and FC magnetic moment curves for the precursor sample, not expected to be superconducting, also show an unexplained divergence around 200K hmmren , (ii) the behavior of magnetic moment versus temperature shown in Fig. 6 is incompatible with the claim of Ref. nrsn , referenced in Ref. e2021pn in support of superconductivity of sulfur hydride, that a magnetic field as large as 0.68T is excluded from the sample hnrs , and (iii) ac magnetic susceptibility measurements for sulfur hydride huangn referenced in Ref. e2021pn as evidence for superconductivity were shown to result from an experimental artifact huangminen .
Recently, the authors of Ref. e2021pn also reported measurement of trapped magnetic flux in their samples as evidence for superconductivity etrappedv2n . We pointed out hmtrappedn that the reported linear behavior of trapped moment versus field in zero field cooling experiments etrappedv2n is inconsistent with the expected behavior of hard superconductors beann . In addition, the magnetic moment measurements reported in Ref. e2021pn indicate that at low temperatures magnetic fields of up to 95mT are excluded from the sample (see Fig. 6 left panel here), which is inconsistent with the reported finding in Ref. etrappedv2n that applied fields as small as 50mT penetrate and are trapped by the same samples.
In summary, we argue that the matters pointed out here cast doubt on the interpretation of Ref. e2021pn that the reported measurements originate in superconductivity.
Acknowledgements.
We acknowledge some helpful correspondence with the authors of Ref. e2021pn . JEH is grateful to R. Prozorov for illuminating discussions. FM was supported in part by the Natural Sciences and Engineering Research Council of Canada (NSERC) and by an MIF from the Province of Alberta.Author contributions: JEH initiated the study. JEH and FM analyzed the data and prepared the manuscript.
Competing interests: the authors declare no competing interests.
Data availability statement: The data that support the findings of this study are available from the authors upon reasonable request.
References
- (1) V. Minkov et al, “Magnetic field screening in hydrogen-rich high-temperature superconductors”, Nat Commun 13, 3194 (2022).
- (2) A.P. Drozdov, M.I. Eremets, I. A.Troyan, V. Ksenofontov and S. I. Shylin, “Conventional superconductivity at 203 kelvin at high pressures in the sulfur hydride system”, Nature 525, 73-76 (2015).
- (3) V. S. Minkov et al, “The Meissner effect in high-temperature hydrogen-rich superconductors under high pressure”, Res. Sq. DOI:10.21203/rs.3.rs-936317/v1 (2021).
- (4) I. A. Troyan et al, “High-temperature superconductivity in hydrides”, Phys. Usp. 65 748–761 (2022) and references therein.
- (5) M. Tinkham, “Introduction to superconductivity”, Second Edition, McGraw Hill, New York, 1996, figure 5.2.
- (6) C. P. Bean, “Magnetization of Hard Superconductors”, Phys. Rev. Lett. 8, 250 (1962).
- (7) M. Oussena, S. Senoussi and G. Collin, “Magnetic Hysteresis in ”, EPL 4, 625 (1987).
- (8) L. Krusin-Elbaum et al, “Low-field Meissner fraction of YBaCuO in a flux pinning model”, Physica C 153–155, 1469 (1988).
- (9) M.Wetzstein et al, “On the low-field Meissner fraction in high-Tc ceramics”, Physica B 169, (1991).
- (10) Y. Tomioka, M. Naito, K. Kishio and K. Kitazawa, “The Meissner and shielding effects of high-temperature oxide superconductors”, Physica C 223, 347 (1994).
- (11) R. Prozorov et al, “Anomalous Meissner effect in pnictide superconductors”, Phys. Rev. B 82, 180513(R) (2010).
- (12) V.V.Moshchalkov and A.A.Zhukov, “The Meissner effect in superconductors with strong vortex pinning”, Physica B 169, 601 (1991).
- (13) M.V. Kartsovnik, G.Yu. Logvenov and K.Ya. Soifer, “Sample size effect on the Meissner fraction in single crystals”, Cryogenics 30, 647 (1990).
- (14) J. E. Hirsch and F. Marsiglio, “Clear evidence against superconductivity in hydrides under high pressure”, Matter and Radiation at Extremes 7, 058401 (2022).
- (15) I. Troyan et al, “Observation of superconductivity in hydrogen sulfide from nuclear resonant scattering”, Science 351, 1303 (2016).
- (16) J. E. Hirsch, “Comment on “On the Analysis of the Tin-Inside- Mossbauer Experiment” ”, J Supercond Nov Mag. 35, 3115–3117 (2022).
- (17) X. Huang et al, “High-temperature superconductivity in sulfur hydride evidenced by alternating-current magnetic susceptibility”, Nat. Sci. Rev. 6, 713 (2019).
- (18) J. E. Hirsch, “Faulty evidence for superconductivity in ac magnetic susceptibility of sulfur hydride under pressure”, National Science Review, 9, nwac086 (2022).
- (19) V. S. Minkov, V. Ksenofontov, S. L. Budko, E. F. Talantsev and M. I. Eremets, “Trapped magnetic flux in hydrogen-rich high-temperature superconductors”, arXiv:2206.14108v2 (2022).
- (20) J. E. Hirsch and F. Marsiglio, “Evidence Against Superconductivity in Flux Trapping Experiments on Hydrides Under High Pressure”, J Supercond Nov Magn 35, 3141–3145 (2022).