Arrival Directions of Cosmic Rays above 32 EeV from Phase One of the Pierre Auger Observatory
Abstract
A promising energy range to look for angular correlation between cosmic rays of extragalactic origin and their sources is at the highest energies, above few tens of EeV (eV). Despite the flux of these particles being extremely low, the area of covered at the Pierre Auger Observatory, and the 17-year data-taking period of the Phase 1 of its operations, have enabled us to measure the arrival directions of more than 2,600 ultra-high energy cosmic rays above . We publish this data set, the largest available at such energies from an integrated exposure of , and search it for anisotropies over the steradians covered with the Observatory. Evidence for a deviation in excess of isotropy at intermediate angular scale, with Gaussian spread or top-hat radius, is obtained at the significance level for cosmic-ray energies above .
2022-08-24
1 Introduction
Cosmic rays are observed up to the astounding energies of more than eV, making them the most energetic particles known in the Universe. However, the origin of these particles remains elusive. The search for the sources of ultra-high energy cosmic rays (UHECRs), at energies above a few EeV (), is challenging since they are almost all charged particles and thus deflected by the magnetic fields permeating the interstellar, intra-halo and intergalactic media (see e.g. Alves Batista et al., 2019, for an overview). These magnetic fields are difficult to study and their modeling is far from being complete. However, above a few tens of EeV, the deflections could be small enough for cosmic rays to retain some directional information on the position of their sources, at least for nuclei with a sufficiently small charge (e.g. Erdmann et al., 2016; Farrar & Sutherland, 2019).
The cosmological volume within which UHECR sources should be sought is fortunately limited. Cosmic rays at EeV energies can interact with the photon backgrounds populating intergalactic space, through the so-called GZK effect (Greisen, 1966; Zatsepin & Kuz’min, 1966). In particular, protons are expected to undergo photo-pion production and nuclei photodissociation interactions. The mean free path for energy losses depends on the cosmic-ray mass and energy. At 100 EeV, the loss length is of the order of Mpc for proton and iron and Mpc for intermediate nuclei such as helium and nitrogen (Allard 2012; see also Figure 6 from Addazi et al. 2022 for a recent overview). Such short distances mean that the sources of the highest-energy cosmic rays must be in the local universe.
The recent detection by the Pierre Auger Collaboration of a dipolar anisotropy in the arrival directions of UHECRs with energies above EeV is evidence that the majority of UHECR sources are not in the Milky Way (Pierre Auger Collaboration, 2017a). The direction of the dipole points away from the Galactic center and is instead consistent at the level with the local distribution of stellar mass (2MASS redshift survey, Huchra et al., 2012), after accounting for the deflections expected in the Galactic magnetic field (Jansson & Farrar, 2012). Even without relying on magnetic deflections, the case for a density of UHECR sources following local extragalactic structures is further strengthened by the consistency at the confidence level (C.L.) between the directions of the UHECR anti-dipole and of the Local Void at equatorial coordinates or Galactic coordinates (Biteau, 2021). Combined with the growth of the dipole amplitude with energy expected from the shrinking horizon out to which extragalactic sources remain visible (Pierre Auger Collaboration, 2018a), the properties of the large-scale anisotropy discovered by the Pierre Auger Collaboration provide a growing body of evidence against a Galactic origin of these cosmic rays. Which (classes of) extragalactic sources host UHECR accelerators nonetheless remains an open question.
In this article, we update previous searches for anisotropies at the highest energies (Pierre Auger Collaboration, 2015a, 2018b) with an unprecedentedly large data set. In particular, we exploit the entire Phase 1 of the Pierre Auger Observatory, i.e. the phase preceding the AugerPrime upgrade (Pierre Auger Collaboration, 2016a). Important progress has been made on estimating the mass distribution of UHECRs using only the surface detector of the Observatory with its full duty cycle (see e.g. Pierre Auger Collaboration, 2016b, 2017b; Ave et al., 2017; Pierre Auger Collaboration, 2021a, b). However, the proposed methods are still not ready to be employed in arrival-direction studies, e.g. by selecting only the candidate light nuclei which would be less deflected by magnetic fields, should such a subsample exist in the data set. In the following, we then consider, as in previous works, only the energy and arrival direction of each event recorded with the Pierre Auger Observatory over 17 years of operation.
The data set includes more than 2,600 events with energies and zenith angles up to , as described in Section 2. The release of this data set complements the publication of the arrival directions of events at energies between 4 and 8 EeV and above 8 EeV made available in Pierre Auger Collaboration (2017a).111https://www.auger.org/document-centre-public/download/78-data/4642-arrival-directions-8eev-science-2017 The choice of an energy threshold at 32 EeV for the present release anticipates upcoming publications focused on lower energy bins, namely EeV and EeV, as investigated e.g. in Pierre Auger Collaboration (2018a) and Pierre Auger Collaboration (2020a) where and events were studied above 32 EeV, respectively. In Section 3, we describe a first set of analyses that are not based on specific source models, i.e. a blind search for excesses in the sky, an autocorrelation study and the search for correlations with the Galactic and supergalactic planes as well as the Galactic center. Section 4 is devoted to the comparison of UHECR arrival directions with the expected flux pattern from specific classes of galaxies traced by their electromagnetic emission, from radio wavelengths to gamma rays. Finally, Section 5 is devoted to a more in-depth study of the Centaurus region, which has intrigued the UHECR community since the early days of the Pierre Auger Observatory (Pierre Auger Collaboration, 2007).
2 The data set
The Pierre Auger Observatory (Pierre Auger Collaboration, 2015b) is located in Argentina near the town of Malargüe. Stable data acquisition began on 1 January 2004. The Observatory is composed of a surface detector (SD) made of 1,660 water-Cherenkov stations distributed on a triangular grid overlooked with a fluorescence detector (FD). The FD consists of 27 telescopes at four locations on the perimeter of the SD array.
Here, we analyse the events with reconstructed energies larger than EeV recorded with the SD array from 1 January 2004 to 31 December 2020. The SD is used to sample secondary particles in air showers and has full efficiency above 4 EeV with duty cycle.
Events recorded with SD are reconstructed differently based on their arrival direction in local coordinates: events with zenith angles, , less than are called vertical events, while events arriving with zenith angles from to are called inclined events. Vertical events are included when the SD station with the largest signal is surrounded by at least four active stations. This a priori condition is complemented by the a posteriori requirement that the reconstructed core of the shower falls within an elementary isosceles triangle of active stations. These requirements ensure that the footprint of the shower is well-contained within the array, with ample data for an accurate reconstruction (Pierre Auger Collaboration, 2010a). Inclined events, on the other hand, are selected if the station closest to the reconstructed core position is surrounded by at least five active stations. Note that other analyses performed by the Pierre Auger Collaboration at lower energies may use a tighter selection. For example, the UHECR spectrum in Pierre Auger Collaboration (2020b) is measured by requiring that all six active stations around the one with the highest signal are active. We are able to use a relaxed selection as the high-energy events included here all have large footprints, with an average of 17.7 triggered stations. We inspected each event and verified that the reconstruction was robust even with inactive stations in the core region. With respect to previous analyses, the identification of active stations that were not triggered has been improved to ensure a better selection. This was done through an a posteriori check of the consistency of the signal distribution at ground: if a station is not triggered in a region of the array where the signal is more than twice that of the full trigger efficiency, which occurs for 11 events in the data set, the station is classified as non-active at the moment of the event (Pierre Auger Collaboration, 2010a).
The selection results in 2,040 events with and 595 with above .222To avoid border effects at the zenith angle separating the inclined and vertical selections, we identified events in the region that are well-reconstructed with the vertical procedure but not included in the inclined data set and, vice-versa, events in the region that are well-reconstructed with the inclined procedure but not included in the vertical data set. We found one event in the former case and none in the latter. The exposure can be computed in a geometrical way since we are operating above the energy threshold for full efficiency for both data samples (EeV for vertical and EeV for inclined). The geometrical exposure for the selection and time span considered is for the vertical sample and for the inclined data set.
The reconstruction procedure for vertical events is described in detail in Pierre Auger Collaboration (2020c). The arrival direction is determined by fitting a spherical model to the arrival times of particles comprising the shower front. For inclined events, the reconstruction procedure is described in Pierre Auger Collaboration (2014). The arrival direction is, in this case, obtained by fitting the arrival times with a front which takes into account the muon propagation from its production point. For both data sets, the angular resolution, defined as the 68% containment radius, is better than at all energies considered here.
The energy estimate is based on different observables for the two samples. The signal at a reference distance of m from the shower core, , is used for the vertical sample. The inclined reconstruction uses as estimator , which represents the muon content of the shower with respect to a reference simulated proton shower with energy eV. For both samples, a correction is applied to take into account the absorption that showers undergo at different zenith angles. This correction is performed through a data-driven procedure called constant intensity cut, which is described in Pierre Auger Collaboration (2020b). The constant-intensity-cut method is used to convert and for each shower to the value they would have if the same shower had arrived from a reference zenith angle of and for vertical and inclined events, respectively. The corrected energy estimators, and , are then calibrated using hybrid events, i.e. events observed with both the FD and the SD. Since the FD analysis enables a quasi-calorimetric measurement of the shower energy, the calibration procedure results in a reliable energy estimation for the whole SD data set without using air-shower simulations. The systematic uncertainty in the energy calibration is while the energy resolution for the SD at the energies considered here is (Pierre Auger Collaboration, 2014; Pierre Auger Collaboration, 2020d).
We checked the consistency between the vertical and inclined data sets by comparing the ratio of number of events in the two samples, , and the value expected from the ratio of geometrical exposures, accounting for the finite energy resolution of each data stream, . In the latter ratio, is the geometrical exposure for each data set, which does not depend on energy, and accounts for the net spillover of events from low to higher energies (see the unfolding procedure described in Pierre Auger Collaboration, 2020b). The ratios are in agreement at the C.L., showing that the vertical and inclined samples can be used together. To keep the analysis as data-driven as possible, we use the ratio of events observed above as the expected exposure ratio when constructing simulated data sets above any energy threshold. It should be noted that at the highest energies probed here, , a deficit of inclined events is observed at a significance level of . A further discussion of this deficit, which does not affect the results presented below, is provided in Appendix A together with the information on how to access the data.
3 Search for overdensities and correlation with structures
An earlier wide-ranging search with the Observatory for small- and intermediate-scale anisotropy was reported in Pierre Auger Collaboration (2015a). Searches for localized excesses in top-hat windows of angular radius across the entire field of view of the Observatory, or around the Galactic center, Centaurus A and candidate host galaxies identified in multi-wavelength surveys, were performed by comparing the expected and observed numbers of events within the window. Similar analyses were performed along the Galactic and supergalactic planes, by counting the number of events within an angle from these structures, and an autocorrelation study exploited the number of pairs of events separated by less than . The analyses were repeated above energy thresholds ranging from 40 to . An additional scan on the maximum distance of the sources was performed for analyses against catalogs of candidate host galaxies. Both scans in energy threshold and maximum distance were motivated by the limited horizon from which UHECR can reach Earth, although the determination of its observational value remains hindered by uncertainties on UHECR composition.
In this Section, we update the results presented in Pierre Auger Collaboration (2015a), with the exception of the search for correlation with catalogs, which is performed in Section 4.
3.1 Search for localized excesses
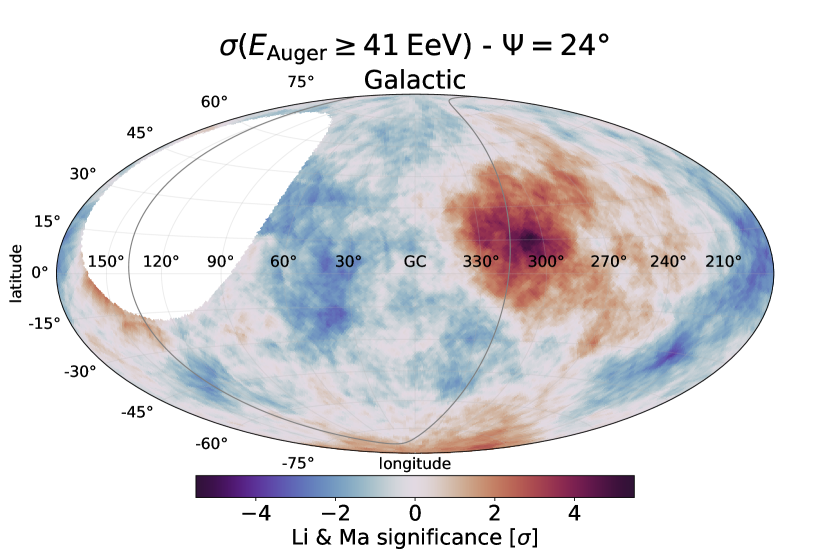
The first analysis is a blind search for excesses over the fraction of the sky covered with the Observatory. The number of UHECRs detected in circular windows on the sky () is compared to that expected, in the same window, from an isotropic distribution of events (). This search is performed over the entire field of view, which covers about 85% of the sky. The search windows are centered on a HEALPix grid (HEALPix v3.70, Górski et al., 2005), defined by the parameter , which sets the size of the pixels to be of the order of the angular resolution of the Observatory. Events are counted within search windows of radius , ranging from to in steps. Similarly, the search is performed by selecting events above energy thresholds, , ranging from EeV to EeV in EeV steps. For each window and energy threshold, we estimate the binomial probability of obtaining by chance or more events from an isotropic distribution of data. The computation of is performed by simulating events with coordinates distributed according to the sum of the vertical and inclined exposures, weighted in proportion to the observed number of events at energies above 32 EeV (see Section 2). For each realization of the simulated data set, the number of events is of the same size as observed across the field of view. Simulated events follow the same energy distribution as the observed events. Performing the analysis on simulated isotropic data sets allows us to take into account the trial factors for having tested different directions, radii and energy thresholds. We consider as post-trial probability the fraction of these simulations with an equal or lower local p-value than the best one obtained with the observed data set.
We also compute the local Li-Ma significance (equation (17) in Li & Ma, 1983) for each point in the sky, where the ON-region is centered on each point of the HEALPix grid and the OFF-region is defined as the remainder of the field of view. The local significance map is displayed in Galactic coordinates in Figure 1. The most significant excess, with local significance, is found above an energy threshold of EeV within a top-hat window of radius centered on equatorial coordinates , which corresponds to Galactic coordinates . At this position of the parameter space, 153 events are observed when 97.7 are expected from isotropy. The local -value in this position is , resulting in a post-trial -value of 3%.
3.2 Autocorrelation
Another model-independent approach to assess the clustering of events is the search for autocorrelation, i.e. counting pairs of events separated by a given angular distance. This approach is particularly effective if the events form multiple clusters on similar angular scales in different directions in the sky.
Following Pierre Auger Collaboration (2015a), we count the number of event pairs, , above energy thresholds ranging from 32 to EeV, that are separated by less than an angle ranging from to in steps of up to and of above. We compute the expected number of pairs, , by analysing simulated isotropic event sets of the same size as the observed data set. For each and , we consider as local -value the fraction of simulated data sets, , for which . The values of are shown in Figure 2(a) and the best results are shown in Table 1.
3.3 Correlation with structures
The most constrained analysis performed in this Section is a search for correlation with local astrophysical structures. Although a Galactic origin of UHECRs at energies above 8 EeV is disfavored by the large-scale anisotropy discovered by the Collaboration, we test as targets the Galactic plane and the Galactic center in addition to the supergalactic plane, for consistency with Pierre Auger Collaboration (2015a). The search is performed in a similar way as the study described in Section 3.2, with being the number of events observed within an angle from the chosen structure. In practice, for the Galactic and supergalactic planes, we count events with an absolute value of latitude smaller than in the respective coordinate system.
The results are shown in Figure 2 and in Table 1. The lowest -values are found for above energy thresholds near and EeV. No significant departure from isotropy is observed in these searches, as in Pierre Auger Collaboration (2015a).
| Search | [EeV] | Angle, [deg] | Local -value, | Post-trial -value | ||
|---|---|---|---|---|---|---|
| Autocorrelation | 62 | 3.75 | 0.24 | |||
| Supergalactic plane | 44 | 20 | 0.13 | |||
| Galactic plane | 58 | 20 | 0.44 | |||
| Galactic center | 63 | 18 | 0.57 |
Note. — The energy threshold, , and the search angle, , which minimize the local -value, based on the number of observed and expected events / pairs. The post-trial -value accounts for the scan in energy threshold and search angle, .
4 Likelihood analysis with catalogs of candidate host galaxies
In Pierre Auger Collaboration (2015a), we presented the results of cross-correlation studies with three flux-limited catalogs: the 2MASS Redshift Survey of near-infrared galaxies (Huchra et al., 2012), the Swift-BAT 70-month catalog of active galactic nuclei (AGNs) observed in hard X-rays (Baumgartner et al., 2013) and a catalog of radio-emitting galaxies from van Velzen et al. (2012). Such cross-correlation analyses inherently assume all galaxies under investigation to have an equal weight (standard-candle approach) and do not easily account for the inverse-square law of the UHECR flux, nor for its attenuation resulting from energy losses induced by propagation. These limitations were addressed in Pierre Auger Collaboration (2018b) through a likelihood-ratio test that expanded upon the maximum-likelihood test presented in Pierre Auger Collaboration (2010b). We also tested two additional catalogs based on gamma-ray observations from Fermi-LAT. The full-sky gamma-ray survey of Fermi-LAT has shown starforming galaxies and jetted AGN to be the main contributors to the extragalactic gamma-ray background at GeV energies, although their relative contributions remains uncertain (see e.g. Ajello et al., 2015; Roth et al., 2021).
4.1 From catalogs to UHECR sky models
We first explore correlations with the large-scale distribution of matter using the Two Micron All-Sky Survey (2MASS, Skrutskie et al., 2006). The expected UHECR flux in this scenario is traced by K-band observations at 2.16 µm, i.e. we assume an UHECR luminosity proportional to stellar mass. We limit the study to galaxies up to a K-band magnitude of 11.75 mag, which corresponds to the flux limit over more than 90% of the 2MASS Redshift Survey. We verified through the HyperLEDA333http://leda.univ-lyon1.fr/ database (Makarov et al., 2014) that all the selected objects are galaxies and we kept in the sample AGN hosts, noting though that their near-infrared emission may be contaminated by non-thermal emission.
A second sample consists of galaxies with a high star-formation rate, broadly denoted here as starburst galaxies. Lunardini et al. (2019) selected local galaxies with a far-infrared flux at 60 µm larger than 60 Jy from the IRAS all-sky survey (Sanders et al., 2003) and with a radio flux at 1.4 GHz larger than 20 mJy from the NVSS (Condon et al., 1998) and Parkes surveys (Calabretta et al., 2014) in the Northern and Southern hemispheres, respectively. The authors also imposed a far-infrared to radio flux ratio larger than 30, which removes galaxies dominated by jetted AGN emission. We further select galaxies with a far-infrared to radio flux ratio smaller than 1000, which excludes dwarf galaxies with negligible radio emission. The latter criterion removes the Large and Small Magellanic Clouds from the sample of starburst galaxies in Lunardini et al. (2019), as these are clear outliers of the flux-ratio distribution. Although the IRAS survey can safely be considered as flux limited over the entire sky for fluxes larger than 60 Jy, the subtraction of the Galactic foreground is more demanding in studies of extended radio sources down to 20 mJy. Following their reanalysis of the Southern radio sky, Lunardini et al. (2019) excluded areas close the Galactic plane, which contain in particular the bright Circinus galaxy at latitude . The latter galaxy satisfies the above-mentioned selection criteria and we add it to the sample using its radio flux tabulated in the Parkes catalog (Wright & Otrupcek, 1996). The radio flux of galaxies in the sample is used as a tracer for UHECR emission, effectively assuming an UHECR luminosity proportional to starforming activity.
The third sample encompasses AGNs observed in hard X-rays with Swift-BAT, as tabulated in their 105-month catalog (Oh et al., 2018). We select hard X-ray sources with a keV flux larger than erg cm-2 s-1, which corresponds to the Swift-BAT flux limit over more than 90% of the sky. We retain objects labeled as jetted AGN, Seyfert galaxies, or other AGNs with or without jets. We adopt with this catalog the hard X-ray flux as a tracer for the UHECR flux, effectively assuming that the UHECR luminosity is driven by accretion onto super-massive black holes. We note though that the X-ray flux of the sub-sample of radio-loud AGN, in particular that of blazars, is expected to be dominated by jet emission.
Finally, the fourth sample comprises -ray selected AGN from the Fermi-LAT 3FHL catalog (Fermi-LAT Collaboration, 2017). We select radio galaxies and blazars with an integral flux between 10 GeV and 1 TeV larger than cm-2 s-1. Above this value, the 3FHL catalog is flux-limited over 90% of the sky (97% for Galactic latitudes ).444Estimated from the data in Figure 6 of Fermi-LAT Collaboration (2017), where the flux limit is provided for a source of photon index detected with a test statistic . Data in the figure courtesy of the Fermi-LAT Collaboration. The -ray flux is used as UHECR proxy, effectively assuming an UHECR luminosity proportional to the inner jet activity.
The bands adopted to trace UHECR emission are affected by little absorption in the host galaxy and along the line of sight but UHECRs suffer increasing energy losses and photo-dissociation with increasing travel time. Robust estimates of the luminosity distances of host galaxies are needed to account for the attenuation of their relative UHECR flux above a given energy threshold. Putative sources within a few tens of Mpc may in particular have a substantial impact on UHECR anisotropies while their host galaxies are not in the Hubble flow, which would make their spectroscopic redshift a biased distance estimate. We cross-matched all four catalogs with the HyperLEDA database and adopted the best distance estimate (modbest field) and associated uncertainty, which account for peculiar motion and exploit cosmic-distance-ladder estimates whenever available. Galaxies within 250 Mpc are retained in the sample and we exclude those located in the Local Group through a cut at 1 Mpc. Nearby galaxies would otherwise dominate sky models aimed at tracing UHECR emission on larger scales. A smaller horizon at 130 Mpc is considered for starburst galaxies, following the selection of Lunardini et al. (2019). We note that few (if any) starforming galaxies within Mpc are expected to pass the radio and far-infrared flux selection. All 26 jetted AGNs and 44 starburst galaxies in our sample are included in HyperLEDA. The apparent total K-band magnitude available in HyperLEDA (Kt field) enables a straightforward selection of 44,113 2MASS galaxies. We identified 23 Swift-BAT AGN, among 523 host galaxies, without a tabulated HyperLEDA distance that nonetheless show compatible redshift estimates () in NED555doi: 10.26132/NED1 and SIMBAD.666http://simbad.u-strasbg.fr The distances of these 23 galaxies are based on their NED spectroscopic redshifts (corrected for the Local-Group infall to the Virgo cluster), as tabulated in Appendix C.
As in Pierre Auger Collaboration (2018b), the UHECR flux expected from each host galaxy is increasingly attenuated with increasing luminosity distance, , following the best-fit model of the spectrum and composition data acquired at the Pierre Auger Observatory (Pierre Auger Collaboration, 2017c, first minimum obtained with the EPOS-LHC hadronic interaction model). The attenuation weights, , are marginalized over distance uncertainty for the three catalogs with less than 1,000 galaxies, with little impact on the final sky models. For the sake of computational intensity, no marginalization over distance uncertainty is performed for the fourth sample, made of more than 44,000 near-infrared galaxies, with negligible impact on the final results.
All four sky models represent significant improvements with respect to those studied in Pierre Auger Collaboration (2018b) from an astronomical point of view. From a quantitative perspective, the improvement in sky coverage and depth of the surveys yield an increase in jetted AGN from 17 to 26 objects, in starburst galaxies from 23 to 44, in all AGNs from 330 to 523 and in near-infrared galaxies from 41,129 to 44,113. The estimation of distance uncertainties also provides a qualitative improvement with respect to the study presented in Pierre Auger Collaboration (2018b). It should be noted though that the results are barely affected by such improvements (see Section 4.3), suggesting that our previous analysis already accounted for sufficiently complete surveys from an astroparticle point of view.
We further evaluated in Pierre Auger Collaboration (2015a) possible correlations with the catalog of van Velzen et al. (2012). The latter compiles observations at 1.4 GHz and 843 MHz of extended radio sources down to a flux limit corresponding to the flux of Centaurus A placed at 200 Mpc. Accounting for attenuation, the resulting sky model is entirely dominated by the nearby Centaurus A (distance of Mpc) and can thus be considered as redundant with the flux pattern obtained with the Swift-BAT model (see Appendix C). We thus limit the present study to the four sky models obtained from near-infrared emission of galaxies (2MASS), radio emission from starburst galaxies, X-rays from AGNs (Swift-BAT) and -rays from jetted AGNs (Fermi-LAT).
4.2 Likelihood-ratio analysis
As in Pierre Auger Collaboration (2018b), the correlation of UHECR arrival directions with the flux pattern expected from the catalogs is evaluated against isotropy using a likelihood-ratio analysis. The model as a function of direction is computed in equal-area bins on the sphere using HEALPix v3.70 with the parameter nSide = 64, as in Section 3.1.
The null hypothesis under investigation, , is that of an isotropic flux distribution. Accounting for the directional exposure of the array, , the isotropic model for the UHECR count density reads
| (1) |
which is normalized so that the sum over the HEALPix pixels indexed over and of direction is equal to one.
The alternative hypothesis, , in which is nested, is considered as the sum of an isotropic component and a component derived from the tested catalog. The amplitude of the latter component is a variable signal fraction, . The isotropic remainder accounts for faint or distant galaxies not included in the catalogs or for a heavy nuclear component deflected away on large angular scales. The model for the UHECR count density under reads
| (2) |
where the index runs over the galaxies in the catalog. The contribution to the UHECR flux from each galaxy, , is modeled as a von Mises-Fisher distribution centered on the direction of the galaxy with a smearing angle . The amplitude of its contribution is proportional to the electromagnetic flux of the galaxy, , accounting for attenuation as a function of luminosity distance, , so that
| (3) |
The von Mises-Fisher distribution is maximum in the direction of the galaxy of interest, , effectively leaving aside coherent deflections which remain under-constrained by current models of the Galactic magnetic fields (Erdmann et al., 2016). The smearing angle , equivalent to the 2D Gaussian extent in the small-angle limit, is assumed to be the same for all galaxies in a given catalog. This parameter accounts for the average angular dispersion in intervening magnetic fields. As a note, the normalization of the von Mises-Fisher distribution in equation (3) is omitted, as it is the same for every galaxy and as the overall anisotropic component is normalized on the sphere (see equation (2)).
The likelihood-ratio test between the nested models and defines the test statistic, , where the likelihood scores of the null and alternative hypothesis, and , are obtained as the product over the events of the models and , respectively. The evaluation of the test statistic is performed by grouping events by HEALPix bin. With an observed event count in the direction , the test statistic is evaluated as
| (4) |
The test statistic is maximized as a function of the two free parameters in the analysis (the search radius, , and the signal fraction, ) above successive energy thresholds. The maximization can be achieved by scanning the 2D parameter space by steps of 0.2% in signal fraction and in search radius. This approach provides an accurate estimate that is independent from any specific maximization algorithm. Alternatively, a maximization with the Minuit package provides a fast estimate for simulated data sets, with an accuracy on TS better than 0.1 units for event counts larger than 100. Above a fixed energy threshold, the test statistic is observed through Monte Carlo simulations to follow a distribution with two degrees of freedom under the null hypothesis (Wilks, 1938). The 1 and C.L. on the best-fit parameters are set by iso-TS contours differing from the maximum TS value by 2.3 and 6.2 units, respectively.
The scan in energy threshold is accounted for, as in Section 3, by estimating the post-trial -value through isotropic Monte Carlo simulations. The post-trial -value, which accounts for the energy scan, differs from the local -value expected from Wilks’ theorem by a penalty factor that is well-approximated by a linear function of TS: . This empirical penalty factor is estimated from simulated isotropic data sets analyzed against each catalog and the uncertainty on the linear coefficient is estimated from the variance across the four tested catalogs. The penalty factor reaches a value of for .
4.3 Results
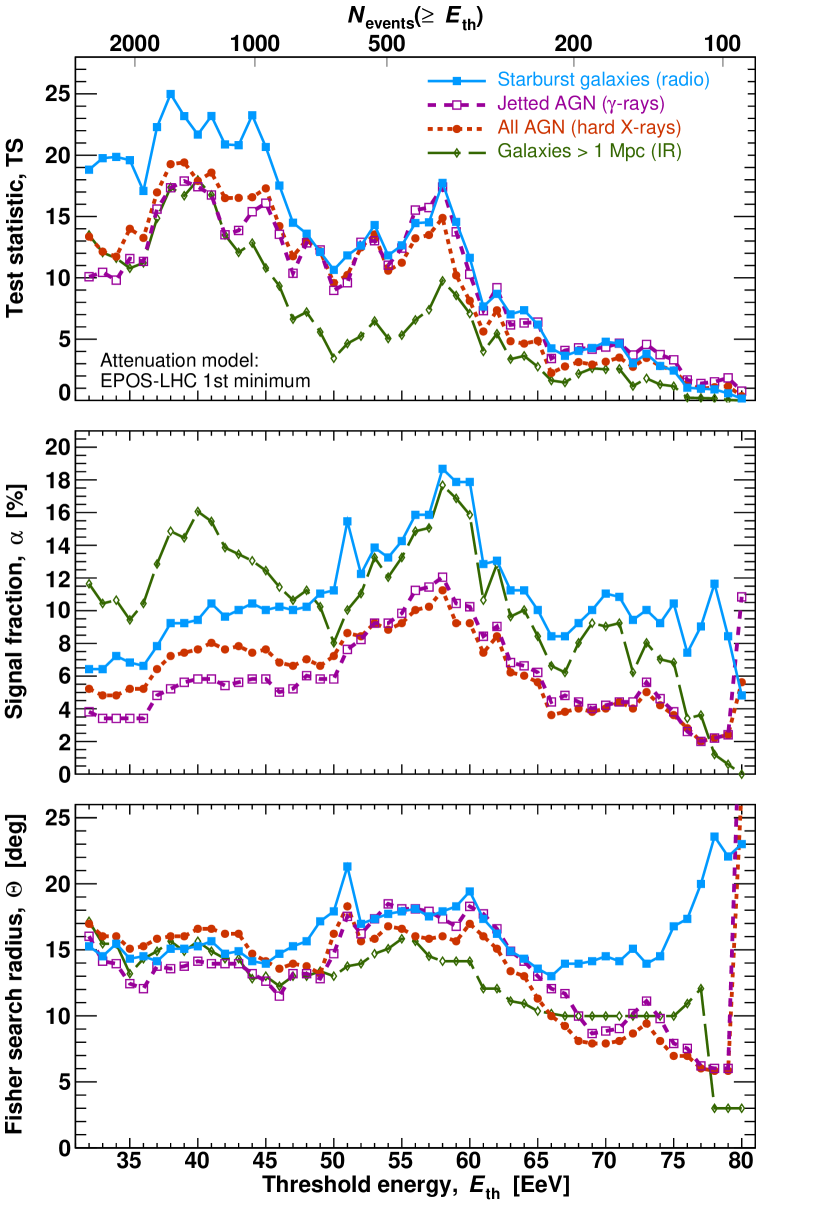
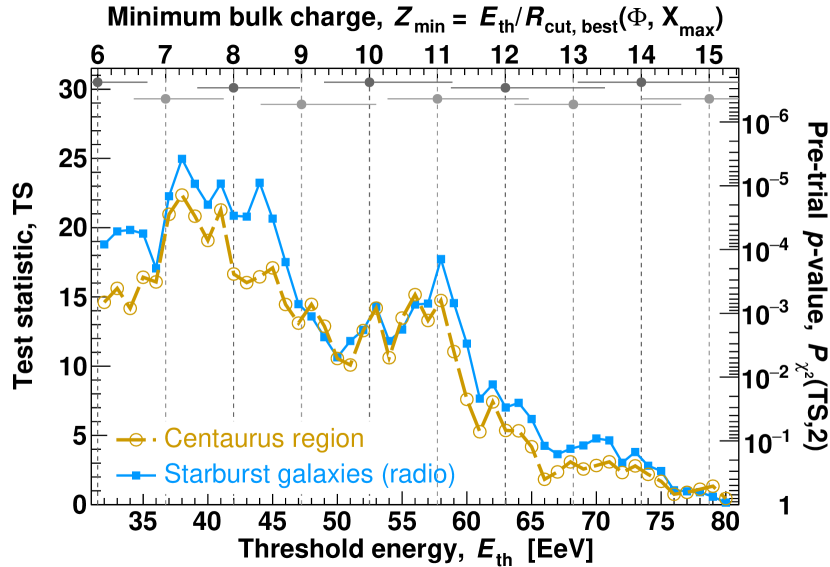
The search radius and signal fraction maximizing the test statistic above fixed energy thresholds ranging in 32–80 EeV are displayed in Figure 3 for the four catalogs. The test statistic follows a double hump structure as a function of energy, with a first peak at energies above EeV and a second peak at energies above EeV. The latter peak corresponds to the maximum signal fraction for all catalogs, ranging in 11–19%. Lower signal fractions ranging in 6–16% are inferred from the global TS maximum, at energies above EeV. As shown in the upper axis in Figure 3, the four times larger number of events in the first peak (1,387 above 40 EeV vs 331 above 60 EeV) yields a more significant deviation from isotropy above .
The amplitude of variations of the best-fit parameters as function of energy threshold can be evaluated against the statistical uncertainties on these parameters, as shown in Figure 4. As the search is performed above successive energy thresholds by steps of 1 EeV, successive energy bins have a non-negligible overlap. For reference, we estimate that there is a total of five to six independent energy bins, by identifying the successive reference energy thresholds above which the number of events is less that half that above a previous reference energy. Such a procedure suggests reference energy thresholds at EeV, with boundaries distant by more than , that corresponds to the energy resolution of relevant in the range covered here (Pierre Auger Collaboration, 2020b). As illustrated by the set of Figures above energy thresholds ranging in 32–80 EeV (see online material attached to Figure 4), the reconstructed parameters do not show significant variations with energy.
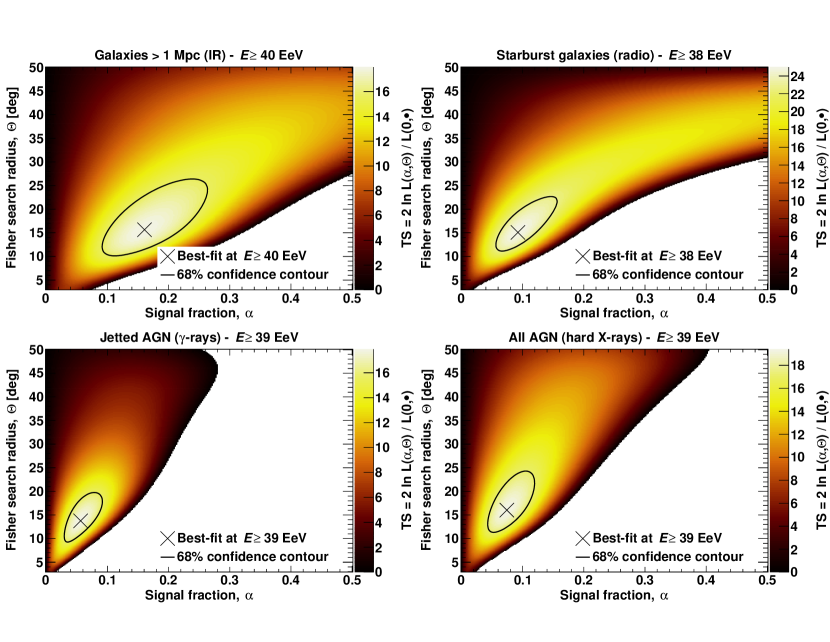
For the sake of completeness, we provide the best-fit parameters and maximum test statistic obtained above energy thresholds corresponding to the global maximum at EeV, in the upper part of Table 2, as well as those obtained above the secondary maximum identified at EeV, in the lower part of the same table. The most significant departure from isotropy is identified for all four catalogs at energy thresholds in the range 38–40 EeV, with post-trial -values of , , and for jetted AGNs traced by their -ray emission, galaxies traced by their near-infrared emission, all AGNs traced by their X-ray emission and starburst galaxies traced by their radio emission, respectively. As in Pierre Auger Collaboration (2018b), we do not penalize for the test of the four catalogs, which all provide similar UHECR flux patterns. As a note, the infrared sample of galaxies contains a large fraction (more than 75%) of each of the three other catalogs and only jetted AGN and starburst catalogs can be considered as strictly distinct galaxy samples.
| Catalog | [EeV] | Fisher search radius, [deg] | Signal fraction, [%] | TSmax | Post-trial -value |
|---|---|---|---|---|---|
| All galaxies (IR) | 40 | 18.0 | |||
| Starbursts (radio) | 38 | 25.0 | |||
| All AGNs (X-rays) | 39 | 19.4 | |||
| Jetted AGNs (-rays) | 39 | 17.9 | |||
| All galaxies (IR) | 58 | 9.8 | |||
| Starbursts (radio) | 58 | 17.7 | |||
| All AGNs (X-rays) | 58 | 14.9 | |||
| Jetted AGNs (-rays) | 58 | 17.4 |
Note. — The energy threshold, , Fisher search radius, , and signal fraction, , which maximize the test statistic, TSmax, for each of the catalogs. The post-trial -value accounts for the energy scan and search over and .
As discussed in Sec. 4.1, all four sky models tested here are based on improved versions of the catalogs used in Pierre Auger Collaboration (2018b), although with a mild impact on the significance of the results and no noticeable change in the best-fit parameters. The maximum test statistic is obtained at the same point of the parameter space using the catalogs of infrared galaxies, starburst galaxies, and X-ray AGNs from Pierre Auger Collaboration (2018b), with TS values of 16.0, 23.1 and 18.0, respectively, differing by less than 2 units from the results in Table 2. The most important change is observed for the gamma-ray catalog of jetted AGNs: the maximum TS (13.5) is obtained above EeV with the earlier catalog version based on the 2FHL catalog (GeV), while it is obtained above EeV with the current version based on the 3FHL catalog (GeV). The change can be understood from the lower energy threshold of the 3FHL catalog, which reduces the relative flux of blazars beyond 100 Mpc (Mkn 421, Mkn 501) with respect to the flux of local radio galaxies (Cen A, NGC 1275, M 87).
5 The Centaurus Region
A visual inspection of the sky models displayed in Appendix C highlights the main similarity between the four catalogs, namely a hotspot expected in the Auger field of view in the direction of the group of galaxies composed of the radio galaxy Centaurus A, the Seyfert galaxy NGC 4945 and the starburst galaxy M 83. These three galaxies, at distances of about 4 Mpc, constitute one of the pillars of the so-called Council of Giants (McCall, 2014) surrounding the Milky Way and Andromeda galaxy. Inspection of the two AGN models, tracing accretion through X-ray emission and jet activity through -ray emission, does not suggest bright secondary hotspots in other sky regions at the highest energies (EeV), as the attenuation of the UHECR flux dramatically reduces the contribution from more distant galaxies. On the other hand, both the infrared model of stellar mass and the radio model of enhanced starforming activity suggest hotspots in the directions of other members of the Council of Giants: the starburst galaxies NGC 253 and M 82, which are the only two starburst galaxies currently detected at TeV energies.777http://tevcat2.uchicago.edu/ While M 82 lies in the blind region of the Pierre Auger Observatory, which can only be observed with Telescope Array (Telescope Array Collaboration, 2018), the contribution from NGC 253 is responsible for the larger departure from isotropy obtained with the starburst model with respect e.g. to the X-ray AGN model (see Appendix C). The infrared model instead yields a smaller test statistic than both the X-ray AGN and starburst models. Within the infrared model, the region of the Virgo cluster (at Mpc) would be brighter than the Centaurus region, which is in tension with the UHECR observations. Following the same procedure as in Pierre Auger Collaboration (2018b), we performed a quantitative comparison between the four models to determine whether one of them is favored by the data against the others. The infrared, X-ray and -ray models fit the data at EeV worse than the starburst model with C.L. . No firm evidence for a catalog preference is identified.
The deviation from isotropy suggested with all four galaxy catalogs is driven by a hotspot in the Centaurus region. This region shows an enhanced flux in all four sky models, arising mainly from Centaurus A for the two AGN models, NGC 4945 for the starburst model and from both galaxies in the infrared model. The peak direction of the UHECR hotspot, as identified through the blind search described in Section 3.1, points away from the main contributor to the starburst model, NGC 4945, and away from the main contributor to the AGN models, Centaurus A.
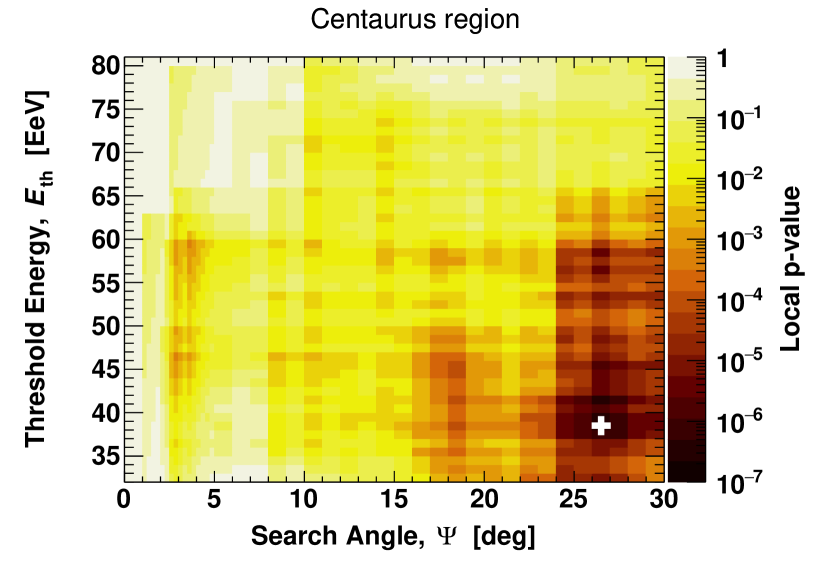
Centaurus A, being the closest radio galaxy at Mpc, has been the target of searches for UHECR excess by the Pierre Auger Collaboration for more than a decade (Pierre Auger Collaboration, 2007). We update such searches by performing the same analysis described in Section 3.3 using as target the position of Centaurus A, (. The map of the local -values as a function of energy threshold and top-hat search angle is shown in Figure 5. The most significant excess is found at EeV in a circle of top-hat radius , where the number of observed events is while events would be expected from isotropy. The minimum local -value, which is estimated as in Section 3 from the binomial probability to observe or more events from an isotropic distribution, is . After penalization for the scan in energy and search angle, the post-trial -value is , similar to that obtained with the likelihood-ratio test for starburst galaxies against isotropy.
The best-fit parameters of the search in the direction of Centaurus A are unsurprisingly similar to those of the blind search. The lower post-trial -value with respect to the blind search results from the direction being fixed a priori, as suggested by the early-day searches from the Pierre Auger Collaboration (Pierre Auger Collaboration, 2007; Pierre Auger Collaboration, 2010b). The top-hat angular scale inferred from the blind search and from the search at the position of Centaurus A, , can be compared to the Fisher search radius inferred from the catalog-based searches through the relation .888For a Fisher radius rad, this relation provides the top-hat radius that maximizes the signal-to-noise ratio, where the noise is and the signal is , with the concentration parameter . The catalog-based searches yield that corresponds to , i.e. a range of values that is consistent with those inferred from the other searches.
Both the catalog-based searches and search in the Centaurus region point to a most significant signal at an energy threshold close to 40 EeV. This energy range encompasses the flux suppression of the energy spectrum above the toe, at EeV (Pierre Auger Collaboration, 2020b). The evolution of the signal with energy displayed in Figure 3 appears to be mainly driven by the event distribution in the Centaurus region, as illustrated in Figure 6. The pre-trial -value in the Centaurus region is obtained by profiling the local -value against the search radius and penalizing for this free parameter. The profile as a function of energy threshold is compared to the test statistic of the starburst catalog. The latter is chosen as example, noting that the results obtained with other catalogs show a similar dependence on energy threshold (see Figure 3).
Constraints from maximum shower-depths up to a few tens of EeV and from the broad-band spectrum above the ankle energy suggest that UHECRs are accelerated in proportion to their charge, following so-called Peters’ cycles (Pierre Auger Collaboration, 2017c, 2020d). The cosmic-ray composition above the toe in the energy spectrum is then expected to be dominated by UHECRs near a maximum magnetic rigidity, . Accounting for both systematic uncertainties on the energy and maximum shower-depth scales, we inferred in Pierre Auger Collaboration (2017c) a maximum rigidity with our reference model. Adopting this value as the typical rigidity of UHECRs above the toe, a lower bound on the charge of the bulk of UHECRs above a given energy threshold can be estimated as , as figured in the top axis of Figure 6. The uncertainties on the points illustrate those on the maximum rigidity in the reference scenario. It should be noted that the composition at the highest energies remains poorly constrained with Phase 1 data and can only be conjectured from a model-dependent approach at this stage.
At rigidities close to EV, i.e. , UHECR propagation in the magnetic field of the Milky Way enters into a semi-ballistic regime (Erdmann et al., 2016). Excesses identified in the UHECR sky could thus be used both to track back putative sources and possibly to constrain the configuration and strength of the Galactic magnetic field (see Boulanger et al., 2018, and references therein). The angular scale inferred from the catalog-based search, as well as that from the blind search and search in the Centaurus region, are consistent with the average angular dispersion expected in the Milky Way of the Auger mix of nuclear species (Pierre Auger Collaboration, 2018b). Nonetheless, the lack of a significant preference for a specific class of galaxies and the strength of the anisotropy signal, reaching at best post-trial -values of , still limit the identification of the host galaxies of UHECR accelerators and UHECR constraints on the Galactic magnetic field.
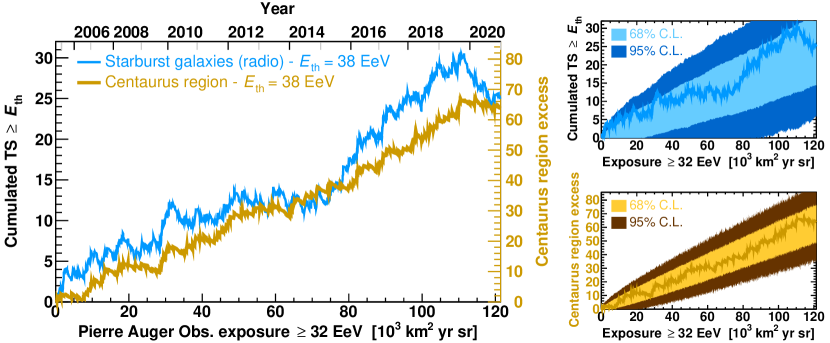
Although only pieces of evidence for anisotropy on intermediate angular scale can be claimed with the Phase 1 high-energy data set, the continued operation of the array may enable the reach of the discovery threshold. The latter corresponds to a post-trial -value of or considering a search for both excesses and deficits (2-sided test) or just for excesses (1-sided test). The growth of the signal in the Centaurus region, quantified by the excess of events with respect to the isotropic expectation, and the growth of the test statistic of starburst model are displayed as a function of accumulated exposure in Figure 7. These analyses yield post-trial significances of 3.9–4.2 for a 1- or 2-sided test applied to the Phase 1 high-energy data set. Both the test statistic and the excess of events are expected to grow linearly with exposure and the fluctuations observed around such a linear behavior are consistent with those expected from simulations. The model-independent search in the Centaurus region shows the smallest fluctuations and may be the most robust approach to forecasting the evolution of the signal. Assuming a fixed top-hat angular scale and a continued growth of the excess at a rate of events per 10,000 km2 yr sr, the (1-sided) discovery threshold would be expected for a total accumulated exposure of km2 yr sr (68% C.L.), which would be within reach by the end of 2025 ( calendar years) adopting an approach similar to that developed in the present study.
6 Conclusion
We have presented the measurement and analysis of arrival directions of the highest-energy events detected at the Pierre Auger Observatory during its first phase of operation. With a total of 2,635 UHECR events above 32 EeV and accumulated exposure of 122,000 km2 sr yr, no indication for anisotropies on angular scales ranging from one to thirty degrees emerges from auto-correlation studies or from blind searches over the entire sky. This lack of significant deviation from isotropy can be attributed a posteriori to the small amplitude of the anisotropic signal evidenced here, to the vastness of the parameter space that has been probed, in addition to the limited number of events at the highest energies. More focused searches along the Galactic center and Galactic plane do not reveal any excesses. The flux along these structures and the associated statistical uncertainty are and , respectively. These values can be compared to average flux over the field of view of the Observatory . A study along the supergalactic plane, not distinguishing among the various galaxies forming this structure, similarly yields .
Accounting for the attenuation of the UHECR mix inferred from lower energy observations, the sky viewed from the Pierre Auger Observatory is better modeled with a flux excess in the directions of nearby galaxies observed in the radio, near-infrared, X-ray and gamma-ray bands. A 1-sided test for an excess disfavors isotropy at the level, depending on the catalog. A model-independent analysis of the Centaurus region, which contains the most prominent active and star-forming galaxies expected to contribute at these energies, reveals an excess that is significant at the C.L.
The average flux above 40 EeV in a top-hat region centered on Centaurus A can be estimated to . In comparison, regions centered on the Virgo cluster and on the starburst galaxy NGC 253 show fluxes of and . As illustrated by the model sky maps in Appendix C, the regions of NGC 253 and of the Virgo cluster could be expected to be as bright as and brighter than the Centaurus region if the UHECR emission rate was simply traced by star-formation rate and stellar mass, respectively. At the present stage, although the starburst catalog enables the identification of the most significant deviation from isotropy (4.2 ) and the jetted AGN catalog the least significant deviation (3.3 ), no firm preference for correlation with a specific class of galaxies can be stated. It should further be noted that such a preferred correlation would not necessarily suggest causation in the form of the identification of the origin of UHECRs, as regular and turbulent magnetic fields traversed by these charged particles could alter the anisotropic pattern observed on Earth (e.g. Kotera & Lemoine, 2008; Erdmann et al., 2016; Farrar & Sutherland, 2019; Bell & Matthews, 2022).
Though the most significant deviation from isotropy is found at energies around for almost all the analyses, the excess is also hinted at for all catalogs and the Centaurus region at energies around , as shown in Figure 8 (see online material). Indeed, it was in this higher energy range that the first indication of anisotropy was found in early Auger data (Pierre Auger Collaboration, 2007). An interpretation of the energy evolution of the signal on intermediate angular scales could be drawn in terms of maximum energy achieved for higher-charge nuclei. In a Peters’ cycle scenario such as discussed in Section 5, the evidence for anisotropy above EeV would be interpreted as stemming from CNO nuclei, which would suggest nuclei to be responsible for the departure from isotropy above EeV. The estimate of maximum rigidity used here is based on the combined fit of spectrum and depth of shower maximum performed in Pierre Auger Collaboration (2017c). The direct inclusion in such analyses of arrival-direction information will enable us to test more directly this scenario. If this scenario of local extragalactic sources is extrapolated to lower energies, one could expect a contribution from He nuclei (see e.g. Lemoine & Waxman, 2009) in the energy range where a significant dipole, but no significant quadrupole has been reported using data from the Observatory. The strength of such an anisotropic contribution could nonetheless be further diluted in the contribution from more distant sources. We foresee that an in-depth comparison could be drawn studying the evolution of the large-scale dipolar and quadrupolar components as a function of energy.999We checked that no significant large-scale deviation from isotropy can be inferred from arrival-direction data in the energy range covered here, with constraints on the dipolar and quadrupolar components not in tension with those expected from best-fit catalog-based models (as inferred e.g. for the 2MASS Redshift Survey in di Matteo & Tinyakov, 2018). Alternatively, a more model-dependent but also more-constrained approach could exploit full-sky flux-limited catalogs encompassing galaxies out to the cosmic-ray horizon at the ankle energy.
At this stage, it is not possible to make claims on which are the sources of the highest energy particles known in the Universe. This is in part due to the deflection they suffer in magnetic fields. Identifying the sources of UHECRs indeed runs parallel to deducing properties of Galactic and extragalactic magnetic fields, and constraints on one of these will enhance our understanding of the other. An important step will be taken through the inclusion of composition-sensitive observables in arrival direction studies. This will be done either through searches for anisotropy in the moments of such composition observables or by their use, event by event, to select only candidate light nuclei. Future studies using the Observatory offer the promise to do so by means of the AugerPrime upgrade, currently being completed, which will enhance mass discrimination with the 100% duty cycle of the surface detector.
Acknowledgments
The successful installation, commissioning, and operation of the Pierre Auger Observatory would not have been possible without the strong commitment and effort from the technical and administrative staff in Malargüe. We are very grateful to the following agencies and organizations for financial support:
Argentina – Comisión Nacional de Energía Atómica; Agencia Nacional de Promoción Científica y Tecnológica (ANPCyT); Consejo Nacional de Investigaciones Científicas y Técnicas (CONICET); Gobierno de la Provincia de Mendoza; Municipalidad de Malargüe; NDM Holdings and Valle Las Leñas; in gratitude for their continuing cooperation over land access; Australia – the Australian Research Council; Belgium – Fonds de la Recherche Scientifique (FNRS); Research Foundation Flanders (FWO); Brazil – Conselho Nacional de Desenvolvimento Científico e Tecnológico (CNPq); Financiadora de Estudos e Projetos (FINEP); Fundação de Amparo à Pesquisa do Estado de Rio de Janeiro (FAPERJ); São Paulo Research Foundation (FAPESP) Grants No. 2019/10151-2, No. 2010/07359-6 and No. 1999/05404-3; Ministério da Ciência, Tecnologia, Inovações e Comunicações (MCTIC); Czech Republic – Grant No. MSMT CR LTT18004, LM2015038, LM2018102, CZ.02.1.01/0.0/0.0/16_013/0001402, CZ.02.1.01/0.0/0.0/18_046/0016010 and CZ.02.1.01/0.0/0.0/17_049/0008422; France – Centre de Calcul IN2P3/CNRS; Centre National de la Recherche Scientifique (CNRS); Conseil Régional Ile-de-France; Département Physique Nucléaire et Corpusculaire (PNC-IN2P3/CNRS); Département Sciences de l’Univers (SDU-INSU/CNRS); Institut Lagrange de Paris (ILP) Grant No. LABEX ANR-10-LABX-63 within the Investissements d’Avenir Programme Grant No. ANR-11-IDEX-0004-02; Germany – Bundesministerium für Bildung und Forschung (BMBF); Deutsche Forschungsgemeinschaft (DFG); Finanzministerium Baden-Württemberg; Helmholtz Alliance for Astroparticle Physics (HAP); Helmholtz-Gemeinschaft Deutscher Forschungszentren (HGF); Ministerium für Innovation, Wissenschaft und Forschung des Landes Nordrhein-Westfalen; Ministerium für Wissenschaft, Forschung und Kunst des Landes Baden-Württemberg; Italy – Istituto Nazionale di Fisica Nucleare (INFN); Istituto Nazionale di Astrofisica (INAF); Ministero dell’Istruzione, dell’Universitá e della Ricerca (MIUR); CETEMPS Center of Excellence; Ministero degli Affari Esteri (MAE); México – Consejo Nacional de Ciencia y Tecnología (CONACYT) No. 167733; Universidad Nacional Autónoma de México (UNAM); PAPIIT DGAPA-UNAM; The Netherlands – Ministry of Education, Culture and Science; Netherlands Organisation for Scientific Research (NWO); Dutch national e-infrastructure with the support of SURF Cooperative; Poland – Ministry of Education and Science, grant No. DIR/WK/2018/11; National Science Centre, Grants No. 2016/22/M/ST9/00198, 2016/23/B/ST9/01635, and 2020/39/B/ST9/01398; Portugal – Portuguese national funds and FEDER funds within Programa Operacional Factores de Competitividade through Fundação para a Ciência e a Tecnologia (COMPETE); Romania – Ministry of Research, Innovation and Digitization, CNCS/CCCDI – UEFISCDI, projects PN19150201/16N/2019, PN1906010, TE128 and PED289, within PNCDI III; Slovenia – Slovenian Research Agency, grants P1-0031, P1-0385, I0-0033, N1-0111; Spain – Ministerio de Economía, Industria y Competitividad (FPA2017-85114-P and PID2019-104676GB-C32), Xunta de Galicia (ED431C 2017/07), Junta de Andalucía (SOMM17/6104/UGR, P18-FR-4314) Feder Funds, RENATA Red Nacional Temática de Astropartículas (FPA2015-68783-REDT) and María de Maeztu Unit of Excellence (MDM-2016-0692); USA – Department of Energy, Contracts No. DE-AC02-07CH11359, No. DE-FR02-04ER41300, No. DE-FG02-99ER41107 and No. DE-SC0011689; National Science Foundation, Grant No. 0450696; The Grainger Foundation; Marie Curie-IRSES/EPLANET; European Particle Physics Latin American Network; and UNESCO.
We gratefully acknowledge constructive feedback from the anonymous reviewer as well as exchanges with Alberto Dominguez on the 3FHL catalog and exchanges with Cecilia Lunardini, Kimberly Emig and Rogier Windhorst on their starburst catalog. This research has made use of the SIMBAD database, operated at CDS, Strasbourg, France. This research has made use of the NASA/IPAC Extragalactic Database (NED), which is operated by the Jet Propulsion Laboratory, California Institute of Technology, under contract with the National Aeronautics and Space Administration. We acknowledge the usage of the HyperLeda database (http://leda.univ-lyon1.fr).
Appendix A Data
The data set used here consists of 2,635 events above 32 EeV collected at the Pierre Auger Observatory from 1 January 2004 to 31 December 2020. The data set is formatted as shown in Table 3, which lists the twenty highest energy events. For each event, we report the year in which the event was detected, the Julian day of the year and the time of detection in UTC seconds. The arrival directions are expressed in local coordinates, , the zenith and azimuth angle (measured counterclockwise from the east), respectively, and in equatorial coordinates (J2000), , the right ascension (R.A.) and declination (Dec), respectively. Finally, the reconstructed energy, in EeV, and the integrated exposure accumulated up to the time of detection are reported in the last two columns. The full list of 2,635 events, with the same information as in Table 3, is available at DOI 10.5281/zenodo.6504276 together with the code, the structure of which is described in Appendix B.
The energies and arrival directions of the events may have changed with respect to those already released in previous works, such as Pierre Auger Collaboration (2015a). These changes are due to the refinements in the reconstruction reported in Section 2 and to updates in the energy scale and calibration which were improved over the years. Similarly, a subsample of the vertical events used here is included in the recent Data Release from the Collaboration (Pierre Auger Collaboration, 2021c). The latter were derived with the other reconstruction software used in the Collaboration, which enables independent cross checks and shows good consistency with the reconstruction software used here (Pierre Auger Collaboration, 2020c).
As mentioned in Section 2, the ratio of the number of inclined and vertical events is energy dependent. Anisotropy itself could impact the ratio of inclined and vertical events, as the two exposures differ over the sky. This effect is however small: the excess reported in Section 5 would imply an expected ratio of instead of for an isotropic distribution. Above , a non-significant excess of inclined events is observed with respect to expectations from the exposure ratio and finite energy resolution (). Above , there are 10 events with and 86 with , which corresponds to a ratio of . The deficit of inclined events is most significant above EeV, which results in a post-trial significance (under the assumption of isotropy) at the level of , when penalized for a search as a function of energy. Such a discrepancy or a stronger one would have a 1.3% probability of being found as a statistical fluctuation under the hypothesis that the energy calibrations of both data streams are correct. For completeness, we also consider the hypothesis that the deficit of inclined events at the highest energies is at least partly due to a systematic underestimation of inclined energies (or overestimation of vertical ones), as different reconstruction techniques are used for the two sets. We tested for this effect empirically by selecting the events with zenith angles between that are reconstructed by both the vertical and inclined reconstructions and for which six active stations surround the one closest to the core position. There are 161 such events and a power-law relation of the form was fitted to extract the parameters that would convert the energies obtained from the inclined reconstruction to the energies obtained from the vertical reconstruction. The results are such that would correspond to . We applied the change to the energies of events in the inclined data set and performed, as a cross-check, the likelihood analysis with the starburst catalog (as in Section 4.1) and the Centaurus-region analysis (as in Section 5). In both cases, we found the same results presented with the standard data set. This cross-check demonstrates that the possible systematic uncertainties induced by the difference in energy calibration of the vertical and inclined reconstructions do not affect the results presented in this paper.
| Year | JD | UTC | Zenith angle, | Azimuth angle, | R.A., | Dec, | Cumulative exposure | |
|---|---|---|---|---|---|---|---|---|
| ∘ | ∘ | ∘ | ∘ | |||||
| 2019 | 314 | 1573399408 | 58.6 | 135.6 | 128.9 | 52.0 | 166 | 111,900 |
| 2007 | 13 | 1168768186 | 14.2 | 85.6 | 192.9 | 21.2 | 165 | 9,800 |
| 2020 | 163 | 1591895321 | 18.9 | 47.7 | 107.2 | 47.6 | 155 | 116,800 |
| 2014 | 293 | 1413885674 | 6.8 | 155.4 | 102.9 | 37.8 | 155 | 70,600 |
| 2018 | 224 | 1534096475 | 47.9 | 141.7 | 125.0 | 0.6 | 147 | 101,400 |
| 2008 | 268 | 1222307719 | 49.8 | 140.5 | 287.8 | 1.5 | 140 | 21,300 |
| 2019 | 117 | 1556436334 | 14.8 | 32.7 | 275.0 | 42.1 | 133 | 107,400 |
| 2017 | 361 | 1514425553 | 41.7 | 30.5 | 107.8 | 44.7 | 132 | 96,100 |
| 2014 | 65 | 1394114269 | 58.5 | 47.3 | 340.6 | 12.0 | 131 | 65,300 |
| 2005 | 186 | 1120579594 | 57.3 | 155.7 | 45.8 | 1.7 | 127 | 3,100 |
| 2015 | 236 | 1440460829 | 20.1 | 46.1 | 284.8 | 48.0 | 125 | 77,700 |
| 2008 | 18 | 1200700649 | 50.3 | 178.9 | 352.5 | 20.8 | 124 | 16,100 |
| 2016 | 26 | 1453874568 | 22.6 | 14.7 | 175.6 | 37.7 | 122 | 81,200 |
| 2016 | 21 | 1453381745 | 13.7 | 179.8 | 231.4 | 34.0 | 122 | 81,100 |
| 2011 | 26 | 1296108817 | 24.9 | 90.9 | 150.0 | 10.4 | 116 | 39,300 |
| 2016 | 68 | 1457496302 | 23.7 | 108.7 | 151.5 | 12.6 | 115 | 82,100 |
| 2015 | 268 | 1443266386 | 77.2 | 172.0 | 21.7 | 13.8 | 113 | 78,400 |
| 2016 | 297 | 1477276760 | 49.5 | 104.5 | 352.1 | 13.2 | 111 | 86,800 |
| 2020 | 66 | 1583535647 | 41.4 | 20.6 | 133.6 | 38.3 | 110 | 114,600 |
| 2018 | 174 | 1529810463 | 42.7 | 4.3 | 300.0 | 22.6 | 110 | 100,200 |
Note. — See text for a description of the columns. Events are sorted here by decreasing energy, , and only the 20 highest-energy events are displayed. The full data set is available in the same format at DOI 10.5281/zenodo.6504276.
Appendix B Code
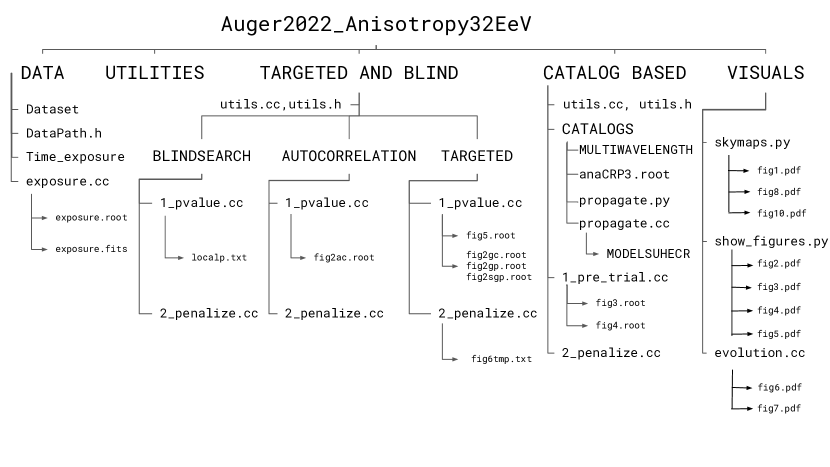
The structure of the code used to produce the results of this paper is presented in Figure 9. The main analyses are contained in two folders, called Targeted_Blind for Sections 3 and 5, and Catalog_Based for Section 4. The add-ons and utilities needed to run the analyses are contained in the folders Data, Utilities and Visuals. A brief description of each folder follows.
-
•
The Data folder contains the file of the data set used in all of the analyses, named AugerApJS2022_Yr_JD_UTC_Th_Ph_RA_Dec_E_Expo.dat. Additionally, the folder contains a C++ script named exposure.cc, which computes the directional exposure of the Observatory for both vertical and inclined events, which is integrated over the duration of the acquisition period; the exposure script produces two files, exposure.root and exposure.fits, which contain the exposure as a function of declination in TF1-root format and in healpixmap-fits form (RING scheme, Galactic coordinates), respectively. The Time_exposure file provides the evolution of exposure with time, as displayed in the upper axis of Figure 7. The DataPath.h contains the declaration of the data set file to be used by all the analyses for easy user intervention.
-
•
The Utilities folder contains files with auxiliary classes and functions used by all other parts of the code, in particular coordinate-conversion utilities and HEALPix map manipulation.
-
•
The Targeted_Blind folder contains the code for the targeted (Sections 5 and 3.3), blind (Section 3.1) and autocorrelation (Section 3.2) analyses. The first folder level contains:
-
–
dedicated utilities (utils.h and utils.cc);
-
–
three sub-folders: Blind, Targeted and Autocorrelation containing the respective analyses.
Each of the three sub-folders contains a script performing the computation of the local -value, 1_pvalue.cc, and a script penalizing for the search over the parameter space, 2_penalization.cc. The results of the Blind code are stored in .txt files for easy readout, while the results of Autocorrelation code are stored as a .root file. In the Targeted folder, 1_pvalue.cc produces the outputs fig5.root, fig2gc.root, fig2gp.root and fig2sgp.root, which contain the local -value in bins of energy threshold and search radius for the Centaurus region, Galactic center, Galactic plane and supergalactic plane analyses, respectively; the .root files in the Autocorrelation and Targeted folders contain also copies of the support histograms used to calculate the local -value which are used by the penalization algorithm. The script 2_penalization.cc produces the post-trial -value in single-value text form, as well as the file fig6tmp.txt, which stores the pre-trial -values as a function of energy threshold penalized only for the scan in angle (see Figure 6).
-
–
-
•
The Catalog_Based folder contains the code for the likelihood-ratio analysis. The first folder level comprises:
-
–
dedicated utilities (utils.h and utils.cc);
-
–
the folder Catalogs, which contains the raw catalogs of galaxies in the subfolder Multiwavelength, as described in Appendix C. The raw catalog files are input, above a fixed energy threshold, to the script propagate.cc, in conjunction with the Auger composition model contained in the file AnaCRP3.root, to produce the attenuated models used in the analysis. These attenuated models can be produced above all energy thresholds by running the script propagate.py, with outputs stored in the subfolder ModelsUHECR. The latter is organized as different folders for each catalog;
-
–
the analysis routines: 1_pre_trial.cc, which produces the results stored in the files fig3.root, showing the test statistic, signal fraction and search radius as a function of threshold energy, and fig4.root, showing the test statistic as a function of the signal fraction and search radius with 68 C.L. contours for each catalog; 2_penalization.cc produces the post-trial -values.
-
–
-
•
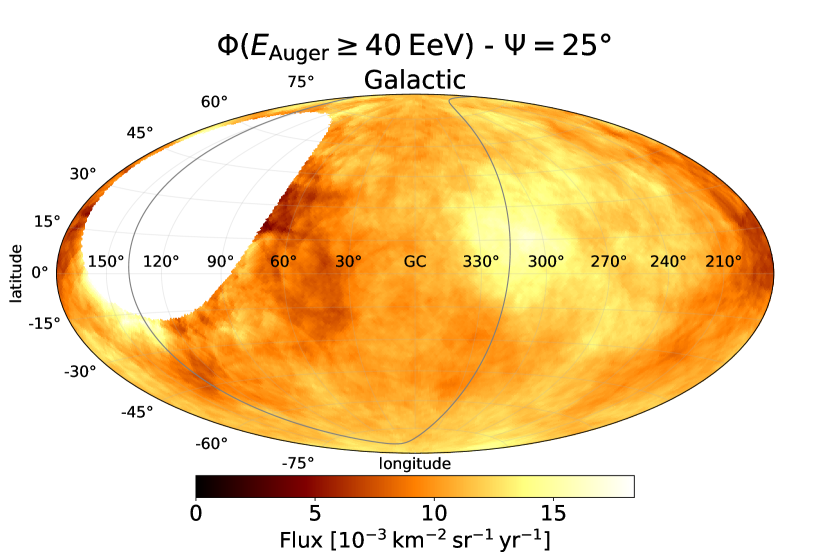
The Visuals folder contains scripts that produce the figures shown in the paper. The python script skymaps.py produces the sky maps in Hammer-Aitoff view: the Li-Ma significance map, fig1.pdf, the flux maps above successive energy threshold stored in fig8.pdf and the model maps stored in fig10.pdf. The script show_figures.py produces fig2.pdf, fig3.pdf, fig4.pdf and fig5.pdf from their respective root files. The script evolution.cc produces fig6.pdf, the plot of the pre-trial -values from the Centaurus-region analysis and likelihood-ratio analysis against starburst galaxies as a function of threshold energy; it also produces fig7.pdf, the plot of the evolution of test statistic of the starburst analysis and of the excess in the Centaurus region as a function of the exposure accumulated at the Observatory.
Appendix C Catalogs
The best-fit sky models above 40 EeV obtained with the four catalogs described in Section 4.1 are shown in Figure 10. These sky maps do not include any isotropic component and display only the flux expected from galaxies included in the catalogs, which is smeared on the best-fit Fisher angular scale above 40 EeV obtained with each catalog. A further top-hat smoothing on an angular scale is performed for the sake of comparison with Figure 8.
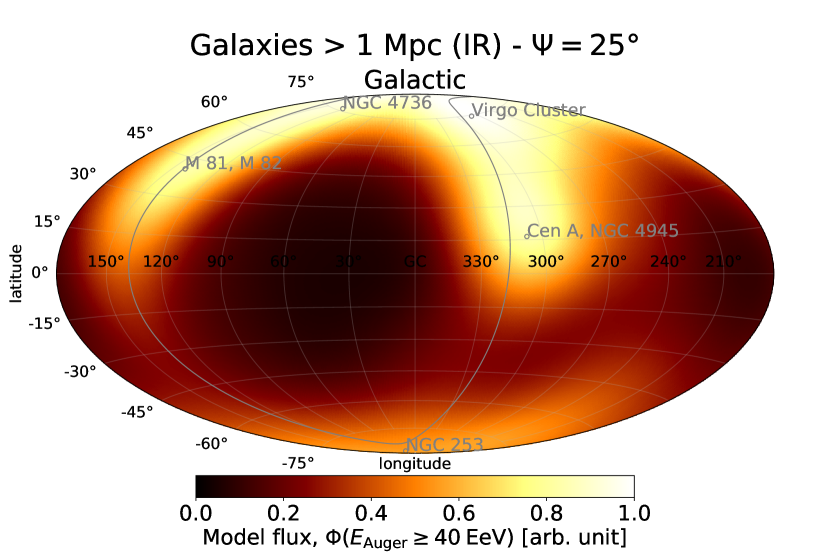
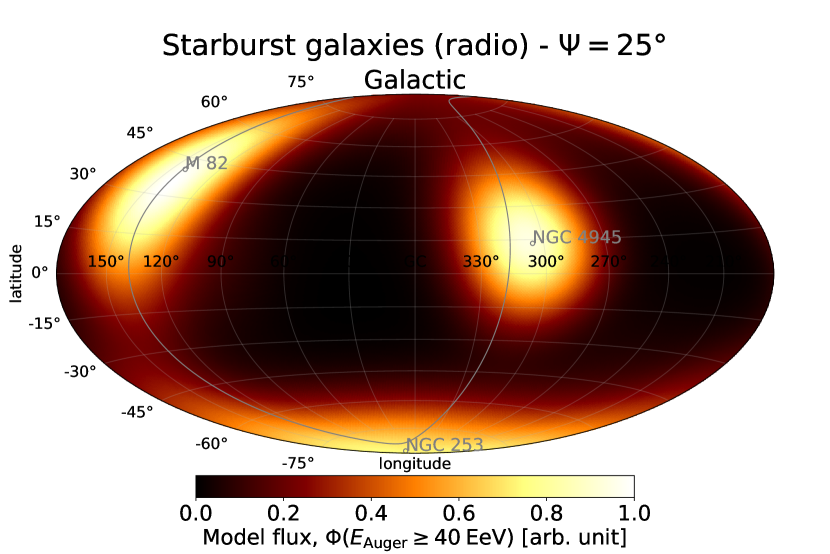
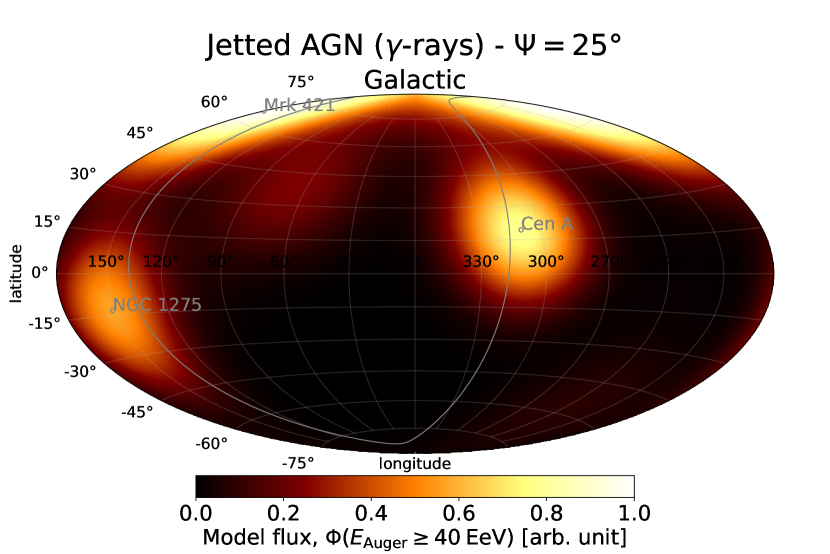
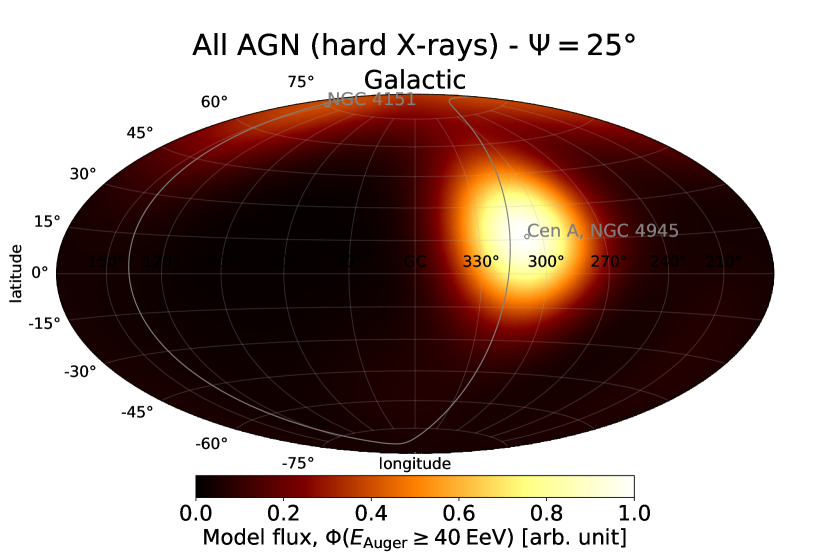
The models shown in Figure 10 are based on the UHECR flux expected from each galaxy in proportion to its electromagnetic flux. The multiwavelength information on the galaxies is made available in the Multiwavelength sub-folder of the catalog-based study, as described in Appendix B, and is available online at DOI 10.5281/zenodo.6504276. The Multiwavelength folder contains one file per catalog, with tabulated values detailed in Tables 4, 5, 6 and 7. The first column of each of these tables provides the name of the source as referenced by the authors of the source catalog. The second column provides a counterpart name that is consistent across all four catalogs. The third column provides the type of galaxy, extracted either from the source catalog or from the HyperLEDA database. The fourth and fifth columns provide the equatorial coordinates of the galaxy. The sixth and seventh columns display the distance modulus and associated uncertainty extracted from the modbest entry of the HyperLEDA database. The eighth and ninth columns display the corresponding luminosity distance in Mpc as well as the relative uncertainty on this quantity. The electromagnetic flux of each galaxy is provided in column 10, except in Table 4 where the K-band magnitude is provided. Whenever available, the uncertainty on the quantity provided in column 10 is shown in column 11. Finally, a flag is provided in the last columns of Tables 5, 6 and 7. This flag indicates whether the galaxy was also included in the main samples studied in Pierre Auger Collaboration (2018b) (Y), in one of the cross-check samples (X), or not included in earlier versions of these catalogs (N). The flag column of Table 6 indicates the origin of the redshift estimate, either from HyperLEDA or from NED for the 23 X-ray AGNs that are not listed in HyperLEDA.
-
Table 4: Galaxies (2MASS(K11.75) HyperLEDA). PGC Counterpart Object Type R.A. Dec ∘ ∘ 29128 NGC3109 G 150.78 -26.16 25.56 0.02 1.29 0.007 9.57 0.40 29653 PGC029653 G 152.75 -4.69 25.59 0.03 1.31 0.013 11.31 0.56 28913 UGC05373 G 150.00 5.33 25.79 0.01 1.44 0.006 10.76 0.23 100169 PGC100169 G 31.52 69.00 26.15 0.20 1.70 0.092 9.69 0.24 67908 IC5152 G 330.67 -51.30 26.46 0.03 1.96 0.012 9.05 0.36 3238 NGC0300 G 13.72 -37.68 26.53 0.02 2.03 0.007 6.58 0.36 1014 NGC0055 G 3.72 -39.20 26.62 0.01 2.11 0.006 6.34 0.18 9140 PGC009140 G 36.18 -73.51 26.63 0.07 2.12 0.032 10.83 0.10 13115 UGC02773 G 53.03 47.79 26.69 0.20 2.18 0.092 9.80 0.10 39573 IC3104 G 184.69 -79.73 26.86 0.02 2.36 0.007 9.24 0.14 60849 IC4662 G 266.79 -64.64 27.03 0.01 2.55 0.006 9.45 0.21 47495 UGC08508 G 202.68 54.91 27.07 0.02 2.60 0.011 11.51 0.10 40904 UGC07577 G 186.92 43.50 27.08 0.02 2.60 0.011 10.45 0.20 54392 ESO274-001 G 228.56 -46.81 27.24 0.06 2.80 0.026 8.30 0.39 51472 UGC09240 G 216.18 44.53 27.25 0.02 2.82 0.008 10.89 0.13 39023 NGC4190 G 183.44 36.63 27.26 0.04 2.83 0.020 11.40 0.77 14241 PGC014241 G 59.96 67.14 27.37 0.03 2.98 0.012 8.24 0.16 4126 NGC0404 G 17.36 35.72 27.37 0.02 2.98 0.007 7.53 0.02 39225 NGC4214 G 183.91 36.33 27.37 0.01 2.98 0.002 8.09 0.21 38881 NGC4163 G 183.04 36.17 27.38 0.02 2.99 0.007 10.92 0.08 15488 NGC1560 G 68.20 71.88 27.38 0.10 2.99 0.046 9.07 0.22 49050 ESO383-087 G 207.32 -36.06 27.52 0.02 3.19 0.007 9.91 0.14 15439 PGC015439 G 68.01 63.62 27.53 0.05 3.20 0.024 10.97 0.17 21396 NGC2403 G 114.21 65.60 27.53 0.01 3.20 0.004 6.24 0.14 47762 NGC5206 G 203.43 -48.15 27.53 0.01 3.21 0.005 8.39 0.25 … … … … … … … … … … … 127001 PGC127001 G 67.39 -61.25 36.99 0.07 249.7 0.030 11.72 0.18 Note. — 44,113 entries within 250 Mpc. 17,143 entries at Mpc, 39,563 at Mpc.
Table 5: Starburst galaxies (Lunardini+ ’19). Lunardi Name Counterpart Host Type R.A. Dec (1.4 GHz) flag: in Pierre Auger Collaboration 2018b? ∘ ∘ (No/Yes/Xcheck) NGC0055 NGC0055 SBm 3.72 -39.20 26.62 0.01 2.11 0.005 0.37 N/A N NGC1569 NGC1569 IB 67.70 64.85 27.53 0.05 3.21 0.023 0.40 N/A X NGC2403 NGC2403 SABc 114.21 65.60 27.53 0.01 3.21 0.005 0.39 N/A X IC342 IC342 SABc 56.70 68.10 27.68 0.03 3.44 0.014 2.25 N/A Y NGC4945 NGC4945 Sbc 196.37 -49.47 27.7 0.02 3.47 0.009 6.60 N/A Y NGC3034(M82) M82 S? 148.97 69.68 27.79 0.01 3.61 0.005 7.29 N/A Y NGC0253 NGC253 SABc 11.89 -25.29 27.84 0.02 3.70 0.009 6.00 N/A Y N/A Circinus Sb 213.29 -65.34 28.12 0.36 4.21 0.166 1.50 N/A Y NGC5236(M83) M83 Sc 204.25 -29.87 28.45 0.02 4.90 0.009 2.44 N/A Y Maffei2 Maffei2 Sbc 40.48 59.60 28.79 0.12 5.73 0.055 1.01 N/A X NGC6946 NGC6946 SABc 308.72 60.15 29.14 0.05 6.73 0.023 1.40 N/A Y NGC4631 NGC4631 SBcd 190.53 32.54 29.33 0.02 7.35 0.009 1.12 N/A Y NGC5194(M51) M51 SABb 202.48 47.20 29.67 0.02 8.59 0.009 1.31 N/A Y NGC5055(M63) NGC5055 Sbc 198.96 42.03 29.78 0.01 9.04 0.005 0.35 N/A Y NGC2903 NGC2903 Sbc 143.04 21.50 29.85 0.11 9.33 0.051 0.44 N/A Y NGC891 NGC891 Sb 35.64 42.35 29.94 1.72 9.73 0.792 0.70 N/A Y NGC1068 NGC1068 Sb 40.66 0.00 30.12 0.34 10.6 0.157 4.85 N/A Y NGC3628 NGC3628 SBb 170.07 13.59 30.21 0.34 11.0 0.157 0.47 N/A Y NGC4818 NGC4818 SABa 194.20 -8.53 30.27 0.33 11.3 0.152 0.45 N/A N NGC3627 NGC3627 Sb 170.06 12.99 30.30 0.04 11.5 0.018 0.46 N/A Y NGC1808 NGC1808 Sa 76.93 -37.51 30.45 0.36 12.3 0.166 0.50 N/A X NGC4303 M61 Sbc 185.48 4.47 30.45 0.10 12.3 0.046 0.44 N/A X NGC3521 NGC3521 SABb 166.45 -0.04 30.47 0.29 12.4 0.134 0.35 N/A N NGC0660 NGC660 Sa 25.76 13.65 30.50 1.31 12.6 0.603 0.37 N/A Y NGC4254 NGC4254 Sc 184.71 14.42 30.77 1.13 14.3 0.520 0.37 N/A N … … … … … … … … … … … … NGC6240 NGC6240 S0-a 253.26 2.40 35.18 0.15 108.6 0.069 0.65 N/A Y Note. — 44 entries within 250 Mpc. 43 entries at Mpc, 44 at Mpc.
Table 6: Jetted and non-jetted AGNs (Swift-BAT 105 months). BAT105 Name Counterpart AGN Type R.A. Dec (keV) flag: ref. ∘ ∘ erg cms-1 erg cms-1 (HyperLEDA/NED) J1305.4-4928 NGC4945 Sy2 196.37 -49.47 27.70 0.02 3.47 0.009 282.1 N/A H J0955.5+6907 M81 Sy1.9 148.94 69.06 27.78 0.01 3.60 0.005 20.3 N/A H J1325.4-4301 CenA BeamedAGN 201.37 -43.02 27.83 0.03 3.68 0.014 1346.3 N/A H J1412.9-6522 Circinus Sy2 213.29 -65.34 28.12 0.36 4.21 0.166 273.2 N/A H J1210.5+3924 NGC4151 Sy1.5 182.64 39.41 28.39 1.65 4.76 0.760 618.9 N/A H J1202.5+3332 NGC4395 Sy2 186.45 33.53 28.39 0.01 4.76 0.005 27.5 N/A H J0420.0-5457 NGC1566 Sy1.5 64.96 -54.94 29.13 1.16 6.70 0.534 19.5 N/A H J1219.4+4720 M106 Sy1.9 184.75 47.29 29.41 0.01 7.62 0.005 23.0 N/A H J1329.9+4719 M51 Sy2 202.48 47.20 29.67 0.02 8.59 0.009 13.3 N/A H J0242.6+0000 NGC1068 Sy1.9 40.66 0.00 30.12 0.34 10.6 0.157 37.9 N/A H J1717.1-6249 NGC6300 Sy2 259.25 -62.83 30.15 0.09 10.7 0.041 96.4 N/A H J1203.0+4433 NGC4051 Sy1.5 180.78 44.52 30.28 0.35 11.4 0.161 42.5 N/A H J1652.0-5915B NGC6221 Sy2 253.18 -59.23 30.34 0.62 11.7 0.286 22.4 N/A H J1209.4+4340 NGC4138 Sy2 182.35 43.70 30.70 0.25 13.8 0.115 24.4 N/A H J1157.8+5529 NGC3998 Sy1.9 179.46 55.44 30.73 0.19 14.0 0.087 13.2 N/A H J2235.9-2602 NGC7314 Sy1.9 338.95 -26.05 31.03 0.25 16.1 0.115 57.4 N/A H J1432.8-4412 NGC5643 Sy2 218.19 -44.15 31.03 1.00 16.1 0.461 16.8 N/A H J1001.7+5543 NGC3079 Sy2 150.46 55.67 31.16 0.32 17.1 0.147 36.7 N/A H J1341.9+3537 NGC5273 Sy1.5 205.47 35.66 31.16 0.12 17.1 0.055 16.0 N/A H J1207.8+4311 NGC4117 Sy2 181.95 43.12 31.18 0.94 17.2 0.433 12.9 N/A H J0333.6-3607 NGC1365 Sy2 53.39 -36.14 31.19 0.02 17.3 0.009 63.5 N/A H J0241.3-0816 NGC1052 BeamedAGN 40.29 -8.24 31.22 0.11 17.5 0.051 31.4 N/A H J1132.7+5301 NGC3718 Sy1.9 173.22 53.02 31.25 0.89 17.8 0.410 12.2 N/A H J1206.2+5243 NGC4102 Sy2 181.59 52.71 31.29 0.25 18.1 0.115 32.1 N/A H J2318.4-4223 NGC7582 Sy2 349.60 -42.37 31.41 0.10 19.1 0.046 82.3 N/A H … … … … … … … … … … … … J0534.8-6026 2MASXJ05343093-6016153 Sy1 83.70 -60.27 36.98 0.06 248.9 0.028 10.7 N/A H Note. — 523 entries within 250 Mpc. 201 entries at Mpc, 458 at Mpc.
Table 7: Jetted AGNs (Fermi-LAT 3FHL). 3FHL Name Counterpart Jetted AGN Type R.A. Dec (TeV) flag: in Pierre Auger Collaboration 2018b? ∘ ∘ cms-1 cms-1 (No/Yes) J1325.5-4300 CenA RDG 201.37 -43.02 27.83 0.03 3.68 0.014 1.54 0.25 Y J1230.8+1223 M87 RDG 187.71 12.39 31.12 0.06 16.7 0.028 0.98 0.20 Y J0322.6-3712e FornaxA RDG 50.67 -37.21 31.55 0.03 20.4 0.014 0.48 0.16 N J1346.2-6026 CenB RDG 206.70 -60.41 33.71 0.29 55.2 0.134 0.64 0.18 N J0319.8+4130 NGC1275 RDG 49.95 41.51 34.46 0.08 78.0 0.037 14.17 0.67 Y J0316.6+4120 IC310 RDG 49.18 41.32 34.60 0.19 83.2 0.087 0.43 0.13 Y J0153.5+7115 TXS0149+710 BCU 28.36 71.25 35.07 0.15 103.3 0.069 0.44 0.12 Y J0308.4+0408 NGC1218 RDG 47.11 4.11 35.48 0.13 124.7 0.060 0.54 0.16 N J1104.4+3812 Mkn421 BLL 166.10 38.21 35.63 0.12 133.7 0.055 59.35 1.38 Y J1653.8+3945 Mkn501 BLL 253.47 39.76 35.91 0.10 152.1 0.046 19.17 0.76 Y J0131.1+5546 TXS0128+554 BCU 22.81 55.75 36.06 0.10 162.9 0.046 0.33 0.12 N J1543.6+0452 CGCG050-083 BCU 235.89 4.87 36.26 0.09 178.6 0.041 0.69 0.17 N J0223.0-1119 1RXSJ022314.6-111741 BLL 35.81 -11.29 36.31 0.09 182.8 0.041 0.40 0.13 N J2347.0+5142 1ES2344+514 BLL 356.76 51.69 36.47 0.08 196.8 0.037 3.32 0.31 Y J0816.4-1311 PMNJ0816-1311 BLL 124.11 -13.20 36.51 0.08 200.4 0.037 2.71 0.33 N J1136.5+7009 Mkn180 BLL 174.11 70.16 36.54 0.08 203.2 0.037 1.74 0.21 Y J1959.9+6508 1ES1959+650 BLL 299.97 65.16 36.63 0.08 211.8 0.037 8.43 0.46 Y J1647.6+4950 SBS1646+499 BLL 251.90 49.83 36.64 0.08 212.8 0.037 0.48 0.12 N J1517.6-2422 APLibrae BLL 229.42 -24.37 36.68 0.07 216.8 0.032 3.76 0.37 Y J0214.5+5145 TXS0210+515 BLL 33.55 51.77 36.70 0.11 218.8 0.051 0.42 0.12 Y J1806.8+6950 3C371 BLL 271.71 69.82 36.77 0.07 225.9 0.032 1.30 0.18 N J1353.0-4413 PKS1349-439 BLL 208.24 -44.21 36.79 0.07 228.0 0.032 0.33 0.12 N J0200.1-4109 1RXSJ020021.0-410936 BLL 30.09 -41.16 36.85 0.07 234.4 0.032 0.51 0.14 N J0627.1-3528 PKS0625-35 BLL 96.78 -35.49 36.89 0.07 238.8 0.032 1.81 0.26 Y J2039.4+5219 1ES2037+521 BLL 309.85 52.33 36.89 0.07 238.8 0.032 0.58 0.15 N J0523.0-3627 PKS0521-36 BLL 80.76 -36.46 36.91 0.07 241.0 0.032 1.17 0.21 N Note. — 26 entries within 250 Mpc. 6 entries at Mpc, 14 at Mpc.
References
- Addazi et al. (2022) Addazi, A., Alvarez-Muniz, J., Alves Batista, R., et al. 2022, Progress in Particle and Nuclear Physics, 103948, doi: https://doi.org/10.1016/j.ppnp.2022.103948
- Ajello et al. (2015) Ajello, M., Gasparrini, D., Sánchez-Conde, M., et al. 2015, ApJ, 800, L27, doi: 10.1088/2041-8205/800/2/L27
- Allard (2012) Allard, D. 2012, Astropart. Phys., 39, 33, doi: 10.1016/j.astropartphys.2011.10.011
- Alves Batista et al. (2019) Alves Batista, R., Biteau, J., Bustamante, M., et al. 2019, Frontiers in Astronomy and Space Sciences, 6, 23, doi: 10.3389/fspas.2019.00023
- Ave et al. (2017) Ave, M., Engel, R., Roth, M., & Schulz, A. 2017, Astropart. Phys., 87, 23, doi: https://doi.org/10.1016/j.astropartphys.2016.11.008
- Baumgartner et al. (2013) Baumgartner, W. H., Tueller, J., Markwardt, C. B., et al. 2013, ApJS, 207, 19, doi: 10.1088/0067-0049/207/2/19
- Bell & Matthews (2022) Bell, A. R., & Matthews, J. H. 2022, MNRAS, 511, 448, doi: 10.1093/mnras/stac031
- Biteau (2021) Biteau, J. 2021, ApJS, 256, 15, doi: 10.3847/1538-4365/ac09f5
- Boulanger et al. (2018) Boulanger, F., Enßlin, T., Fletcher, A., et al. 2018, J. Cosmology Astropart. Phys, 2018, 049, doi: 10.1088/1475-7516/2018/08/049
- Calabretta et al. (2014) Calabretta, M. R., Staveley-Smith, L., & Barnes, D. G. 2014, PASA, 31, e007, doi: 10.1017/pasa.2013.36
- Condon et al. (1998) Condon, J. J., Cotton, W. D., Greisen, E. W., et al. 1998, AJ, 115, 1693, doi: 10.1086/300337
- di Matteo & Tinyakov (2018) di Matteo, A., & Tinyakov, P. 2018, MNRAS, 476, 715, doi: 10.1093/mnras/sty277
- Erdmann et al. (2016) Erdmann, M., Müller, G., Urban, M., & Wirtz, M. 2016, Astropart. Phys., 85, 54, doi: 10.1016/j.astropartphys.2016.10.002
- Farrar & Sutherland (2019) Farrar, G. R., & Sutherland, M. S. 2019, J. Cosmology Astropart. Phys, 2019, 004, doi: 10.1088/1475-7516/2019/05/004
- Fermi-LAT Collaboration (2017) Fermi-LAT Collaboration. 2017, ApJS, 232, 18, doi: 10.3847/1538-4365/aa8221
- Górski et al. (2005) Górski, K. M., Hivon, E., Banday, A. J., et al. 2005, ApJ, 622, 759, doi: 10.1086/427976
- Greisen (1966) Greisen, K. 1966, Phys. Rev. Lett., 16, 748, doi: 10.1103/PhysRevLett.16.748
- Huchra et al. (2012) Huchra, J. P., Macri, L. M., Masters, K. L., et al. 2012, ApJS, 199, 26, doi: 10.1088/0067-0049/199/2/26
- Jansson & Farrar (2012) Jansson, R., & Farrar, G. R. 2012, ApJ, 761, L11, doi: 10.1088/2041-8205/761/1/L11
- Kotera & Lemoine (2008) Kotera, K., & Lemoine, M. 2008, Phys. Rev. D, 77, 123003, doi: 10.1103/PhysRevD.77.123003
- Lemoine & Waxman (2009) Lemoine, M., & Waxman, E. 2009, J. Cosmology Astropart. Phys, 2009, 009, doi: 10.1088/1475-7516/2009/11/009
- Li & Ma (1983) Li, T. P., & Ma, Y. Q. 1983, ApJ, 272, 317, doi: 10.1086/161295
- Lunardini et al. (2019) Lunardini, C., Vance, G. S., Emig, K. L., & Windhorst, R. A. 2019, J. Cosmology Astropart. Phys, 2019, 073, doi: 10.1088/1475-7516/2019/10/073
- Makarov et al. (2014) Makarov, D., Prugniel, P., Terekhova, N., Courtois, H., & Vauglin, I. 2014, A&A, 570, A13, doi: 10.1051/0004-6361/201423496
- McCall (2014) McCall, M. L. 2014, MNRAS, 440, 405, doi: 10.1093/mnras/stu199
- Oh et al. (2018) Oh, K., Koss, M., Markwardt, C. B., et al. 2018, ApJS, 235, 4, doi: 10.3847/1538-4365/aaa7fd
- Pierre Auger Collaboration (2007) Pierre Auger Collaboration. 2007, Science, 318, 938, doi: 10.1126/science.1151124
- Pierre Auger Collaboration (2010a) —. 2010a, NIM A, 613, 29, doi: https://doi.org/10.1016/j.nima.2009.11.018
- Pierre Auger Collaboration (2010b) —. 2010b, Astropart. Phys., 34, 314, doi: 10.1016/j.astropartphys.2010.08.010
- Pierre Auger Collaboration (2014) —. 2014, J. Cosmology Astropart. Phys, 2014, 019, doi: 10.1088/1475-7516/2014/08/019
- Pierre Auger Collaboration (2015a) —. 2015a, ApJ, 804, 15, doi: 10.1088/0004-637X/804/1/15
- Pierre Auger Collaboration (2015b) —. 2015b, NIM A, 798, 172, doi: https://doi.org/10.1016/j.nima.2015.06.058
- Pierre Auger Collaboration (2016a) —. 2016a, arXiv e-prints, arXiv:1604.03637. https://arxiv.org/abs/1604.03637
- Pierre Auger Collaboration (2016b) —. 2016b, Phys. Rev. D, 93, 072006, doi: 10.1103/PhysRevD.93.072006
- Pierre Auger Collaboration (2017a) —. 2017a, Science, 357, 1266, doi: 10.1126/science.aan4338
- Pierre Auger Collaboration (2017b) —. 2017b, Phys. Rev. D, 96, 122003, doi: 10.1103/PhysRevD.96.122003
- Pierre Auger Collaboration (2017c) —. 2017c, J. Cosmology Astropart. Phys, 2017, 038, doi: 10.1088/1475-7516/2017/04/038
- Pierre Auger Collaboration (2018a) —. 2018a, ApJ, 868, 4, doi: 10.3847/1538-4357/aae689
- Pierre Auger Collaboration (2018b) —. 2018b, ApJ, 853, L29, doi: 10.3847/2041-8213/aaa66d
- Pierre Auger Collaboration (2020a) —. 2020a, ApJ, 891, 142, doi: 10.3847/1538-4357/ab7236
- Pierre Auger Collaboration (2020b) —. 2020b, Phys. Rev. D, 102, 062005, doi: 10.1103/PhysRevD.102.062005
- Pierre Auger Collaboration (2020c) —. 2020c, J. Instrum., 15, P10021, doi: 10.1088/1748-0221/15/10/P10021
- Pierre Auger Collaboration (2020d) —. 2020d, Phys. Rev. Lett., 125, 121106, doi: 10.1103/PhysRevLett.125.121106
- Pierre Auger Collaboration (2021a) —. 2021a, J. Instrum., 16, P07019, doi: 10.1088/1748-0221/16/07/p07019
- Pierre Auger Collaboration (2021b) —. 2021b, J. Instrum., 16, P07016, doi: 10.1088/1748-0221/16/07/p07016
- Pierre Auger Collaboration (2021c) —. 2021c, Pierre Auger Observatory 2021 Open Data, 1.0.0, Zenodo, doi: 10.5281/zenodo.4487613
- Roth et al. (2021) Roth, M. A., Krumholz, M. R., Crocker, R. M., & Celli, S. 2021, Nature, 597, 341, doi: 10.1038/s41586-021-03802-x
- Sanders et al. (2003) Sanders, D. B., Mazzarella, J. M., Kim, D. C., Surace, J. A., & Soifer, B. T. 2003, AJ, 126, 1607, doi: 10.1086/376841
- Skrutskie et al. (2006) Skrutskie, M. F., Cutri, R. M., Stiening, R., et al. 2006, AJ, 131, 1163, doi: 10.1086/498708
- Telescope Array Collaboration (2018) Telescope Array Collaboration. 2018, ApJ, 867, L27, doi: 10.3847/2041-8213/aaebf9
- van Velzen et al. (2012) van Velzen, S., Falcke, H., Schellart, P., Nierstenhöfer, N., & Kampert, K.-H. 2012, A&A, 544, A18, doi: 10.1051/0004-6361/201219389
- Wilks (1938) Wilks, S. S. 1938, Ann. Math. Statist., 9, 60, doi: 10.1214/aoms/1177732360
- Wright & Otrupcek (1996) Wright, A. E., & Otrupcek, R. 1996, VizieR Online Data Catalog, VIII/15
- Zatsepin & Kuz’min (1966) Zatsepin, G. T., & Kuz’min, V. A. 1966, J. Exp. Theor. Phys. Lett., 4, 78
=3000
The Pierre Auger Collaboration
P. Abreu72, M. Aglietta54,52, J.M. Albury13, I. Allekotte1, K. Almeida Cheminant70, A. Almela8,12, J. Alvarez-Muñiz79, R. Alves Batista80, J. Ammerman Yebra79, G.A. Anastasi54,52, L. Anchordoqui86, B. Andrada8, S. Andringa72, C. Aramo50, P.R. Araújo Ferreira42, E. Arnone63,52, J. C. Arteaga Velázquez67, H. Asorey8, P. Assis72, G. Avila11, E. Avocone57,46, A.M. Badescu75, A. Bakalova32, A. Balaceanu73, F. Barbato45,46, J.A. Bellido13,69, C. Berat36, M.E. Bertaina63,52, G. Bhatta70, P.L. Biermannb, V. Binet6, K. Bismark39,8, T. Bister42, J. Biteau37, J. Blazek32, C. Bleve36, J. Blümer41, M. Boháčová32, D. Boncioli57,46, C. Bonifazi9,26, L. Bonneau Arbeletche22, N. Borodai70, A.M. Botti8, J. Brackd, T. Bretz42, P.G. Brichetto Orchera8, F.L. Briechle42, P. Buchholz44, A. Bueno78, S. Buitink15, M. Buscemi47, M. Büsken39,8, K.S. Caballero-Mora66, L. Caccianiga59,49, F. Canfora80,81, I. Caracas38, R. Caruso58,47, A. Castellina54,52, F. Catalani19, G. Cataldi48, L. Cazon79, M. Cerda10, J.A. Chinellato22, J. Chudoba32, L. Chytka33, R.W. Clay13, A.C. Cobos Cerutti7, R. Colalillo60,50, A. Coleman91, M.R. Coluccia48, R. Conceição72, A. Condorelli45,46, G. Consolati49,55, F. Contreras11, F. Convenga41, D. Correia dos Santos28, C.E. Covault84, S. Dasso5,3, K. Daumiller41, B.R. Dawson13, J.A. Day13, R.M. de Almeida28, J. de Jesús8,41, S.J. de Jong80,81, J.R.T. de Mello Neto26,27, I. De Mitri45,46, J. de Oliveira18, D. de Oliveira Franco22, F. de Palma56,48, V. de Souza20, E. De Vito56,48, A. Del Popolo58,47, M. del Río11, O. Deligny34, L. Deval41,8, A. di Matteo52, M. Dobre73, C. Dobrigkeit22, J.C. D’Olivo68, L.M. Domingues Mendes72, R.C. dos Anjos25, M.T. Dova4, J. Ebr32, R. Engel39,41, I. Epicoco56,48, M. Erdmann42, C.O. Escobara, A. Etchegoyen8,12, H. Falcke80,82,81, J. Farmer90, G. Farrar88, A.C. Fauth22, N. Fazzinia, F. Feldbusch40, F. Fenu63,52, B. Fick87, J.M. Figueira8, A. Filipčič77,76, T. Fitoussi41, T. Fodran80, T. Fujii90,e, A. Fuster8,12, C. Galea80, C. Galelli59,49, B. García7, H. Gemmeke40, F. Gesualdi8,41, A. Gherghel-Lascu73, P.L. Ghia34, U. Giaccari80, M. Giammarchi49, J. Glombitza42, F. Gobbi10, F. Gollan8, G. Golup1, M. Gómez Berisso1, P.F. Gómez Vitale11, J.P. Gongora11, J.M. González1, N. González14, I. Goos1,41, D. Góra70, A. Gorgi54,52, M. Gottowik38, T.D. Grubb13, F. Guarino60,50, G.P. Guedes23, E. Guido52,63, S. Hahn41,8, P. Hamal32, M.R. Hampel8, P. Hansen4, D. Harari1, V.M. Harvey13, A. Haungs41, T. Hebbeker42, D. Heck41, G.C. Hill13, C. Hojvata, J.R. Hörandel80,81, P. Horvath33, M. Hrabovský33, T. Huege41,15, A. Insolia58,47, P.G. Isar74, P. Janecek32, J.A. Johnsen85, J. Jurysek32, A. Kääpä38, K.H. Kampert38, B. Keilhauer41, A. Khakurdikar80, V.V. Kizakke Covilakam8,41, H.O. Klages41, M. Kleifges40, J. Kleinfeller10, F. Knapp39, N. Kunka40, B.L. Lago17, N. Langner42, M.A. Leigui de Oliveira24, V. Lenok41, A. Letessier-Selvon35, I. Lhenry-Yvon34, D. Lo Presti58,47, L. Lopes72, R. López64, L. Lu92, Q. Luce39, J.P. Lundquist76, A. Machado Payeras22, G. Mancarella56,48, D. Mandat32, B.C. Manning13, J. Manshanden43, P. Mantscha, S. Marafico34, F.M. Mariani59,49, A.G. Mariazzi4, I.C. Mariş14, G. Marsella61,47, D. Martello56,48, S. Martinelli41,8, O. Martínez Bravo64, M. Mastrodicasa57,46, H.J. Mathes41, J. Matthewsf, G. Matthiae62,51, E. Mayotte85,38, S. Mayotte85, P.O. Mazura, G. Medina-Tanco68, D. Melo8, A. Menshikov40, S. Michal33, M.I. Micheletti6, L. Miramonti59,49, S. Mollerach1, F. Montanet36, L. Morejon38, C. Morello54,52, M. Mostafá89, A.L. Müller32, M.A. Muller22, K. Mulrey80,81, R. Mussa52, M. Muzio88, W.M. Namasaka38, A. Nasr-Esfahani38, L. Nellen68, G. Nicora2, M. Niculescu-Oglinzanu73, M. Niechciol44, D. Nitz87, I. Norwood87, D. Nosek31, V. Novotny31, L. Nožka33, A Nucita56,48, L.A. Núñez30, C. Oliveira20, M. Palatka32, J. Pallotta2, P. Papenbreer38, G. Parente79, A. Parra64, J. Pawlowsky38, M. Pech32, J. Pȩkala70, R. Pelayo65, J. Peña-Rodriguez30, E.E. Pereira Martins39,8, J. Perez Armand21, C. Pérez Bertolli8,41, L. Perrone56,48, S. Petrera45,46, C. Petrucci57,46, T. Pierog41, M. Pimenta72, V. Pirronello58,47, M. Platino8, B. Pont80, M. Pothast81,80, P. Privitera90, M. Prouza32, A. Puyleart87, S. Querchfeld38, J. Rautenberg38, D. Ravignani8, M. Reininghaus41,8, J. Ridky32, F. Riehn72, M. Risse44, V. Rizi57,46, W. Rodrigues de Carvalho80, J. Rodriguez Rojo11, M.J. Roncoroni8, S. Rossoni43, M. Roth41, E. Roulet1, A.C. Rovero5, P. Ruehl44, A. Saftoiu73, M. Saharan80, F. Salamida57,46, H. Salazar64, G. Salina51, J.D. Sanabria Gomez30, F. Sánchez8, E.M. Santos21, E. Santos32, F. Sarazin85, R. Sarmento72, R. Sato11, P. Savina92, C.M. Schäfer41, V. Scherini56,48, H. Schieler41, M. Schimassek39,8, M. Schimp38, F. Schlüter41,8, D. Schmidt39, O. Scholten15, H. Schoorlemmer80,81, P. Schovánek32, F.G. Schröder91,41, J. Schulte42, T. Schulz41, S.J. Sciutto4, M. Scornavacche8,41, A. Segreto53,47, S. Sehgal38, R.C. Shellard16, G. Sigl43, G. Silli8,41, O. Sima73,g, R. Smau73, R. Šmída90, P. Sommers89, J.F. Soriano86, R. Squartini10, M. Stadelmaier32, D. Stanca73, S. Stanič76, J. Stasielak70, P. Stassi36, M. Straub42, A. Streich39,8, M. Suárez-Durán14, T. Sudholz13, T. Suomijärvi37, A.D. Supanitsky8, Z. Szadkowski71, A. Tapia29, C. Taricco63,52, C. Timmermans81,80, O. Tkachenko41, P. Tobiska32, C.J. Todero Peixoto19, B. Tomé72, Z. Torrès36, A. Travaini10, P. Travnicek32, C. Trimarelli57,46, M. Tueros4, R. Ulrich41, M. Unger41, L. Vaclavek33, M. Vacula33, J.F. Valdés Galicia68, L. Valore60,50, E. Varela64, A. Vásquez-Ramírez30, D. Veberič41, C. Ventura27, I.D. Vergara Quispe4, V. Verzi51, J. Vicha32, J. Vink83, S. Vorobiov76, H. Wahlberg4, C. Watanabe26, A.A. Watsonc, A. Weindl41, L. Wiencke85, H. Wilczyński70, D. Wittkowski38, B. Wundheiler8, A. Yushkov32, O. Zapparrata14, E. Zas79, D. Zavrtanik76,77, M. Zavrtanik77,76, L. Zehrer76
-
1
Centro Atómico Bariloche and Instituto Balseiro (CNEA-UNCuyo-CONICET), San Carlos de Bariloche, Argentina
-
2
Centro de Investigaciones en Láseres y Aplicaciones, CITEDEF and CONICET, Villa Martelli, Argentina
-
3
Departamento de Física and Departamento de Ciencias de la Atmósfera y los Océanos, FCEyN, Universidad de Buenos Aires and CONICET, Buenos Aires, Argentina
-
4
IFLP, Universidad Nacional de La Plata and CONICET, La Plata, Argentina
-
5
Instituto de Astronomía y Física del Espacio (IAFE, CONICET-UBA), Buenos Aires, Argentina
-
6
Instituto de Física de Rosario (IFIR) – CONICET/U.N.R. and Facultad de Ciencias Bioquímicas y Farmacéuticas U.N.R., Rosario, Argentina
-
7
Instituto de Tecnologías en Detección y Astropartículas (CNEA, CONICET, UNSAM), and Universidad Tecnológica Nacional – Facultad Regional Mendoza (CONICET/CNEA), Mendoza, Argentina
-
8
Instituto de Tecnologías en Detección y Astropartículas (CNEA, CONICET, UNSAM), Buenos Aires, Argentina
-
9
International Center of Advanced Studies and Instituto de Ciencias Físicas, ECyT-UNSAM and CONICET, Campus Miguelete – San Martín, Buenos Aires, Argentina
-
10
Observatorio Pierre Auger, Malargüe, Argentina
-
11
Observatorio Pierre Auger and Comisión Nacional de Energía Atómica, Malargüe, Argentina
-
12
Universidad Tecnológica Nacional – Facultad Regional Buenos Aires, Buenos Aires, Argentina
-
13
University of Adelaide, Adelaide, S.A., Australia
-
14
Université Libre de Bruxelles (ULB), Brussels, Belgium
-
15
Vrije Universiteit Brussels, Brussels, Belgium
-
16
Centro Brasileiro de Pesquisas Fisicas, Rio de Janeiro, RJ, Brazil
-
17
Centro Federal de Educação Tecnológica Celso Suckow da Fonseca, Nova Friburgo, Brazil
-
18
Instituto Federal de Educação, Ciência e Tecnologia do Rio de Janeiro (IFRJ), Brazil
-
19
Universidade de São Paulo, Escola de Engenharia de Lorena, Lorena, SP, Brazil
-
20
Universidade de São Paulo, Instituto de Física de São Carlos, São Carlos, SP, Brazil
-
21
Universidade de São Paulo, Instituto de Física, São Paulo, SP, Brazil
-
22
Universidade Estadual de Campinas, IFGW, Campinas, SP, Brazil
-
23
Universidade Estadual de Feira de Santana, Feira de Santana, Brazil
-
24
Universidade Federal do ABC, Santo André, SP, Brazil
-
25
Universidade Federal do Paraná, Setor Palotina, Palotina, Brazil
-
26
Universidade Federal do Rio de Janeiro, Instituto de Física, Rio de Janeiro, RJ, Brazil
-
27
Universidade Federal do Rio de Janeiro (UFRJ), Observatório do Valongo, Rio de Janeiro, RJ, Brazil
-
28
Universidade Federal Fluminense, EEIMVR, Volta Redonda, RJ, Brazil
-
29
Universidad de Medellín, Medellín, Colombia
-
30
Universidad Industrial de Santander, Bucaramanga, Colombia
-
31
Charles University, Faculty of Mathematics and Physics, Institute of Particle and Nuclear Physics, Prague, Czech Republic
-
32
Institute of Physics of the Czech Academy of Sciences, Prague, Czech Republic
-
33
Palacky University, RCPTM, Olomouc, Czech Republic
-
34
CNRS/IN2P3, IJCLab, Université Paris-Saclay, Orsay, France
-
35
Laboratoire de Physique Nucléaire et de Hautes Energies (LPNHE), Sorbonne Université, Université de Paris, CNRS-IN2P3, Paris, France
-
36
Univ. Grenoble Alpes, CNRS, Grenoble Institute of Engineering Univ. Grenoble Alpes, LPSC-IN2P3, 38000 Grenoble, France
-
37
Université Paris-Saclay, CNRS/IN2P3, IJCLab, Orsay, France
-
38
Bergische Universität Wuppertal, Department of Physics, Wuppertal, Germany
-
39
Karlsruhe Institute of Technology (KIT), Institute for Experimental Particle Physics, Karlsruhe, Germany
-
40
Karlsruhe Institute of Technology (KIT), Institut für Prozessdatenverarbeitung und Elektronik, Karlsruhe, Germany
-
41
Karlsruhe Institute of Technology (KIT), Institute for Astroparticle Physics, Karlsruhe, Germany
-
42
RWTH Aachen University, III. Physikalisches Institut A, Aachen, Germany
-
43
Universität Hamburg, II. Institut für Theoretische Physik, Hamburg, Germany
-
44
Universität Siegen, Department Physik – Experimentelle Teilchenphysik, Siegen, Germany
-
45
Gran Sasso Science Institute, L’Aquila, Italy
-
46
INFN Laboratori Nazionali del Gran Sasso, Assergi (L’Aquila), Italy
-
47
INFN, Sezione di Catania, Catania, Italy
-
48
INFN, Sezione di Lecce, Lecce, Italy
-
49
INFN, Sezione di Milano, Milano, Italy
-
50
INFN, Sezione di Napoli, Napoli, Italy
-
51
INFN, Sezione di Roma “Tor Vergata”, Roma, Italy
-
52
INFN, Sezione di Torino, Torino, Italy
-
53
Istituto di Astrofisica Spaziale e Fisica Cosmica di Palermo (INAF), Palermo, Italy
-
54
Osservatorio Astrofisico di Torino (INAF), Torino, Italy
-
55
Politecnico di Milano, Dipartimento di Scienze e Tecnologie Aerospaziali , Milano, Italy
-
56
Università del Salento, Dipartimento di Matematica e Fisica “E. De Giorgi”, Lecce, Italy
-
57
Università dell’Aquila, Dipartimento di Scienze Fisiche e Chimiche, L’Aquila, Italy
-
58
Università di Catania, Dipartimento di Fisica e Astronomia “Ettore Majorana“, Catania, Italy
-
59
Università di Milano, Dipartimento di Fisica, Milano, Italy
-
60
Università di Napoli “Federico II”, Dipartimento di Fisica “Ettore Pancini”, Napoli, Italy
-
61
Università di Palermo, Dipartimento di Fisica e Chimica ”E. Segrè”, Palermo, Italy
-
62
Università di Roma “Tor Vergata”, Dipartimento di Fisica, Roma, Italy
-
63
Università Torino, Dipartimento di Fisica, Torino, Italy
-
64
Benemérita Universidad Autónoma de Puebla, Puebla, México
-
65
Unidad Profesional Interdisciplinaria en Ingeniería y Tecnologías Avanzadas del Instituto Politécnico Nacional (UPIITA-IPN), México, D.F., México
-
66
Universidad Autónoma de Chiapas, Tuxtla Gutiérrez, Chiapas, México
-
67
Universidad Michoacana de San Nicolás de Hidalgo, Morelia, Michoacán, México
-
68
Universidad Nacional Autónoma de México, México, D.F., México
-
69
Universidad Nacional de San Agustin de Arequipa, Facultad de Ciencias Naturales y Formales, Arequipa, Peru
-
70
Institute of Nuclear Physics PAN, Krakow, Poland
-
71
University of Łódź, Faculty of High-Energy Astrophysics,Łódź, Poland
-
72
Laboratório de Instrumentação e Física Experimental de Partículas – LIP and Instituto Superior Técnico – IST, Universidade de Lisboa – UL, Lisboa, Portugal
-
73
“Horia Hulubei” National Institute for Physics and Nuclear Engineering, Bucharest-Magurele, Romania
-
74
Institute of Space Science, Bucharest-Magurele, Romania
-
75
University Politehnica of Bucharest, Bucharest, Romania
-
76
Center for Astrophysics and Cosmology (CAC), University of Nova Gorica, Nova Gorica, Slovenia
-
77
Experimental Particle Physics Department, J. Stefan Institute, Ljubljana, Slovenia
-
78
Universidad de Granada and C.A.F.P.E., Granada, Spain
-
79
Instituto Galego de Física de Altas Enerxías (IGFAE), Universidade de Santiago de Compostela, Santiago de Compostela, Spain
-
80
IMAPP, Radboud University Nijmegen, Nijmegen, The Netherlands
-
81
Nationaal Instituut voor Kernfysica en Hoge Energie Fysica (NIKHEF), Science Park, Amsterdam, The Netherlands
-
82
Stichting Astronomisch Onderzoek in Nederland (ASTRON), Dwingeloo, The Netherlands
-
83
Universiteit van Amsterdam, Faculty of Science, Amsterdam, The Netherlands
-
84
Case Western Reserve University, Cleveland, OH, USA
-
85
Colorado School of Mines, Golden, CO, USA
-
86
Department of Physics and Astronomy, Lehman College, City University of New York, Bronx, NY, USA
-
87
Michigan Technological University, Houghton, MI, USA
-
88
New York University, New York, NY, USA
-
89
Pennsylvania State University, University Park, PA, USA
-
90
University of Chicago, Enrico Fermi Institute, Chicago, IL, USA
-
91
University of Delaware, Department of Physics and Astronomy, Bartol Research Institute, Newark, DE, USA
-
92
University of Wisconsin-Madison, Department of Physics and WIPAC, Madison, WI, USA
-
—–
-
a
Fermi National Accelerator Laboratory, Fermilab, Batavia, IL, USA
-
b
Max-Planck-Institut für Radioastronomie, Bonn, Germany
-
c
School of Physics and Astronomy, University of Leeds, Leeds, United Kingdom
-
d
Colorado State University, Fort Collins, CO, USA
-
e
now at Hakubi Center for Advanced Research and Graduate School of Science, Kyoto University, Kyoto, Japan
-
f
Louisiana State University, Baton Rouge, LA, USA
-
g
also at University of Bucharest, Physics Department, Bucharest, Romania