60 candidate high-velocity stars originating from the Sagittarius dwarf spheroidal galaxy in Gaia EDR3
Abstract
Using proper motions from Gaia Early Data Release 3 (Gaia EDR 3) and radial velocities from several surveys, we identify 60 candidate high-velocity stars with total velocity greater than 75% escape velocity that probably origin from Sagittarius dwarf spheroidal galaxy (Sgr) by orbital analysis. Sgr’s gravity has little effect on the results and the Large Magellanic Cloud’s gravity has non-negligible effect on only a few stars. The closest approach of these stars to the Sgr occurs when the Sgr passed its pericenter ( 38.2 Myr ago), which suggest they were tidally stripped from the Sgr. The positions of these stars in the HR diagram and the chemical properties of 19 of them with available [Fe/H] are similar with the Sgr stream member stars. This is consistent with the assumption of their accretion origin. Two of the 60 are hypervelocity stars, which may also be produced by Hills mechanism.
1 introduction
High-velocity stars move so fast that it implies the presence of extreme dynamical processes. One type of high-velocity star is hypervelocity star (HVS), which has a extreme velocity above the escape velocity of the Milky Way. Hills (1988) first theoretically predicted the formation of HVS by close encounter between a binary system and the massive black hole (MBH) in the Galactic Center (GC). Yu & Tremaine (2003) analyze the ejection mechanism of single stars and a binary MBH and calculate the ejection rate. The first candidate HVS was discovered by Brown et al. (2005): a B-type star with a total velocity of 709 km s-1 in the Galactic halo. Recently, the Southern Stellar Stream Spectroscopic Survey () discovered the currently fastest HVS (Koposov et al., 2020): an A-type star with a total velocity of 1755 km s-1 located at a heliocentric distance of kpc, and its backward orbit was found to point unambiguously to the GC, providing a direct evidence to the Hills mechanism.
Runaway stars are another type of high-velocity stars, their velocity often point away from an OB association. One mechanism for producing a runaway star is to be ejected in binaries when its companion has exploded as a supernova (Blaauw, 1961; Tauris & Takens, 1998; Portegies Zwart, 2000; Wang & Han, 2009; Wang et al., 2013). Tauris (2015) investigated the ejection velocity of early and late type stars under this mechanism and they found that the upper limit of the ejection velocity of B-stars () can reach 550 km s-1 in the Galactic rest frame and that late-type stars are even faster. The other mechanism is ejected from a stellar system by the dynamical interactions (Poveda et al., 1967). Gvaramadze et al. (2009) explored the exchange encounters in the three-body system and found that the ejected star can obtain velocities of km s-1, depending on their mass. The discoveries of HVS US 708 (Geier et al., 2015) and HD 271791 (Heber et al., 2008) provide strong support of the two mechanisms.
Besides the mechanisms mentioned above, high-velocity stars could also be ejected by other mechanisms such as from the tidal debris of disrupted dwarf galaxies or gravitational slingshot effect (e.g., Boubert & Evans, 2016; García-Bellido, 2017; Montanari et al., 2019). Abadi et al. (2009) used simulations to predict HVS can be ejected from tidal disrupted dwarf galaxies. A close interaction between globular cluster and a single supermassive black hole or a binary supermassive black hole could lead to the ejection of high-velocity stars (Capuzzo-Dolcetta & Fragione, 2015; Fragione & Capuzzo-Dolcetta, 2016). The HVS HE 0437-5439 is suggested to be ejected from Large Magellanic Cloud (LMC) through Hills mechanism (Erkal et al., 2019a). Du et al. (2018, 2019) use Gaia and LAMOST data to discover that some high-velocity stars origin from the tidal debris of disrupted dwarf galaxies. Caffau et al. (2020) used the Gaia DR2 and VLT data to present the chemodynamical investigation of a 72 high-velocity sample stars and suggested that these stars can be the result of a disrupted small galaxy or globular cluster members. Marchetti (2021) derived that 7 high-velocity stars possibly origin from an extragalactic origin from Gaia EDR 3. All these results provide strong evidences that high-velocity stars origin from accreted and disrupted dwarf spheroidal galaxies. But most studies could not judge which dwarf galaxy or globular cluster these high-velocity stars origin from. Recently, Huang et al. (2021) discover a candidate HVS (J1443+1453) with a total velocity of 559 km s-1 that is probably from Sgr.
In this letter, we report the discovery of 60 candidate high-velocity stars, probably originated from the Sgr. Among them, 2 HVS candidates with extreme velocity that could be produced by the Hills mechanism, requiring a central MBH in the Sgr. This letter is organized as follows: in Section 2, we describe the method of assembling sample high-velocity stars. Section 3 explore the possible origin of sample stars by orbital analysis. Finally, we give a summary and discussion in Section 4.
2 samples
Gaia Early Data Release 3 (Gaia EDR3, Collaboration et al., 2021) provides positions, proper motions, and parallaxes for about 1.468 billion sources. It also contains radial velocities for about 7.21 million stars from Gaia DR2 (Collaboration et al., 2018). Furthermore, we cross-match Gaia EDR3 catalog with the Gaia-ESO DR4 (Gilmore et al., 2012; Randich et al., 2013), the Galactic Archaeology with HERMES (GALAH) DR3 (De Silva et al., 2015; Buder et al., 2021), low and medium resolution spectra (LRS and MRS) of Large Sky Area Multi-object Fiber Spectroscopic Telescope (LAMOST) DR9(Zhao et al., 2012; Cui et al., 2012; Liu et al., 2020), the Radial Velocity Experiment (RAVE) DR6 (Steinmetz et al., 2020a, b), the Sloan Digital Sky Surveys (SDSS) optical spectra DR17 (York et al., 2000; Yanny et al., 2009; Abdurro’uf et al., 2022), the Apache Point Observatory Galactic Evolution Experiment (APOGEE, Majewski et al., 2017) of SDSS DR17 and the Southern Stellar Stream Spectroscopic Survey () DR1 (Li et al., 2019) to supplement radial velocity information.
We select stars with RUWE, where RUWE (Renormalised Unit Weight Error) is a reliable and informative goodness-of-fit statistic in Gaia EDR3 (Lindegren et al., 2021). We use Lindegren et al. (2020) method to correct the Gaia EDR3 parallaxes () and remove stars . For spectroscopic data, we require S/N.
We use the median value of radial velocity () difference to correct the offset of other surveys relative to Gaia and the results are listed in Table 1.
The misestimation of radial velocity error is reported by many study (e.g., Cottaar et al., 2014; Tsantaki et al., 2022). Following the method outlined in Li et al. (2019), we use the mixture model
| (1) |
where is pairwise radial velocity differences, is the weight of first mixture component, and are the radial velocity error of the -th and -th observation respectively and is the outlier of radial velocity difference. The radial velocity correction function is , where is correction factor and is the floor error of radial velocity.
| Survey | offset | Method | ||
|---|---|---|---|---|
| km s-1 | km s-1 | |||
| LAMOST LRS | -5.11 | 0.81 | 0.0 | dupl |
| LAMOST MRS | -0.82 | 0.99 | 1.78 | dupl |
| APOGEE | -0.09 | 1.78 | 0.08 | dupl |
| RAVE | -0.32 | 0.92 | 0.89 | dupl |
| SDSS | 7.69 | 1.41 | 2.2 | dupl |
| S5 | -0.35 | - | - | - |
| GALAH | -0.32 | 2.92 | 0.31 | cross |
| Gaia-ESO | -0.3 | 3.33 | 0.0 | cross |
| Gaia | - | 1.56 | 0.3 | cross |
Note. — Column 1 is the survey name; Column 2 lists the radial velocity offset from Gaia; Columns 3-4 are the correction parameters applied in Equation 1; Column 5 gives the correction method used.
For surveys with at least 104 sources that contain multiple observations, we fit this model to multiple observations. The results are listed in Table 1 and the correction method of these surveys in Table 1 is set to “dupl”. In addition, the radial velocity error in S5 catalog has been corrected based on this method (Li et al., 2019).
We apply the similar method to other surveys. In Equation 1, the -th observation is from only one of the uncorrected surveys, and the -th observation is from all corrected surveys. The results are also listed in Table 1 and the method is marked as “cross”.
After applying the above corrections, we weight the radial velocity means by the inverse of its variance. Observations that deviate from the average by more than are removed. We only retain stars with the epoch number of radial velocity to ensure that the radial velocity can be considered as the systemic velocity of the system (Boubert et al., 2019).
To search for stars that originated from dwarf galaxies or globular clusters in our sample, we collect 50 dwarf galaxies and 160 globular clusters. 46 dwarf galaxies are referenced from Li et al. (2021). We add Leo T, Pegasus III, Phoenix I (McConnachie & Venn, 2020a) and Sgr (Fritz et al., 2018) to our dwarf galaxy sample. All 160 globular clusters are referenced from Vasiliev & Baumgardt (2021).
Heliocentric distances () and velocities in right ascension and declination direction ( and ) are derived using the Bayesian method (Luri et al., 2018). We use the posterior of Du et al. (2019) and replace the distance prior with the three-parameter Generalized Gamma Distribution (Bailer-Jones et al., 2021). The priors for both and are uniform. We use the Markov chain Monte Carlo (MCMC) sampler, emcee (Foreman-Mackey et al., 2013), to draw samples from the posterior probability. The distances and velocities of dwarf galaxies and globular clusters are calculated using the similar method. Due to high accuracy of their distance modulus and distance, we use uniform distributions as distance priors. In this study, we generate 2000 Monte Carlo (MC) realizations for each object (stars, dwarf galaxies and globular clusters) and use the median value to describe the results. The lower and upper uncertainties are the 16th and 84th percentiles of the probability distribution function.
We use the right-handed Cartesian Galactocentric coordinate system (Jurić et al., 2008). Here we adopt the distance of the Sun to the GC kpc (Gravity Collaboration et al., 2018) and the vertical distance from the Sun to the Galactic midplane pc (Jurić et al., 2008). The proper motions, radial velocities and distances are used to derived 3D velocities (, , ) in the right-handed coordinate system (Johnson & Soderblom, 1987).
To get a accurate high-velocity star sample, we select stars with and , where and are the Galactic total velocity and its error, is the escape velocity at in Eilers et al. (2019) potential model, which includes a Plummer (Binney & Tremaine, 1987) bulge, two Miyamoto-Nagai (Miyamoto & Nagai, 1975) disks and a NFW (Navarro et al., 1997) dark matter halo. By applying the above selection criteria, we obtain 1049 sample stars.
3 orbit analysis
To get some hints on the ejection location of our sample high-velocity stars, we study their orbit by adopting the potential model in Eilers et al. (2019) We use galpy (Bovy, 2015) to get the orbit of our Bayesian samples (stars, dwarf galaxies and globular clusters), and integrate orbit back in a total time of 1 Gyr. The gravity influence of dwarf galaxy and globular cluster is temporarily ignored.
We define the normalized distance from the star to the dwarf galaxy and to the globular cluster:
| (2) |
where is Galactocentric coordinates, is the Heliocentric distance, is the half-light radius and is the scale radius of the Plummer model (Vasiliev & Baumgardt, 2021). Most of are referenced from McConnachie & Venn (2020b) except Crater I (Laevens et al., 2014). The relative minimum value of is marked as . If there are multiple relative minima, we take the nth which maximizes the probability that the star originated from the dwarf galaxy or the globular cluster . This probability is defined as the fraction of MC realizations with .
There are 60 stars with , which means the probability of these stars originating from Sgr is greater than 50%. We have not found any stars with probability of originating from other dwarf galaxies or globular clusters greater than 50%. The maximum probability of originating from non-Sgr objects is 11.4% and this possible object is Antlia II with a half-light radius of 2.95 kpc. The maximum probability of that a star originates from globular clusters is 6.3%, and the possible source is Cen with a scale radius of 23 pc. To test the influence of Sgr’s large half-light radius, we create a “mirror” Sgr by reversing the sign of Sgr’s and . Base on the same method as above, we find 24 stars with , which is less than half of the number of stars originating from Sgr.
In order to further determine the link between these stars and Sgr, we use GIZMO (Springel, 2005; Hopkins, 2015) to take the gravity influence of Sgr into account by assuming a Keplerian potential with a total mass of for Sgr (Vasiliev & Belokurov, 2020). We select 215 stars with relative to Sgr, and repeat the above orbit analysis in a total time of 0.5 Gyr. The change of is very small, equivalent to several parsecs. This is approximately equal to the half-light radius of most globular clusters, therefore globular cluster is very sensitive to the gravitational potential. The probability of stars originating from a globular cluster is therefore greatly affected. But dwarf galaxies ( pc) are hardly affected.
The Large Magellanic Cloud (LMC) with a mass of (Erkal et al., 2019b) is an important gravitational source in the Milky Way. Its proper motions are referenced from Gaia Collaboration et al. (2020) and other parameters are from McConnachie & Venn (2020a). We also use the Bayesian method to obtains 2000 random samples. Because of its distance, it is considered a point source. For most of our selection of 215 stars, the change of is less than 100 pc compared to only considering the Sgr’s gravity. of dwarf galaxies with smaller half-light radius may be significantly affected. The change of for 8 stars is more than 1 kpc, and the maximum value is 7.9 kpc.
Finally, there are 60 stars with . The distribution of these stars in and space is shown in Figure 1. We also plot the escape velocity curve of four Milky Way potential models (Eilers et al., 2019; Cautun et al., 2020; McMillan, 2017; Bovy, 2015) as a function of Galactocentric distance in this figure.
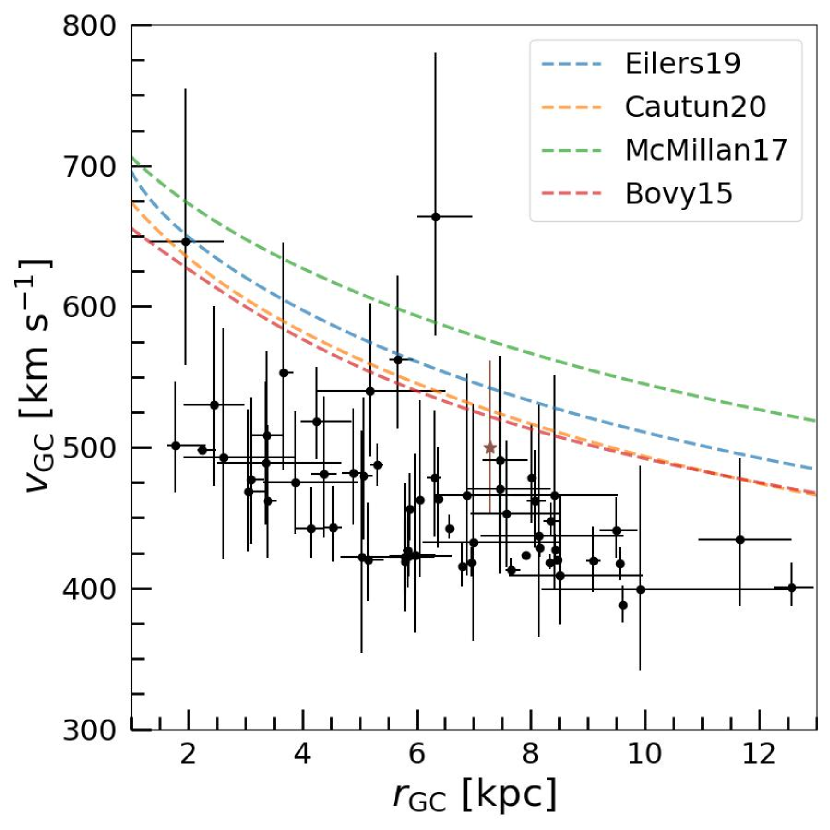
Figure 2 shows the properties of stars at the time of the closest approach. In the panel (a), we show the distribution of velocity difference versus half-light radius normalized distance between the star and the Sgr when they are the closest approach. We consider the velocity of the stars relative to Sgr as their ejection velocity . There are 2 stars with km s-1, such a fast velocity may be produced by the Hills mechanism (Hills, 1988; Bromley et al., 2006). The probability of an ejection is
| (3) |
where
| (4) |
where is the distance between the binary and the black hole when the close encounter, is the semi-major axis of the binary, are masses of the black hole and the binary, respectively. However, (i.e., in our study) is much larger than a reasonable binary semi-major axis for our candidate stars. This indicates , so . This does not mean that the Hills mechanism is not a reasonable explanation for the candidate Sgr HVSs, because the orbital uncertainty could increase to more than 175. The small error in suggests that statistical error is not the main reason. Additional gravitational influences may cause changes in the orbits of stars after they are ejected, such as the globular clusters associated with Sgr (Ibata et al., 1995, NGC 6715 (M54), Terzan 7, Arp 2 and Terzan 8) and Sgr stream. Therefore, the mass of the black hole cannot be estimated, which needs to be further studied by N-body simulations in the future.
Another ejection mechanism of high-velocity stars is the tidal disruption of the dwarf galaxy (Abadi et al., 2009). Their simulation shows that during the last time the dwarf galaxy passed through the pericenter, the velocity distribution of the stars in the tidal debris extends beyond the escape velocity. As shown in the panel (b) of Figure 2, the backward time of the closest approach and the Sgr passed its pericenter are close for 59 stars with (except one star with Myr). This is consistent with the results from Abadi et al. (2009). With the release of more high-precision data, we could discover more high-velocity stars from the accreted and disrupted dwarf spheroidal galaxies, which would help us better understand the property of dwarf galaxies and the history of the Milky Way’s accretion.
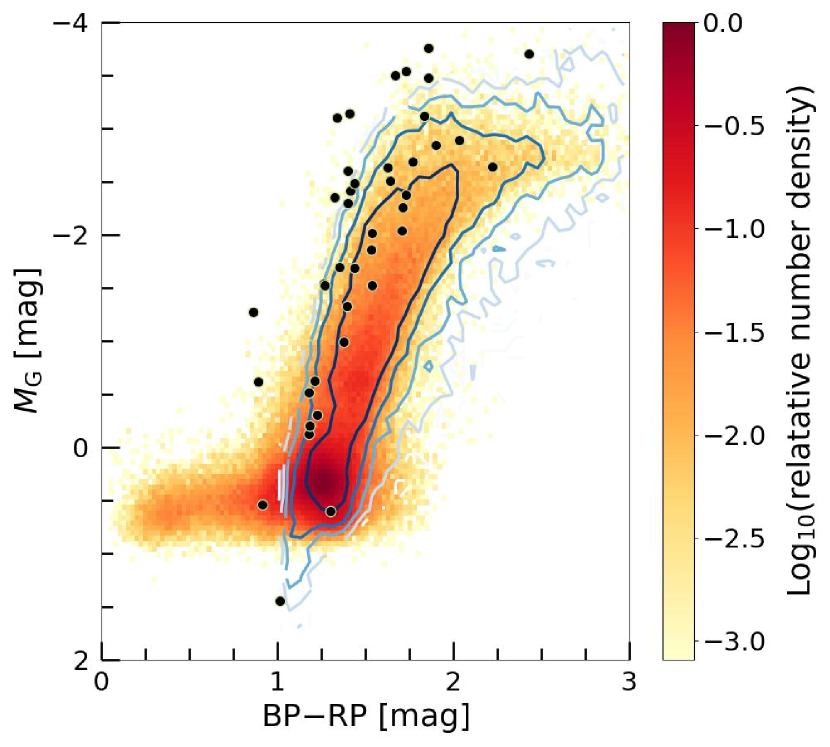
Figure 3 shows the Hertzsprung-Russell (HR) diagram for stars with the probability . The -axis is the color index in the Gaia BP-band and RP-band. The -axis is the Gaia G-band absolute magnitude, which is corrected by the extinction provided by (Green et al., 2019). All of them are late-type giant stars. As shown in this figure, these Sgr high-velocity stars are most similar to both Sgr and Sgr stream, but they are closer to Sgr stream relative to Sgr which is more concentrated at (, BPRP) = (0.5, 1.25). This suggests that these stars have a similar origin to Sgr stream.
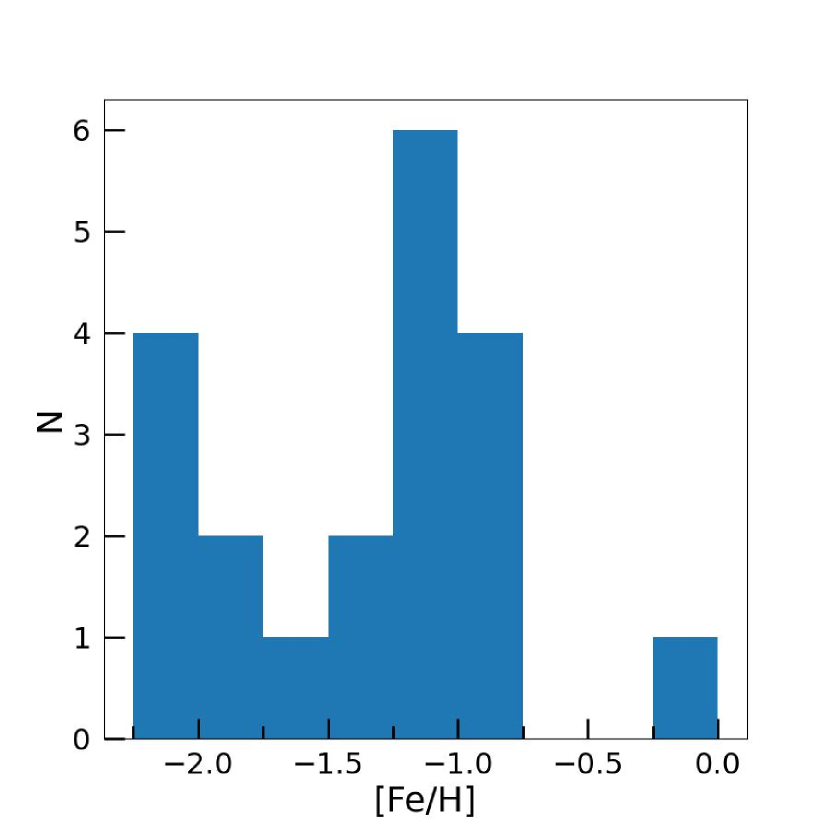
Of the 60 stars with , only 19 have metallicity information, the distribution is shown in the Figure 4. There are two peaks in this distribution. The first one is at [Fe/H], which is very close to the metallicity distribution of the Sgr stream (Hayes et al., 2020). This is consistent with the assumption that they are tidally stripped stars from the Sgr. The peak at [Fe/H] is close to the most metal-poor part of the Sgr stream, and they may originate from the Sgr halo. One metal-rich star ([Fe/H]) reaches the upper limit of the Sgr’s metallicity, and has a retrograde orbit. It is located at (, BPRP) = (0.6, 1.3) in Figure 3, very close to the densest region of Sgr (, BPRP) = (0.5, 1.25) and may be related to the most metal-rich part of Sgr.
Recently, Huang et al. (2021) discovered a candidate high-velocity star originating from Sgr. It is not included in our sample because its radial velocity based only on two epochs. We test this star using our method and find similar results. It is shown in Figure 1 and Figure 2. Our determined minimum distance kpc, the trace back time Myr and the velocity difference km s-1 correspond to their results: kpc, Myr and km s-1. This difference has little effect on dwarf galaxies with a large half-light radius like Sgr, but it may have effect for some dwarf galaxies with a small half-light radius.
4 summary and discussion
In this letter, based on the high-quality positions, proper motions and parallaxes of Gaia EDR3 combining with the radial velocity of several surveys, we define a high-velocity star sample with . By analyzing backward orbits, we investigate the links between these stars and 50 dwarf galaxies, 160 globular clusters. Finally, there are 60 stars that had a closest approach with Sgr and the encountering time is close to when Sgr reached its pericenter and all of them are late-type giants. A catalog of the properties of these stars is available at https://nadc.china-vo.org/res/r101121/.
The effect of the Sgr’s gravity can be ignored. Even further considering the gravity of the LMC, very few stars are significantly affected. The similarity of the 60 stars and Sgr stream in the HR diagram suggests they could from the Sgr. 19 of these stars with available [Fe/H] are also chemically similar to Sgr stream. Moreover, we found 2 hypervelocity stars with an ejection velocity km s-1. This extreme velocity can be produced by the Hills mechanism (Hills, 1988), but it is difficult to constrain the properties of black holes at the center of the Sgr.
Because Sgr has just passed its pericenter ( 38.2 Myr ago), we could expect to discover more high-velocity stars originated from Sgr with the release of more and more large surveys data. The details, such as number and velocity distribution, need to be studied using numerical simulations. This can help us study the interaction between Sgr and the Milky Way in the accretion event, which will provide important clues to the formation and evolution history of the Milky Way galaxy. On the other hand, most of the dwarf galaxies discovered are located near their pericenter (Li et al., 2021). This means that we can better study the high-velocity stars of tidal origin, and it is helpful to understand different ejection mechanisms of high-velocity stars.
References
- Abadi et al. (2009) Abadi, M. G., Navarro, J. F., & Steinmetz, M. 2009, ApJ, 691, L63, doi: 10.1088/0004-637X/691/2/L63
- Abdurro’uf et al. (2022) Abdurro’uf, Accetta, K., Aerts, C., et al. 2022, ApJS, 259, 35, doi: 10.3847/1538-4365/ac4414
- Bailer-Jones et al. (2021) Bailer-Jones, C. A. L., Rybizki, J., Fouesneau, M., Demleitner, M., & Andrae, R. 2021, AJ, 161, 147, doi: 10.3847/1538-3881/abd806
- Binney & Tremaine (1987) Binney, J., & Tremaine, S. 1987, Princeton, NJ, Princeton University Press, 1987, 747 p.
- Blaauw (1961) Blaauw, A. 1961, Bulletin of the Astronomical Institutes of the Netherlands, 15, 265
- Boubert & Evans (2016) Boubert, D., & Evans, N. W. 2016, ApJ, 825, L6, doi: 10.3847/2041-8205/825/1/L6
- Boubert et al. (2019) Boubert, D., Strader, J., Aguado, D., et al. 2019, MNRAS, 486, 2618, doi: 10.1093/mnras/stz253
- Bovy (2015) Bovy, J. 2015, ApJS, 216, 29, doi: 10.1088/0067-0049/216/2/29
- Bromley et al. (2006) Bromley, B. C., Kenyon, S. J., Geller, M. J., et al. 2006, ApJ, 653, 1194, doi: 10.1086/508419
- Brown et al. (2005) Brown, W. R., Geller, M. J., Kenyon, S. J., & Kurtz, M. J. 2005, ApJ, 622, L33, doi: 10.1086/429378
- Buder et al. (2021) Buder, S., Sharma, S., Kos, J., et al. 2021, MNRAS, 506, 150, doi: 10.1093/mnras/stab1242
- Caffau et al. (2020) Caffau, E., Monaco, L., Bonifacio, P., et al. 2020, A&A, 638, A122, doi: 10.1051/0004-6361/202038057
- Capuzzo-Dolcetta & Fragione (2015) Capuzzo-Dolcetta, R., & Fragione, G. 2015, MNRAS, 454, 2677, doi: 10.1093/mnras/stv2123
- Cautun et al. (2020) Cautun, M., Benítez-Llambay, A., Deason, A. J., et al. 2020, MNRAS, 494, 4291, doi: 10.1093/mnras/staa1017
- Collaboration et al. (2018) Collaboration, G., Brown, A. G. A., Vallenari, A., et al. 2018, A&A, 616, A1, doi: 10.1051/0004-6361/201833051
- Collaboration et al. (2021) —. 2021, A&A, 649, A1, doi: 10.1051/0004-6361/202039657
- Cottaar et al. (2014) Cottaar, M., Covey, K. R., Meyer, M. R., et al. 2014, ApJ, 794, 125, doi: 10.1088/0004-637X/794/2/125
- Cui et al. (2012) Cui, X.-Q., Zhao, Y.-H., Chu, Y.-Q., et al. 2012, RAA, 12, 1197, doi: 10.1088/1674-4527/12/9/003
- De Silva et al. (2015) De Silva, G. M., Freeman, K. C., Bland-Hawthorn, J., et al. 2015, MNRAS, 449, 2604, doi: 10.1093/mnras/stv327
- Du et al. (2018) Du, C., Li, H., Newberg, H. J., et al. 2018, ApJ, 869, L31, doi: 10.3847/2041-8213/aaf578
- Du et al. (2019) Du, C., Li, H., Yan, Y., et al. 2019, ApJS, 244, 4, doi: 10.3847/1538-4365/ab328c
- Eilers et al. (2019) Eilers, A.-C., Hogg, D. W., Rix, H.-W., & Ness, M. K. 2019, ApJ, 871, 120, doi: 10.3847/1538-4357/aaf648
- Erkal et al. (2019a) Erkal, D., Boubert, D., Gualandris, A., Evans, N. W., & Antonini, F. 2019a, MNRAS, 483, 2007, doi: 10.1093/mnras/sty2674
- Erkal et al. (2019b) Erkal, D., Belokurov, V., Laporte, C. F. P., et al. 2019b, MNRAS, 487, 2685, doi: 10.1093/mnras/stz1371
- Foreman-Mackey et al. (2013) Foreman-Mackey, D., Hogg, D. W., Lang, D., & Goodman, J. 2013, Publications of the Astronomical Society of the Pacific, 125, 306, doi: 10.1086/670067
- Fragione & Capuzzo-Dolcetta (2016) Fragione, G., & Capuzzo-Dolcetta, R. 2016, MNRAS, 458, 2596, doi: 10.1093/mnras/stw531
- Fritz et al. (2018) Fritz, T. K., Battaglia, G., Pawlowski, M. S., et al. 2018, A&A, 619, A103, doi: 10.1051/0004-6361/201833343
- Gaia Collaboration et al. (2020) Gaia Collaboration, Luri, X., Chemin, L., et al. 2020, arXiv:2012.01771 [astro-ph]. https://arxiv.org/abs/2012.01771
- García-Bellido (2017) García-Bellido, J. 2017, 840, 012032, doi: 10.1088/1742-6596/840/1/012032
- Geier et al. (2015) Geier, S., Fürst, F., Ziegerer, E., et al. 2015, Science, 347, 1126, doi: 10.1126/science.1259063
- Gilmore et al. (2012) Gilmore, G., Randich, S., Asplund, M., et al. 2012, The Messenger, 147, 25
- Gravity Collaboration et al. (2018) Gravity Collaboration, Abuter, R., Amorim, A., et al. 2018, A&A, 615, L15, doi: 10.1051/0004-6361/201833718
- Green et al. (2019) Green, G. M., Schlafly, E., Zucker, C., Speagle, J. S., & Finkbeiner, D. 2019, ApJ, 887, 93, doi: 10.3847/1538-4357/ab5362
- Gvaramadze et al. (2009) Gvaramadze, V. V., Gualandris, A., & Portegies Zwart, S. 2009, MNRAS, 396, 570, doi: 10.1111/j.1365-2966.2009.14809.x
- Hayes et al. (2020) Hayes, C. R., Majewski, S. R., Hasselquist, S., et al. 2020, ApJ, 889, 63, doi: 10.3847/1538-4357/ab62ad
- Heber et al. (2008) Heber, U., Edelmann, H., Napiwotzki, R., Altmann, M., & Scholz, R.-D. 2008, A&A, 483, L21, doi: 10.1051/0004-6361:200809767
- Hills (1988) Hills, J. G. 1988, Nature, 331, 687, doi: 10.1038/331687a0
- Hopkins (2015) Hopkins, P. F. 2015, MNRAS, 450, 53, doi: 10.1093/mnras/stv195
- Huang et al. (2021) Huang, Y., Li, Q., Zhang, H., et al. 2021, ApJ, 907, L42, doi: 10.3847/2041-8213/abd413
- Ibata et al. (1995) Ibata, R. A., Gilmore, G., & Irwin, M. J. 1995, MNRAS, 277, 781, doi: 10.1093/mnras/277.3.781
- Johnson & Soderblom (1987) Johnson, D. R. H., & Soderblom, D. R. 1987, AJ, 93, 864, doi: 10.1086/114370
- Jurić et al. (2008) Jurić, M., Ivezić, Ž., Brooks, A., et al. 2008, ApJ, 673, 864, doi: 10.1086/523619
- Koposov et al. (2020) Koposov, S. E., Boubert, D., Li, T. S., et al. 2020, MNRAS, 491, 2465, doi: 10.1093/mnras/stz3081
- Laevens et al. (2014) Laevens, B. P. M., Martin, N. F., Sesar, B., et al. 2014, ApJ, 786, L3, doi: 10.1088/2041-8205/786/1/L3
- Li et al. (2021) Li, H., Hammer, F., Babusiaux, C., et al. 2021, ApJ, 916, 8, doi: 10.3847/1538-4357/ac0436
- Li et al. (2019) Li, T. S., Koposov, S. E., Zucker, D. B., et al. 2019, MNRAS, 490, 3508, doi: 10.1093/mnras/stz2731
- Lindegren et al. (2020) Lindegren, L., Bastian, U., Biermann, M., et al. 2020, arXiv e-prints, arXiv:2012.01742
- Lindegren et al. (2021) Lindegren, L., Klioner, S. A., Hernández, J., et al. 2021, A&A, 649, A2, doi: 10.1051/0004-6361/202039709
- Liu et al. (2020) Liu, C., Fu, J., Shi, J., et al. 2020, arXiv e-prints, arXiv:2005.07210
- Luri et al. (2018) Luri, X., Brown, A. G. A., Sarro, L. M., et al. 2018, A&A, 616, A9, doi: 10.1051/0004-6361/201832964
- Majewski et al. (2017) Majewski, S. R., Schiavon, R. P., Frinchaboy, P. M., et al. 2017, AJ, 154, 94, doi: 10.3847/1538-3881/aa784d
- Marchetti (2021) Marchetti, T. 2021, MNRAS, 503, 1374, doi: 10.1093/mnras/stab599
- McConnachie & Venn (2020a) McConnachie, A. W., & Venn, K. A. 2020a, Research Notes of the American Astronomical Society, 4, 229, doi: 10.3847/2515-5172/abd18b
- McConnachie & Venn (2020b) —. 2020b, AJ, 160, 124, doi: 10.3847/1538-3881/aba4ab
- McMillan (2017) McMillan, P. J. 2017, MNRAS, 465, 76, doi: 10.1093/mnras/stw2759
- Miyamoto & Nagai (1975) Miyamoto, M., & Nagai, R. 1975, Publications of the Astronomical Society of Japan, 27, 533
- Montanari et al. (2019) Montanari, F., Barrado, D., & García-Bellido, J. 2019, MNRAS, 490, 5647, doi: 10.1093/mnras/stz2959
- Navarro et al. (1997) Navarro, J. F., Frenk, C. S., & White, S. D. M. 1997, ApJ, 490, 493, doi: 10.1086/304888
- Portegies Zwart (2000) Portegies Zwart, S. F. 2000, ApJ, 544, 437, doi: 10.1086/317190
- Poveda et al. (1967) Poveda, A., Ruiz, J., & Allen, C. 1967, Boletin de los Observatorios Tonantzintla y Tacubaya, 4, 86
- Randich et al. (2013) Randich, S., Gilmore, G., & Gaia-ESO Consortium. 2013, The Messenger, 154, 47
- Springel (2005) Springel, V. 2005, MNRAS, 364, 1105, doi: 10.1111/j.1365-2966.2005.09655.x
- Steinmetz et al. (2020a) Steinmetz, M., Matijevič, G., Enke, H., et al. 2020a, AJ, 160, 82, doi: 10.3847/1538-3881/ab9ab9
- Steinmetz et al. (2020b) Steinmetz, M., Guiglion, G., McMillan, P. J., et al. 2020b, AJ, 160, 83, doi: 10.3847/1538-3881/ab9ab8
- Tauris (2015) Tauris, T. M. 2015, MNRAS, 448, L6, doi: 10.1093/mnrasl/slu189
- Tauris & Takens (1998) Tauris, T. M., & Takens, R. J. 1998, A&A, 330, 1047
- Tsantaki et al. (2022) Tsantaki, M., Pancino, E., Marrese, P., et al. 2022, A&A, 659, A95, doi: 10.1051/0004-6361/202141702
- Vasiliev & Baumgardt (2021) Vasiliev, E., & Baumgardt, H. 2021, MNRAS, 505, 5978, doi: 10.1093/mnras/stab1475
- Vasiliev & Belokurov (2020) Vasiliev, E., & Belokurov, V. 2020, MNRAS, 497, 4162, doi: 10.1093/mnras/staa2114
- Vasiliev et al. (2021) Vasiliev, E., Belokurov, V., & Erkal, D. 2021, MNRAS, 501, 2279, doi: 10.1093/mnras/staa3673
- Wang & Han (2009) Wang, B., & Han, Z. 2009, A&A, 508, L27, doi: 10.1051/0004-6361/200913326
- Wang et al. (2013) Wang, B., Justham, S., & Han, Z. 2013, A&A, 559, A94, doi: 10.1051/0004-6361/201322298
- Yanny et al. (2009) Yanny, B., Rockosi, C., Newberg, H. J., et al. 2009, AJ, 137, 4377, doi: 10.1088/0004-6256/137/5/4377
- York et al. (2000) York, D. G., Adelman, J., Anderson, Jr., J. E., et al. 2000, AJ, 120, 1579, doi: 10.1086/301513
- Yu & Tremaine (2003) Yu, Q., & Tremaine, S. 2003, ApJ, 599, 1129, doi: 10.1086/379546
- Zhao et al. (2012) Zhao, G., Zhao, Y.-H., Chu, Y.-Q., Jing, Y.-P., & Deng, L.-C. 2012, RAA, 12, 723, doi: 10.1088/1674-4527/12/7/002