SKTR: Trace Recovery from Stochastically Known Logs
Abstract
Developments in machine learning together with the increasing usage of sensor data challenge the reliance on deterministic logs, requiring new process mining solutions for uncertain, and in particular stochastically known, logs. In this work we formulate trace recovery, the task of generating a deterministic log from stochastically known logs that is as faithful to reality as possible. An effective trace recovery algorithm would be a powerful aid for maintaining credible process mining tools for uncertain settings. We propose an algorithmic framework for this task that recovers the best alignment between a stochastically known log and a process model, with three innovative features. Our algorithm, , 1) handles both Markovian and non-Markovian processes; 2) offers a quality-based balance between a process model and a log, depending on the available process information, sensor quality, and machine learning predictiveness power; and 3) offers a novel use of a synchronous product multigraph to create the log. An empirical analysis using five publicly available datasets, three of which use predictive models over standard video capturing benchmarks, shows an average relative accuracy improvement of more than over a common baseline.
I Introduction
Process logs constitute an essential element of process mining tasks. 111https://www.processmining.org/event-data.html#data They serve as the basis to process discovery, enable conformance checking, and their reliability determines to a great extent the success of process enhancement. Process log capturing has seen a great transformation in recent years, from a meticulous update in an information system using the caring hands of human clerks to semi and fully automatic activity capturing from sensors, keyboard strokes, and video clips [1]. Such capturing methods challenge the common reliance of process mining on deterministic logs [2]. For example, consider log discovery from video clips. Activity identification in video clips using deep learning is typically based on choosing an activity with the highest likelihood from a prediction layer called the softmax layer, which provides a distribution over possible activities. By deterministically selecting a single activity, even if its likelihood is higher than other possible activities, the log becomes a biased representation of reality.
A recent line of work considers uncertain event logs [3, 2, 4], where uncertainty can be associated with timestamps, activities, etc. Going back to the video capturing example, using stochastically known (SK) logs [2], the softmax layer can serve as input, where activities in a trace are assigned a probability value, approximated using the softmax layer.
Modeling process logs as SK logs leads to the challenge we tackle in this work, that of identifying a true trace out of several possible realizations, each of which can be associated with different managerial and operational implications (e.g., resource allocation and decision making). Therefore, credible decision making vis-à-vis process management requires recovering the original event-log traces.
In this work we focus on trace recovery, a challenging process mining task [5] involving the accurate selection of the log realization that represents the true occurrence from an SK log. Accordingly, given a process model and an SK log, we introduce the Stochastically Known Trace Recovery (SKTR) algorithm that recovers deterministic traces with the aim of maximizing the similarity between a recovered log and a log that represents the actual occurrence of activities in reality. A challenging aspect of this approach involves the quality of the process models, both conceptual and data-driven [6]. Process models depend heavily on the inputs and parameters that shape them, requiring modelers’ domain expertise and high quality of execution data. Designer’s choice of a discovery algorithm also affect the model’s quality. To overcome this hurdle, we introduce a flexible approach that can align a trace recovery process with the amount of trust we assign to the available reference process model and the SK log.
This work makes a threefold contribution:
-
(1)
From a modeling viewpoint (Section II), the suggested approach can represent varying levels of trust in the process model and the log. We show that in stochastic settings with imprecise data, the role of process models is more important for recovery of the original log. Our approach uses cost functions to reflect levels of trust in the model and log, considering frequent and infrequent model paths. We discuss how to map probabilities into costs and explore the properties and performance of several linear and non-linear cost functions.
-
(2)
From an algorithmic perspective (Section III), we develop SKTR, a novel approach to recover an SK log, using a probability-aware conformance checking algorithm [4]. We propose a novel use of a synchronous product multigraph to capture alternative trace, model, and synchronous moves as well as their probabilities. SKTR handles Markovian and non-Markovian (path dependent) probabilities, where the latter can improve the recovery accuracy. Through analytical insights and an empirical evaluation, we demonstrate that SKTR achieves high accuracy in trace recovery under varying conditions and that it is highly preferable compared to several machine learning and process mining baselines.
-
(3)
From an empirical viewpoint (Section IV), we demonstrate an average relative accuracy improvement of more than over a common baseline and analyze the impact of various parameters, such as discovered process model quality and the stochastic noise within the event log, on recovery accuracy.
Related work is discussed in Section V and Section VI concludes the paper and discusses future research directions.
II Model
We start by describing an SK environment and position our search for a cost model within this context. We adopt the notation of [2] [2] who characterized environments of interest as either Deterministically known (DK) or SK. DK refers to a process model or an event log that are deterministic (e.g., a supervised dataset), and SK to a known probability distribution of event attribute values in an event log (e.g., predicted activity names for a trace event). Accordingly, for an SK trace, the probability distribution of each event to be classified as one of the possible activities is known.
| Case# | Event# | Activity | Timestamp |
|---|---|---|---|
| 1 | 03-06-2022T12:00 | ||
| 1 | 03-06-2022T14:55 | ||
| 1 | 04-06-2022T17:39 |
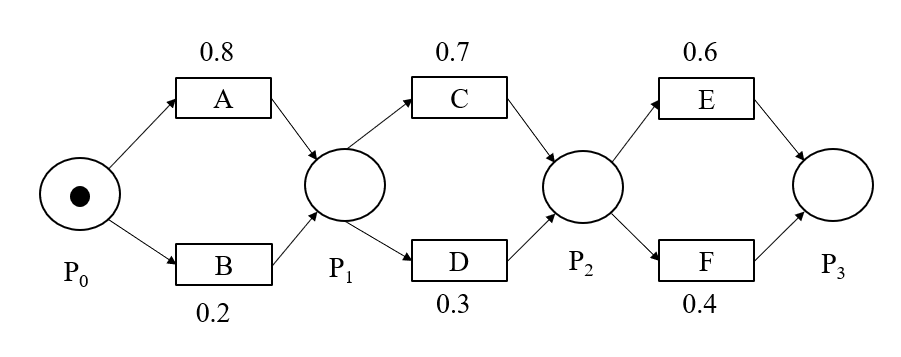
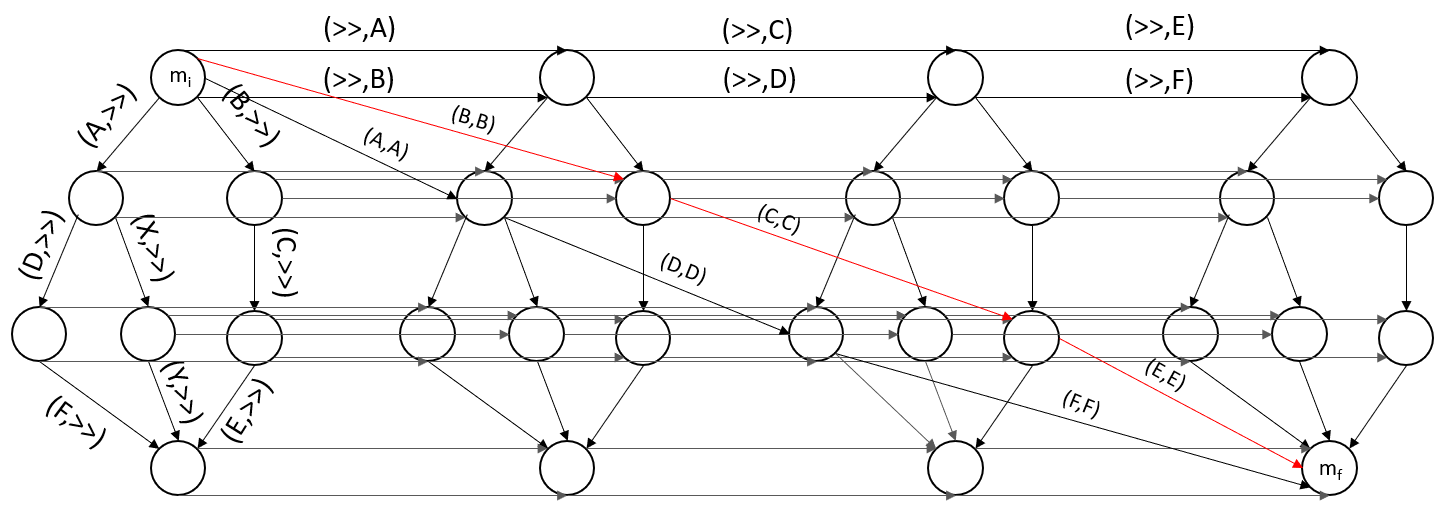
Table I presents an excerpt from an SK log. Each entry consists of a case identifier, an event identifier, a probabilistic distribution over possible activities, and a timestamp. For example, event may relate to activity with a probability of and activity with a probability of . The corresponding stochastic trace model (see [4], Definition 1) is presented in Figure 1.
In this work, we seek to recover traces using a process model that can be either human generated or discovered from an event log. For the latter, we shall assume that the model was discovered from a DK log, where no uncertainty exists. [6] [6] highlighted the role of process quality in conformance checking and, in line with this reasoning, we argue that in stochastic settings, recovered traces depend heavily on the quality of the process model, with a trade-off between fitness and precision. A low fitting model can result in rejecting true activity labels within a non conforming trace. A low precision model can result in recovering wrong activity labels if such activities are possible according to the model. The recovered trace depends also on data quality. On one extreme, if the quality of sensor data is high than data can be trusted and the importance of a reference process model decreases. On the other extreme, if data are imprecise and the model is of high quality, the role of the model in determining the true trace increases. Oftentimes, we place our trust somewhere between these extremes.
Given our aim to recover deterministic traces from an SK log and our intention to use possibly unreliable process models and data, we seek a mechanism to control the reliance of trace recovery algorithms on process models, based on their quality. Consider stochastic conformance checking algorithms [4], where for each set of alternative transitions that represent nonsynchronous trace moves, the algorithm moves forward with a single randomly chosen transition while ignoring the remaining transitions. The random selection among alternative transitions stems from the fact that the default weight of nonsynchronous moves in conformance checking is set to 1 (both in deterministic and stochastic settings, see [4]). Therefore, no transition that forms nonsynchronous moves is preferred, regardless of its probability to be part of a more likely activity sequence. Ignoring alternative nonsynchronous moves, however, may influence the trace recovery accuracy.
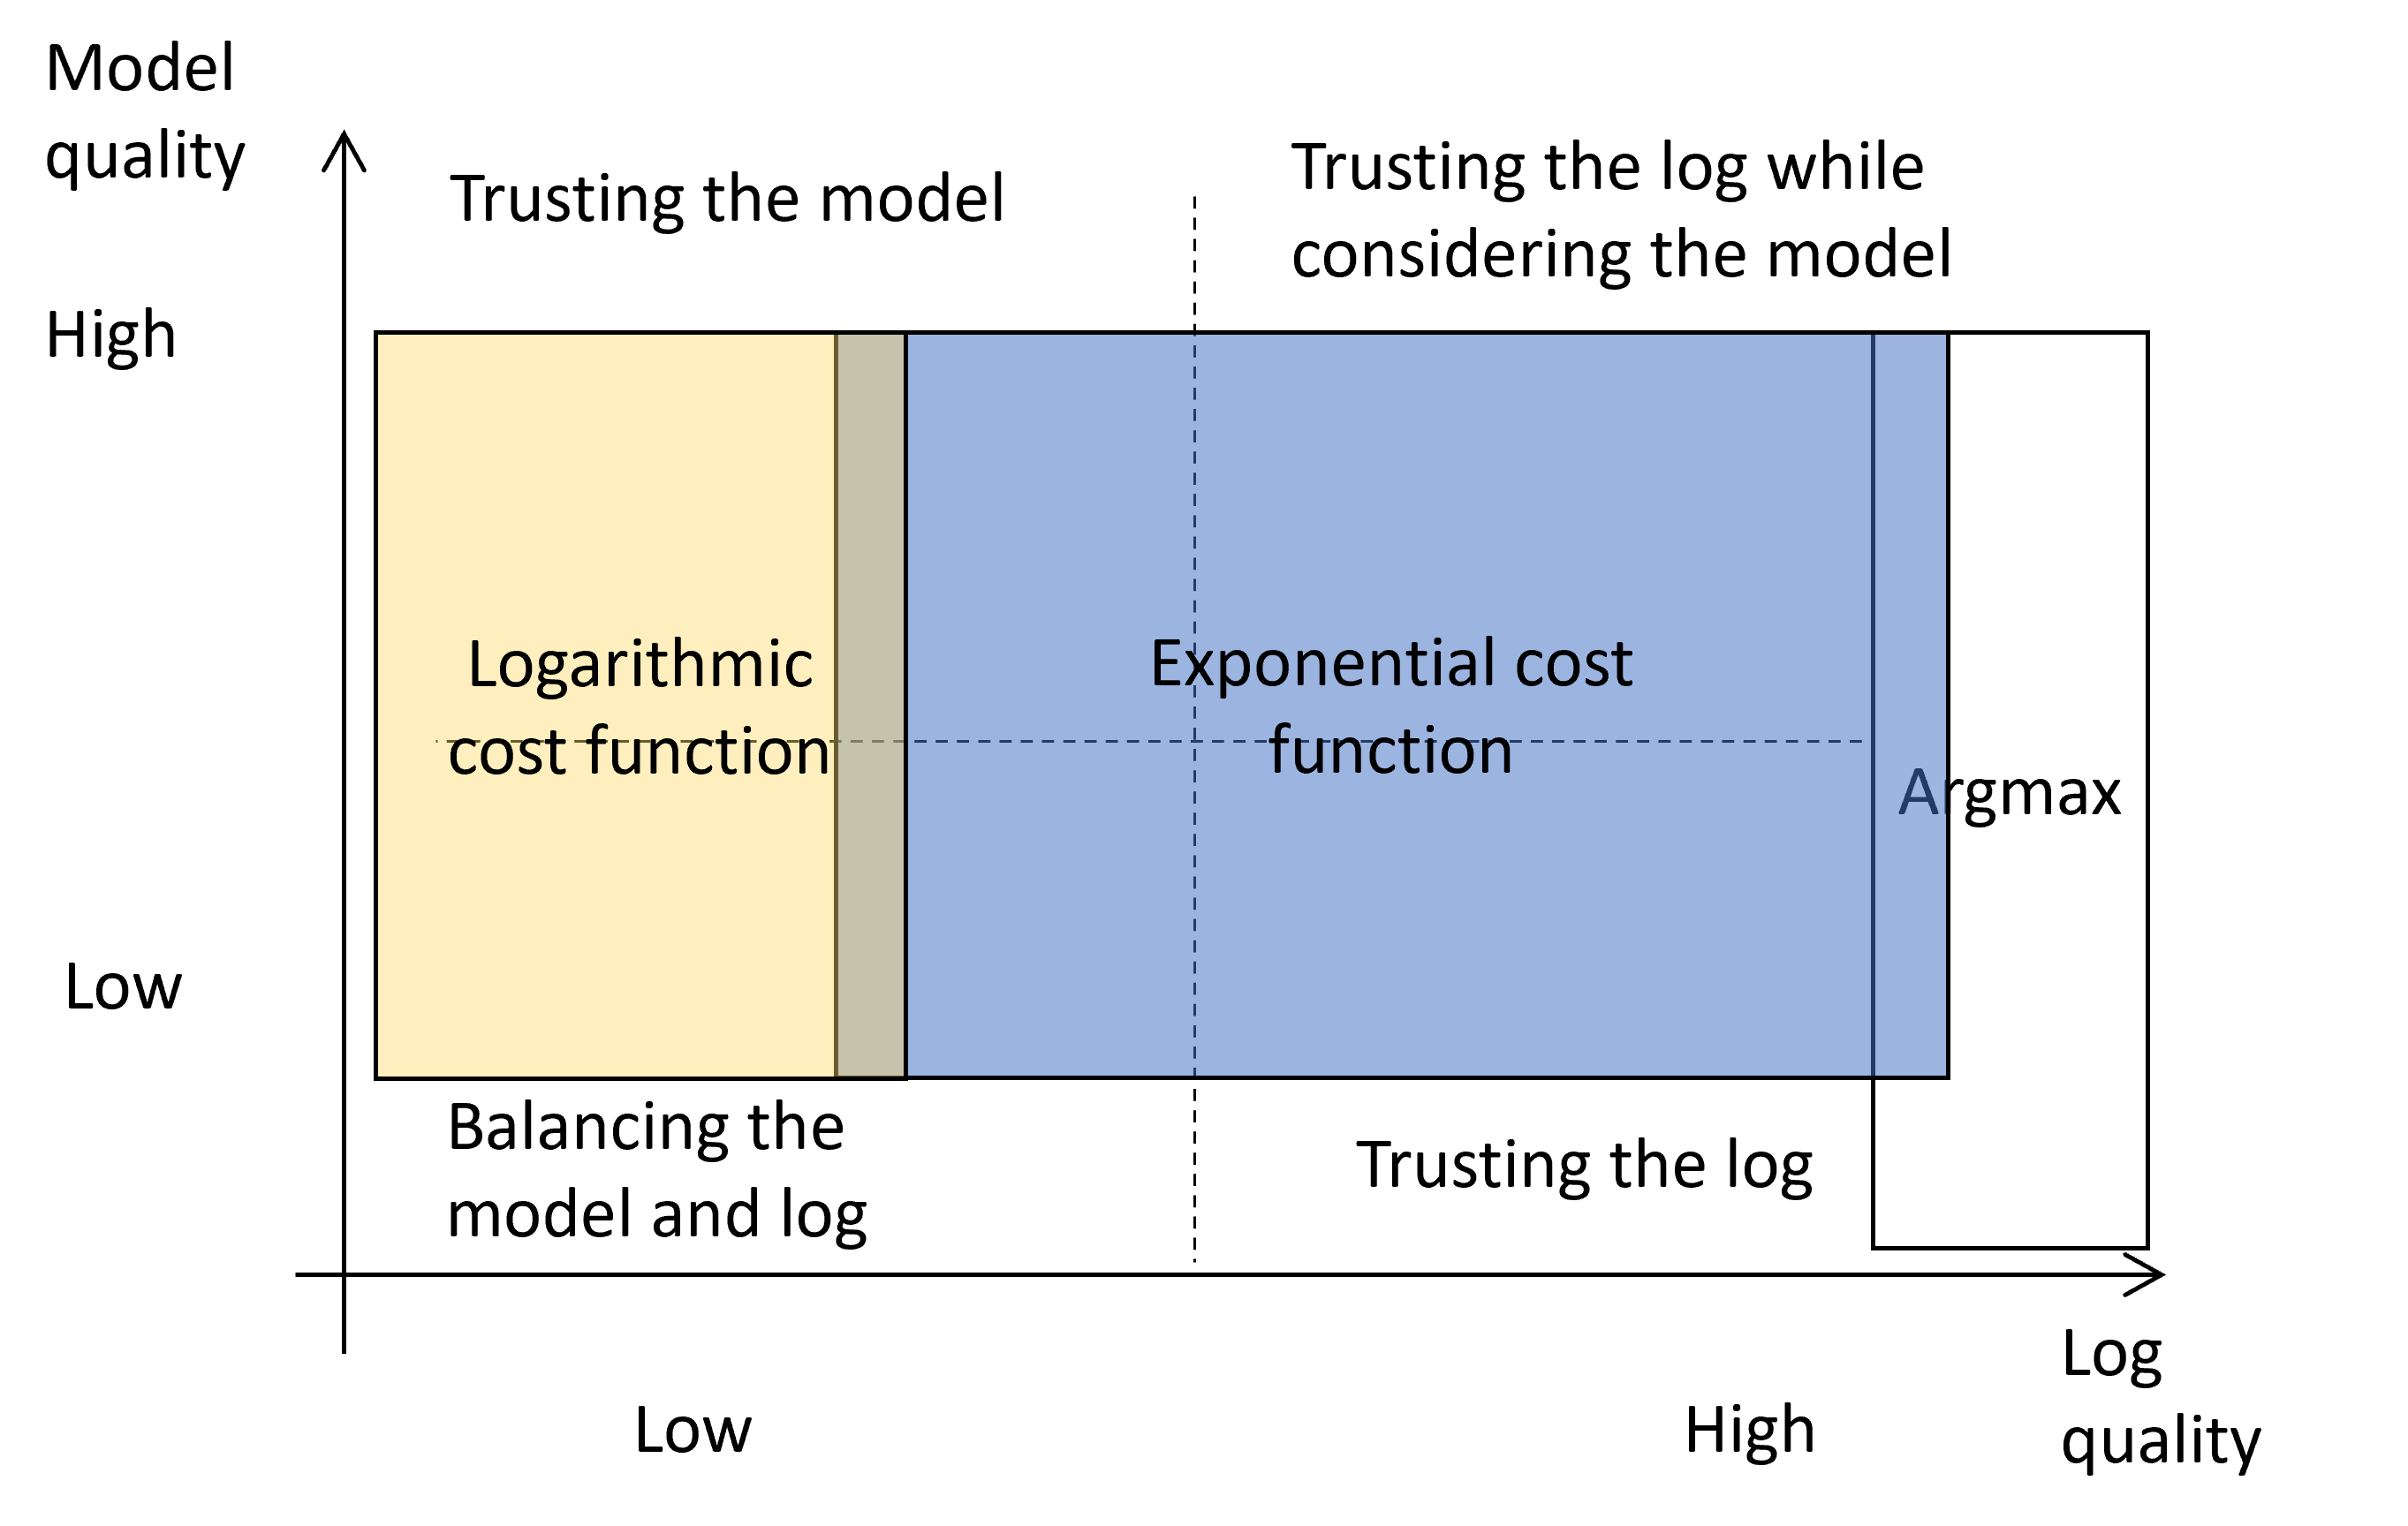
We use cost functions to reflect the trust in the model vs. the stochastic trace (Figure 2(a)) and calculate the cost value by each function as a function of the probability of an activity (Figure 2(b)). Today, Argmax is the most commonly used heuristic for generating a prediction from a softmax layer. Our cost functions, however, eliminate the need to use an Argmax heuristic that ignores the process model by choosing, for each event in an SK trace, the activity label associated with the highest probability. Had we applied an Argmax heuristic on the SK trace in Table I we would have generated the trace .
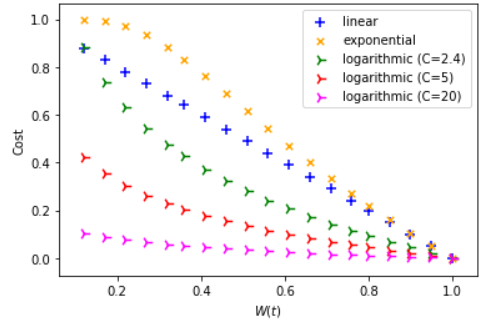
[4] [4] suggested an exponential cost function for stochastic conformance checking, where and are the cost of an edge on the reachability graph and the probability of a transition , respectively. In addition, they introduced a linear cost function , and a logarithmic function , where is a normalization constant such that costs that correspond to a synchronous move do not exceed . The difference between these functions, as illustrated in Figure 2(b), is the rate at which they induce an additional cost as the probability of a transition decreases. The costs induced by the exponential and linear functions are similar for higher probabilities (e.g., ) while for smaller probabilities (e.g., ) the exponential function penalizes uncertainty to a larger degree. As the probability approaches , the penalty given by both functions approaches . In contrast, the normalized logarithmic function is more “forgiving,” penalizing uncertainty to a lesser degree (on average) compared to the other two functions, thus trusting the model more. The constant factor can be used to fine-tune the “forgiveness” of the cost function since the penalty magnitude decreases with values across all probability values.
III SKTR Algorithm
We now introduce SKTR (Algorithm 1), inspired by an alignment-based conformance checking approach [4]. It takes as input a stochastic trace model and a process model , constructs (Line 1) a stochastic synchronous product (see [4] for a formal definition) and a corresponding reachability multigraph (Line 1, Section III-A), and searches for an optimal alignment (Lines 1–1, Sections III-B–III-D). The initialization stage involves hyperparameter settings based on the guidelines presented in Section II for selecting the cost function, calculations to determine the sequence–probability mapping, and via exploration–exploitation, testing and grid search (see examples in [7]) for the history length and trade-off parameters.
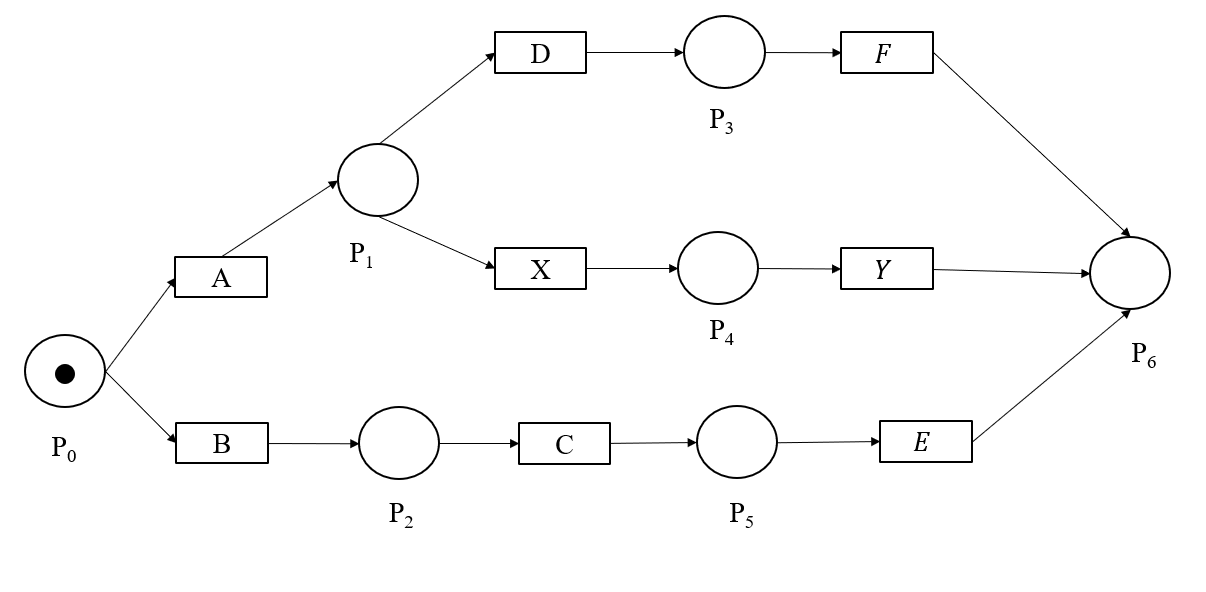
Consider, for example, the stochastic trace in Table I, its stochastic model (Figure 1), and the process model in Figure 3. SKTR recovers the trace from the optimal alignment by removing the skip symbol aligned with a model’s move. The recovered trace is different than the Argmax prediction (see Section II). If the process model reflects reality faithfully, we can conclude that the Argmax heuristic offers an inferior prediction since is not valid according to the model. This depends on the process model’s quality since a process model with low fitness may not conform with the aforementioned trace, while the trace may be possible in reality.
III-A Constructing a Reachability Multigraph
We denote the stochastic synchronous product , where . Alternative nonsynchronous moves affect the trace recovery accuracy. Thus, we transform , given and , into a reachability multigraph in which optimal alignment is searched over all alternative transitions rather than randomly selecting one that participates in a nonsynchronous move. is constructed such that two markings and , which are two nodes in the graph, have an edge between them if and only if there is a corresponding transition within the . Differently from a deterministic setting,in an SK trace there may be more than a single edge connecting two adjacent places.
III-B Searching the Reachability Multigraph
The algorithm searches over the reachability multigrpah (Lines 1-1) for the shortest (cheapest) path between and , using or , while enabling transition differentiation by altering edge weights (costs) within the the graph. During the search, SKTR evaluates the multigraph edges. A weight of is assigned to edges that correspond to nonsynchronous moves. The edge weights that correspond to synchronous moves are computed according to their probability in the and the chosen cost function. Each time the algorithm encounters such an edge, it computes a final weight based on its original weight and the probability of the sequence of activities that lead to this edge (see Section III-C), which is added to the overall alignment weight for the selected edge. The search procedure, when executed on the running example, yields the path marked in red in Figure 4.
III-C Computing Sequence–Probability
We now show how SKTR uses history to improve trace recovery accuracy. Conformance checking implicitly assumes that to compute the cost of a transition it is sufficient to know the preceding marking in the synchronous product and, in a stochastic setting, also the probability associated with the considered trace event. This assumption ignores the likelihood of an activity happening, which depends on activities that have already happened and their ordering. We should, therefore, take into account the firing sequence of preceding transitions. Take for example a simple process model that permits four firing sequences: , , , and . The underlying Petri net of such a process would allow for activities and to be executed in any order, after which activity or would occur. Based only on the process model, one cannot predict the transition that follows and (in any order) better than a random guess. On the other hand, assuming that trace occurred 99 times, once, 98 times, and the appeared twice, it would be much more likely that would following the sequence , and would follow . Probabilities of such sequences could be estimated from the process log and used during the search for an optimal alignment, as discussed next.
Let be a transition firing sequence. Let be the set of all observed sub-sequences between and followed by , ( where ). By extension, is the set of all sub-sequences in of size up to (the computational effort for each trace is bounded by ). Given a supervised part of a log, we can compute occurrence probabilities of all sub-sequences, termed histories. To illustrate, consider a log with two traces, and . By arbitrarily choosing we get , and . Note that the sum of probabilities for each history with identical length and labels for the sequence between and is , allowing to calculate the conditional probability for each observed label. The sequence–probability mapping for our example is:
The probability of any sub-sequence (e.g., ) is where refers to the number of times such a sequence appears in the log.
III-D Using Sequence–Probability Mapping Within SKTR
To demonstrate how to use probability mapping for trace recovery, consider edge , which corresponds to activity , and assume that the path to was preceded by three edges, corresponding to activities in that order. If is a nonsynchronous move, its weight would be 1 for any preceding activity sequence (Lines 1–1). Otherwise, corresponds to a synchronous move – in which case, we look for the longest available sequence of ’s preceding activities in our sequence–probability mapping. For example, based on the sequence probabilities computed in Section III-C, the sub-sequence is not recognizable by since . When we remove the farthest away activity that precedes from the sequence, we get , which is recognized by with a probability . The final weight of the edge is computed as follows: where is a hyperparameter that allocates the cost of the edge between its probability and the path from which it was reached, and is the selected cost function. If we do not want to consider history (i.e., ) or no sub-sequence was recognized by , then the cost of the edge is determined by its probability .
IV Empirical Evaluation
We use five publicly available datasets to evaluate the performance of SKTR . With BPI 2012 and BPI 2019 we test our approach by inserting controlled uncertainty similar to earlier works (e.g., [4] and [8]). Three food preparation process videos, namely Breakfast, 50 salads, and GTEA, serve as popular benchmarks for machine learning algorithms. Log uncertainty for these benchmarks stems from applying a state-of-the-art machine learning algorithm to segment a temporally untrimmed video by time and label each segment with an activity. To the best of our knowledge, this paper is the first to apply process mining to real-life uncertain datasets.
We adopt the widely accepted accuracy performance measure as the main performance measure for this task. Overall performance comparison (Section IV-A) is followed by a separate discussion of experiments on the BPI datasets (Section IV-B) and the video datasets (Section IV-C).
IV-A SKTR Overall Performance
Table II compares the performance of SKTR (Algorithm 1) and the Argmax heuristic (with ASFormer network [9] for the video datasets) over 30 experiments. SKTR shows a significant average accuracy improvement over the baseline method (p-values of paired one-sided t-tests were ) with an improvement of about on average across all datasets.
| Algorithm | Breakfast | 50Salads | GTEA | BPI2012 | BPI2019 |
|---|---|---|---|---|---|
| Argmax | 0.70 | 0.83 | 0.73 | 0.78 | 0.80 |
| SKTR | 0.81 | 0.89 | 0.79 | 0.92 | 0.82 |
| improvement | 15.7% | 7.2% | 8.2% | 17.9% | 2.5% |
IV-B Experiments with BPI Datasets
Experiments with the BPI datasets were designed to reveal insights about SKTR performance under varying levels of uncertainty, model quality, and different cost functions. Due to space considerations, we present results for the BPI 2012 dataset. Data preparation procedures and results were similar for BPI 2019.
IV-B1 Data Preparation and Preprocessing
To prepare the uncertain log, we controlled the following parameters:
-
(1)
, which sets the probability of the original transition to be assigned the highest probability among its set of alternative transitions. For example, setting will result in each original transition being assigned the highest probability approximately half of the time; otherwise, the highest probability is assigned to an alternative transition.
-
(2)
is the number of traces used for process model discovery. Typically, low values would lead to low fitness and high precision, and high values would increase fitness and decrease precision.
We randomly chose traces for process model discovery, and another 2000 random traces to test SKTR (and Argmax). We generated noise within each trace by adding to each transition within it all activity labels as alternative transitions. The probability mass was divided among the set of alternative transitions according to starting with . In each iteration we added a probability of 0.05 to and regenerated the noise within each trace. In essence, we start from a DK trace and add noise in a structured way. Then, we evaluate whether the SK traces can be recovered by applying SKTR. We compared the results with the Argmax heuristic that chooses from each set of alternative transitions the one with the highest probability. Argmax is commonly used to resolve the probability matrix in deep neural networks and to determine their final classification. We evaluate the recovery performance based on the accuracy measure as follows – given an SK trace, we determine its recovered trace using SKTR or Argmax and compare each recovered trace to its original DK trace. Accuracy is calculated by averaging the recovery accuracy of each trace. We repeated each setting 30 times and averaged the results.
IV-B2 Results
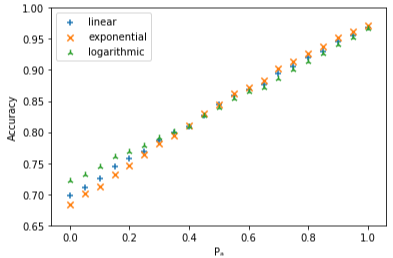
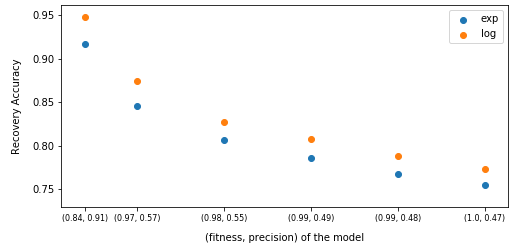
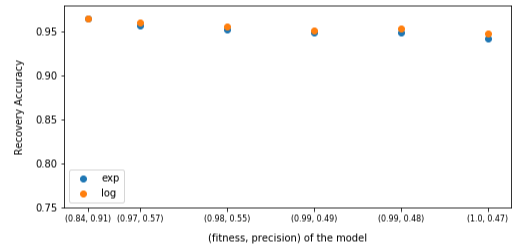
Figure 5 summarizes the results and identifies conditions under which a specific cost function may affect trace recovery performance. Figure 5(a) compares cost functions under varying log qualities (varying values) and a model that was discovered by dusing (preliminary experiments indicate that this number achieves high recovery accuracy). A logarithmic cost function performed favorably compared to an exponential function for an unreliable log (low values), across a wide range of models (see, Figure 5(b)). Performance deteriorated with a decrease in the model’s precision. For high quality logs manifested by high values, the selection of a cost function did not make a significant difference with a slight deterioration in recovery accuracy as the model precision decreases (see Figure 5(c)).
Performance differences can be traced back to the cost function properties. Exponential cost function inflict higher penalties on lower probabilities compared to logarithmic functions (see, Figure 2(b)). Therefore, a logarithmic function may favor alignments with as many synchronous moves as possible (even if their probabilities are low), whereas an exponential function may prefer alignments with nonsynchronous moves over ones with multiple low probability synchronous moves. Consider, for example, a model in which two alignments are being evaluated by SKTR. Alignment 1 consists of five synchronous moves and a single nonsynchronous move, while Alignment 2 consists of four synchronous moves and two nonsynchronous moves. If the probabilities associated with the synchronous moves of Alignment 1 are lower than those of Alignment 2, SKTRwith a logarithmic function is more likely to choose Alignment 1 since low probabilities (though not extremely low) would not induce a high cost for the synchronous moves, compared to Alignment 2 for which an additional nonsynchronous move would induce a cost of 1. In contrast, SKTR with an exponential function may prefer Alignment 2 as the cost induced by five low probability synchronous moves can exceed the cost induced by the four synchronous moves of Alignment 2 even after considering the additional nonsynchronous move in Alignment 2. Choosing highly probable transitions, even with the additional cost of nonsynchronous moves, can lead to recovery errors if these transitions are not the true ones. Thus, for logs with a low quality and a reasonable model, one would wish to trust the process model while minimizing nonsynchronous moves.
As values increase, different cost functions exhibit similar performance since the functions that assign higher penalties would choose the original transitions more often given that these transitions currently have higher probabilities. Based on the above explanations, Figures 5(b) and 5(c) present the results of experiments with a varying model quality (by changing ) and low () and high () log quality, respectively. When the log is prone to errors (Figure 5(b)), a logarithmic cost function led to slightly better performance of SKTR compared to an exponential cost function. This happens because a logarithmic function prioritizes alignments with fewer nonsynchronous moves and relies more on the model compared to the stochastic one. The x-axis shows that as increases and model’s precision decreases, SKTR performance decreases. As seen in Figure 5(c), for a reasonable log quality () cost functions perform almost equally.
IV-C Experiments with Video Datasets
We used three publicly available popular machine learning datasets, which contain videos of food preparation. These benchmarks are used to compare activity segmentation algorithms, predicting the correct activity label for timestamps within each video stream.
IV-C1 Data Preparation and Preprocessing
To retrieve labels’ probabilities from videos, we reproduced the results of a state-of-the-art deep learning network for action segmentation, ASFormer [9], which receives as input a video stream and assigns an activity label for each selected timestamp. The accuracy of the model ranges in 70%–86% depending on the dataset and selected parameters. For a fair comparison, we used the default network parameters. Prior to the assignment of labels, for each timestamp, the model generates the probability of each label being the correct one in the form of a matrix (termed softmax matrix) where rows correspond to the possible labels and columns to timestamps. Then, it assigns to each timestamp the label with the highest probability (Argmax). The softmax matrices are used them as inputs to SKTR. In addition, SKTR receives a training set of several labeled videos from which it discovers a reference process model. SKTR converts the softmax matrices into SK traces, constructs a reachability multigraph between the process model and each matrix, and recovers the labels using Algorithm 1.
After applying ASFormer and extracting a softmax matrix for each video, we sampled about 30-60 timestamps from each video and passed the samples to SKTR. We compared SKTR’s output against the ground truth labels, annotated by humans and computed its accuracy.
IV-C2 Results
The results, summarized in Table II, indicate that SKTR significantly outperforms the baseline deep learning network with a relative accuracy improvement of -. Using the sequence–probability feature that considers the path (history) containing previous activities (Section III-D) improved the accuracy by - compared to the standard practice of considering only the current marking. We believe that developing integration procedures of history with SKTR can improve the results even more but this is outside the scope of this research. The biggest advantage SKTR offers in comparison to the baseline is its reference process model that is utilized during the label recovery process. The algorithm considers the process perspective, enabling it to predict the correct labels by considering sequences of labels and how well they are aligned with the process.
V Related Work
[10] [10] describe probabilistic databases as “…databases where the value of some attributes or the presence of some records are uncertain and known only with some probability.” Commonly, data uncertainty is classified into attribute- or record-level uncertainty [10, 11], where the former term refers to an uncertain event attribute for which the possible values are known with probability, and the latter to the probability that a record (a trace) exists. In the context of this work we focus on attribute-level uncertainty.
A rich body of research focuses on (semi-)automatically identifying data quality issues, e.g., [12, 13]. These studies focus on identifying atypical data patterns with respect to other data or a process and developing repair mechanisms but do not exploit probabilistic knowledge of data values. Some studies, to improve model discovery results, filter out an event log. For example, [14] [14] develop a threshold-based framework for filtering out infrequent behaviors. Mixed-integer linear programming is used to find an automaton with a minimal number of arcs that represents the log behavior, which is used for finding frequency thresholds. The events that do not fit the automaton, subject to the threshold, are filtered out. [15] [15] present an alignment-based technique to fill in missing trace events. Among a set of optimal alignments, the one with the highest probability is selected. In contrast, we factor the probabilities of different paths during the search and return a single optimal alignment rather than a set of alignments. Another difference, is that we compute alignments with respect to an SK trace.
[16] [16] propose techniques to detect incomplete traces or traces that do not terminate properly by identifying the probability in which an activity appears in the context of a specific behavior. For example, how likely it is that activity appears after the sequence . The conditional probabilities can be then filtered according to a threshold. [17] [17] focus on the ordering of events when some of their timestamps are imprecise due to missing, non-synchronized, or manual recordings of date/time information (also called order uncertainty). The authors test three different models in which the probability of a trace variation or a specific sequence of events are estimated based on event-log traces that do exhibit order uncertainty (deterministic traces). A recent paper by [18] [18], who take a universal approach to identifying data by developing a semi-automated data quality evaluation framework of event data extracted from relational databases. Their approach is based on the development of quantitative indices for measuring 12 different data quality dimensions (e.g., precision, completeness, uniqueness).
[19] [19] classify data uncertainty into one of two classes: strong and weak. The former states that an event’s attribute may have several possible values but their probabilities of being the true value are unknown. The latter assumes that the probability distribution over possible values is known. [3] [3] develop a process discovery technique for logs with strong uncertainty. The technique constructs a directly-follows graph, extracts a process model, and applies filters to simplify it. [20] [20] construct a behavior graph, which accommodates precedence relationships among events for logs with strong uncertainty, allowing the discovery of models from logs using directly-follows relationships. [21] [21] evaluate lower and upper bounds on the cost of alignment-based conformance under the strong uncertainty assumption. [22] [22] develop a conformance checking technique between a stochastic workflow network and a deterministic trace. Their technique filters model paths having occurrence probabilities higher than a predetermined threshold and ranks their conformance score with respect to the reference trace as a product of a distance measure (e.g., Levenshtein distance) and path’s probability. [4] [4] propose an alignment-based algorithm that computes the conformance cost between a model and an SK trace.
Differently from previously introduced solutions [4], in SKTR the level of trust in model and log is adjusted according to their qualities via selection of different cost functions. Moreover, recovery of activity labels can consider the probabilities of activity sequences. To restore activity labels, the synchronous product is modeled as a multigraph, which enables distinguishing between nonsynchronous moves, a novel feature of the algorithm.
VI Conclusions and Future Work
We propose accurate trace recovery process from uncertain data, a crucial task for credible process analysis and decision making. We focus on SK event logs in which activity labels are only known in stochastic terms, a setting characteristic of neural networks and sensor outputs. The suggested approach calculates the conformance between a process model and an SK trace and recovers, as the true trace, the best alignment within this stochastic trace. Results of experiments over five datasets, three of which document processes via videos, indicate significant trace recovery accuracy improvements of by SKTR compared to the common Argmax heuristic and a deep learning network. For future work, we plan to explore computationally efficient techniques for computing alignments with long SK traces from long videos/processes. Another research direction involves exploring additional types of cost functions and integrating history into SKTR.
References
- [1] Christian Janiesch et al. “The Internet of Things Meets Business Process Management: A Manifesto” In IEEE Systems, Man, and Cybernetics Magazine 6.4, 2020, pp. 34–44 DOI: 10.1109/MSMC.2020.3003135
- [2] Izack Cohen and Avigdor Gal “Uncertain Process Data with Probabilistic Knowledge: Problem Characterization and Challenges” In Proceedings of the International Workshop Problems21, 2021, pp. 51–56
- [3] Marco Pegoraro, Merih Seran Uysal and Wil Van Der Aalst “Discovering process models from uncertain event data” In International Conference on Business Process Management, 2019, pp. 238–249 Springer
- [4] Eli Bogdanov, Izack Cohen and Avigdor Gal “Conformance Checking Over Stochastically Known Logs” In Business Process Management Forum: BPM 2022 Forum, 2022, pp. 105–119 Springer
- [5] Iris Beerepoot et al. “The biggest business process management problems to solve before we die” In Computers in Industry 146 Elsevier, 2023, pp. 103837
- [6] Andreas Rogge-Solti et al. “In Log and Model We Trust? A Generalized Conformance Checking Framework” In Business Process Management Cham: Springer International Publishing, 2016, pp. 179–196
- [7] Elisheva Chocron, Izack Cohen and Paul Feigin “Delay Prediction for Managing Multiclass Service Systems: An Investigation of Queueing Theory and Machine Learning Approaches” In IEEE Transactions on Engineering Management IEEE, 2022
- [8] Marco Pegoraro, Merih Seran Uysal and Wil Van Der Aalst “Efficient construction of behavior graphs for uncertain event data” In International Conference on Business Information Systems, 2020, pp. 76–88 Springer
- [9] Fangqiu Yi, Hongyu Wen and Tingting Jiang “Asformer: Transformer for action segmentation” In arXiv preprint arXiv:2110.08568, 2021
- [10] Dan Suciu et al. “Probabilistic databases, synthesis lectures on data management” In Morgan & Claypool, 2011
- [11] Charu C Aggarwal and S Yu Philip “A survey of uncertain data algorithms and applications” In IEEE Transactions on Knowledge and Data Engineering 21.5 IEEE, 2008, pp. 609–623
- [12] Suriadi et al. “Event log imperfection patterns for process mining: Towards a systematic approach to cleaning event logs” In Information Systems 64 Elsevier, 2017, pp. 132–150
- [13] Jianmin Wang et al. “Cleaning structured event logs: A graph repair approach” In 2015 IEEE 31st International Conference on Data Engineering, 2015, pp. 30–41 IEEE
- [14] Raffaele Conforti, Marcello La Rosa and Arthur HM Hofstede “Filtering out infrequent behavior from business process event logs” In IEEE Transactions on Knowledge and Data Engineering 29.2 IEEE, 2016, pp. 300–314
- [15] Andreas Rogge-Solti et al. “Repairing event logs using stochastic process models” Universitätsverlag Potsdam, 2013
- [16] Mohammadreza Fani Sani, Sebastiaan J Zelst and Wil Van Der Aalst “Improving process discovery results by filtering outliers using conditional behavioural probabilities” In International Conference on Business Process Management, 2017, pp. 216–229 Springer
- [17] Han Van der Aa, Henrik Leopold and Matthias Weidlich “Partial order resolution of event logs for process conformance checking” In Decision Support Systems 136 Elsevier, 2020, pp. 113347
- [18] Robert Andrews et al. “Quality-informed semi-automated event log generation for process mining” In Decision Support Systems 132 Elsevier, 2020, pp. 113265
- [19] Marco Pegoraro and Wil MP Aalst “Mining uncertain event data in process mining” In 2019 International Conference on Process Mining (ICPM), 2019, pp. 89–96 IEEE
- [20] Marco Pegoraro, Merih Seran Uysal and Wil Van Der Aalst “Efficient Time and Space Representation of Uncertain Event Data” In Algorithms 13.11 Multidisciplinary Digital Publishing Institute, 2020, pp. 285
- [21] Marco Pegoraro, Merih Seran Uysal and Wil MP Aalst “Conformance checking over uncertain event data” In Information Systems 102 Elsevier, 2021, pp. 101810
- [22] Giacomo Bergami et al. “A Tool for Computing Probabilistic Trace Alignments” In International Conference on Advanced Information Systems Engineering, 2021, pp. 118–126 Springer