Space-resolved Chemical Information from Infrared Extinction Spectra
Abstract
Based on the classical Lorentz model of the index of refraction, a new method is presented for the extraction of the complex index of refraction from the extinction efficiency of homogeneous and layered dielectric spheres that simultaneously removes scattering effects and corrects measured extinction spectra for baseline shifts, tilts, curvature, and scaling. No reference spectrum is required and the method automatically satisfies the Kramers-Kronig relations. Thus, the method yields pure absorbance spectra for unambiguous interpretation of the chemical information of the sample. In the case of homogeneous spheres, the method also determines the radius of the sphere. In the case of layered spheres, the method determines the radii of the layers and the substances within each layer. Only a single-element detector is required. Using simulated data of polymethyl-methacrylate (PMMA) and polystyrene homogeneous and layered spheres we show that our reconstruction algorithm is reliable and accurately extracts pure absorbance spectra from data. Reconstructing the pure absorbance spectrum from a published, experimentally measured raw absorbance spectrum shows that our method also works for uncorrected spectra, reliably removes scattering effects and, given shape information, simultaneously corrects for spectral distortions.
I Introduction
With roots going back several decades in time, infrared (IR) spectroscopy has evolved into one of the most powerful and successful tools for the analysis of biological cells and tissues for applications in biophysics, chemistry, and medical pathology Bha (12); MRDW (05); LBZ+ (15); JDM+ (98). Far from being a successful, but stagnant field of study, with the recent advent of tunable IR laser sources HM (16), IR spectroscopy is currently experiencing growing interest and expansion into new fields of application. No matter whether the spectra are taken with thermal, laser, or synchrotron IR sources, two tasks always have to be performed: (1) Cleaning up of the raw spectra and (2) reconstructing the refractive index (revealing the chemistry) of the (biological) sample under investigation. Powerful tools exist for cleaning up the spectra, i.e., removing artefacts introduced by the spectrographs and IR sources that result, e.g., in baseline shifts, tilts, curvature, and multiplicative distortions of the spectra SGP+ (19); VDMCB (13).
This paper focuses on single-cell IR spectroscopy where the cell sizes are approximately of the same order of magnitude as the wavelength of the incident IR radiation. Thus, the corresponding IR spectra exhibit pronounced scattering effects, such as Mie scattering Hul (81), that modify absorbance spectra considerably and need to be removed before interpreting the spectra.
In this paper we present a new technique that is based on the classical Lorentz model of the index of refraction Gri (99) and is capable of accomplishing the tasks (1) and (2) above without the need of a reference spectrum SGP+ (19) or the Kramers-Kronig relations SGP+ (19); VDMCB (13) as required by leading spectral correction methods. For our examples, we use two substances, polymethyl-methacrylate (PMMA) and polystyrene (PS).
II Methods
In subsection II.1 we start by describing the general method used in IR spectroscopy. Then, in subsection II.2, we describe our method of reconstructing the space- and wavenumber-dependent complex index of refraction , i.e., the hyperspectral complex refractive index, that is based on the classical Lorentz model Gri (99) of the index of refraction. Concluding this section, based on the methods described in subsections II.1 and II.2, we describe in subsection II.3 our numerical procedures for reconstructing the complex refractive index , and with it pure absorbance spectra (i.e., ).
II.1 General
Typically in single-detector IR spectroscopy, a beam of IR radiation of wavelength (wavenumber ) and intensity is directed toward a target that may be a biological cell, a sample of biological tissue, or a grain of biological or inanimate matter, and the transmitted intensity is measured in forward direction. Because of absorption of IR radiation by the target, and because of scattering of IR radiation out of the forward direction, we have . Once is measured, the result of the measurements is typically reported as the apparent absorbance
| (1) |
While the apparent absorbance is convenient for recording and reporting experimental results, cross sections are more convenient for analysis of experiments, numerical simulations, and the extraction of refractive indexes. We denote by and the scattering and absorption cross sections, respectively. Then, the extinction cross section is defined as Hul (81)
| (2) |
We also define scattering, absorption, and extinction efficiencies according to Hul (81)
| (3) |
respectively, where is the geometric cross section of the sample under investigation. Denoting by the reception area of the detector, the radiative power received by the detector without the sample present is
| (4) |
and the radiative power received by the detector with the sample present is
| (5) |
From this, we obtain
| (6) |
Via (1), this can immediately be related to the apparent absorbance according to
| (7) |
Since, via (7), and contain the same information, we will, in the following, present our theoretical analysis and reconstructions of refractive indexes on the basis of or depending on convenience.
II.2 Reconstruction via Classical Lorentz Model
The main point of our method is to extract the space- and wavenumber-dependent complex index of refraction from . This may sound ambitious, since has no space dependence. Nevertheless, it is possible, at least for a sphere with two layers, as demonstrated in Section III. To implement the method, we discretize space into voxels, which can be any shape or size. The smaller, the more resolution. The more regular (such as cubes or shells), the easier the computations. Labeling the voxels with the discrete index , and denoting by a representative point of voxel number (for instance its center in the case of cubes or a point on the center shell in the case of shells), we represent the refractive index inside of a voxel by its (spatially) constant value , which varies in wavenumber as a sum of Lorentzians of the form
| (8) |
where, inside voxel number , is the wavenumber location of an IR absorption band, is the corresponding peak height, is the width of the absorption band, numbers the absorption bands, and , a parameter, decides how many bands we include in our reconstructions. , , and are adjustable parameters to be determined via a 3D scattering code such that the predicted on the basis of (8) optimally reproduces , where is the given , either obtained experimentally, or from a numerical simulation (see Section III).
In the simplest case, the entire scatterer may be represented as a single voxel, in which case . This is appropriate for homogeneous scatterers, i.e., scatterers with a spatially constant index of refraction, such as a homogeneous sphere. Another example is a sphere with two layers, i.e., a core and a shell, each homogeneously filled with a medium of spatially constant index of refraction as discussed in Section III. In this case two voxels, i.e., the core and the shell, suffice, each endowed with its own series (8) of Lorentzians. The method now determines the unknown parameters , , and as the optimum values that best reproduce . This can be done with any standard nonlinear fit algorithm that minimizes a target function , for instance,
| (9) |
where is the extinction efficiency evaluated at with fit parameters , , and , computed via a suitable 3D scattering code and are the wavenumbers at which has been measured or pre-determined numerically.
The main characteristic of the Lorentzian method is that, in contrast to other spectral-correction methods (e.g., SGP+ (19)), no reference spectrum is needed to scatter-correct spectra, whether simulated via a forward model or obtained experimentally, and that no Kramers-Kronig transformation is needed. This is so, since the complex Lorentzian functions in (8) automatically satisfy the Kramers-Kronig relations, and thus , as a finite sum of such functions, automatically satisfies the Kramers-Kronig relations as well.
II.3 Numerical Simulations
To demonstrate the power of the Lorentzian method, we performed four types of numerical simulations, labeled I, II, III, and IV. Types I, II, and III are for homogeneous spheres and type IV is for a layered sphere.
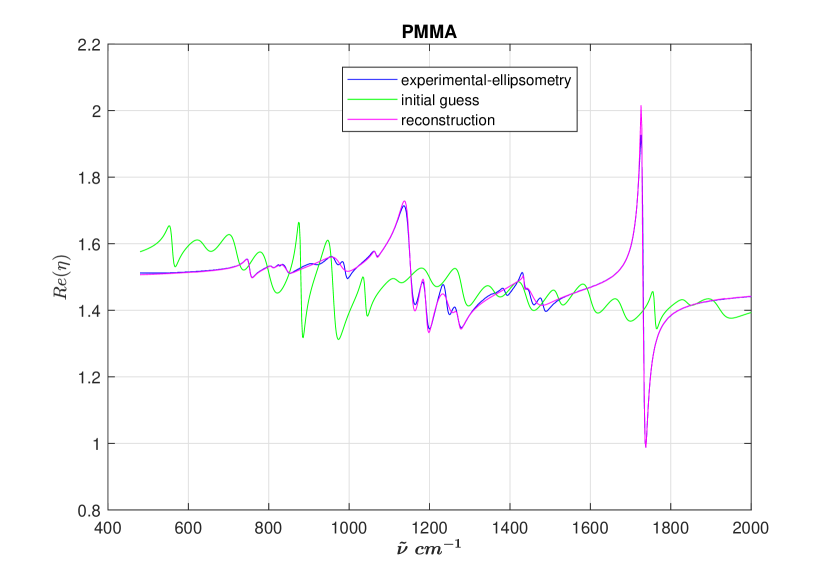
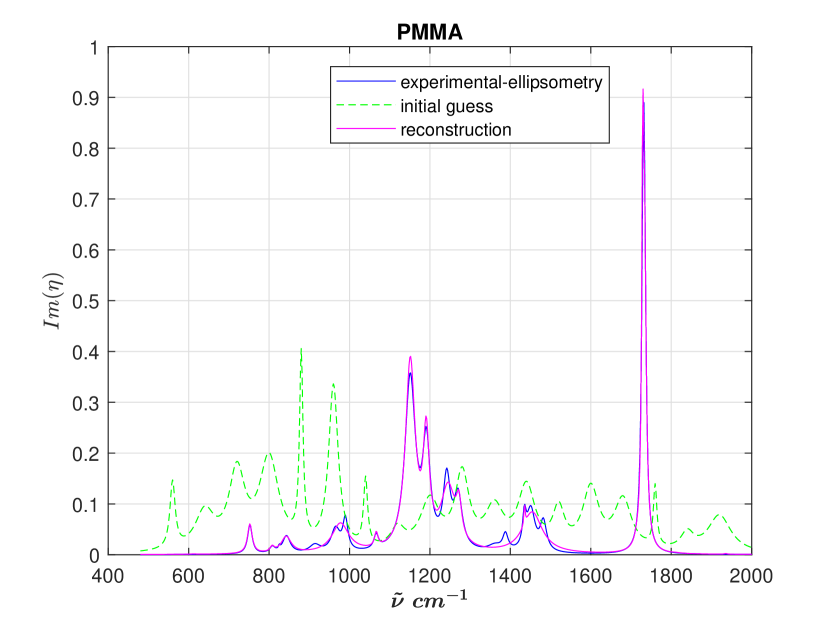
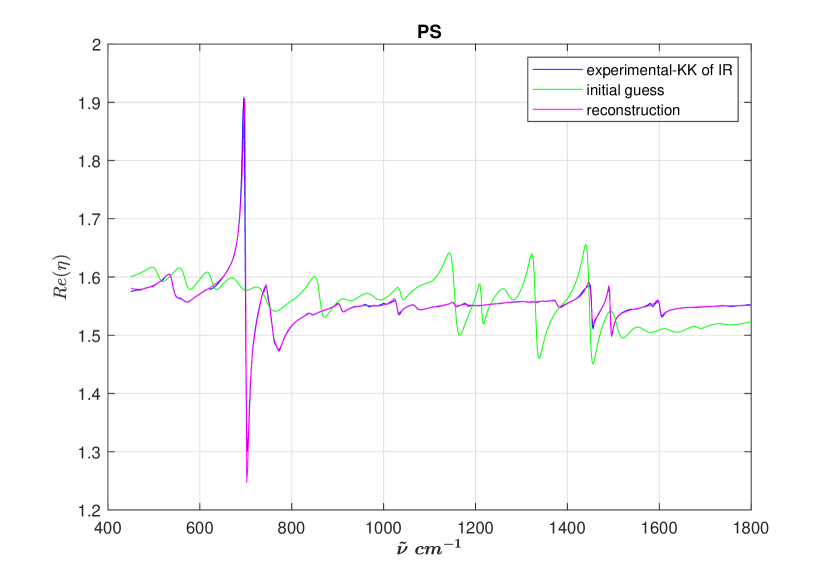
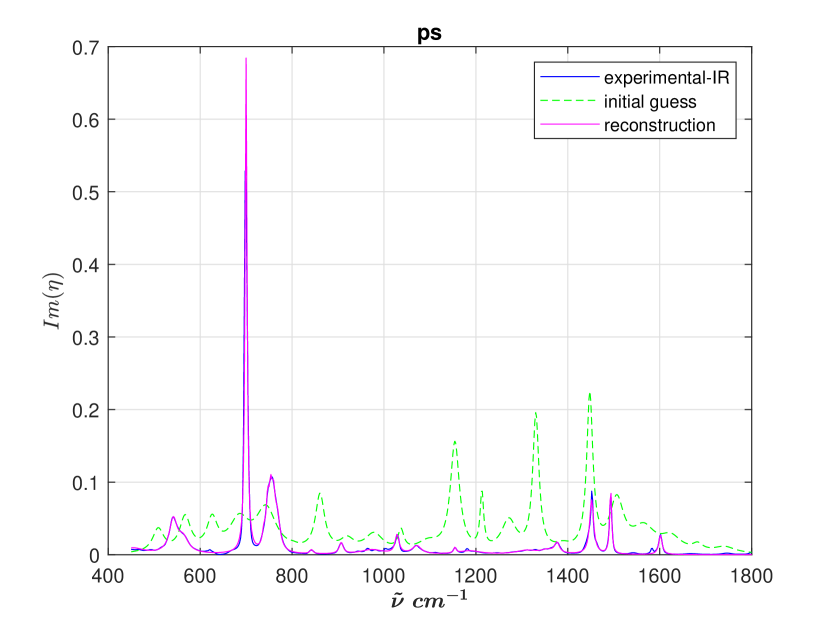
In our type-I simulations, we fit accurate experimental data for of PMMA TYKY (18) and PS MTD+ (18) with (PMMA) and (PS) Lorentzians, respectively, and compute with in (8) using a standard Mie scattering code. The results of these type-I simulations are presented and discussed in Section III.1.1.
In our type-II simulations, we compute directly on the basis of the experimental data for . The results of our type-II simulations are presented and discussed in Section III.1.2.
Our type-III simulations take directly from an experimental absorbance spectrum published in BBLK (16). In this case we also perform baseline, tilt, scaling, and curvature corrections of the experimental raw spectrum, by adding the baseline-, tilt-, scaling-, and curvature parameters as additional fit parameters to our Lorentzian method. As shown in Section III.1.3 this works very well, and thus our Lorentzian method performs both the correction of raw spectra and scattering corrections in a single step, without the need of a reference spectrum or the Kramers-Kronig transform.
In our type-IV simulations, we use our Lorentzian method to reconstruct the complex space-dependent index of refraction for a sphere with two layers, i.e., PMMA in the core and PS in the shell. This is a case with two voxels, i.e., representing the complex refractive index in the core and representing the complex refractive index in the shell. In this case, we construct using a standard Mie code for stratified spheres with in the core and in the shell, both taken directly from the corresponding experimental complex refractive indexes. The results of these simulations, reported in Section III.2, prove that the Lorentzian method with only a single-element detector, and a single as input, can reveal space-dependent chemistry, at least for this two-layer model.
One characteristic feature of our Lorentzian method is that, initially, as starting conditions, we place Lorentzians, equi-spaced (unbiased) into the wavenumber interval under consideration. This way, in addition to using random initial values for Lorentzian peak heights and peak widths, we obtain an initial condition that is not only unbiased, but an initial Lorentzian peak is always near to an actual absorption peak in the pure absorbance spectrum, which then needs only a relatively small adjustment in position, height, and widths, to morph into the actual absorption peak. This feature is crucial. It avoids, to a large extent, getting trapped in secondary optimization minima, i.e., a stationary but not global minimum of the target function [see (9)]. We can still get trapped in secondary minima, but because of our choice of equi-spaced initial Lorentzian positions, the chance of getting trapped in a secondary minimum that results in a particularly bad fit is vastly reduced.
III Results
In this section we apply our Lorentzian reconstruction method to two important cases: (a) Homogeneous spheres (see Section III.1) and (b) layered spheres (see Section III.2). While these examples are important for testing validity and robustness of our method, IR spectroscopy on homogeneous and layered spheres may also have practical importance, for instance in mineralogy, or for characterizing micro- and nano-spheres, such as PMMA or PS spheres. PMMA spheres, in particular, are frequently used as model systems for biological cells VDMCB (13); BBLK (16); LBZ+ (15); BBB+ (09).
III.1 Homogeneous Spheres (types I, II, and III)
In this section we demonstrate the validity of our reconstruction method for homogeneous spheres, all of radius m, in three steps, working with two different substances: PMMA and PS. We start by simulating PMMA and PS spectra based on a Lorentzian approximation of the complex refractive index and show that for all three substances our method exactly reconstructs the complex index of refraction (see Section III.1.1). Then, we simulate PMMA and PS spectra based directly on experimental data of the complex index of refraction and demonstrate that in this case, as well, near-perfect reconstructions are obtained (see Section III.1.2). Finally, we reconstruct the complex index of refraction from an experimentally measured PMMA spectrum BBLK (16), which also includes baseline, tilt, scale, and curvature corrections (see Section III.1.3). We show that a satisfactory result is achieved in this case as well.
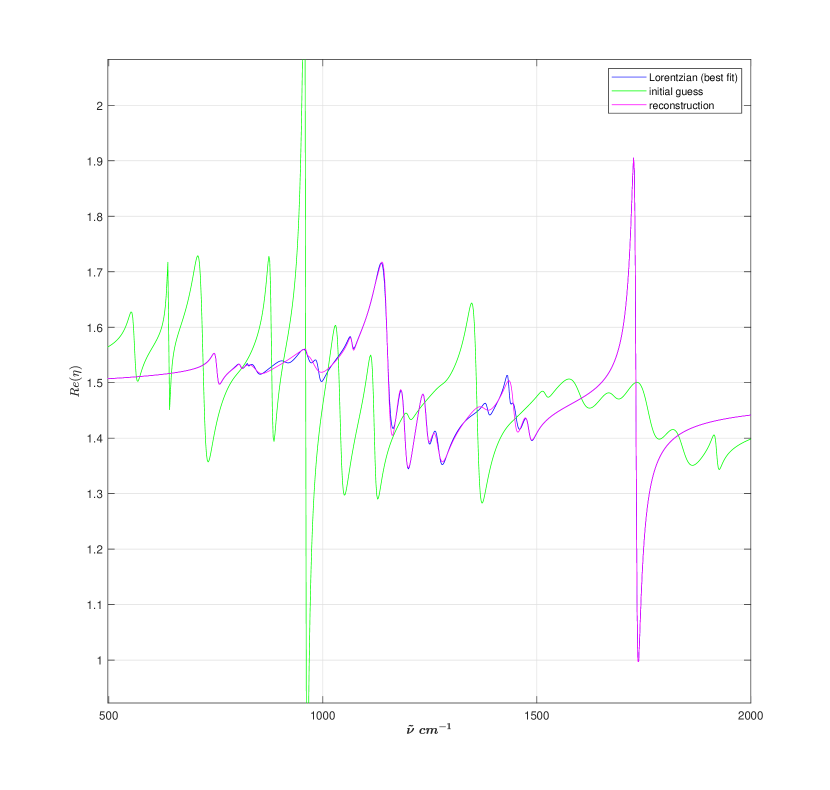
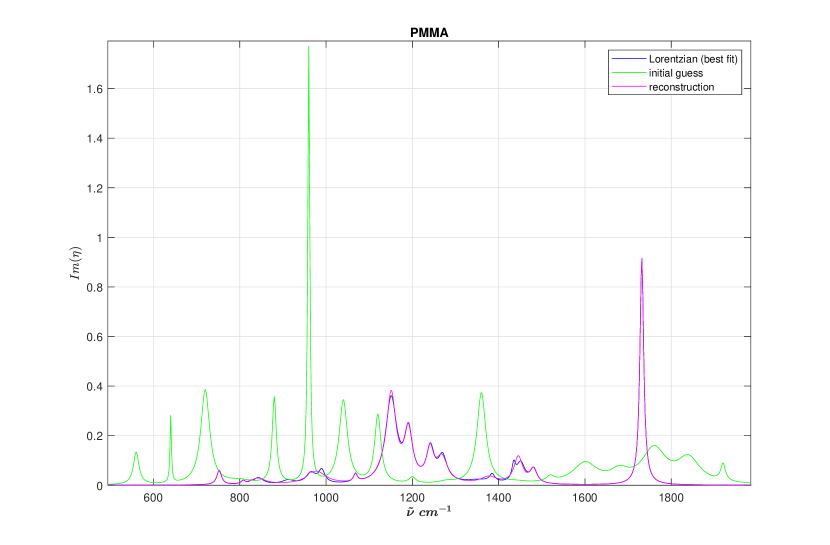
III.1.1 Lorentzian Extinction (type-I)
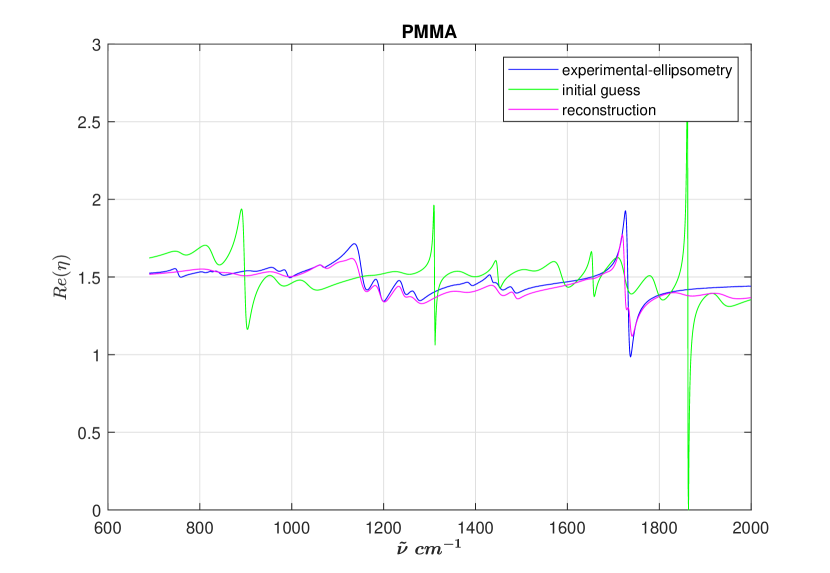
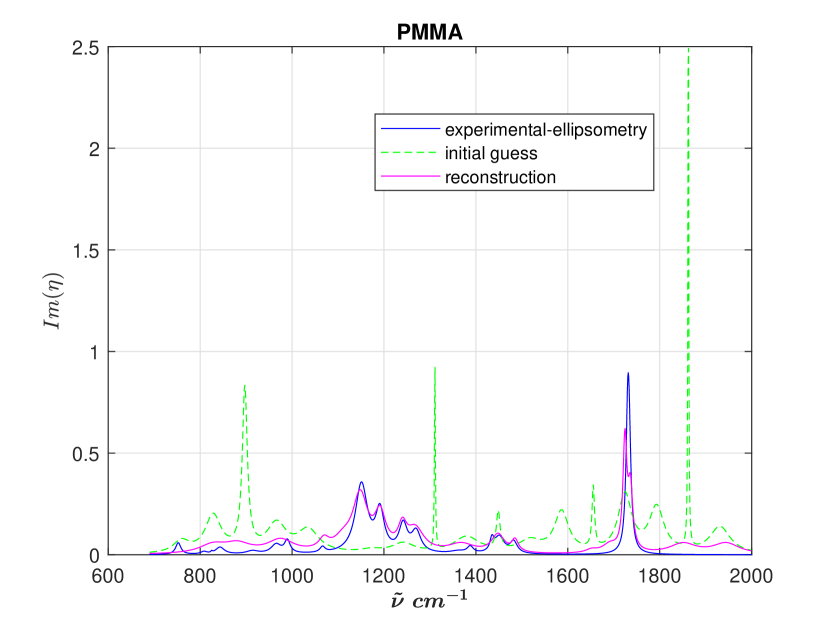
Approximating the experimental data of by a set of Lorentzians, and computing , on the basis of these Lorentzians, we obtain the reconstructions of the real and imaginary parts of the refractive index as shown in Fig. 1. Although we start with initial conditions (green lines) that are far off the final result (magenta lines), we see that our reconstructions (magenta lines) overlap the target refractive indexes (blue lines) nearly perfectly. This shows that our type-I reconstructions are near perfect. Given that we start our reconstruction algorithm (green lines) far from the target (blue lines) it also shows that our Lorentzian reconstruction algorithm is robust. Adding to the robustness, we also simulated reconstructions (not shown) adding 10% noise to . We obtained reconstructed spectra of similar accuracy. This shows that our reconstruction algorithm is robust also to perturbations in . Thus, the main result of this section is that our Lorentzian method works well and is robust with respect to initial conditions and noise.
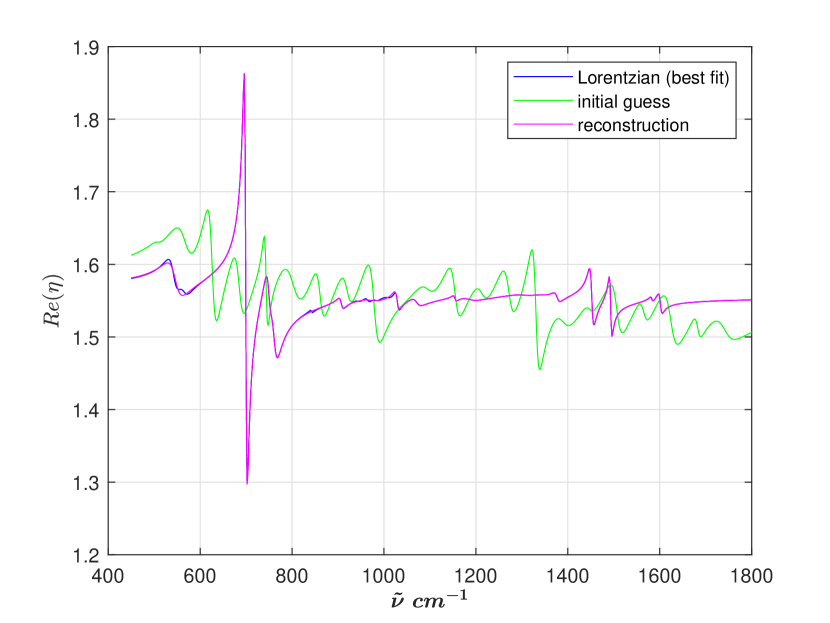
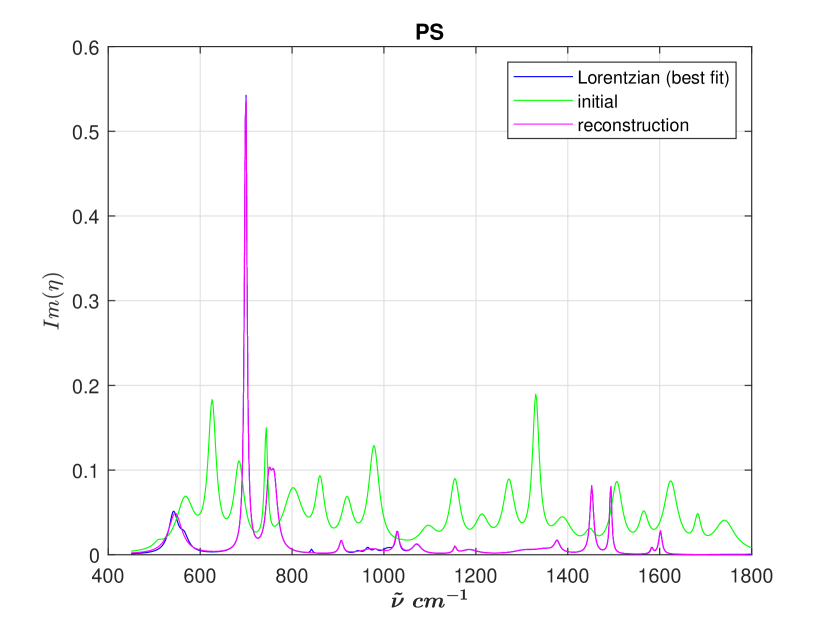
III.1.2 Extinction based on experimental refractive index (type-II)
In this section we make it slightly harder for our reconstruction algorithm by not approximating the experimental refractive index by Lorentzians, but compute directly on the basis of the experimental complex . The result is shown in Fig. 2. Again, although starting far from the optimal values of the Lorentzian fit parameters, we obtain near perfect reconstructions of real and imaginary refractive indexes. In this case, too, we checked for the influence of noise, and found our algorithm robust with respect to noise perturbations.
III.1.3 Experimental Extinction (type-III)
In our third numerical experiment concerned with homogeneous spheres, we reconstructed the complex PMMA refractive index from an experimental apparent absorbance spectrum BBLK (16), simultaneously performing baseline-, tilt-, scaling-, and curvature corrections of the the raw spectrum. The result is shown in Fig. 3. Starting our Lorentzian reconstruction algorithm once more with random initial conditions, we obtained reconstructions (magenta lines) of the real and imaginary parts of the complex PMMA index of refraction in satisfactory agreement with the experimental data (blue lines). This shows that our algorithm also works for experimental raw spectra that are neither scatter corrected, nor corrected for experimental systematic errors. Our algorithm can handle both simultaneously without the need of a reference spectrum or the Kramers-Kronig transformation.
III.2 Layered Sphere (type-IV)
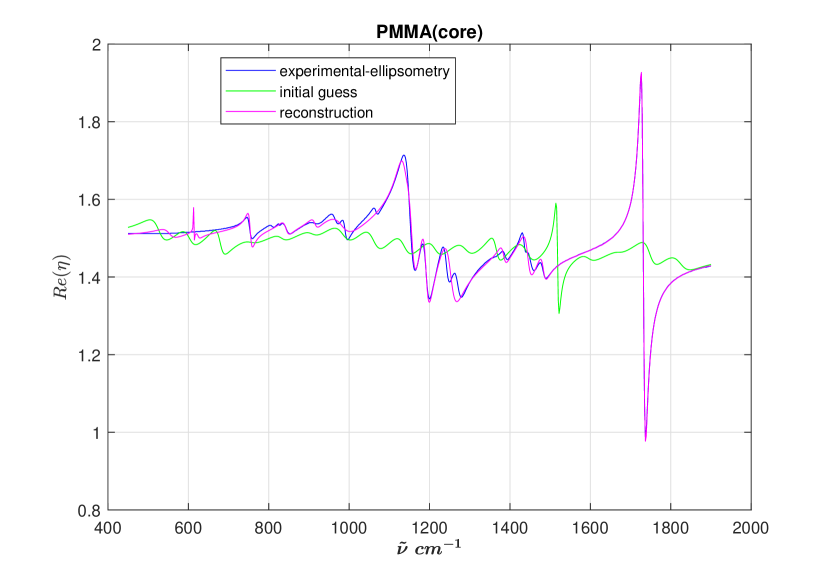
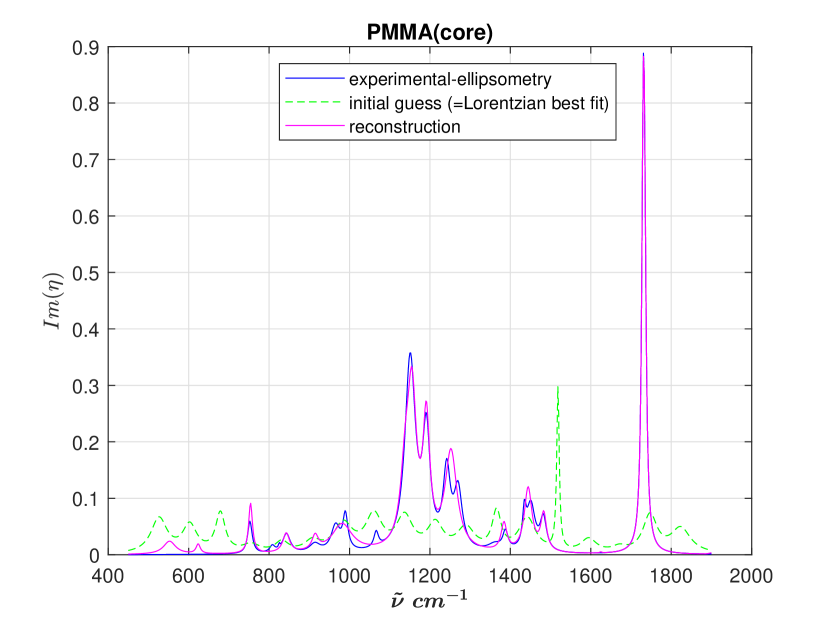
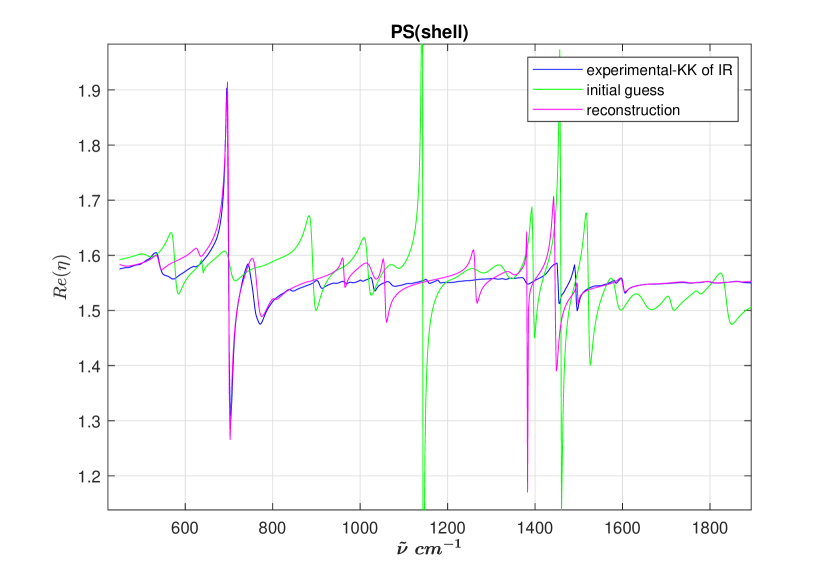
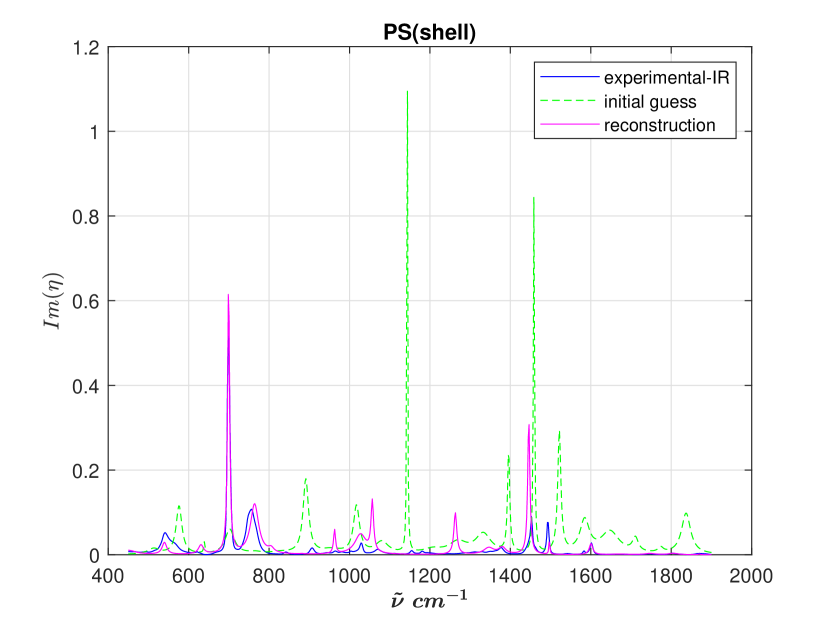
In Section III.1 we concentrated on exploring the power of our Lorentzian method in the well-defined case of homogeneous spheres. We now ask the question whether our Lorentzian algorithm is powerful enough to obtain the space-resolved complex refractive index, i.e., via the imaginary part of the complex refractive index (absorption), space-resolved chemistry. To answer this question, we focus on a stratified sphere with two layers. We fill the core of the layered sphere with PMMA, the shell with PS, and compute on the basis of (8) with . The outer radius of the sphere is m; the inner radius, i.e., the core radius, is m. For the PMMA refractive index in the core we used experimental PMMA data. For the PS refractive index in the shell, we used the known imaginary part of the refractive index and computed the real part using the Kramers-Kronig transformation. We emphasize that the use of the Kramers-Kronig transformation in this case has nothing to do with our reconstruction algorithm (which never uses the Kramers-Kronig transformation), and is used only to generate the real part of the PS refractive index. We could have, as well, used a complete set of PS experimental data for real and imaginary parts of the refractive index, avoiding the Kramers-Kronig transformation altogether, but we were unable to locate a suitable, published set. In any case, constructing on the basis of this input, we obtained the reconstructions of the complex indexes of refraction in the core and in the shell as shown in Fig. 4.
The result of our Lorentzian reconstruction of the space-dependent complex refractive index is shown in Fig. 4. We see that, not only does our Lorentzian algorithm, based only on the extinction efficiency, correctly identify the two substances and their spatial locations (PMMA in the core and PS in the shell), the reconstructions themselves (magenta lines) are close to their actual values (blue lines). This is encouraging, the more that, again, we started from completely unbiased, random initial conditions (green lines). This demonstrates that our Lorentzian algorithm is capable of revealing space-resolved chemistry based only on a single-element detector. We mention that we also used our Lorentzian method to discover the core and sphere radii, assumed unknown. In this case we add the core and sphere radii as additional parameters to our Lorentzian method. We found that in this case our Lorentzian method is not only able to reconstruct the complex indexes of refraction, but simultaneously also determines the core and sphere radii. As a result of this type-IV simulation, we find that in this case, too, we can reconstruct the complex refractive indexes, space- and wavenumber-dependent, simultaneously with determining sphere size and information on internal structure (in this case the core radius, which may stand for the nucleus of a biological cell).
IV Discussion
In contrast to other spectroscopic methods, such as, e.g., Raman spectroscopy, the IR power in IR spectroscopy is low and thus does not harm the cells. In addition, since IR spectroscopy does not require staining, IR spectroscopy does not alter the cells or the cell chemistry. Thus, IR spectroscopy enables in-vivo investigations of cells and tissues. In their natural state, biological cells have a 3D structure, which, combined with the fact that cells and tissues have sizes that are of the order of the IR wavelength, leads to large scattering contributions that need to be removed to obtain pure absorbance spectra that only then can be interpreted as to their chemical information content. Our new Lorentzian method, compact and powerful, accomplishes just that, and, as demonstrated in Section III, can even be combined with baseline, tilt, curvature, and scaling corrections of raw spectra. The method is also suitable for extracting space-resolved chemistry as demonstrated in Section III.2 with the help of a layered sphere.
Our results also show that focal plane arrays (FPAs) may not be necessary to obtain space-resolved chemistry. For instance, as shown for the layered sphere, a single-element detector suffices. FPAs may still be needed if the scatterer has a more detailed shape or internal structure. However, rotating the sample, or using different illumination directions, akin to X-ray tomography, we may still get away with only a single-element detector.
Concerning stability and reliability of our Lorentzian method, we performed several checks. (a) We perturbed the simulated spectrum with up to 10% of noise and found that reconstruction was still possible. (b) We always start our reconstructions with random inputs for peak widths, peak heights, and peak locations. We always find convergence to the correct pure absorbance spectrum. This demonstrates that our method is robust and does not require fine-tuning of input parameters.
With the advent of new IR sources, such as tunable quantum cascade lasers, IR spectroscopy has recently received a rejuvenating boost that is ideally suited for the application of our method, which works well with coherent illumination of samples. We mention that in the case of coherent IR sources, optical effects, such as interference and scattering are more important and more controlled as compared with thermal IR sources (e.g., GLOBAR) or (partially coherent) synchrotron sources. Thus, our Lorentzian method is ideally suited for obtaining pure absorbance spectra in combination with coherent laser sources. We also mention that lasers are cheaper and more accessible than synchrotron sources, which makes our method ideally suited for laboratory applications.
V Conclusion
In this paper we have shown that it is possible to reconstruct the spatially resolved, wavenumber-dependent complex index of refraction (the spatially resolved chemistry) of a sample on the basis of extinction spectra which require only a single-element detector. The method is robust and reliable. It can be extended in several directions. (a) How many different layers of a stratified sphere can we resolve with a single-element detector? (b) Extension of the method to spheres with internal structure that does not have rotational symmetry. (c) Extension to 3D shapes with 3D internal structure. The most important question to answer is the following: Up to what point is a single-element detector enough, and at what point is it more advantageous to work with an FPA? These topics define exciting directions for future research. In addition, our method may find practical applications in biophysics, including in medical diagnostics, medical pathology, and single-cell spectroscopy.
VI Acknowledgments
VII Author contributions
RB suggested the method and supervised the project. KdS coded and performed all computer simulations. All authors contributed to the writing of the paper.
References
- BBB+ [09] Paul Bassan, Hugh J Byrne, Franck Bonnier, Joe Lee, Paul Dumas, and Peter Gardner. Resonant Mie scattering in infrared spectroscopy of biological materials–understanding the ‘dispersion artefact’. Analyst, 134(8):1586–1593, 2009.
- BBLK [16] Reinhold Blümel, M Bağcioğlu, R Lukacs, and A Kohler. Infrared refractive index dispersion of polymethyl methacrylate spheres from Mie ripples in Fourier-transform infrared microscopy extinction spectra. Journal of the Optical Society of America, 33(9):1687–1696, 2016.
- Bha [12] Rohit Bhargava. Infrared spectroscopic imaging: the next generation. Applied spectroscopy, 66(10):1091–1120, 2012.
- Gri [99] David J. Griffiths. Introduction to Electrodynamics. Prentice Hall, 1999.
- HM [16] Julian Haas and Boris Mizaikoff. Advances in mid-infrared spectroscopy for chemical analysis. Annual Review of Analytical Chemistry, 9:45–68, 2016.
- Hul [81] Hendrik Christoffel Hulst. Light Scattering by Small Particles. Dover Publications, Inc., 1981.
- JDM+ [98] N. Jamin, P. Dumas, J. Moncuit, W. H. Fridman, J. L. Teillaud, L. G. Carr, and G. P. Williams. Highly resolved chemical imaging of living cells by using synchrotron infrared microspectrometry. Proc. Natl. Acad. Sci. USA, 95(9):4837–4840, 1998.
- LBZ+ [15] R. Lukacs, R. Blümel, B. Zimmerman, M. Bağcıoğlu, and A. Kohler. Recovery of absorbance spectra of micrometer-sized biological and inanimate particles. Analyst, 140(9):3273–3284, 2015.
- MRDW [05] B. Mohlenhöff, M. Romeo, M. Diem, and B. R. Wood. Mie-type scattering and non-Beer-Lambert absorption behavior of human cells in infrared microspectroscopy. Biophys. J., 88(5):3635–3640, 2005.
- MTD+ [18] Tanya L. Myers, Russell G. Tonkyn, Tyler O. Danby, Matthew S. Taubman, Bruce E. Bernacki, Jerome C. Birnbaum, Steven W. Sharpe, and Timothy J. Johnson. Accurate measurement of the optical constants and for a series of 57 inorganic and organic liquids for optical modeling and detection. Applied Spectroscopy, 72(4):535–550, 2018.
- SGP+ [19] J. H Solheim, Evgeniy Gunko, Dennis Petersen, Frederik Großerüschkamp, Klaus Gerwert, and Achim Kohler. An open-source code for Mie extinction extended multiplicative signal correction for infrared microscopy spectra of cells and tissues. J. Biophotonics, 12:e201800415, 2019.
- TYKY [18] Shinichiro Tsuda, Shuhei Yamaguchi, Yoshiaki Kanamori, and Hiroo Yugami. Spectral and angular shaping of infrared radiation in a polymer resonator with molecular vibrational modes. Optics Express, 26(6):article number 318844, 2018.
- VDMCB [13] Thomas Van Dijk, David Mayerich, P Scott Carney, and Rohit Bhargava. Recovery of absorption spectra from Fourier transform infrared (FT-IR) microspectroscopic measurements of intact spheres. Applied Spectroscopy, 67(5):546–552, 2013.