Crucial role of vibrational entropy in the Si- surface structure stability
Abstract
We investigate the relative thermodynamic stability of the , , , and infinitely large structures related to the dimers-adatoms-stacking faults family of Si surface reconstructions by means of first-principles calculations. Upon accounting for the vibrational contribution to the surface free energy, we find that the structure is more stable than the at low temperatures. While a phase transition is anticipated to occur at around room temperature, the transformation upon cooling is hindered by the limited mobility of Si atoms. The results not only flag a crucial role of vibrational entropy in the formation of the structure at elevated temperatures, but also point for its metastable nature below room temperature. [Pre-print published in Physical Review B 105, 245306 (2022)] DOI:10.1103/PhysRevB.105.245306
I Introduction
First-principles electronic structure methods, most notably density functional theory (DFT), have been widely used as a powerful tool to solve surface structures and to study their electronic properties. Due to its technological importance, semiconductor silicon has been a benchmark for studying surface physics, with several surface structures being extensively investigated [1, 2, 3, 4, 5, 6, 7, 8, 9, 10]. When Si surface structures are composed of different building blocks as, for example, , and reconstructions on Si, their surface energy differences are usually significant (above ), facilitating a reliable identification of the lowest energy atomistic configuration [11, 12]. In the above, the structure consists of -bonded chains [13], consists of Si adatoms on -sites [14], while the lowest energy reconstruction is described by the complex dimers adatoms stacking faults (DAS) model [15]. The DAS model describes a series of structures belonging to the family of reconstructions observed on Si and Ge surfaces ( being a positive integer): , , , and so on.
However, if the competing surface structures belong to the same family of reconstructions, i.e. when they are made of common building blocks, it becomes difficult to determine which one has the lowest formation energy, and ultimately to find the one that should be observed. For instance, the and ) reconstructions on Si are both composed of Si dimers, but because they buckle with different periodicity, their reported energy difference is as low as () [16]. We note that in spite of such low energy difference, the calculated lowest energy structure [] is in agreement with experimental scanning tunneling microscopy (STM) data obtained at low temperature.
The and DAS reconstructions on Si surface provide us with another example of two structures with very close surface formation energies. Two previous attempts to compare the surface formation energies of DAS reconstructions on Si within DFT are singled out. In Ref. 17, formation energies of , and reconstructed Si surfaces were compared, and the reconstruction was claimed as the most favorable structure. This result agrees with many experiments demonstrating that the is the most frequently observed structure on Si below the order-disorder transition temperature at around [18]. However, two years later, Needels [19] provided evidence that the above calculations suffered from poor Brillouin zone (BZ) sampling, that once adequately corrected, resulted in a different energy ordering, with the surface becoming the ground state (more stable than the reconstruction).
The second attempt to calculate the formation energy of Si DAS reconstructions was carried out by Solares et al. [20]. The Si came out as the one with lowest formation energy, and once again, was deemed the most stable. However, the calculated energy difference between and structures of only (), which combined with a reported accuracy of about () [20], make their conclusions questionable. The large error stems from several calculation settings, most notably the use of thin 4-bilayer (BL) slabs, insufficient number of -points to sample the BZ, and the use of the experimental lattice parameter () instead of calculated one () in the construction of the models [20]. The later factor introduces an artificial strain field across the slabs which alter the calculated energy differences of and surface structures.
In summary, the available picture regarding the stability ordering of the DAS structures on Si is rather unclear. In particular, our understanding of the physics that governs the formation of the most stable Si surface is covered by error bars. Importantly, both studies described above are based on calculations of potential (static) energies, i.e. for temperature only. It is a general practice to neglect thermal excitations as well as the contribution of entropy to the free energy of formation of surfaces. However, given the small energy difference between and surface structures, it would be important not only to account for the above referred sources of uncertainty (slab thickness, BZ sampling, artificial strain neutralization), but also to assess the effect of entropy, especially the contribution of vibrational degrees of freedom, usually the dominant finite-temperature contribution to the surface free energy of formation of semiconductor surfaces.
The aim of the present work is to find well converged energy differences between several members of the DAS family of structures on Si surface, size the entropy contribution to the free energy of formation of and reconstructions, and finally understand the driving stabilization factors. We find that while the reconstruction is the most favorable structure at K, vibrational freedom stabilizes the reconstruction, with a cross-over of the respective free-energies of formation taking place close to room temperature. The observation of metastable Si- below room temperature can be explained by a large barrier along the transition that involves the motion of Si atoms during cooling.
II Calculation details, Results and Discussion
II.1 Relative formation energies of Si(111) surfaces with DAS reconstructions at temperature
The calculations were carried out using the pseudopotential [21] density functional theory SIESTA code [22, 23]. Both the local density approximation (LDA) of Perdew and Zunger (PZ) [24], as well as the generalized gradient approximation (GGA) of Perdew et al. (commonly referred as PBEsol) [25], were employed for the description of the exchange-correlation (XC) interactions between electrons. Although it was previously shown that DAS Si surfaces are diamagnetic [20], our calculations were spin-unrestricted. The valence states were expressed as linear combinations of Sankey-Niklewski-type numerical atomic orbitals [22]. In the present calculations, polarized double- functions were placed on all atomic coordinates. This means two sets of s- and p-orbitals plus one set of d-orbitals on silicon atoms, and two sets of s-orbitals plus one set of p-orbitals on hydrogen atoms. The electron density and potential terms were calculated on a real space grid with spacing equivalent to a plane-wave cut-off of 200 Ry.
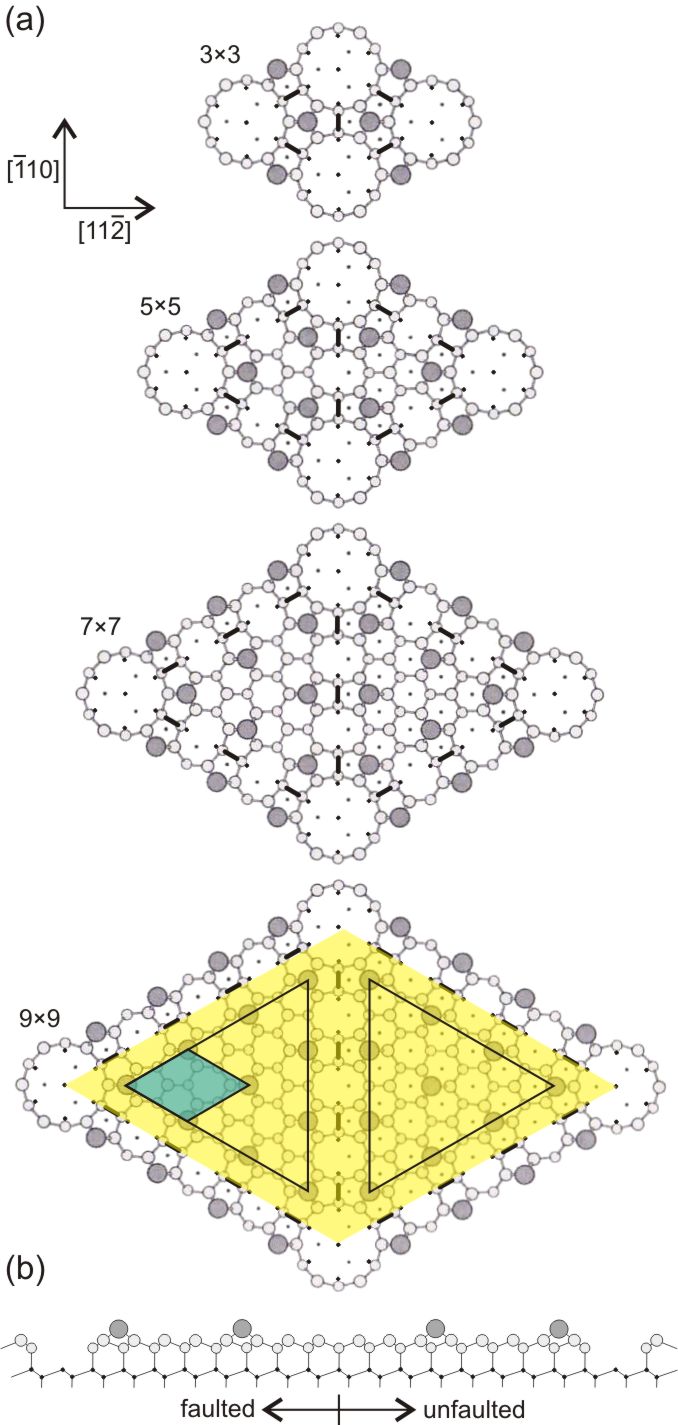
For total energy calculations we used Si-slabs of 6 BLs separated by a 30 Å thick vacuum layer. Dangling bonds at the bottom side of the slabs were saturated by hydrogen, while the top layers were modified according to the DAS , , and atomic models [15], as well as a model, consisting of adatoms on sites. A graphical description of the surface structures is presented in Figures 1(a) (top-view) and 1(b) (cross-sectional view along the direction).
The total number of Si atoms in the slabs were the following: 106 for , 300 for , 592 for , 982 for and 49 for . The positions of all slab atoms (except for the H atoms and Si atoms in the bottom bilayer) were fully optimized until the atomic forces became less than 1 meV/Å. BZ integration was discretized as summations over Monkhorst-Pack (MP) -point meshes [26]. The following BZ-sampling schemes were applied: MP- for , MP- for , MP- for , MP- for and MP- for surface slabs. These sampling schemes lead to approximately the same -point density in all BZs. We found that the above calculation settings provide a relative surface energy convergence within .
Although experiments are normally performed under constant pressure, any theoretical description of surface thermodynamics is more conveniently carried out under constant volume. That avoids dealing with anharmonic effects and the cumbersome connection between temperature and volume via thermal expansion coefficients. As demonstrated by Estreicher et al. [27, 28], the small thermal expansion of crystalline Si leads to comparable constant-volume and constant-pressure free energies up to a few hundred degrees Celsius. This is enough for the present purpose. However, at higher temperatures, anharmonicity and electronic excitations become important and the results should be considered as qualitative.
The Helmholtz free energy (per unit area) of an infinite and periodic semiconductor surface must account for electronic and vibrational contributions, . Magnetic degrees of freedom are not relevant since all structures considered are diamagnetic. Rotational motion and configurational entropy are also excluded for obvious reasons. The magnitude of the electronic term () is dominant, although it has a weak -dependence. On the other hand, the vibrational term accounts for a small zero-point energy (ZPE) at K, but shows a relatively stronger -dependence.
Mostly often, is replaced by the internal electronic surface energy at absolute zero temperature, , as found from the stationary solution of the many-body electronic problem within DFT. On the other hand, is usually neglected, making , where for the sake of convenience the electronic potential energy is hereafter referred to as surface energy. This approximation is well justified in many cases, since is usually much larger than the other terms. However, as it will be shown below, this approach has been hiding an important driving force that determines the structure of the Si(111) surface.
We are interested in finding relative surface free energies () of Si(111) reconstructions. For that we will consider the Si (DAS model) as reference. The energy of a Si surface relative to that of Si () is obtained from
| (1) |
where to first approximation we start by assuming that , the slab free energy with being the total electronic energy of a particular relaxed slab made of Si atoms (3, 5, 7 or 9), and the area of the Si(111)- surface unit cell. Analogously, the Si chemical potential is approximated to the internal electronic energy per Si atom in the bulk at K, , accounting for any stoichiometric mismatch between and slabs. This quantity was found from a bulk-like slab of 3 BLs thickness with MP- for BZ sampling.
In order to estimate the error bar due to different implementations of DFT, including basis, pseudopotentials and exchange-correlation functionals, we also calculated for Si and Si using the VASP code [29, 30]. These calculations were carried out within the GGA to spin-unrestricted density functional theory, both without and with a correction for dispersion forces (PBE [31] and PBE-D3 [32, 33], respectively). Both VASP and SIESTA calculations used identical conditions, except that in the former case, being a planewave code, the Kohn-Sham states were described with planewaves with kinetic energy up to 250 eV.
| DFT software | XC functional | |||||
|---|---|---|---|---|---|---|
| infinity | ||||||
| SIESTA [22] | LDA (PZ [24]) | 2.58 | 0 | 0.15 | 0.57 | 3.95 |
| GGA (PBEsol [25]) | 2.32 | 0 | 0.23 | 0.7 | 4.16 | |
| VASP [29, 30] | GGA (PBE [31]) | - | 0 | 0.31 | - | - |
| GGA (PBE-D3 [32, 33]) | - | 0 | 0.36 | - | - | |
It is possible to calculate the formation energy of an infinitely large DAS surface. To do this, we note that the upper bilayer of DAS unit cell consists of two halves: one of them with and the other without stacking faults (faulted and unfaulted halves in short), as represented in Fig. 1. These halves are linked together by dimers on the surface [15]. They also contain adatoms on top, arranged according to a periodicity. With increasing the size of the DAS unit cell, the contribution of dimers to the surface energy scales with , while that from faulted and unfaulted areas scales with . Hence, for , the contribution of dimers can be neglected and the surface energy is simply the average between energies of two surfaces composed of adatoms: with and without stacking faults, respectively.
The surface energy difference between and reconstructed Si surfaces was estimated from experimental STM data in Ref. 34 as less than (). This figure is somewhat lower but comparable to the calculated energy differences of (LDA) and (GGA) as derived from Tab. 1. According to Tab. 1, the reconstructed Si surface has a significantly higher surface energy than , and reconstructed surfaces. The Si surface has the lowest surface energy, and that increases monotonically with increasing the size of the unit cell. The surface energy of the infinitely large DAS reconstruction is substantially (about ) higher than that of .
It is well known from experiments that is the most frequently observed surface reconstruction of Si at temperatures below the order-disorder structural transition. Therefore, the data of Tab. 1 are in seeming disagreement with the experimental results. However, considering the small energy difference between and reconstructed surfaces, it is important to inspect the relative stability of both surfaces at finite temperatures, accounting for contributions of vibrational and electronic excitations to the surface free energy.
II.2 Contribution of vibrational and electronic excitations to the free energies of Si and Si surfaces
The vibrational free energy of and reconstructed Si surfaces was obtained within the quasi-harmonic approximation, according to the usual procedure employed for defects and surfaces in semiconductors and metals [27, 28, 35, 36]. This approach is applicable to silicon up to few hundred Kelvin [28, 37], and in particular to Si(111) DAS surfaces, which form unique and stable minimum energy structures. For surfaces with structural degrees of freedom, e.g. Si [16] and Si [38] one would have to consider configurational entropy and anharmonicity [36, 39]. For those cases, the potential energy surface contains multiple minima separated by low energy barriers due to two-fold buckling of small Si structures (forming double well potentials for the case of buckled dimers on Si).
The relative surface free energy can be calculated using Eq. 1, where now includes a vibrational contribution (in addition to the electronic potential difference already reported in the previous section). The quantity can be calculated by replacing in Eq. 1 by the vibrational contribution to the Helmholtz free energy of a slab [40],
| (2) |
and is now the vibrational part of the Si chemical potential (see below). The summation of Eq. 2 runs over all vibrational mode frequencies, , of the slab (excludes 3 translational modes), and is the Boltzmann constant. The first term on the right side of Eq. 2 gives the ZPE. This is a -independent quantity, which could in principle be regarded as a potential term, and alternatively be considered as a small correction to the values of Tab. 1.
The phonon frequencies were calculated using the frozen phonon scheme as implemented in the VIBRA utility of the SIESTA software package [23]. Only zone-center phonons () were calculated. This is justified by the large lateral dimensions of and reconstructions (, ), corresponding to small BZ surface areas and rather weak phonon dispersion. For the calculation of the dynamical matrix, we employed 4 BL-thick slabs ( thickness). All Si atoms of the three top-most BLs were displaced by from their relaxed positions along all three Cartesian coordinates. These correspond to a total of 150 and 298 dynamical atoms for the and reconstructions, respectively. Thicker slabs would require a computational power out of our reach. However, as we will show below, the calculated vibrational free energy of a 64-atom supercell (with a (super)lattice spacing ), is already converged and the corresponding vibrational entropy agrees well with the measurements.
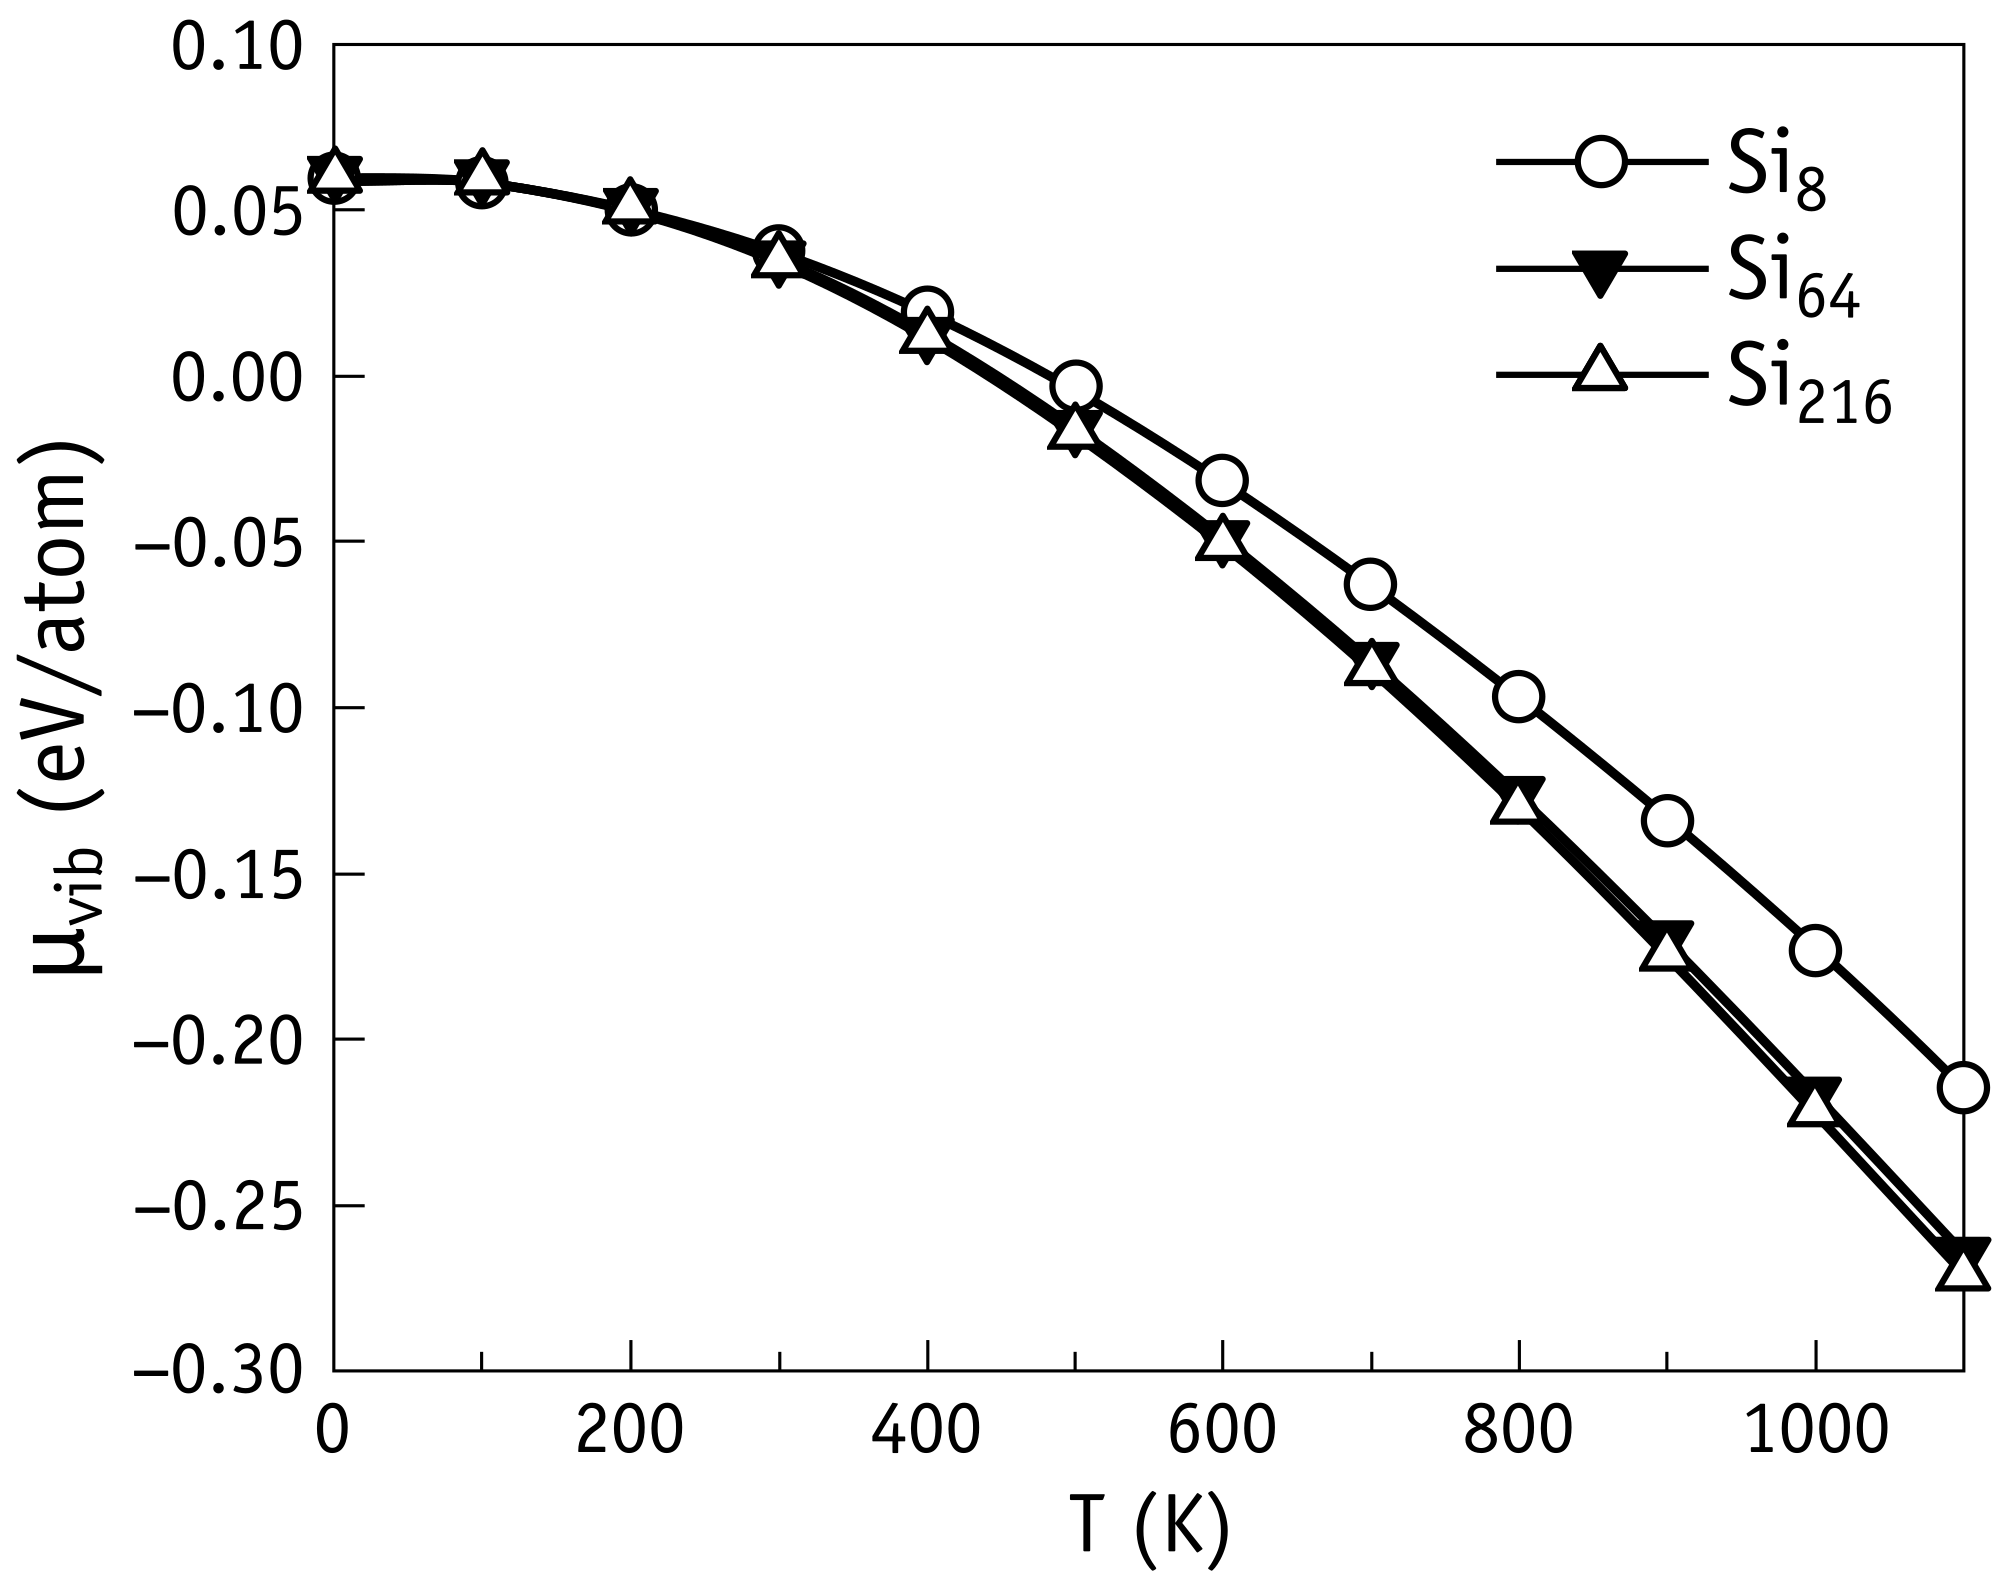
The vibrational contribution to the Si chemical potential, , was calculated using Eq. 2 for a cubic bulk Si cell. In order to test the convergence with respect to the cell size, we performed calculations using (), () and () bulk cubic cells. Results within GGA PBEsol are shown in Fig. 2; the LDA PZ results are comparable. It is clear from this figure that the values for and clusters are very close: their difference amounts to at , which translates into an error bar of only in the calculation of using Eq. 1. These findings are corroborated by the results of Estreicher et al. [28] and by convergence tests reported by Gomes et al. [37], who found no significant improvement in the calculated specific heat of Si when moving from a 64-atom cell to a 216-atom cell.
We also calculated the ZPE and vibrational entropy per Si atom, , for bulk Si. The results per molar unit are shown in Tab. 2 and they are close to both experimental data [41, 42] and previous calculations [27].
| ZPE | |||
|---|---|---|---|
| Calc.: LDA PZ, | 5.980 | 18.896 | 40.847 |
| Calc.: GGA PBEsol, | 5.871 | 19.327 | 41.350 |
| Calc.: LDA PZ, [27] | 6.201 | 18.395 | 40.308 |
| Exp. [41, 42] | 6.008 | 18.820 | 41.568 |
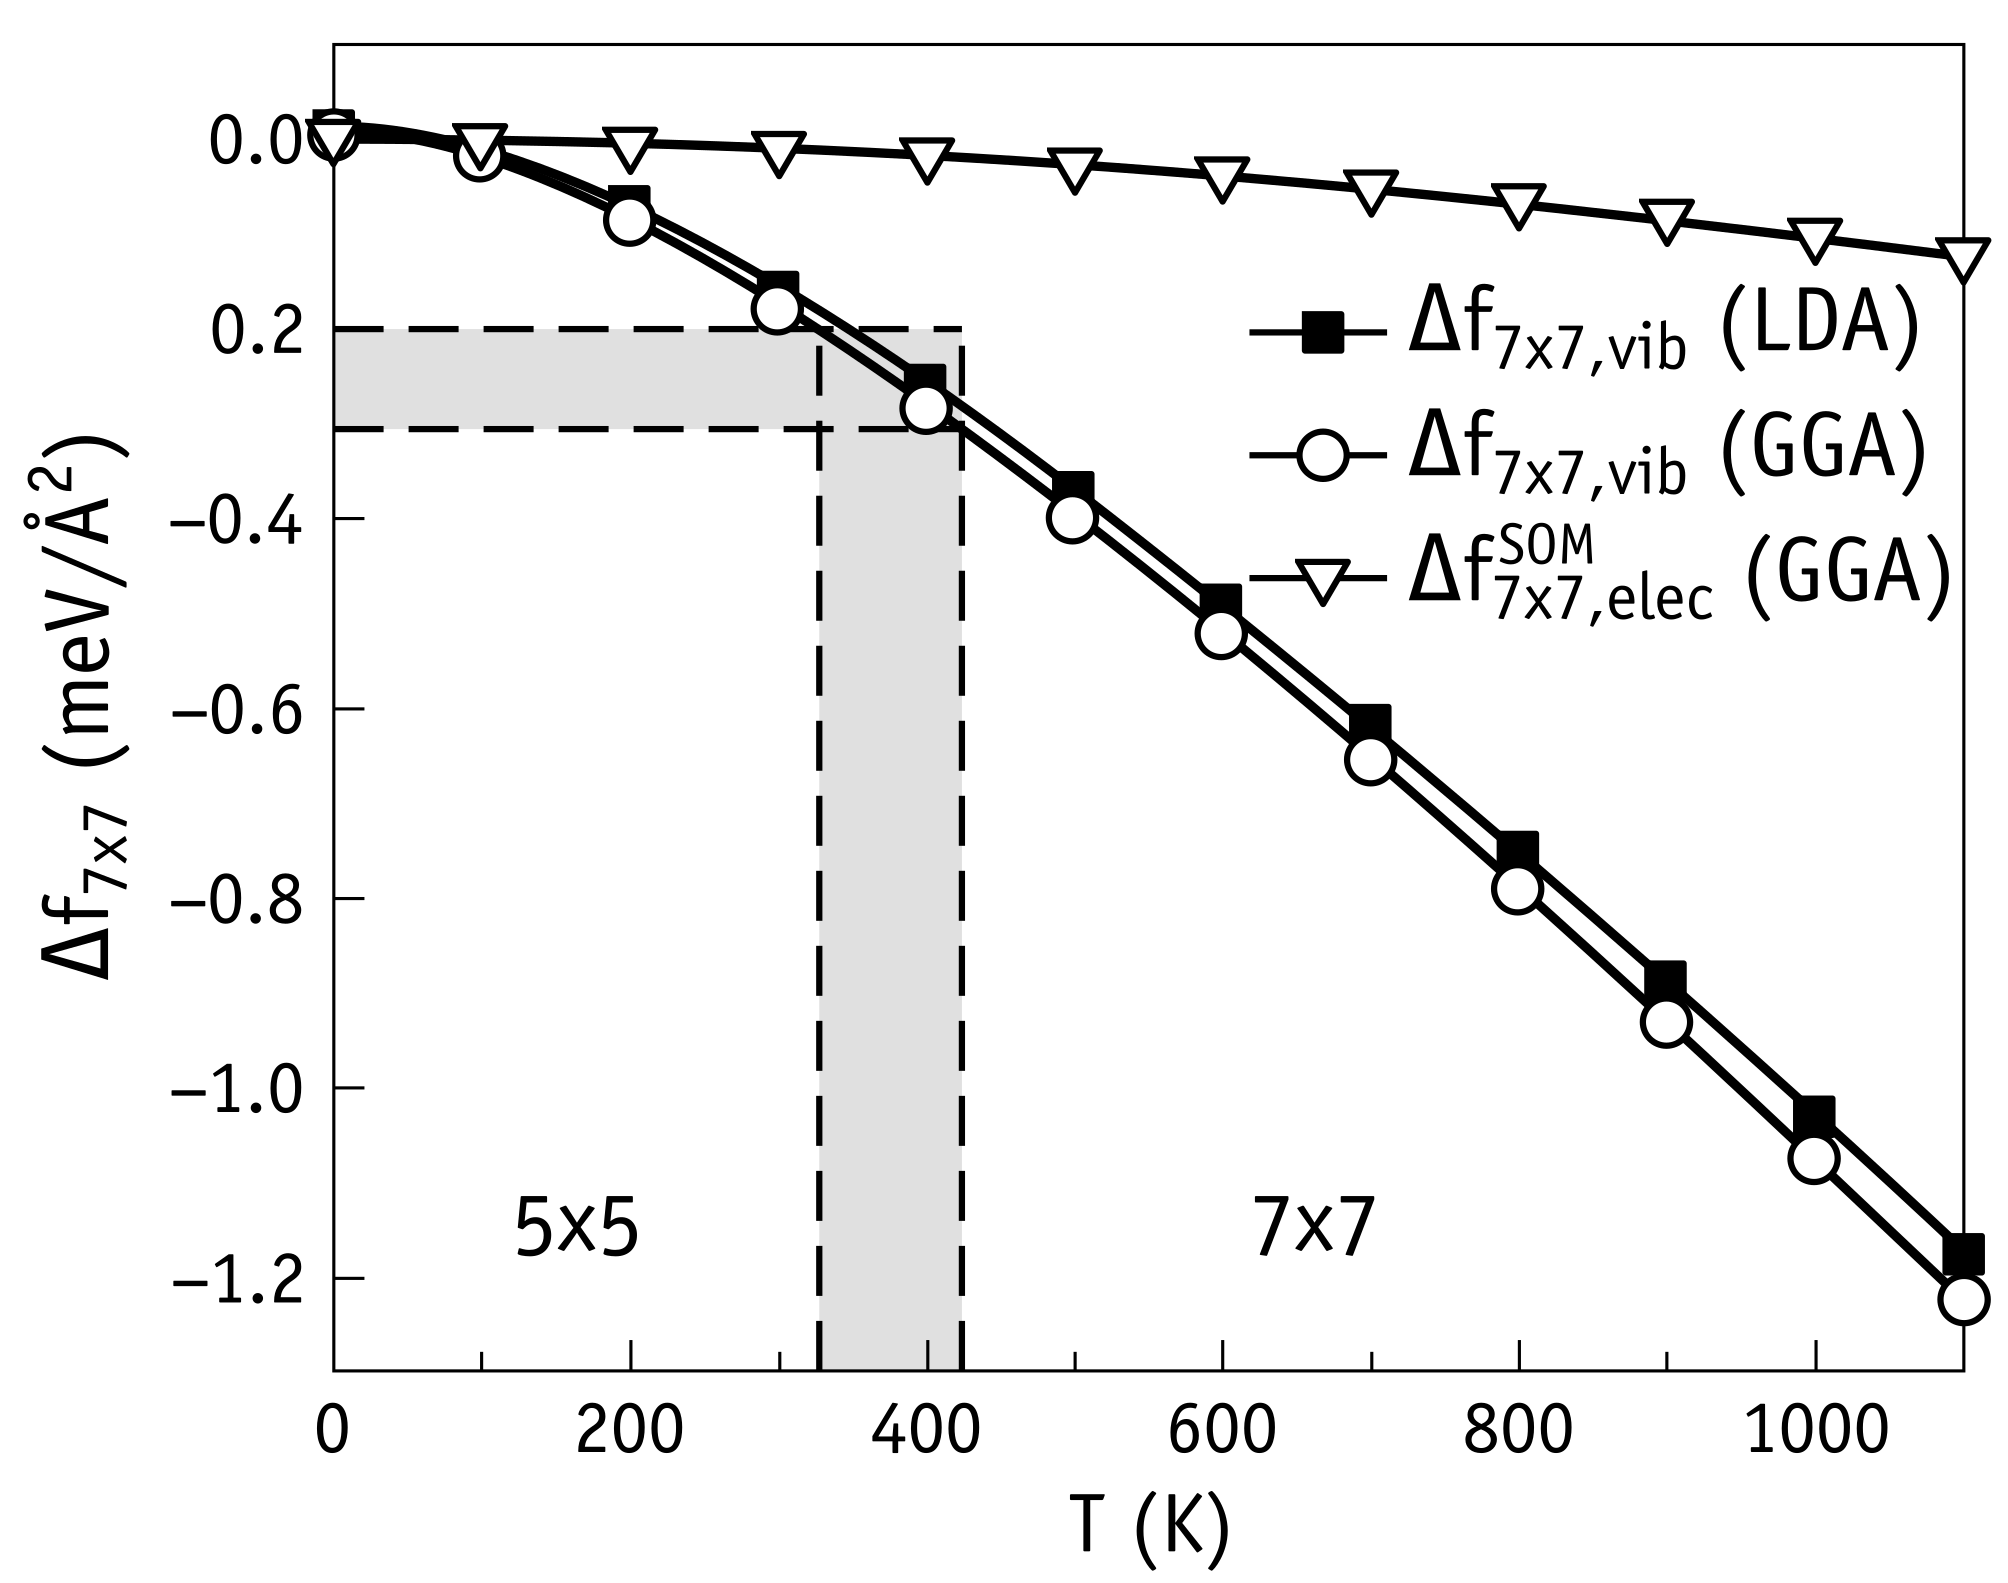
The calculated relative energy as a function of is shown in Fig. 3 for LDA PZ [24] and GGA PBEsol [25] XC functionals; A supercell was used for the calculation of . At a glance, LDA and GGA results are very similar and indicate a decrease of (stabilization of the reconstruction) with increasing the temperature. We can only explain this feature with a faster increase of vibrational entropy with temperature for the Si(111)- surface (compared to that of Si(111)-). The identification of specific vibrational modes and surface bonds at the origin of this effect may not be simple. As shown by Murali et al. [35] for the case of defects in metals, the change in vibrational entropy is not necessarily accounted for by well-identifiable localized defect modes, but mostly by resonant modes associated with vibrations in the strained regions surrounding the defects. The lower their frequency, the more likely is for such resonances to become thermally populated at a certain temperature, and therefore the higher their contribution to the entropy change.
Our resultssuggest a relative softening of the Si(111)- surface and subsurface bonds when compared to Si(111)-. That would make the excited vibrational spectrum of the Si(111)- more dense and accessible with temperature raising.
At this point, an obvious question is whether electronic entropy also has a role to play? It has been shown that gap states deeper than eV from the band edges impact no more than few tens of meV to the electronic free energy of formation, even at several hundred Kelvin [27, 28]. Explicit calculations of the electronic free energy of TiN semiconductor surface confirms that electronic excitations are only significant above K [39]. Sommerfeld’s approximation to the electronic free energy of metals [43],
| (3) |
provides us with an approximate and simple quantification of electronic entropy of a metallic or semi-metallic surface. Accordingly, is proportional to the density of electronic states at the Fermi level, . Even for a Si reconstruction, where the gap between highest occupied and lowest unoccupied surface states can be as narrow as few tens of meV [44], is rather small, implying that the difference between of two close surfaces (such as and members of the DAS family), should be also small. Sommerfeld’s electronic free energy of Si(111)- with respect to the same quantity for Si(111)-, namely , was calculated using Eqs. 1 and 3, assuming a vanishing electronic entropy from the bulk Si chemical potential (). We applied a -wide Gaussian broadening to the Kohn-Sham energy levels in the evaluation of . The results obtained within GGA PBEsol are shown in Fig. 3 as open triangles. Like , the electronic surface free energy decreases with increasing the temperature (also working toward a stabilization of the reconstruction). This is explained by approximately 8% higher density of dangling bonds on reconstructed surface than on surface, and therefore by a higher density of states of the reconstruction within the Si gap. However, as anticipated, the calculated values of are at least one order of magnitude lower than , suggesting that electronic entropy can be safely neglected. Hence, to a good approximation, the free energy difference between and reconstructed surfaces is simply given by .
We reported already (see Tab. 1) that the electronic surface energy is positive and dominates the surface free energy at low temperatures (favoring the structure). On the other hand, (Fig. 3) is increasingly negative with temperature (favoring the structure), meaning that there is a phase transition temperature above which the Si(111)- becomes more stable. Considering that (Tab. 1) the transition temperature is found at , i.e., slightly above room temperature (Fig. 3).
The usual way to prepare a clean Si(111) surface involves sample flashing at for about followed by cooling to the desired temperature [10]. Above the order-disorder phase transition temperature at , the Si surface contains a high density of mobile Si adatoms [34] and exhibits diffraction pattern reflecting the Si substrate below the moving adatoms. The reconstruction forms at around the transition temperature and persists at lower temperatures. Our results are in agreement with these well established observations, namely, the Si(111)- reconstruction is the most stable across a wide temperature range up to .
However, the structure on Si was also observed below room temperature with no sign of structure change to [44]. The most likely explanation for this experimental fact is the existence of a high kinetic barrier making the transformation unlikely. The hindered diffusion of Si atoms on and reconstructed surfaces below room temperature provides an example of an effective slowing factor. Other effects, including a barrier for Si atom detachment may be invoked as well. Indeed, the and reconstructions have different surface atomic density [34]. Hence, the structural transformation requires the removal (or addition) of excessive (or deficient) Si surface atoms from Si terraces, for instance by moving them to the always existing step edges on the sample surface. Si surface diffusion on Si- at room temperature is strongly hindered due to the high energy barrier () that separates two halves of the unit cell [45]. This experimental figure is in agreement with DFT calculations showing that there is an energy barrier of about separating faulted and unfaulted half-cells for diffusing Si adatoms [46]. The height of energy barriers for adatom migration depend on the local atomic arrangement of surface atoms within the DAS structures. This is essentially identical for and reconstructions, suggesting that the energy barriers on and - surfaces should be similarly high. Such a conclusion was also drawn from experimental STM data obtained on Ge and - reconstructed surfaces [47]. Thus, according to our calculations the reconstruction is metastable below room temperature, being frozen in upon cooling from high temperatures.
III Conclusions
The relative thermodynamic stability of the , , , and infinitely large DAS reconstructions on Si surface was investigated by means of first-principles calculations within density functional theory. It was found that the surface energy ordering (from lowest to highest) at is: , , , , infinitely large. The vibrational entropy contribution to the free energy of formation was evaluated for the and surfaces in the temperature range . The contribution of electronic entropy was shown to be negligible. Accordingly, the reconstruction is energetically more favorable than at low temperatures, with the phase transition anticipated to occur at around room temperature. The invariable observation of the phase is explained by the low mobility of Si atoms on the surface, effectively freezing it in a metastable state during cooling. Our study shows that vibrational entropy plays a crucial role in the stabilization of reconstruction at elevated temperatures, and reveals the metastable nature of this structure below room temperature.
Acknowledgements.
R. A. Z. would like to thank the Novosibirsk State University for providing the computational resources. This work was supported by the Russian Science Foundation (project no. 19-72-30023). J. C. thanks the support of FCT in Portugal through Projects LA/P/0037/2020, UIDB/50025/2020, UIDP/50025/2020References
- Da̧browski et al. [1994] J. Da̧browski, H.-J. Müssig, and G. Wolff, Phys. Rev. Lett. 73, 1660 (1994).
- Erwin et al. [1996] S. C. Erwin, A. A. Baski, and L. J. Whitman, Phys. Rev. Lett. 77, 687 (1996).
- Bechstedt et al. [2001] F. Bechstedt, A. A. Stekolnikov, J. Furthmüller, and P. Käckell, Phys. Rev. Lett. 87, 016103 (2001).
- Battaglia et al. [2009] C. Battaglia, K. Gaál-Nagy, C. Monney, C. Didiot, E. F. Schwier, M. G. Garnier, G. Onida, and P. Aebi, Phys. Rev. Lett. 102, 066102 (2009).
- Kuzmin et al. [2014] M. Kuzmin, M. P. J. Punkkinen, P. Laukkanen, J. J. K. Lång, J. Dahl, L. Vitos, and K. Kokko, J. Phys. Chem. C 118, 1894 (2014).
- Zhachuk and Teys [2017] R. A. Zhachuk and S. A. Teys, Phys. Rev. B 95, 041412(R) (2017).
- Zhachuk and Shklyaev [2019] R. A. Zhachuk and A. A. Shklyaev, Appl. Surf. Sci. 494, 46 (2019).
- Zhachuk et al. [2020] R. A. Zhachuk, A. E. Dolbak, and A. A. Shklyaev, Surf. Sci. 693, 121549 (2020).
- Zhachuk and Coutinho [2020] R. A. Zhachuk and J. Coutinho, Appl. Surf. Sci. 533, 147507 (2020).
- Zhachuk et al. [2021] R. A. Zhachuk, D. I. Rogilo, A. S. Petrov, D. V. Sheglov, A. V. Latyshev, S. Colonna, and F. Ronci, Phys. Rev. B 104, 125437 (2021).
- Stekolnikov et al. [2002] A. A. Stekolnikov, J. Furthmüller, and F. Bechstedt, Phys. Rev. B 65, 115318 (2002).
- Zhachuk et al. [2013] R. Zhachuk, S. Teys, and J. Coutinho, J. Chem. Phys. 138, 224702 (2013).
- Pandey [1981] K. C. Pandey, Phys. Rev. Lett. 47, 1913 (1981).
- Zhachuk et al. [2017] R. Zhachuk, J. Coutinho, A. Dolbak, V. Cherepanov, and B. Voigtländer, Phys. Rev. B 96, 085401 (2017).
- Takayanagi et al. [1985] K. Takayanagi, Y. Tanishiro, S. Takahashi, and M. Takahashi, Surf. Sci. 164, 367 (1985).
- Seino et al. [2004] K. Seino, W. G. Schmidt, and F. Bechstedt, Phys. Rev. Lett. 93, 036101 (2004).
- S̆tich et al. [1992] I. S̆tich, M. C. Payne, R. D. King-Smith, J.-S. Lin, and L. J. Clarke, Phys. Rev. Lett. 68, 1351 (1992).
- Ishizaka et al. [1991] A. Ishizaka, T. Doi, and M. Ichikawa, Appl. Phys. Lett. 58, 902 (1991).
- Needels [1993] M. Needels, Phys. Rev. Lett. 71, 3612 (1993).
- Solares et al. [2005] S. D. Solares, S. Dasgupta, P. A. Schultz, Y.-H. Kim, C. B. Musgrave, and W. A. Goddard, Langmuir 21, 12404 (2005).
- Troullier and Martins [1991] N. Troullier and J. L. Martins, Phys. Rev. B 43, 1993 (1991).
- Soler et al. [2002] J. M. Soler, E. Artacho, J. D. Gale, A. García, J. Junquera, P. Ordejón, and D. Sánchez-Portal, J. Phys.: Condens. Matter 14, 2745 (2002).
- García et al. [2020] A. García, N. Papior, A. Akhtar, E. Artacho, V. Blum, E. Bosoni, P. Brandimarte, M. Brandbyge, J. I. Cerdá, F. Corsetti, R. Cuadrado, V. Dikan, J. Ferrer, J. Gale, P. García-Fernández, V. M. García-Suárez, S. García, G. Huhs, S. Illera, R. Korytár, P. Koval, I. Lebedeva, L. Lin, P. López-Tarifa, S. G. Mayo, S. Mohr, P. Ordejón, A. Postnikov, Y. Pouillon, M. Pruneda, R. Robles, D. Sánchez-Portal, J. M. Soler, R. Ullah, V. W. zhe Yu, and J. Junquera, J. Chem. Phys. 152, 204108 (2020).
- Perdew and Zunger [1981] J. P. Perdew and A. Zunger, Phys. Rev. B 23, 5048 (1981).
- Perdew et al. [2008] J. P. Perdew, A. Ruzsinszky, G. I. Csonka, O. A. Vydrov, G. E. Scuseria, L. A. Constantin, X. Zhou, and K. Burke, Phys. Rev. Lett. 100, 136406 (2008).
- Monkhorst and Pack [1976] H. J. Monkhorst and J. D. Pack, Phys. Rev. B 13, 5188 (1976).
- Sanati and Estreicher [2003] M. Sanati and S. K. Estreicher, Solid State Commun. 128, 181 (2003).
- Estreicher et al. [2004] S. K. Estreicher, M. Sanati, D. West, and F. Ruymgaart, Phys. Rev. B 70, 125209 (2004).
- Kresse and Furthmüller [1996a] G. Kresse and J. Furthmüller, Phys. Rev. B 54, 11169 (1996a).
- Kresse and Furthmüller [1996b] G. Kresse and J. Furthmüller, Comp. Mater. Sci. 6, 15 (1996b).
- Perdew et al. [1996] J. P. Perdew, K. Burke, and M. Ernzerhof, Phys. Rev. Lett. 77, 3865 (1996).
- Grimmea et al. [2010] S. Grimmea, J. Antony, S. Ehrlich, and H. Krieg, J. Chem. Phys. 132, 154104 (2010).
- Grimme et al. [2011] S. Grimme, S. Ehrlich, and L. Goerigk, J. Comp. Chem. 32, 1456 (2011).
- Yang and Williams [1994] Y.-N. Yang and E. D. Williams, Phys. Rev. Lett. 72, 1862 (1994).
- Murali et al. [2015] D. Murali, M. Posselt, and M. Schiwarth, Physical Review B 92, 064103 (2015).
- Kempisty and Kangawa [2019] P. Kempisty and Y. Kangawa, Physical Review B 100, 085304 (2019).
- Gomes et al. [2022] D. Gomes, V. P. Markevich, A. R. Peaker, and J. Coutinho, Physica Status Solidi B , 2100670 (2022).
- Zhachuk et al. [2018] R. Zhachuk, J. Coutinho, and K. Palotás, J. Chem. Phys. 149, 204702 (2018).
- Forslund et al. [2021] A. Forslund, X. Zhang, B. Grabowski, A. V. Shapeev, and A. V. Ruban, Physical Review B 103, 195428 (2021).
- Fultz [2010] B. Fultz, Prog. Mat. Sci. 55, 247 (2010).
- Flubacher et al. [1959] P. Flubacher, A. J. Leadbetter, and J. A. Morrison, Philos. Mag. 4, 273 (1959), in Table 5, page 285 of this paper, "cal/g atom" should read "cal/mol".
- Barin [1995] I. Barin, Thermochemical data of pure substances, 3rd ed. (VCH Verlagsgesellschaft mbH, 1995).
- Ashcroft and Mermin [1976] N. W. Ashcroft and N. D. Mermin, Solid State Physics (Sauders College Publishing, New York, 1976).
- Modesti et al. [2020] S. Modesti, P. M. Sheverdyaeva, P. Moras, C. Carbone, M. Caputo, M. Marsi, E. Tosatti, and G. Profeta, Phys. Rev. B 102, 035429 (2020).
- Sato et al. [2000] T. Sato, S. Kitamura, and M. Iwatsuki, J. Vac. Sci. Tech. A 18, 960 (2000).
- Chang and Wei [2003] C. M. Chang and C. M. Wei, Phys. Rev. B 67, 033309 (2003).
- Cherepanov and Voigtländer [2004] V. Cherepanov and B. Voigtländer, Phys. Rev. B 69, 125331 (2004).