Quantum-corrected thickness-dependent thermal conductivity in amorphous silicon predicted by machine-learning molecular dynamics simulations
Abstract
Amorphous silicon (a-Si) is an important thermal-management material and also serves as an ideal playground for studying heat transport in strongly disordered materials. Theoretical prediction of the thermal conductivity of a-Si in a wide range of temperatures and sample sizes is still a challenge. Herein we present a systematic investigation of the thermal transport properties of a-Si by employing large-scale molecular dynamics (MD) simulations with an accurate and efficient machine-learned neuroevolution potential (NEP) trained against abundant reference data calculated at the quantum-mechanical density-functional-theory level. The high efficiency of NEP allows us to study the effects of finite size and quenching rate in the formation of a-Si in great detail. We find that a simulation cell up to atoms (a cubic cell with a linear size of 11 nm) and a quenching rate down to K s-1 are required for almost convergent thermal conductivity. Structural properties, including short- and medium-range order as characterized by the pair correlation function, angular distribution function, coordination number, ring statistics and structure factor are studied to demonstrate the accuracy of NEP and to further evaluate the role of quenching rate. Using both the heterogeneous and homogeneous nonequilibrium MD methods and the related spectral decomposition techniques, we calculate the temperature- and thickness-dependent thermal conductivity values of a-Si and show that they agree well with available experimental results from 10 K to room temperature. Our results also highlight the importance of quantum effects in the calculated thermal conductivity and support the quantum-correction method based on the spectral thermal conductivity.
I Introduction
Silicon remains as one of the most fundamental semicondutor materials in the microelectronics industry. Amorphous silicon (a-Si) is a disordered semiconductor material with important technological applications, in particular as photoabsorber in solar cells Stuckelberger et al. (2017); Ramanujam et al. (2020). Understanding the thermal properties of a-Si at the atomic level is important in predicting the behavior of this material and how it may affect device performance. Experimental measurements Cahill et al. (1994); Zink et al. (2006); Regner et al. (2013); Kim et al. (2021) have played an important role in characterizing the thermal transport properties of a-Si, but theoretical understanding and reproduction of the experimental results are also important. For pristine crystalline silicon, phonons are the dominant heat carriers and phonon-mediated heat transport has been well understood in terms of anharmonic phonon-phonon scattering within the phonon-gas picture. However, due to the complexity of the structure and the absence of long-range order Elliott (1991) in amorphous systems, there are no well-defined phonon bands and the phonon-gas picture is not valid Lv and Henry (2016a). Most of heat carriers in a-Si are vibrations with short mean free paths (MFPs) due to the disorder-induced scattering and thus the thermal conductivity in a-Si is about two orders of magnitude smaller than that in crystalline silicon around room temperature Regner et al. (2013).
Assuming the dominance of disorder-mediated scattering, a harmonic Hamiltonian model has been proposed by Allen and Feldman Allen and Feldman (1993) and numerical methods based on the Kubo-Greenwood formula have been devised Feldman et al. (1993), which have led to a classification of lattice vibrations in amorphous materials into propagons, diffusons, and locons corresponding to low, medium, and high-frequency vibrations, respectively Allen et al. (1999). Recently, unified approaches that can account for both anharmonicity and disorder have been developed Isaeva et al. (2019); Simoncelli et al. (2019), providing a more comprehensive understanding of heat transport from the crystalline to the strongly disordered limit. These methods have found many applications in amorphous or amorphous-like materials, yet they have limitations, such as nonlinear scaling of the computational cost with respect to the simulation cell size and the high cost of including high-order anharmonicity.
Molecular dynamics (MD) simulations, on the other hand, have a linear-scaling computational cost with respect to the simulation cell size and contain lattice anharmonicity and phonon scatterings to all orders. MD is the most comprehensive classical atomistic simulation method to study thermal transport and has been the standard approach used for benchmarking other theoretical models or computational methods Isaeva et al. (2019); Zhou (2021); Zhang et al. (2022). However, reliable application of MD simulations to amorphous materials in general, and to a-Si in particular, is hindered by two main aspects: the scarcity of accurate and efficient interatomic potentials and the classical nature of the MD method.
In this paper, we present solutions to both of the aforementioned obstacles. On the one hand, we develop an accurate yet highly efficient interatomic potential based on machine-learning techniques for general silicon systems, applicable to a-Si in particular. There have been some machine-learned potentials (MLPs) developed for studying thermal transport in a-Si Qian et al. (2019); Li et al. (2020), but they are not efficient enough for performing a comprehensive investigation with careful convergence tests. The silicon MLP we develop in this work is based on the neuroevolution potential (NEP) framework Fan et al. (2021) which can achieve an unprecedented computational speed of about atom-step per second using a single Nvidia graphics processing units (GPU) such as Tesla A100. The high accuracy and efficiency of the NEP model allow us to reach a large simulation cell size and long evolution times, generating realistic a-Si structures that closely resemble the experimental samples, which is the prerequisite for obtaining reliable predictions for the thermal transport properties. On the other hand, we apply a proper quantum-statistical correction to the spectral thermal conductivity calculated within the homogeneous non-equilibrium molecular dynamics (HNEMD) formalism Fan et al. (2019) and find that this can lead to quantitative agreement with the experimental results Zink et al. (2006) in a wide range of temperatures, from 10 K up to the room temperature. With the combination of the efficiency and accuracy of the NEP model and a proper quantum-statistical correction, we achieved insightful results that are difficult to obtain previously.
II Training a machine-learned potential for a-Si
The NEP model is a neural network (NN) based MLP trained using the separable natural evolution strategy (SNES) Schaul et al. (2011). The NN maps the local atom-environment descriptor of a central atom to its site energy and the total energy of an extended system is the sum of the individual site energies of the atoms. The descriptor used in NEP Fan et al. (2021) consists of selected radial and angular components similar in spirit to the Behler-Parrinello symmetry functions Behler (2011) and the optimized Caro (2019) smooth overlap of atomic positions (SOAP) Bartók et al. (2013).
To train a NEP model applicable to a-Si, we reuse the well-designed training database that has been used to train an accurate Gaussian-approximation potential (GAP) (called GAP18 here) Bartók et al. (2018). This training dataset was computed at the quantum-mechanical density-functional (DFT) level using the PW91 functional Perdew et al. (1992) and covers a wide range of silicon structures, including the liquid and a-Si ones in particular. The GAP18 potential has been demonstrated to be well transferable and is able to simultaneously describe various properties of crystalline and non-crystalline silicon Deringer et al. (2018). However, thermal transport usually involves large length and long time scales and GAP18 is not currently efficient enough for this purpose. The NEP model as implemented in the gpumd package Fan et al. (2017a, 2022), on the other hand, can reach a computational speed of about atom-step per second for a-Si by using a single GPU card such as Tesla V100, which is about three orders of magnitude faster than GAP18 using 72 Xeon-Gold 6240 central processing unit (CPU) cores Fan et al. (2021).
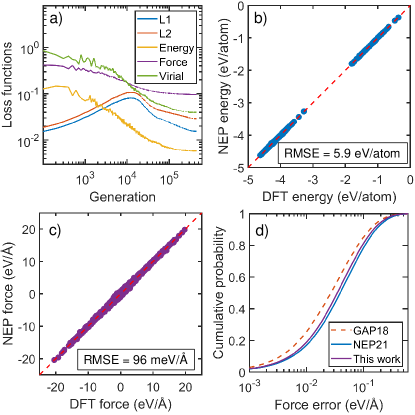
A NEP model has already been trained previously for bench-marking the NEP framework Fan et al. (2021) (we call it NEP21), but with a better understanding on the hyperparameters, we here re-train it by changing the relative weight of virial from to , keeping all the other hyperparameters as used in Ref. Fan et al., 2021 unchanged. Figure 1(a) shows the convergence trend of the root-mean-square error (RMSE) of energy, force, and virial during the training process. We note that both and regularization are used in our training, which can help to increase the robustness of the potential. Upon convergence, the predicted energy and force from NEP correlate with the reference data very well, as shown in Figs. 1(b) and 1(c). The converged energy and force RMSEs for the training data set are meV/atom and meV/Å respectively. The corresponding RMSEs for the hold-out testing data set as used in Ref. Bartók et al., 2018 are meV/atom and meV/Å respectively. As can be seen in Fig. 1(d), the NEP model trained in this work is slightly more accurate than NEP21 but is still less accurate than GAP18. This training accuracy is similar to that obtained by using the atomic cluster expansion approach Dusson et al. (2022). Despite the relatively lower training accuracy, the NEP trained here exhibits performance on a par with GAP18 in predicting the various structural properties of a-Si, as will be demonstrated below.
III Sample generation and structural characterization
III.1 Generating a-Si samples
The key ingredient for obtaining reliable results for the physical properties of a-Si is sample preparation. To this end, we use classical MD simulations with a melt-quench-anneal process to prepare the a-Si samples. All the MD simulations are performed using the gpumd package Fan et al. (2017a) (version 2.9.1). We take diamond silicon as the initial structure and quickly heat it up to K to reach the liquid state and equilibrate it for ns. Then, we cool down the system with the target temperature in the thermostat linearly dropping from to a temperature (from to K) with a given quenching rate (from down to K s-1). Finally, we anneal the quenched sample at for ns to obtain a well equilibrated a-Si structure. We use the isothermal-isobaric ensemble (zero target pressure) realized by the Berendsen thermostat and barostat Berendsen et al. (1984) during the melt-quench-anneal process. We have checked that using the recently proposed Bernetti-Bussi barostat Bernetti and Bussi (2020) combined with the Bussi-Donadio-Parrinello thermostat Bussi et al. (2007) does not lead to noticeably different results. In all the MD simulations, we use a time step of fs.
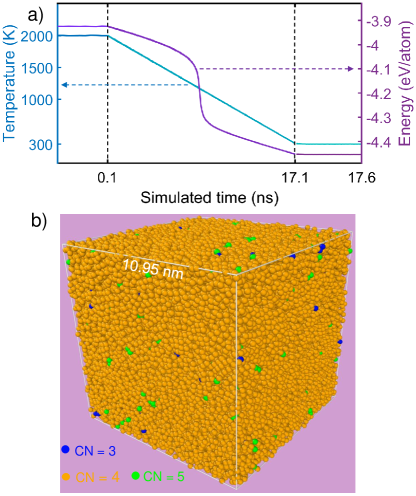
Figure 2(a) shows the evolution of the temperature and potential energy in the case of K and K s-1 obtained by using a system with atoms. In this case, the quenching process lasts ns. To appreciate the high computational demands for heat transport applications and the excellent computational efficiency of NEP we note that, to reach the same quenching rate, the system size must be chosen to be in GAP18 Deringer et al. (2018) with a time step of fs.
III.2 Short-range order
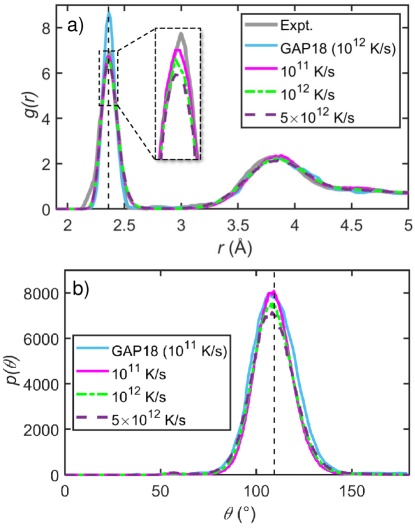
After generating the a-Si samples, we first characterize the bond motifs of the short-range order in terms of the pair-correlation function (PCF), the angular-distribution function (ADF), and the coordination number (CN). The results are shown in Fig. 3 and Table 1. For the first peak located at about Å in the PCF, the height calculated from the NEP model increases with decreasing quenching rate , getting close to the experimental value Laaziri et al. (1999a) when is reduced to K s-1. The GAP18 model Bartók et al. (2018) gives a sharper distribution around the first peak. All the theoretical and experimental results agree well beyond the first peak, particularly at the second peak at Å.
For the ADF, there are no experimental data, but the NEP and GAP18 models agree well for the same quenching rate K s-1. Both show a peak at an angle of , indicating the dominance of bond motifs in a-Si. Similar to the case of PCF, the peak height in the ADF increases with decreasing quenching rate which indicates that a smaller quenching rate leads to a more locally ordered a-Si structure.
| (K s-1) | ||||
|---|---|---|---|---|
| % | % | % | ||
| % | % | % | ||
| % | % | % | ||
| Deringer et al. (2018) | % | % | % |
Based on the PCF, we determine the CN of each atom from the neighboring atoms within a cutoff distance of Å. The calculated fractions of atoms with different CNs and the average CN are presented in Table 1. Most atoms have a CN of 4 and the percentage of these atoms increases from to as the quenching rate decreases from K s-1 to K s-1. This trend is in good agreement with that from GAP18 Deringer et al. (2018). The results here again indicate that a lower quenching rate leads to a more locally ordered a-Si sample. At the lowest quenching rate here, the averaged CNs from our NEP model and GAP18 are both close to 4. In contrast, the experimentally annealed a-Si samples prepared by ion implantation have an averaged CNs of Laaziri et al. (1999b). This can be understood by noting that the experimental a-Si samples are 1.8% less dense than the crystalline precursor that has a CN of 4 due to the appearance of vacancy defects.
III.3 Medium-range order
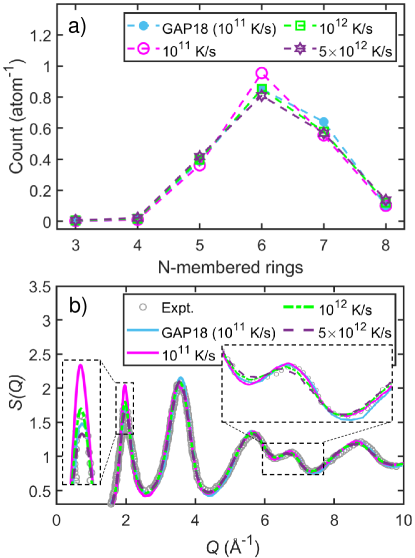
Apart from the short-range order as characterized by the PCF, ADF, and CN, we also characterize the medium-range order. Ring motifs involve the sequential connections of coordination tetrahedra and can be used to characterize near or intermediate medium-range order that is the next length scale following the short-range domain Elliott (1991). We compute the ring distribution in Fig. 4(a) using shortest-path algorithm Franzblau (1991). For crystalline diamond silicon, all atoms are connected to one another in the cyclohexane-like 6-membered units with one ring per atom. For a-Si, the most energetically favorable -membered rings still dominate but 7- and 5-membered rings are also energetically viable and exist with a considerable amount as defected motifs in the three-dimensional network of a-Si Deringer et al. (2018). With decreasing quench rate, the average number of 6-membered rings increases, which indicates an increased near or intermediate medium-range ordering.
The structure factor , one of the most common experimental structural probes, is typically regarded as a signature of medium-range ordering Elliott (1991); Hejna et al. (2013); Xie et al. (2013). Computationally, is typically derived as the Fourier transform of the PCF, i.e., . For the comparison with diffraction experiments, we also calculate the static in Fig. 4(b) using the isaacs package Le Roux and Petkov (2010). The first peak usually gives an indication of intermediate or far medium-range ordering Deringer et al. (2018); Hejna et al. (2013); Xie et al. (2013), and we see that it strengthens (in terms of increased value) at about Å-1 with decreasing quenching rate. Specifically for a-Si, there is a direct connection between the first peak in and the second peak in the PCF, which corresponds to second-neighbors distances Dahal et al. (2021). Also, the shoulder peak at about Å-1 features more clearly for lower quenching rate (see inset of Fig. 4(b)). Indeed, Laaziri et al. Laaziri et al. (1999b) observed experimentally that annealed a-Si samples exhibit a more featured shoulder peak than as-deposited ones. The quantitative differences between the results from NEP and GAP18 as shown in Fig. 4 are most likely due to the different simulation cell sizes.
IV Heat transport in amorphous silicon
IV.1 Effects of size and quenching rate on thermal conductivity
After generating and thoroughly characterizing the structures of the a-Si samples, we study their heat transport properties. There are numerous methods for computing thermal conductivity at the atomistic level Gu et al. (2021), but MD in particular is efficient for strongly disordered systems. Among the various MD-based methods for thermal conductivity calculations, the HNEMD method has been proven to be the most efficient one Fan et al. (2019). In this method, one applies an external driving force
| (1) |
to create a nonzero heat current. Here is the driving force parameter with the dimension of inverse length and is the per-atom virial tensor (not necessarily symmetric for many-body potentials) Fan et al. (2015); Gabourie et al. (2021); Fan et al. (2021) defined as
| (2) |
where denotes tensor product between two vectors, is the site energy of atom , and is defined as , being the position of atom . In the linear-response regime, the nonequilibrium ensemble average (denoted by ) of the heat current is proportional to the the driving force parameter:
| (3) |
where is the temperature and is the volume. Here the instant heat current is calculated based on the definition Fan et al. (2015); Gabourie et al. (2021); Fan et al. (2021)
| (4) |
where is the velocity of atom . The thermal conductivity tensor can thus be extracted from Eq. (3). The judicious choices of the magnitude of for the systems here are presented in Fig. S1 of the Supplementary Material (SM).
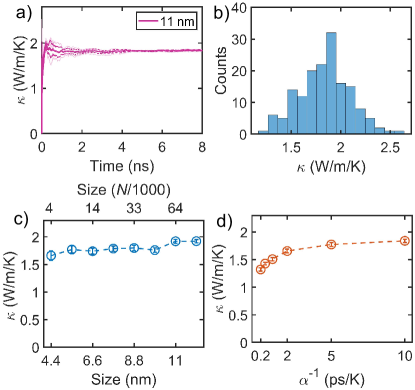
Figure 5(a) shows the cumulatively averaged versus time in the HNEMD simulations for three independent a-Si samples with atoms obtained with a quenching rate of K s-1 and a final temperature of K. We see that converges nicely with the simulation time. For temperatures K, we use six a-Si samples due to the worse ergodicity in MD simulations with decreasing temperature. In all the cases, we treat the trajectories for different samples as a whole and divide them into about 100 equally-sized blocks and calculate a proper estimate of the statistical error (measured as the standard error). Figure 5(b) presents the distribution of the block-averaged values.
The HNEMD method is physically equivalent to the Green-Kubo method and thus has similar finite-size effects as in the Green-Kubo method Gu et al. (2021), which come from two competing effects Ladd et al. (1986): a finite cell truncates some long-wavelength vibrations and also ignores some scattering events. In disordered materials, the former should dominate and we expect that will increase with increasing simulation cell size. This is indeed the case for our results shown in Fig. 5(c) (see Fig. S2 in the SM for the time convergence of for each cell size), where we can see that it requires a system size of atoms (or a linear size of 11 nm in a cubic cell) to almost converge . This is the size we use for all the subsequent calculations except for those in Sec. IV.4, where we explore the effects of finite simulation domain size in more depth.
Similar to the structural properties, in a-Si is also sensitive to the quenching rate , increasing with decreasing and converging to about W m-1 K-1 at about K s-1, see Fig. 5(d) (see Fig. S3 in the SM for the time convergence of for each quenching rate). That is, a more ordered structure from a lower quenching rate conducts heat better. Based on the short- and medium-range characterizations, it seems K s-1 is a safe choice that is also computationally affordable. We thus use this quenching rate in all the subsequent calculations.
It is worth noting that experimentally measured thermal conductivity of a-Si varies from to W mK-1 Liu et al. (2009); Kwon et al. (2017); Cahill et al. (1994); Kim et al. (2021); Regner et al. (2013); Zink et al. (2006) at room temperature. This large variation is most likely due to the structural differences of the a-Si samples: more ordered samples tend to have higher thermal conductivity according to our results above. For example, Liu et al. Liu et al. (2009) reported a thermal conductivity of 4 W m-1 K-1 for a -m-thick a-Si film deposited by the hot-wire chemical vapor deposition (CVD) method at room temperature, and they confirmed that their a-Si structures are more ordered and possess higher medium-range order than typical ones. Using another flavor of CVD, the vapor-liquid-solid mediated low-pressure CVD, Kwon et al. Kwon et al. (2017) also obtained a thermal conductivity up to 4 W m-1 K-1 for a -m-thick a-Si film at K. On the other hand, a-Si samples prepared by physical vapor deposition (PVD), such as sputtering deposition Regner et al. (2013); Cahill et al. (1994), electron-beam deposition Zink et al. (2006) and self-implantation Laaziri et al. (1999b, a), tend to be more disordered. Particularly, the a-Si samples by Zink et al. are of high purity without crystallinity Zink et al. (2006). Our numerical a-Si sampled prepared by the melt-quench-anneal protocol resemble the PVD ones Laaziri et al. (1999b, a) as has been shown above. Therefore, we will mainly compare our thermal conductivity results against those by Zink et al Zink et al. (2006), which span a large range of temperature (from a few K to a few hundred K).
IV.2 Quantum-statistical correction
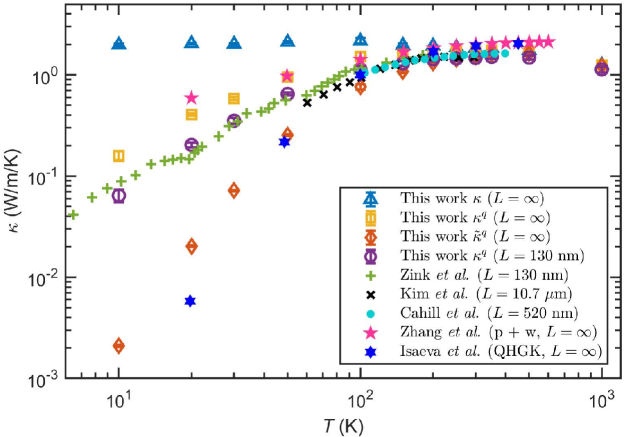
After determining the converged and , we calculate for a-Si at different temperatures and compare the results with experimental ones, see Fig. 6. Figure S4 in the SM presents the time convergence of for each temperature. The HNEMD results (triangles) only agree with the experimental ones around and above room temperature, significantly overshooting at low temperatures.
Considering the fact that MD simulations follow classical statistics and the relatively high Debye temperature of silicon (about 487 K) Zink et al. (2006), we expect that this overshooting is mostly due to the missing quantum-statistical effects in the MD simulations. To study this in detail, we note that there is a feasible quantum-correction method based on the spectral thermal conductivity in the HNEMD formalism Fan et al. (2019). In this formalism, one can obtain the spectral thermal conductivity as a function of the vibrational frequency and temperature with a Fourier transform of the so-called virial-velocity correlation function Fan et al. (2019); Gabourie et al. (2021), which is a generalization of the spectral heat current approach Sääskilahti et al. (2014, 2015) from interface to bulk materials. The virial-velocity correlation function is defined as Fan et al. (2019); Gabourie et al. (2021):
| (5) |
The summation is over the atoms in a control volume of interest, and indicates the average over different time origins. The spectral thermal conductivity is then calculated as
| (6) |
This is classical but it can be quantum corrected by multiplying it with a ratio between quantum and classical modal heat capacity Lv and Henry (2016b); Sääskilahti et al. (2016); Fan et al. (2017b),
| (7) |
where , is the reduced Planck constant and is the Boltzmann constant. The effectiveness of this quantum-correction method for amorphous systems originates from the fact that the population of vibrations has negligible effects on elastic scattering processes. This is in sharp contrast with crystals, where inelastic phonon-phonon scattering dominates and the over-populated high-frequency phonons in classical MD can reduce the lifetime of the low-frequency phonons and a simple correction of the phonon population usually leads to an underestimated thermal conductivity Turney et al. (2009).
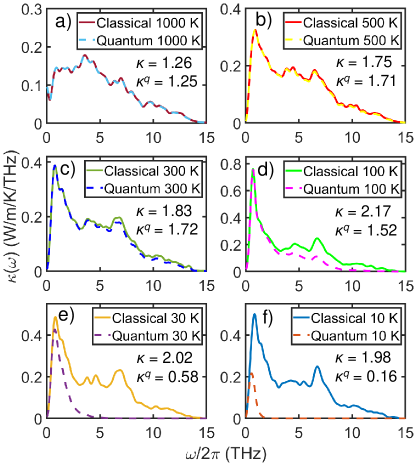
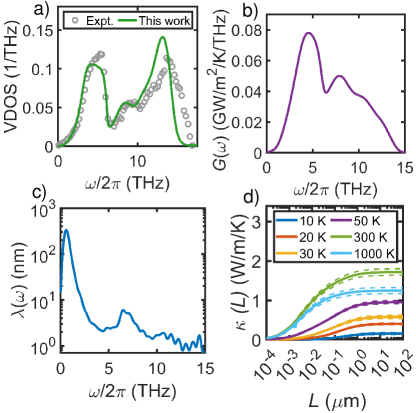
Figure 7 shows the classical and quantum-corrected spectral thermal conductivity at different temperatures. Quantum corrections are large at low temperatures and high frequencies, which is consistent with the fact that the populations of the vibrational modes in these conditions are artificially high in classical MD simulations. The total quantum corrected thermal conductivity is then obtained as an integral of over the frequency as
| (8) |
At room temperature, is close to unity at , while it becomes as small as at 10 K. The strong quantum-statistical effects make the classical MD results to fail to describe the experimental measurements at low temperatures. After applying the quantum correction, the HNEMD results (squares in Fig. 6) are much closer to the experimental ones by Zink et al Zink et al. (2006), but are still slightly too large at the low-temperature limit. We note that if is not available, one may attempt to make a quantum correction based on the vibrational density of states (VDOS) :
| (9) |
This is however not quantitatively correct because does not contain the information of heat transport that is contained in and weights more for the high-frequency part than , as can be seen from a comparison between Fig. 8(a) and Fig. 7. Therefore, the quantum correction based on results in too small a ratio as compared to the correct one from the quantum correction based on , as can be clearly seen from Fig. 6 (diamond symbols).
IV.3 Length dependence of thermal conductivity
To understand the overestimation of thermal conductivity in the low-temperature limit using the statistical quantum correction, Eq. (7), we note that the experimental samples are of finite thickness in the transport direction, being nm Zink et al. (2006), while in our HNEMD simulations should be regarded as infinite. Strong length dependence of has been experimentally observed in amorphous silicon thin films Braun et al. (2016) or through MFP spectroscopy Pan et al. (2020). To enable a more proper comparison with experiments, we need to compute at a finite . A conventional approach is to perform heterogeneous non-equilibrium molecular dynamics (NEMD) simulations at different . However, a more computationally efficient and elegant way is to first perform a single NEMD simulation in the ballistic limit (low and short ) that is equivalent to the atomistic Green’s function approach Li et al. (2019), and then employ the same spectral decomposition method as in HNEMD Fan et al. (2019) to obtain the spectral thermal conductance (see Fig. 8(b)):
| (10) |
Here is the temperature difference between the heat source and heat sink in the NEMD setup. After this, one can obtain the spectral MFP as (see Fig. 8(c)), and then obtain the quantum-corrected thermal conductivity at any thickness as (see Fig. 8(d))
| (11) |
Setting nm as in the experiments Zink et al. (2006), our predicted results (circles in Fig. 6) finally agree well with the experimental ones from room temperature down to 10 K.
In Fig. 6, we also present previous theoretical results by Zhang et al. Zhang et al. (2022) and Isaeva et al. Isaeva et al. (2019). The methods in these works have been well benchmarked against their respective MD simulations, but the agreement with experimental data is less satisfactory. These two works have used the Stillinger-Weber Stillinger and Weber (1985) and Tersoff Tersoff (1989) empirical potentials, respectively, indicating that these traditional potentials that reproduce pristine Si may not be accurate enough for a-Si. It would thus be interesting to study if combining these methods and our NEP model can improve the results, although this is beyond the scope of the current paper.
Finally, to further confirm the reliability of our predictions, we considered possible external stress that can intentionally or accidentally exist in experiments and find that there is no stress-dependence of in a-Si (see Fig. S5 and Fig. S6 in the SM for details).
Note that we have considered temperatures up to 1000 K in our calculations, but as far as we know there are no available experimental data at such high temperatures. Based on our results, in a-Si at 1000 K is significantly reduced as compared to the room temperature. The validity of this prediction is yet to be confirmed by future experiments. We stress that while the possible contribution to heat conduction by electrons has been ignored in this work it should not be significant below the melting point of a-Si.
IV.4 The low-frequency limit and finite-size effects
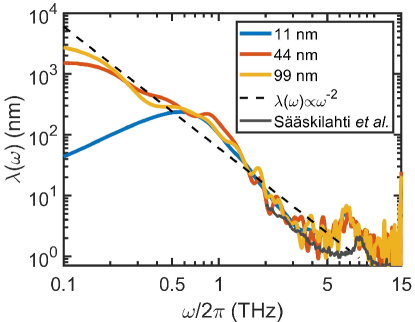
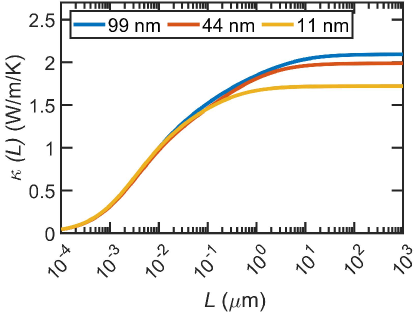
The existence of large vibrational MFPs around 1 THz is a manifestation of the existence of propagons Allen et al. (1999). These propagating phonon-like modes contribute a significant portion to the thermal conductivity, which is consistent with experimental measurements Regner et al. (2013); Braun et al. (2016); Pan et al. (2020) and previous predictions Larkin and McGaughey (2014); Moon et al. (2018); Zhou (2021); Zhang et al. (2022). We note that the MFPs in Fig. 8(c) drops in the low-frequency limit, which is caused by the finite simulation domain length. According to the effective group velocity km/s of the propagons Moon et al. (2018, 2019), a domain length of nm can only support vibrations with frequency down to THz. By considering a domain length up to 99 nm, the lower limit of the frequency that can be probed is pushed down to about 0.08 THz, as can be seen in Fig. 9. We also observe that, in the low-frequency limit, the MFPs scale as . However, the VDOS scales as (Fig. 8(a)), leading to a constant contribution to the thermal conductivity. By increasing the domain length from 11 to 99 nm, the total thermal conductivity is only increased by about 15%, but the thickness-convergence of the thermal conductivity is extended from about 1 to 10 microns (cf. Fig. 10).
V Summary and conclusions
In summary, we have studied heat transport in a-Si using extensive MD simulations with an accurate and efficient MLP constructed using the NEP approach. Realistic a-Si samples were first generated using the melt-quench-anneal process. Based on detailed structural analyses and heat transport calculations, we found that both short-range and medium-range structural order increase with reduced quenching rate, and the calculated thermal conductivity accordingly increases. A quenching rate of K s-1 is determined to be appropriate to generate realistic a-Si samples and converged thermal conductivity. The thermal conductivity calculated from HNEMD simulations also exhibits notable finite-size effects, requiring a simulation cell with a linear size of 11 nm to reach asymptotic convergence. Based on spectral decomposition techniques, we verified the importance of both quantum statistical effects and a finite sample length commensurate with experiments on the predicted thermal conductivity of a-Si. With a correction to the classical spectral thermal conductivity based on quantum statistics, we obtained good agreement with experiments from 10 K to room temperature using the same sample length. Finally, we also demonstrated that an approximate quantum-correction scheme based on the density of states is inaccurate for a-Si.
Data availability
The inputs and outputs related to the NEP model training are freely available at the Gitlab repository: https://gitlab.com/brucefan1983/nep-data. The inputs and outputs of all the MD simulations are freely available at Zenodo Wang et al. (2022).
Code availability
The source code of gpumd is available at https://github.com/brucefan1983/GPUMD and the related documentation can be found at https://gpumd.org.
Acknowledgements.
The authors acknowledge funding from the Academy of Finland, under projects 321713 (M.A.C. & Y. W.), 330488 (M.A.C.), 312298/QTF Center of Excellence program (T.A.-N., Z.F. & Y.W.), the National Natural Science Foundation of China (NSFC) under grant no. 11974059 (Z.F.), the National Key Research and Development Program of China under grant no. 2021YFB3802100 (P.Q. & Y.W), and the China Scholarship Council under grant no. CSC202006460064 (Y.W.). The authors also acknowledge computational resources from the Finnish Center for Scientific Computing (CSC) and Aalto University’s Science IT project.References
- Stuckelberger et al. (2017) Michael Stuckelberger, Rémi Biron, Nicolas Wyrsch, Franz-Josef Haug, and Christophe Ballif, “Review: Progress in solar cells from hydrogenated amorphous silicon,” Renewable and Sustainable Energy Reviews 76, 1497–1523 (2017).
- Ramanujam et al. (2020) Jeyakumar Ramanujam, Douglas M. Bishop, Teodor K. Todorov, Oki Gunawan, Jatin Rath, Reza Nekovei, Elisa Artegiani, and Alessandro Romeo, “Flexible CIGS, CdTe and a-Si:H based thin film solar cells: A review,” Progress in Materials Science 110, 100619 (2020).
- Cahill et al. (1994) David G. Cahill, M. Katiyar, and J. R. Abelson, “Thermal conductivity of a-Si:H thin films,” Phys. Rev. B 50, 6077–6081 (1994).
- Zink et al. (2006) B. L. Zink, R. Pietri, and F. Hellman, “Thermal conductivity and specific heat of thin-film amorphous silicon,” Phys. Rev. Lett. 96, 055902 (2006).
- Regner et al. (2013) Keith T Regner, Daniel P Sellan, Zonghui Su, Cristina H Amon, Alan JH McGaughey, and Jonathan A Malen, “Broadband phonon mean free path contributions to thermal conductivity measured using frequency domain thermoreflectance,” Nature communications 4, 1–7 (2013).
- Kim et al. (2021) Taeyong Kim, Jaeyun Moon, and Austin J. Minnich, “Origin of micrometer-scale propagation lengths of heat-carrying acoustic excitations in amorphous silicon,” Phys. Rev. Materials 5, 065602 (2021).
- Elliott (1991) Stephen R Elliott, “Medium-range structural order in covalent amorphous solids,” Nature 354, 445–452 (1991).
- Lv and Henry (2016a) Wei Lv and Asegun Henry, “Examining the validity of the phonon gas model in amorphous materials,” Scientific reports 6, 1–8 (2016a).
- Allen and Feldman (1993) Philip B. Allen and Joseph L. Feldman, “Thermal conductivity of disordered harmonic solids,” Phys. Rev. B 48, 12581–12588 (1993).
- Feldman et al. (1993) Joseph L. Feldman, Mark D. Kluge, Philip B. Allen, and Frederick Wooten, “Thermal conductivity and localization in glasses: Numerical study of a model of amorphous silicon,” Phys. Rev. B 48, 12589–12602 (1993).
- Allen et al. (1999) Philip B. Allen, Joseph L. Feldman, Jaroslav Fabian, and Frederick Wooten, “Diffusons, locons and propagons: Character of atomie yibrations in amorphous Si,” Philosophical Magazine B 79, 1715–1731 (1999).
- Isaeva et al. (2019) Leyla Isaeva, Giuseppe Barbalinardo, Davide Donadio, and Stefano Baroni, “Modeling heat transport in crystals and glasses from a unified lattice-dynamical approach,” Nature communications 10, 1–6 (2019).
- Simoncelli et al. (2019) Michele Simoncelli, Nicola Marzari, and Francesco Mauri, “Unified theory of thermal transport in crystals and glasses,” Nature Physics 15, 809–813 (2019).
- Zhou (2021) Yanguang Zhou, “Assessing the quantum effect in classical thermal conductivity of amorphous silicon,” Journal of Applied Physics 129, 235104 (2021).
- Zhang et al. (2022) Zhongwei Zhang, Yangyu Guo, Marc Bescond, Jie Chen, Masahiro Nomura, and Sebastian Volz, “How coherence is governing diffuson heat transfer in amorphous solids,” npj Computational Materials 8, 1–8 (2022).
- Qian et al. (2019) X. Qian, S. Peng, X. Li, Y. Wei, and R. Yang, “Thermal conductivity modeling using machine learning potentials: application to crystalline and amorphous silicon,” Materials Today Physics 10, 100140 (2019).
- Li et al. (2020) R. Li, E. Lee, and T. Luo, “A unified deep neural network potential capable of predicting thermal conductivity of silicon in different phases,” Materials Today Physics 12, 100181 (2020).
- Fan et al. (2021) Zheyong Fan, Zezhu Zeng, Cunzhi Zhang, Yanzhou Wang, Keke Song, Haikuan Dong, Yue Chen, and Tapio Ala-Nissila, “Neuroevolution machine learning potentials: Combining high accuracy and low cost in atomistic simulations and application to heat transport,” Phys. Rev. B 104, 104309 (2021).
- Fan et al. (2019) Zheyong Fan, Haikuan Dong, Ari Harju, and Tapio Ala-Nissila, “Homogeneous nonequilibrium molecular dynamics method for heat transport and spectral decomposition with many-body potentials,” Phys. Rev. B 99, 064308 (2019).
- Bartók et al. (2018) Albert P. Bartók, James Kermode, Noam Bernstein, and Gábor Csányi, “Machine learning a general-purpose interatomic potential for silicon,” Phys. Rev. X 8, 041048 (2018).
- Schaul et al. (2011) Tom Schaul, Tobias Glasmachers, and Jürgen Schmidhuber, “High Dimensions and Heavy Tails for Natural Evolution Strategies,” in Proceedings of the 13th Annual Conference on Genetic and Evolutionary Computation, GECCO ’11 (Association for Computing Machinery, New York, NY, USA, 2011) pp. 845–852.
- Behler (2011) Jörg Behler, “Atom-centered symmetry functions for constructing high-dimensional neural network potentials,” The Journal of chemical physics 134, 074106 (2011).
- Caro (2019) Miguel A. Caro, “Optimizing many-body atomic descriptors for enhanced computational performance of machine learning based interatomic potentials,” Phys. Rev. B 100, 024112 (2019).
- Bartók et al. (2013) Albert P. Bartók, Risi Kondor, and Gábor Csányi, “On representing chemical environments,” Phys. Rev. B 87, 184115 (2013).
- Perdew et al. (1992) John P. Perdew, J. A. Chevary, S. H. Vosko, Koblar A. Jackson, Mark R. Pederson, D. J. Singh, and Carlos Fiolhais, “Atoms, molecules, solids, and surfaces: Applications of the generalized gradient approximation for exchange and correlation,” Phys. Rev. B 46, 6671–6687 (1992).
- Deringer et al. (2018) Volker L. Deringer, Noam Bernstein, Albert P. Bartók, Matthew J. Cliffe, Rachel N. Kerber, Lauren E. Marbella, Clare P. Grey, Stephen R. Elliott, and Gábor Csányi, “Realistic atomistic structure of amorphous silicon from machine-learning-driven molecular dynamics,” The Journal of Physical Chemistry Letters 9, 2879–2885 (2018).
- Fan et al. (2017a) Zheyong Fan, Wei Chen, Ville Vierimaa, and Ari Harju, “Efficient molecular dynamics simulations with many-body potentials on graphics processing units,” Computer Physics Communications 218, 10–16 (2017a).
- Fan et al. (2022) Zheyong Fan, Yanzhou Wang, Penghua Ying, Keke Song, Junjie Wang, Yong Wang, Zezhu Zeng, Ke Xu, Eric Lindgren, J. Magnus Rahm, Alexander J. Gabourie, Jiahui Liu, Haikuan Dong, Jianyang Wu, Yue Chen, Zheng Zhong, Jian Sun, Paul Erhart, Yanjing Su, and Tapio Ala-Nissila, “GPUMD: A package for constructing accurate machine-learned potentials and performing highly efficient atomistic simulations,” The Journal of Chemical Physics 157, 114801 (2022).
- Dusson et al. (2022) Geneviève Dusson, Markus Bachmayr, Gábor Csányi, Ralf Drautz, Simon Etter, Cas van der Oord, and Christoph Ortner, “Atomic cluster expansion: Completeness, efficiency and stability,” Journal of Computational Physics 454, 110946 (2022).
- Stukowski (2009) Alexander Stukowski, “Visualization and analysis of atomistic simulation data with OVITO–the Open Visualization Tool,” Modelling and Simulation in Materials Science and Engineering 18, 015012 (2009).
- Berendsen et al. (1984) Herman JC Berendsen, JPM van Postma, Wilfred F Van Gunsteren, ARHJ DiNola, and Jan R Haak, “Molecular dynamics with coupling to an external bath,” The Journal of chemical physics 81, 3684–3690 (1984).
- Bernetti and Bussi (2020) Mattia Bernetti and Giovanni Bussi, “Pressure control using stochastic cell rescaling,” The Journal of Chemical Physics 153, 114107 (2020).
- Bussi et al. (2007) Giovanni Bussi, Davide Donadio, and Michele Parrinello, “Canonical sampling through velocity rescaling,” The Journal of chemical physics 126, 014101 (2007).
- Laaziri et al. (1999a) Khalid Laaziri, S. Kycia, S. Roorda, M. Chicoine, J. L. Robertson, J. Wang, and S. C. Moss, “High resolution radial distribution function of pure amorphous silicon,” Phys. Rev. Lett. 82, 3460–3463 (1999a).
- Laaziri et al. (1999b) Khalid Laaziri, S. Kycia, S. Roorda, M. Chicoine, J. L. Robertson, J. Wang, and S. C. Moss, “High-energy x-ray diffraction study of pure amorphous silicon,” Phys. Rev. B 60, 13520–13533 (1999b).
- Franzblau (1991) D. S. Franzblau, “Computation of ring statistics for network models of solids,” Phys. Rev. B 44, 4925–4930 (1991).
- Hejna et al. (2013) Miroslav Hejna, Paul J. Steinhardt, and Salvatore Torquato, “Nearly hyperuniform network models of amorphous silicon,” Phys. Rev. B 87, 245204 (2013).
- Xie et al. (2013) Ruobing Xie, Gabrielle G. Long, Steven J. Weigand, Simon C. Moss, Tobi Carvalho, Sjoerd Roorda, Miroslav Hejna, Salvatore Torquato, and Paul J. Steinhardt, “Hyperuniformity in amorphous silicon based on the measurement of the infinite-wavelength limit of the structure factor,” Proceedings of the National Academy of Sciences 110, 13250–13254 (2013).
- Le Roux and Petkov (2010) Sébastien Le Roux and Valeri Petkov, “ISAACS–interactive structure analysis of amorphous and crystalline systems,” Journal of Applied Crystallography 43, 181–185 (2010).
- Dahal et al. (2021) Devilal Dahal, Hiroka Warren, and Parthapratim Biswas, “On the origin and structure of the first sharp diffraction peak of amorphous silicon,” physica status solidi (b) 258, 2000447 (2021).
- Gu et al. (2021) Xiaokun Gu, Zheyong Fan, and Hua Bao, “Thermal conductivity prediction by atomistic simulation methods: Recent advances and detailed comparison,” Journal of Applied Physics 130, 210902 (2021).
- Fan et al. (2015) Zheyong Fan, Luiz Felipe C. Pereira, Hui-Qiong Wang, Jin-Cheng Zheng, Davide Donadio, and Ari Harju, “Force and heat current formulas for many-body potentials in molecular dynamics simulations with applications to thermal conductivity calculations,” Phys. Rev. B 92, 094301 (2015).
- Gabourie et al. (2021) Alexander J. Gabourie, Zheyong Fan, Tapio Ala-Nissila, and Eric Pop, “Spectral decomposition of thermal conductivity: Comparing velocity decomposition methods in homogeneous molecular dynamics simulations,” Phys. Rev. B 103, 205421 (2021).
- Ladd et al. (1986) Anthony J. C. Ladd, Bill Moran, and William G. Hoover, “Lattice thermal conductivity: A comparison of molecular dynamics and anharmonic lattice dynamics,” Phys. Rev. B 34, 5058–5064 (1986).
- Liu et al. (2009) Xiao Liu, J. L. Feldman, D. G. Cahill, R. S. Crandall, N. Bernstein, D. M. Photiadis, M. J. Mehl, and D. A. Papaconstantopoulos, “High thermal conductivity of a hydrogenated amorphous silicon film,” Phys. Rev. Lett. 102, 035901 (2009).
- Kwon et al. (2017) Soonshin Kwon, Jianlin Zheng, Matthew C. Wingert, Shuang Cui, and Renkun Chen, “Unusually high and anisotropic thermal conductivity in amorphous silicon nanostructures,” ACS Nano 11, 2470–2476 (2017).
- Sääskilahti et al. (2014) K. Sääskilahti, J. Oksanen, J. Tulkki, and S. Volz, “Role of anharmonic phonon scattering in the spectrally decomposed thermal conductance at planar interfaces,” Phys. Rev. B 90, 134312 (2014).
- Sääskilahti et al. (2015) K. Sääskilahti, J. Oksanen, S. Volz, and J. Tulkki, “Frequency-dependent phonon mean free path in carbon nanotubes from nonequilibrium molecular dynamics,” Phys. Rev. B 91, 115426 (2015).
- Lv and Henry (2016b) Wei Lv and Asegun Henry, “Direct calculation of modal contributions to thermal conductivity via Green–Kubo modal analysis,” New Journal of Physics 18, 013028 (2016b).
- Sääskilahti et al. (2016) K Sääskilahti, Jani Oksanen, J Tulkki, AJH McGaughey, and Sebastian Volz, “Vibrational mean free paths and thermal conductivity of amorphous silicon from non-equilibrium molecular dynamics simulations,” AIP Advances 6, 121904 (2016).
- Fan et al. (2017b) Zheyong Fan, Petri Hirvonen, Luiz Felipe C Pereira, Mikko M Ervasti, Ken R Elder, Davide Donadio, Ari Harju, and Tapio Ala-Nissila, “Bimodal grain-size scaling of thermal transport in polycrystalline graphene from large-scale molecular dynamics simulations,” Nano letters 17, 5919–5924 (2017b).
- Turney et al. (2009) J. E. Turney, A. J. H. McGaughey, and C. H. Amon, “Assessing the applicability of quantum corrections to classical thermal conductivity predictions,” Phys. Rev. B 79, 224305 (2009).
- Kamitakahara et al. (1987) W.A. Kamitakahara, C.M. Soukoulis, H.R. Shanks, U. Buchenau, and G.S. Grest, “Vibrational spectrum of amorphous silicon: Experiment and computer simulation,” Physical Review B 36, 6539 – 6542 (1987).
- Braun et al. (2016) Jeffrey L. Braun, Christopher H. Baker, Ashutosh Giri, Mirza Elahi, Kateryna Artyushkova, Thomas E. Beechem, Pamela M. Norris, Zayd C. Leseman, John T. Gaskins, and Patrick E. Hopkins, “Size effects on the thermal conductivity of amorphous silicon thin films,” Phys. Rev. B 93, 140201 (2016).
- Pan et al. (2020) Ying Pan, Jiawei Zhou, and Gang Chen, “Quantifying thermal transport in amorphous silicon using mean free path spectroscopy,” Phys. Rev. B 101, 144203 (2020).
- Li et al. (2019) Zhen Li, Shiyun Xiong, Charles Sievers, Yue Hu, Zheyong Fan, Ning Wei, Hua Bao, Shunda Chen, Davide Donadio, and Tapio Ala-Nissila, “Influence of thermostatting on nonequilibrium molecular dynamics simulations of heat conduction in solids,” The Journal of chemical physics 151, 234105 (2019).
- Stillinger and Weber (1985) Frank H. Stillinger and Thomas A. Weber, “Computer simulation of local order in condensed phases of silicon,” Phys. Rev. B 31, 5262–5271 (1985).
- Tersoff (1989) J. Tersoff, “Modeling solid-state chemistry: Interatomic potentials for multicomponent systems,” Phys. Rev. B 39, 5566–5568 (1989).
- Sääskilahti et al. (2016) K. Sääskilahti, J. Oksanen, J. Tulkki, A. J. H. McGaughey, and S. Volz, “Vibrational mean free paths and thermal conductivity of amorphous silicon from non-equilibrium molecular dynamics simulations,” AIP Advances 6, 121904 (2016).
- Larkin and McGaughey (2014) Jason M. Larkin and Alan J. H. McGaughey, “Thermal conductivity accumulation in amorphous silica and amorphous silicon,” Phys. Rev. B 89, 144303 (2014).
- Moon et al. (2018) Jaeyun Moon, Benoit Latour, and Austin J. Minnich, “Propagating elastic vibrations dominate thermal conduction in amorphous silicon,” Phys. Rev. B 97, 024201 (2018).
- Moon et al. (2019) Jaeyun Moon, Raphaël P. Hermann, Michael E. Manley, Ahmet Alatas, Ayman H. Said, and Austin J. Minnich, “Thermal acoustic excitations with atomic-scale wavelengths in amorphous silicon,” Phys. Rev. Materials 3, 065601 (2019).
- Wang et al. (2022) Yanzhou Wang, Zheyong Fan, Miguel A. Caro, and Tapio Ala-Nissila, “Data for ”Quantum-corrected thickness-dependent thermal conductivity in amorphous silicon predicted by machine-learning molecular dynamics simulations”,” (2022).