Cycloidal Magnetic Ordering in Noncentrosymmetric EuIrGe3
Abstract
Successive magnetic phase transitions at =12.2 K, =7.0 K, and =5.0 K in EuIrGe3, an intermetallic compound with a body centered tetragonal lattice belonging to a polar space group , has been investigated by neutron diffraction and resonant X-ray diffraction. It is shown that EuIrGe3 exhibits an incommensurate longitudinal sinusoidal order with and in the high temperature phase (), which changes to a cycloidal order with () and in the intermediate phase (). In the low temperature phase (), the cycloidal plane rotates by to have (). It is also pointed out that the X-ray scattering amplitude from odd-parity magnetic quadrupole due to the polar environment interfere with that from normal even-parity magnetic dipole in the magnetic ordered phase. ()
In noncentrosymmetric magnetic materials, various kinds of nontrivial magnetic structures are realized as a result of competing interactions of symmetric magnetic exchange interaction, Dzyaloshinskii-Moriya (DM) antisymmetric exchange interaction, and the Zeeman energy in external fields. [1, 2] In many cases, they are non-collinear or non-coplanar structures associated with incommensurate spiral orderings. Typical examples are the formation of skyrmion lattices in cubic chiral magnets such as MnSi with the space group . [3, 4] A similar skyrmion lattice phase is also observed in a rare-earth chiral magnet EuPtSi, which belongs to the same space group. [5, 6, 7, 8, 9, 10, 11] Recently, skyrmion lattices have also been discovered even in centrosymmetric Gd compounds. [12, 13, 14, 15] The =7/2 (=0) total spin state in Eu2+ and Gd3+ provides an ideal platform to investigate the formations of characteristic spin structures which are little affected by the crystal-field anisotropy.
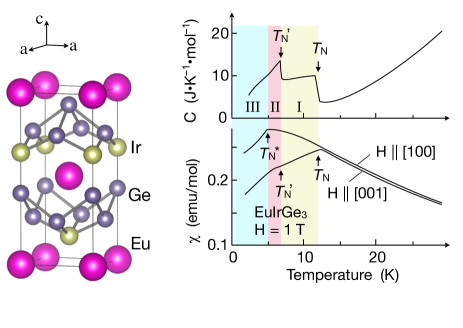
EuTGe3 (T=transition metal), with the BaNiSn3-type body-centered tetragonal structure (space group ), exhibits a wide variety of magnetic properties. [16, 17, 18, 19] In EuNiGe3, the helimagnetic order and the appearance of anomalous Hall effect in the intermediate phase in magnetic field suggest a formation of a skyrmion lattice state. [20, 21, 22, 23, 24] The magnetic properties of EuRhGe3 and EuIrGe3 have also been well studied. [25, 26, 27] In spite of weak magnetic anisotropies of Eu2+, these compounds exhibit multiple magnetic phases in the temperature () vs magnetic field () space, suggesting a subtle energy balance among various magnetic structures, which is of great interest. EuIrGe3, the subject compound of this paper, exhibits successive phase transitions at =12.2 K, =7.0 K, and =5.0 K. [26, 18] The crystal structure and the physical properties of EuIrGe3 are summarized in Fig. 1, where the three magnetic phases at zero field are named as phase I, II, and III, respectively. However, the detailed magnetic structures of these phases have not been clarified yet. From the structural viewpoint, it is of special interest that the crystal lacks an inversion center but possesses vertical mirror planes including the -axis (point group ), allowing the existence of a DM interaction. This is not a chiral, but a polar system. In this paper, we report the results of neutron and resonant x-ray diffraction and present the magnetic structures of EuIrGe3 at zero field.
Single crystals of EuIrGe3, using natural Eu, were grown by the In-flux method as described in Ref. \citenKakihana17. Neutron diffraction was performed at BL18 (SENJU) time-of-flight single crystal neutron diffractometer at the Materials and Life Science Experimental Facility (MLF) of Japan Proton Accelerator Research Complex (J-PARC). [29] The wavelength range of the incident neutrons was Å. A plate-shaped single crystal with a -plane surface, mm2 in area and 0.4 mm in thickness, was mounted in a closed cycle 4He refrigerator so that the -axis was perpendicular to the incident beam in the horizontal scattering plane with the -axis vertical. The crystal was then rotated by about the -axis to increase the irradiation area and collect Bragg peaks as many as possible in the reflection condition. Neutron diffraction patterns were collected between 4 K and 15 K using a closed cycle 4He refrigerator.
Resonant X-ray diffraction (RXD) was performed at BL-3A of the Photon Factory, KEK, Japan. The single crystalline sample was spark cut into a plate-shape and the -plane surface was polished to a shining surface. The measurement was performed in the scattering plane. The X-ray energy around the Eu -edge was used. See supplemental material (SM) for the scattering configuration of the RXD experiment. [30]
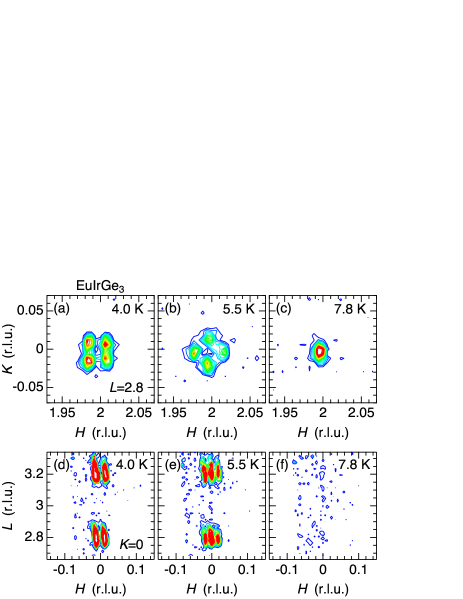
In the neutron diffraction experiment at SENJU, we successfully detected magnetic signals appearing below at positions around the propagation vector corresponding to . Figure 2 shows the contour maps of neutron-diffraction intensity around (2, 0, 2.8) and (0, 0, 3), demonstrating the splitting of the Bragg peak below and . The cut of Fig. 2(a) and the cut of Fig. 2(d) clearly demonstrate that the magnetic propagation vector at 4.0 K in phase III is described by with . The four peaks are considered to be due to the magnetic domains with equivalent -vectors. At 5.5 K in phase II, as demonstrated in Figs. 2(b) and 2(e), the positions of the four peaks rotate by , indicating that the propagation vector in phase II is described by with . At 7.8 K in phase I, the four peaks merge to a single peak as shown in Fig. 2(c), indicating that the magnetic structure of phase I is described by . Since the peak disappears on the line as shown in Fig. 2(f), we can conclude that the moments are aligned along the -axis in phase I.
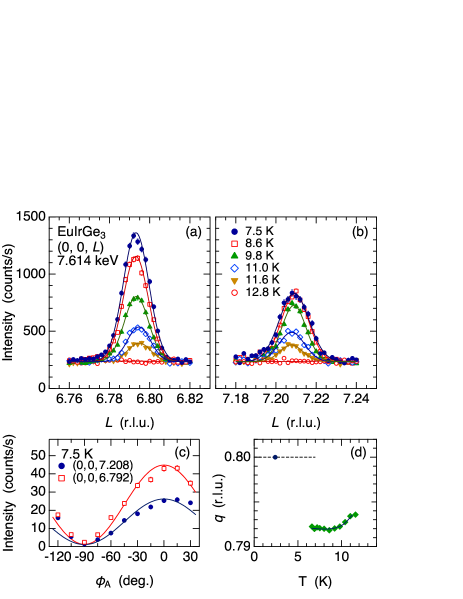
The magnetic Bragg peaks have been investigated in more detail by RXD with higher spatial resolution. Figures 3(a) and 3(b) show the results of -scans around and 7.2 with increasing in phase I. These data clearly demonstrate that the peak position slightly deviates from the commensurate value at . The magnetic propagation vector is more precisely described by . Furthermore, the fitting result shows that is weakly dependent on as shown in Fig. 3(d). The -scan at 2.4 K in phase III shows that the peak is exactly at , which is presented in the SM with the result of the energy spectrum of the resonance. [30]
The result that the ordered moments in phase I are parallel to the -axis is also confirmed by the polarization analysis in RXD, which is demonstrated in Fig. 3(c). If the Fourier component of the magnetic structure had finite in-plane component along the -axis, which is perpendicular to the scattering plane in the present configuration, there should arise finite - intensity at . The vanishing intensity of - indicates that the moments are parallel to the axis. The solid lines are the calculations for the magnetic scattering at the resonance, i.e., , [31, 32, 33] by assuming the longitudinal sinusoidal magnetic structure with the -axis component only.
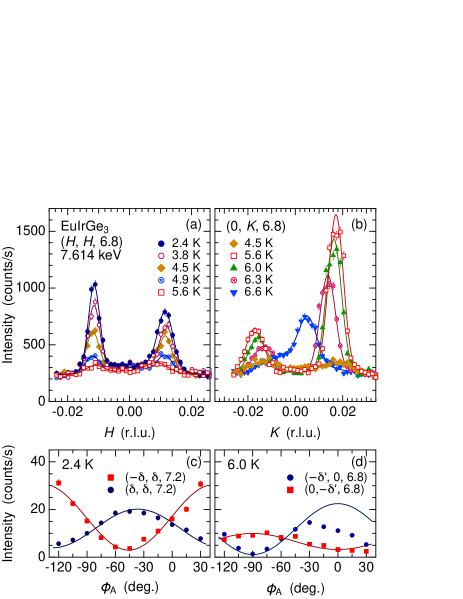
The reciprocal space scans of in phase III and in phase II at several temperatures are shown in Fig. 4(a) and 4(b), respectively. As shown in Fig. 2, the scan in phase III exhibits peaks at . The intensity decreases with increasing and disappears on entering phase II, leaving weak peaks at 5.6 K. In the scan, on the other hand, the peaks at are very weak in phase III at 4.5 K and develop above 5 K on entering phase II. The intensity soon begins to decrease with increasing , and the peak position moves to the central position at . The results of the scans along and are provided in the SM. [30]
The polarization analyses performed on the representative peaks at and () at 2.4 K in phase III and at and () at 6.0 K in phase II are shown in Figs. 4(c) and 4(d), respectively. It is clearly demonstrated that the intensity for takes the maximum at an intermediate angle around . The phase of the dependence is reversed for , where the intensity takes the minimum at around . At 6.0 K in phase II, where the peak position is rotated by , the intensity for takes the minimum and maximum at () and (), respectively. The decrease in intensity at is considered to be due to some misalignment of the detector that unexpectedly happened when rotating the analyzer system. The phase relation is reversed for , where the intensity is maximum and minimum at and , respectively.
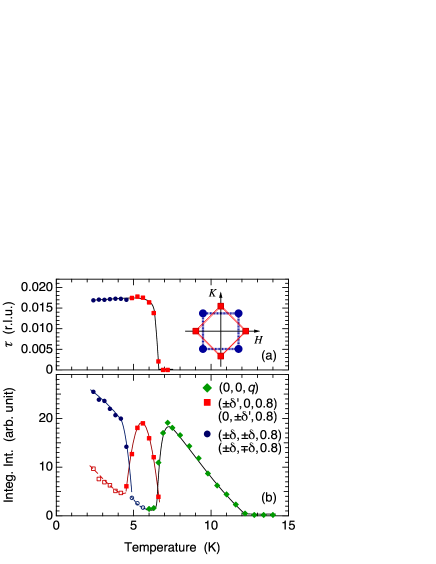
The -dependence of in phase II and in phase III, the distance () from the central position at , is shown in Fig. 5(a). This figure shows that does not change at the II–III phase boundary; i.e., the peak position only rotates by . Figure 5(b) shows the -dependence of the total integrated intensity. Note that the and scans in phase III, where the peaks of phase II do not exist, pass across the ridge connecting the four peaks in phase III. This gives rise to residual peaks. The intensity is plotted by the open marks. The -dependence of the total intensity in Fig. 5(b) shows that the magnitude of the ordered moment increases with decreasing below . The almost linear -dependence suggest a mean-field-like development: . Below and , although the intensity ratio among the four peaks is not equal due to unequal domain population, the total intensity is maintained and keeps increasing with decreasing .
The magnetic moment of Eu on the th lattice point at is generally expressed as
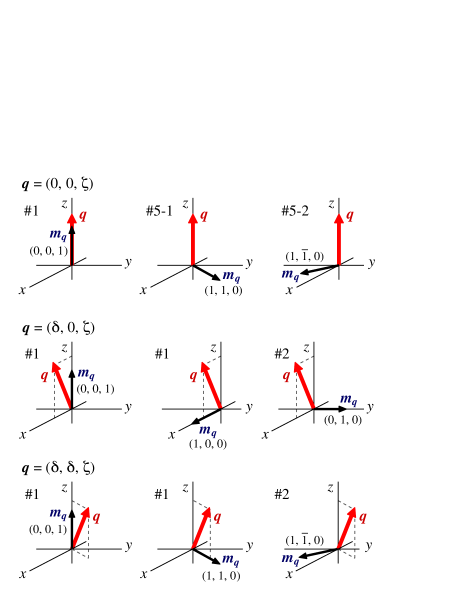
where represents the Fourier component of the magnetic structure. It is usually reasonable to consider that belongs to one of the irreducible representations of the magnetic structure described by the propagation vector in the space group . [30] For , can be or a linear combination of and . The experiment shows = is realized.
For , can be or a linear combination of and . The calculated curves of the polarization analysis for and in Fig. 4(c) are obtained by assuming = and , respectively, with equal -axis and -plane amplitudes. This indicates the cycloidal propagation of the ordered moment along the and direction, respectively, and also along the -axis. In the same manner, the calculated curves for and in Fig. 4(d) are obtained by assuming = and , respectively. This again shows the cycloidal propagation of the magnetic moment. Although the sign of of represent the sense of rotation, we cannot distinguish the two possibilities in this linear polarization analysis. This should be checked in future by using a circularly polarized X-ray, since the DM vector perpendicular to the mirror plane should favor a unique sense of rotation. Also, we presumed the single- structure since the intensities of the four peaks were much different. The appearance of the four peaks is ascribed to the domain formation and not to the multi- structure. The vanishing intensity in the polarization analysis at specific analyzer angles and the good agreement with the calculation well support the single- scenario.
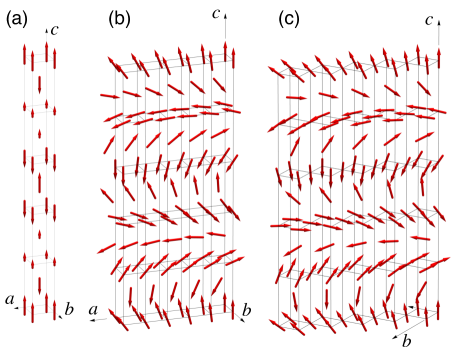
The magnetic structure of EuIrGe3 in phase I, II, and III is illustrated in Figs. 6(a), 6(b), and 6(c), respectively. By taking a rotation or a mirror reflection of these structures, i.e., by performing symmetry operations allowed in the space group , we obtain the magnetic structures of other domains. Just below K, the longitudinal sinusoidal structure of Fig. 6(a) is realized. The alignment of the ordered moments along the -axis could be associated with the weak magnetic anisotropy to prefer the -axis orientation. However, since there inevitably remain small moment sites in this structure, it is not preferable to maintain this structure down to the lowest temperature due to the requirement of entropy reduction and the energy gain in the magnetic exchange interaction. It is necessary to increase the size of the magnetic moments. In the system with weak anisotropy, this can be realized by giving rise to an in-plane magnetic component. Since is almost fixed by the Ruderman-Kittel-Kasuya-Yoshida (RKKY) interaction to maximize , which is associated with the conduction electron state, a possible solution is to rotate the magnetic moment to form a helical or cycloidal structure.
No change in the crystal structure has been detected experimentally, although more careful measurement would be necessary. Within the framework of the space group, the slight tilt of the -vector from to or in phase II or III, respectively, could be a consequence of maximizing the energy gain of the magnetic exchange interaction without distorting the tetragonal lattice. It is possible to form the cycloidal structure in the symmetry by tilting since the -axis and the -plane components of have the same irreducible representation, whereas the cycloid with breaks the symmetry of . [30]
The rotation of the -vector about the axis is also observed in the multiple magnetic transitions in EuAl4. [34, 35, 36] It is intriguing that the sequence is opposite to the present case in EuIrGe3; in EuAl4, the () appears at high and () is realized at low . The cycloidal structure at zero field in EuIrGe3 with the crystal class also suggests a possibility for the Néel type skyrmion formation as observed in a polar 3d system GaV4S8. [37]
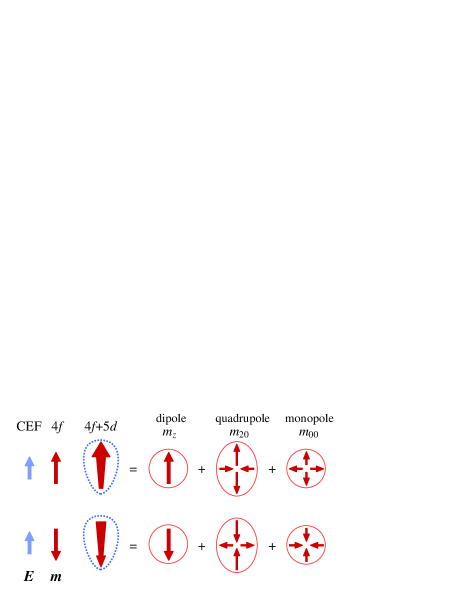
Finally, we point out that the resonant intensities at and in phase I, where represents the fundamental Bragg point, are different as shown in Fig. 3 and in the SM in more detail. [30] This cannot be explained if we only consider the resonance due to the magnetic dipole, where the - intensity should be proportional to . The difference in intensity is intrinsic because the intensities of the and reflections respectively follow the dependence. From the viewpoint of symmetry, in the space group without a horizontal mirror plane perpendicular to the axis, the propagation vectors of and are different. Therefore, the intensities of and can be different as experimentally observed.
This difference can be explained by considering the noncentrosymmetric polar environment at the Eu site as it is apparent in Fig. 1. The finite electric field gradient at the Eu site induces the mixing between and states, allowing the - cross-term resonance. [33] The magnetic moment distribution in the hybrid orbital state is anisotropic and should be different at Eu sites with the upward and downward magnetic moments as schematically illustrated in the SM. [30] By symmetry analysis, this hybrid state is described by a superposition of magnetic dipole, magnetic quadrupole, and magnetic monopole. [38, 39, 40] The contribution from magnetic monopole can be excluded here since the rank-0 quantity does not contribute to the - resonance. [33] The scattering amplitudes of normal - resonance due to the magnetic dipole and the - cross-term resonance due to the magnetic quadrupole interfere. Then, the structure factors at and are expressed as and , respectively, where and are the magnetic dipole and quadrupole structure factors, and are the - and - spectral functions, respectively. This relation leads to the different intensities at . [30] More detailed study to extract the signal from the magnetic quadrupole is necessary.
In summary, we have investigated the magnetic structures of the three successive magnetic phases of noncentrosymmetric EuIrGe3 by neutron and resonant X-ray diffraction. With decreasing temperature, a longitudinal sinusoidal structure with takes place below =12.2 K, which changes to a cycloidal structure with (=0.017) below =7.0 K. The cycloidal plane rotates by below =5.0 K to have (=0.012). We also detected the - and - interference term due to the parity-odd magnetic quadrupole induced in the - hybrid orbital state, reflecting the lack of inversion symmetry at the Eu site.
Acknowledgements
The authors acknowledge valuable discussion with A. Tanaka. This work was supported by JSPS KAKENHI Grant number JP20H01854. The neutron experiment at the Materials and Life Science Experimental Facility of the J-PARC was performed under a user program (Proposal No. 2020A0118). The synchrotron experiments were performed under the approval of the Photon Factory Program Advisory Committee (No. 2020G034).
References
- [1] I. Dzyaloshinsky, J. Phys. Chem. Solids 4, 241 (1958).
- [2] T. Moriya, Phys. Rev. 120, 91 (1960).
- [3] S. Muhlbauer, B. Binz, F. Jonietz, C. Pfleiderer, A. Rosch, A. Neubauer, R. Georgii, and P. Böni, Science 323, 915 (2009).
- [4] A. Neubauer, C. Pfleiderer, B. Binz, A. Rosch, R. Ritz, P. G. Niklowitz, and P. Böni, Phys. Rev. Lett. 102, 186602 (2009).
- [5] M. Kakihana, D. Aoki, A. Nakamura, F. Honda, M. Nakashima, Y. Amako, S. Nakamura, T. Sakakibara, M. Hedo, T. Nakama, and Y. Ōnuki, J. Phys. Soc. Jpn. 87, 023701 (2018).
- [6] M. Kakihana, D. Aoki, A. Nakamura, F. Honda, M. Nakashima, Y. Amako, T. Takeuchi, H. Harima, M. Hedo, T. Nakama, and Y. Ōnuki, J. Phys. Soc. Jpn. 88, 094705 (2019).
- [7] K. Kaneko, M. D. Frontzek, M. Matsuda, A. Nakao, K. Munakata, T. Ohhara, M. Kakihana, Y. Haga, M. Hedo, T. Nakama, and Y. Ōnuki, J. Phys. Soc. Jpn. 88, 013702 (2019).
- [8] C. Tabata, T. Matsumura, H. Nakao, S. Michimura, M. Kakihana, T. Inami, K. Kaneko, M. Hedo, T. Nakama, and Y. Ōnuki, J. Phys. Soc. Jpn. 88, 093704 (2019).
- [9] Y. Homma, M. Kakihana, Y. Tokunaga, M. Yogi, M. Nakashima, A. Nakamura, Y. Shimizu, D. X. Li, A. Maurya, Y. J. Sato, F. Honda, D. Aoki, Y. Amako, M. Hedo, T. Nakama, and Y. Ōnuki, J. Phys. Soc. Jpn. 88, 094702 (2019).
- [10] T. Sakakibara, S. Nakamura, S. Kittaka, M. Kakihana, M. Hedo, T. Nakama, and Y. Onuki, J. Phys. Soc. Jpn. 88, 093701 (2019).
- [11] T. Takeuchi, M. Kakihana, M. Hedo, T. Nakama, and Y. Onuki, J. Phys. Soc. Jpn. 88, 053703 (2019).
- [12] T. Kurumaji, T. Nakajima, M. Hirschberger, A. Kikkawa, Y. Yamasaki, H. Sagayama, H. Nakao, Y. Taguchi, T. Arima, and Y. Tokura, Science 365, 914 (2019).
- [13] M. Hirschberger, T. Nakajima, M. Kriener, T. Kurumaji, L. Spitz, S. Gao, A. Kikkawa, Y. Yamasaki, H. Sagayama, H. Nakao, S. Ohira-Kawamura, Y. Taguchi, T. Arima, and Y. Tokura, Phys. Rev. B 101, 220401 (2020).
- [14] M. Hirschberger, T. Nakajima, S. Gao, L. Peng, A. Kikkawa, T. Kurumaji, M. Kriener, Y. Yamasaki, H. Sagayama, H. Nakao, K. Ohishi, K. Kakurai, Y. Taguchi, X. Yu, T. Arima, and Y. Tokura, Nature communications 10, 5831 (2019).
- [15] N. D. Khanh, T. Nakajima, S. Hayami, S. Gao, Y. Yamasaki, H. Sagayama, H. Nakao, R. Takagi, Y. Motome, Y. Tokura, T. H. Arima, and S. Seki, Adv. Sci. e2105452 (2022).
- [16] N. Kumar, P. K. Das, R. Kulkarni, A. Thamizhavel, S. K. Dhar, and P. Bonville, J. Phys.: Condens. Matter 24, 036005 (2012).
- [17] D. Kaczorowski, B. Belan, and R. Gladyshevskii, Solid State Commun. 152, 839 (2012).
- [18] M. Kakihana, H. Akamine, K. Tomori, K. Nishimura, A. Teruya, A. Nakamura, F. Honda, D. Aoki, M. Nakashima, Y. Amako, K. Matsubayashi, Y. Uwatoko, T. Takeuchi, T. Kida, M. Hagiwara, Y. Haga, E. Yamamoto, H. Harima, M. Hedo, T. Nakama, and Y. Ōnuki, J. Alloys and Compounds 694, 439 (2017).
- [19] B. K. Rai, G. Pokharel, H. S. Arachchige, S.-H. Do, Q. Zhang, M. Matsuda, M. Frontzek, G. Sala, V. O. Garlea, A. D. Christianson, and A. F. May, Phys. Rev. B 103, 014426 (2021).
- [20] R. J. Goetsch, V. K. Anand, and D. C. Johnston, Phys. Rev. B 87, 064406 (2013).
- [21] A. Maurya, P. Bonville, A. Thamizhavel, and S. K. Dhar, J Phys Condens Matter 26, 216001 (2014).
- [22] D. H. Ryan, J. M. Cadogan, R. Rejali, and C. D. Boyer, J. Phys.: Condens. Matter 28, 266001 (2016).
- [23] X. Fabrèges, A. Gukasov, P. Bonville, A. Maurya, A. Thamizhavel, and S. K. Dhar, Phys. Rev. B 93, 214414 (2016).
- [24] W. Iha, S. Matsuda, M. Kakihana, D. Aoki, A. Nakamura, M. Nakashima, Y. Amako, T. Takeuchi, M. Kimata, Y. Otani, M. Hedo, T. Nakama, and Y. Ōnuki, JPS Conf. Proc. 30, 011092 (2020).
- [25] O. Bednarchuk and D. Kaczorowski, Acta Phys. Pol. A 127, 418 (2015).
- [26] A. Maurya, P. Bonville, R. Kulkami, A. Thamizhavel, and S. K. Dhar, J. Magn. Magn. Mater. 401, 823 (2016).
- [27] Y. Utsumi, D. Kasinathan, P. Swatek, O. Bednarchuk, D. Kaczorowski, J. M. Ablett, and J.-P. Rueff, Phys. Rev. B 97, 115155 (2018).
- [28] K. Momma and F. Izumi, J. Appl. Crystallogr. 44, 1272 (2011).
- [29] T. Ohhara, R. Kiyanagi, K. Oikawa, K. Kaneko, T. Kawasaki, I. Tamura, A. Nakao, T. Hanashima, K. Munakata, T. Moyoshi, T. Kuroda, H. Kimura, T. Sakakura, C.-H. Lee, M. Takahashi, K. Ohshima, T. Kiyotani, Y. Noda, and M. Arai, J. Appl. Crystallogr. 49, 120 (2016).
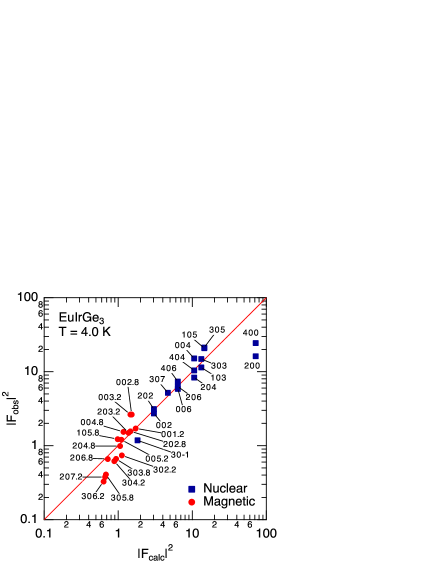
- [30] (Supplemental Material) The following pieces of information are provided online. (S1) Scattering configuration of the resonant X-ray diffraction experiment. (S2) X-ray energy dependence and the -scan data at 3 K in phase III. (S3) -scans at 7.5 K in phase I around , , and . (S4) All the scan data for the -dependence plot of Fig. 5. (S5) Irreducible representation of the Fourier component of the magnetic structure. (S6) Schematic of the appearance of odd parity magnetic moments with the magnetic dipole order. (S7) Comparison of the observed and calculated structure factors for the neutron diffraction measurement at 4.0 K in phase III.
- [31] J. P. Hannon, G. T. Trammell, M. Blume, and D. Gibbs: Phys. Rev. Lett. 61 (1988) 1245; 62 (1988) 2644.
- [32] M. Blume: in Resonant Anomalous X-ray Scattering, Theory and Applications, ed. G. Materlik, C. J. Sparks, and K. Fischer (Elsevier Science, Amsterdam, 1994) p. 495.
- [33] S. W. Lovesey, E. Balcar, K. S. Knight, and J. Fernández-Rodríguez, Phys. Rep. 411, 233 (2005).
- [34] K. Kaneko, T. Kawasaki, A. Nakamura, K. Munakata, A. Nakao, T. Hanashima, R. Kiyanagi, T. Ohhara, M. Hedo, T. Nakama, and Y. Ōnuki, J. Phys. Soc. Jpn. 90, 064704 (2021).
- [35] S. Shimomura, H. Murao, S. Tsutsui, H. Nakao, A. Nakamura, M. Hedo, T. Nakama, and Y. Ōnuki, J. Phys. Soc. Jpn. 88, 014602 (2019).
- [36] T. Shang, Y. Xu, D. J. Gawryluk, J. Z. Ma, T. Shiroka, M. Shi, and E. Pomjakushina, Phys. Rev. B 103, L020405 (2021).
- [37] I. Kézsmárki, S. Bordács, P. Milde, E. Neuber, L. M. Eng, J. S. White, H. M. Rønnow, C. D. Dewhurst, M. Mochizuki, K. Yanai, H. Nakamura, D. Ehlers, V. Tsurkan, and A. Loidl, Nat Mater 14, 1116 (2015).
- [38] S. Hayami and H. Kusunose, J. Phys. Soc. Jpn. 87, 033709 (2018).
- [39] S. Hayami, M. Yatsushiro, Y. Yanagi, and H. Kusunose, Phys. Rev. B 98, 165110 (2018).
- [40] M. Yatsushiro, H. Kusunose, and S. Hayami, Phys. Rev. B 104, 054412 (2021).
[t]
Supplemental Material
Cycloidal Magnetic Ordering in Noncentrosymmetric EuIrGe3
Takeshi Matsumura, Mitsuru Tsukagoshi, Yoshihisa Ueda, Nonoka Higa, Akiko Nakao, Koji Kaneko, Masashi Kakihana, Masato Hedo, Takao Nakama, and Yoshichika Ōnuki
![[Uncaptioned image]](/html/2206.06596/assets/x7.png)
(Color online) Scattering configuration of the resonant X-ray diffraction experiment. We take the -axis along the scattering vector , -axis along , and -axis along . The - and -axis of the crystal was set parallel to the - and -axis, respectively. The incident X-ray beam from the synchrotron source is -polarized in the horizontal plane. The 006 reflection of a pyrolytic graphite crystal, with at 7.614 keV, was used as an analyzer. By rotating the analyzer angle we investigate the polarization state of the diffracted beam. At and at , only the and polarization component, respectively, of the diffracted beam is measured.
![[Uncaptioned image]](/html/2206.06596/assets/x8.png)
(Color online) (a) X-ray energy dependence of the Bragg peak at 3 K. The triangles are the background data taken at . (b) The reciprocal space scan along at 3 K at the resonance energy of 7.614 keV, indicating that the peak is exactly at the commensurate position .
![[Uncaptioned image]](/html/2206.06596/assets/x9.png)
(Color online) -scans at 7.5 K in phase I with polarization analysis at - for , , and . The bars on the right side of the peak show with and , where represents the - structure factor for the - resonance due to magnetic dipole and represents that for the - resonance, although the phase and the dependence in are neglected. is the Lorentz factor.
![[Uncaptioned image]](/html/2206.06596/assets/x10.png)
(Color online) All of the reciprocal space scans for the -dependence plot of Fig. 5 in the main text. The inset figures show the schematic of the peak positions and the ridge structures. The scan line is shown by the arrow.