Size effects in micro and nanoscale materials fracture.
Abstract
Micro and nanoscale materials have remarkable mechanical properties, such as enhanced strength and toughness, but usually display sample-to-sample fluctuations and non-trivial size effects, a nuisance for engineering applications and an intriguing problem for science. Our understanding of size-effects in small-scale materials has progressed considerably in the past few years thanks to a growing number of experimental measurements on carbon based nanomaterials, such as graphene carbon nanotubes, and on crystalline and amorphous micro/nanopillars and micro/nanowires. At the same time, increased computational power allowed atomistic simulations to reach experimentally relevant sample sizes. From the theoretical point of view, the standard analysis and interpretation of experimental and computational data relies on traditional extreme value theories developed decades ago for macroscopic samples, with recent work extending some of the limiting assumptions of the original theories. In this review, we discuss the recent experimental and numerical literature on micro and nanoscale fracture size effects, illustrate existing theories pointing out their advantages and limitations and finally provide a tutorial for analyzing fracture data from micro and nanoscale samples. We discuss a broad spectrum of materials but provide at the same time a unifying theoretical framework that should be helpful for materials scientists working on micro and nanoscale mechanics.
Introduction
Understanding how materials fail is a multiscale problem of immense complexity that has fascinated and puzzled scientists and engineers for many years. Relevant processes range from the nanometer scales where the atomic displacement and defect motion initiate irreversible deformation, to macroscopic scale where the deformation manifests itself in localized plastic instabilities and crack propagation. This intricate coupling between the scales reveals itself in the widespread observation of size effects in materials strength, generally indicating that larger samples are easier to fracture. This general phenomenon was already noted by Leonardo da Vinci [1], who measured the carrying-capacity of metal wires of varying length and observed that longer wires could sustain a smaller weight. This kind of fracture size effects is difficult to explain within a continuum mechanics framework: if the cross-section of the wire is constant, the stress is the same regardless of the wire length.
Fracture size effects can only be explained considering the role disorder, as originally shown in the the pioneering work of Weibull in the 30’s [2], which was based on extreme value theory (EVT)[3]: if a sample could be divided into a set of non-interacting subvolumes, the total strength would correspond to the strength of the weakest volume, leading to the well-known Weibull distribution [2]. Additional support for this line of reasoning comes from fracture mechanics indicating that a material fails at a lower nominal applied stress when a flaw is present [4]. Coming back to Leonardo’s wire, we can assume that longer wires are more likely to enclose longer flaws and are thus bound to fail at smaller loads, on average. Unfortunately the issue is more complicated since the notion of independent subvolumes is often difficult to justify in practice: Flaws induce long-range stress fields in the material and therefore different sub-volumes may interact, invalidating the assumption of independence. As a result, it is not entirely clear if and why the Weibull distribution can be used to describe fracture statistics. For instance, compression experiments in rocks indicate that the fracture strength does not vanish in the large size limit[5], at odds with EVT but in agreement with depinning theories similar to those used to describe crystal plasticity [6, 7]. Notice also that disorder is not always detrimental as implied by EVT. In some cases, a strong disorder might even prevent crack propagation and ultimately result in a stronger sample [8]. Finally, size effects are commonly revealed experimentally but difficult to quantify with precision, since the strength probability distribution is dominated by its tails. Few scientists have the patience and the resources to repeat the same experiment on a large number of nominally identical samples.
The current trend towards increasing miniaturization of samples and devices poses additional challenges to our understanding of fracture size effects: Micro and nanomaterials often display rate and thermal dependent effects that could invalidate the weakest-link hypothesis which lies at the basis of EVT. Furthermore, concepts and ideas coming from continuum fracture mechanics, that are fundamental to understand macroscopic fracture, might not be applicable to very small samples. Hence, while we can not rely on theoretical arguments that derive the Weibull distribution from the statistical properties of the flaws present in an elastic medium [9, 10, 11, 12, 13], the Weibull distribution is still commonly used to fit and interpret experimental data, even at those small scales.
Additional complications arise when we move from brittle to ductile materials. Plasticity in bulk materials has the common feature of being nearly size independent, so that the yield stress, the stress needed to initiate plastic deformation, is almost independent of the sample size. This statement held true until a few years ago, when materials scientists started to experiment with micron-sized samples. In their pioneering work, Dimiduk et al. performed compression experiments on single crystalline Ni micropillars, obtained by focused ion beam (FIB) machining [14, 15, 16]. The results show a dramatic increase of the yield stress as the pillar diameter decreases, but also strong sample-to-sample fluctuations and intermittent strain bursts during loading [17]. Hence, micron-sized samples are not only stronger than bulk ones, but also more erratic in their deformation. In single crystals, strain bursts were shown experimentally to follow a power law distribution, due to the collective dynamics of dislocations [18, 17, 19]. These findings gave rise to a flurry of activity and similar size effects were recorded in a wide variety of crystalline [20, 21, 22] and amorphous materials [23, 24]. Yet, a comprehensive and convincing theory accounting for size effects in micro and nanoscale ductile materials is still missing (see recent reviews [16, 25, 22, 26]).
This review is an attempt to respond to the pressing need of revisiting and extending existing size effects theories, suggesting guidelines for their application to experimental data. To this end, we first review recent experimental results revealing size effects in micro and nanoscale materials, ranging from carbon based materials such as carbon nanotube and graphene, to crystalline brittle and ductile metallic materials, and finally amorphous samples such as silica glasses and bulk metallic glasses. To help orient the reader through the vast experimental literature, we have compiled a list of experimental results in Table S1, including materials, sample size and statistical methods used. We then report on recent atomistic simulations results addressing the issue of size effects in those materials. To interpret all these data, we review classical EVT, discuss their limitations and propose some extensions appropriate to deal with rate and thermal effects which become increasingly relevant at the nanoscale. Equipped with this theoretical background, we propose general guidelines to interpret experimental data and provide some concrete examples to illustrate our ideas.
Fracture at the micro and nanoscale: experiments
Carbon based materials
Due to their potential for technological applications, carbon based materials have played a major role in the past few years in the field of nanomaterials, with carbon nanotubes (CNTs) and graphene as the primary examples. These materials are interesting from the mechanical point of view due to their extremely large strength and stiffness, as reviewed extensively [27, 28]. As an example of these experiments, we mention here early tensile tests on multiwalled CNTs using atomic force microscopy (AFM) revealing brittle fracture with extremely high tensile strengths in the range 20-60 GPa [29]. This and subsequent AFM experiments on single filament multiwalled CNTs [30] found size effects and failure stress distributions in reasonable agreement with Weibull statistics [31]. Weibull distribution has been shown to successfully apply also to the fracture dynamics of CNT fibers [32, 33, 34, 35], carbon fibers [36] and multiwalled WS2 NT [31, 37]. Recent experiments on carbon fibers [38] and carbon fiber bundles [39] detected brittle failures, without exploring the statistical aspects. Among these results, we find of particular interest the work of Sun et al. [34] who recorded the distribution of tensile strength of CNT fibers as a function of strain rates and fiber diameters. While most of the tests on CNTs are based on AFM, other techniques involving force sensors and nanomanipulators have been recently introduced [40]. It is also possible to produce CNT reinforced composites: Fig. 1a shows experiments of the tensile deformation of multi-walled CNT embedded in a Al matrix [41]. Experiments show that strain induces plastic deformation and microcrack formation in the composite. In this setting, CNTs act as bridges and prevent crack growth increasing the fracture strength. Analyzing size effects and strength statistics in CNT composites is still an unexplored challenging task.
The other carbon based material that has recently excited much interest for its exceptional mechanical properties is graphene. Testing its fracture properties is extremely challenging due to the difficulty in applying high tensile stresses in a controlled fashion on the sample [42, 43, 44, 45]. One of the few remarkable experiments considers the fracture of a bilayer graphene with notches of various lengths (in the 66 nm – 2512 m range) [45]. The results, reported in Fig. 1b, reveal a fast brittle fracture and a reduced strength with respect to the intrinsic value. This can be explained by the classic Griffith’s theory that provides an expression for the crack length dependence of the failure strength (see the theoretical section of this review). It would be interesting to understand how a collection of randomly placed nanoscale cracks or vacancies would affect the strength, but this issue has still to be investigated experimentally.
Silicon based materials
Among single crystals, silicon holds a preminent role, as it is one of the most common materials in electronic devices and micro and nanoelectromechanical systems (MEMS/NEMS). Si and Si-related single crystals are brittle at room temperature and statistical analysis based on the Weibull law is commonly used to describe the observed scatter in bending or tensile strength values[46]. Already in 1985 Petrovic and coworkers [47] reported tensile experiments on silicon carbide (SiC) whiskers whose diameters were in the range of 4 to 6m, and lengths approximately 10mm. Measured strength values exhibited a significant range with a statistics in good agreement with the Weibull theory. More recently, SiC dog-bone shaped specimens were subject to microtensile uniaxial experiments, demonstrating the ability of the Weibull distribution to be used to predict the strength response[48]. Later, tensile test devices were designed and developed for operation not only in ambient air but also in a FIB and a SEM [49]. The width and the thickness of FIB-fabricated nanowires were varied within the ranges from 57 and 235 nm to 221 and 444 nm respectively, while those of annealed nanowires ranged from 149 and 314 nm to 263 and 418 nm. Results indicated brittle failure during elastic deformation in the entire set of wires tested. Bending tests on micro and nanofilms corroborate the brittle nature of Si and related composites. Nanometer-scale Si double anchored beams, with widths from 200 to 800 nm and a thickness of 255 nm, were loaded by means of AFM [50] or a depth-sensing nanoindenter with a harmonic force [51]. In the first case, the bending strength distribution followed the Weibull statistics, with clear size effects. The same qualitative behavior was reported[52] for Si and SiO2 nanobeams with a 6m length and widths ranging from 200 to 600 nm deformed in bending using an AFM. Single crystal 3-SiC together with ultranano-crystalline diamond (UNCD) and amorph one carbon (ta-C) micro-specimens were tested in membrane deflection experiments [53], confirming the validity of Weibull theory in predicting the specimen strength when the volume was changed by about two orders of magnitude. At higher temperature, Si becomes plastic and the brittle-to-ductile transition temperature decreases with sample size [54], as shown for single crystal silicon (SCS) beams with widths of 720nm to 8.7m in thermo-mechanical bending tests [55], and for microbeams in tensile regime [56]. However, the matter of the brittle or ductile nature of Si NWs at room temperature is still rather controversial [57, 58, 59, 60, 61, 62, 63, 64, 65, 66, 67]. In situ TEM experiments performed under both uniaxial and bending conditions for ultrathin Si NWs down to 9 nm diameter, revealed an extremely rich behaviour subtending the NW fracture mechanics, simultaneously influenced by the NW dimensions, loading conditions and stress states [68].
Generally speaking, the capability of Weibull statistics to predict localized strengths at micro and nanoscales as it does for bulk ceramics has also been accurately reported in [69], considering the four most widely used materials in MEMS/NEMS fabrication: SiC, SCS, silicon nitride and polycrystalline silicon (poly-Si). Poly-Si thin films, indeed, constitute a key structural component for various microelectronics devices[70] indeed. At room temperature, poly-Si thin films fail in a brittle manner by cleavage [71] and Weibull parameters may describe sufficiently well the probability of failure of a variety of geometries with different stress distributions, provided that the active flaw population is properly identified [72]. This was shown in uniaxial tension tests of poly-Si dog-bone specimens with uniform cross-section, with a central hole, and with symmetric double notches 3.5m thick, with widths of either 20 or 50 m [73]. The same has been observed in the case of micro specimens with various geometries of circular/elliptical perforations centrally located at the gauge section [74]. The fracture strengths of 40 and 240nm poly-Si thick films have been demonstrated to decrease with the film thickness [75]. These size effects were shown to be related to the polycrystalline nature of the material and to microstructure difference controlled by the fabrication process [76].
Size effects in the fracture of nanoscale and microscale amorphous materials follow remarkably similar trends as those observed in crystalline materials, and are routinely described by Weibull statistics [77]. A clear example is provided by silica glass (SiO2) samples that can be manufactured into nanowires [78] or even dog-bone shaped nanofibers with diameters going down to 1nm [79] (see Fig. 1c). Tensile deformation tests of these samples display a brittle-to-ductile transition at room temperature when the sample diameter goes below 18nm [78]. Reducing the sample size leads to a dramatic increase in tensile strength and accumulated plastic strain with respect to bulk samples. This is illustrated in Fig. 1d comparing the stress-strain curves for samples of different diameters. The current interpretation of this experimental observation is that the effect is due to the increasing role played by enhanced atomic diffusion at the boundary of the sample [79].
Metallic materials
Statistical fracture size effects in macroscopic samples have been traditionally investigated in brittle and quasi-brittle materials, whereas size influence was barely considered in ductile metallic materials [80, 22, 16, 25]. Materials, however, can be brittle or ductile depending on size, shape, specimen preparation, experimental conditions such a strain rate or temperature, and even on the type of the experiment performed. A paradigmatic example is copper, which is the most widely studied among ultra-fine grained and nano-crystalline materials [81]. As for many other single-crystals, Cu exhibits plastic behavior whose onset is intimately tied to presence and depinning of dislocations. Plasticity in Cu specimens at the micro and nanoscale has been detected in a wealth of different loading conditions and sizes. Uniaxial tensile tests on single-crystal Cu microneedles [82], thin films [83] and nanopillars with diameters between 75 nm and 165 nm [84], have been performed in in-situ apparatuses, i.e. with the help of a scanning (transmission) electron microscopy to achieve the high-resolution detection of deformational fields [85]. Furthermore, a surprising crystalline-liquid-rubber-like behavior in Cu nanowires was reported in ref.[86], with a retractable strain of the fractured wires that can approach over 35. Plastic behavior has been assessed through bending experiments as well; these include microsized cantilevered beams [87, 88] and thin metal films on silicon substrates [89], deflected using a nanoindenter, and bulge experiments [90] down to the nanoscale domain [91, 92].
From the late fifties of the last century, copper whiskers were known exhibit brittle behavior. Under tensile loading, whiskers of few millimeters in length and few microns in diameter “suddenly snapped, without any observable amount of plastic deformation” [93, 94]. Fracture size effects were present in almost all samples, as the strength increased when the length or the section decreased. The same brittle behavior (no plastic necking) has been observed in nano-whiskers with diameters between 75 nm and 300 nm by attaching a micromanipulator to one end of the wire and pulling on it [95]. In general, this size-induced ductile-whisker transition appears to be common in many crystals (Ag, Fe, Au, Pd, Ge, Si, Zn and Cd) [22, 15], with the two phases well characterized at the atomic level (whiskers can be considered dislocation-free) and by distinct size-dependent behaviors.
Plastic size effects manifest themselves quite generically at micron and sub-micron scale where the yield strength and flow stress increases by reducing the specimen size [25, 22, 80, 96]. Although their specific plasticity mechanisms is still debated, the generic mechanism is believed to be dislocation-mediated [97, 98, 22, 99, 92]. These plastic size effects are associated to intermittent discrete slip events separated by elastic loading segments in the stress-strain curve, as shown by uniaxial compression experiments performed on nanopillars and micropillars made out of Cu [100, 101], Ni [15, 21, 14], Au [20], W [102], Mg [103], Al [104], Mo, Ta and Nb [105], and in dislocation dynamics simulations [19]. Despite the large scatter in yield strength values, however, the observed stress values do not approach the magnitudes reported for brittle fracture in whiskers, although the diameters of the samples significantly overlap.
To make the playground even richer, a remarkable ductile-to-brittle transition has been observed in uniaxial tensile tests of Au nanowires (diameter between 8 and 20nm) containing angstrom scale twins [106]. Moreover, recent experiments performed on freestanding Cu thin films, in micromachined tensile frame at elevated temperatures, revealed that failures of smaller samples (385 nm) occur at the onset of the elastic-plastic transition, pointing out that the ductile-to-brittle temperature may reduce with the sample size [107]. Using a micromachined silicon tensile frame with integrated heaters, Sim et al. reported a large decrease in yield strength at elevated temperature for freestanding Au thin films of width varying from 450 to 960nm [108]. They also observed an inverse size effect where the yield strength at elevated temperature decreases with decreasing temperature. Thermally-activated deformation mechanisms at the micro/nanoscale are currently being addressed, and systematic investigations of the effect of size on mechanical strengths as a function of temperature have now been conducted for a number of materials [54]. Moreover, compression of Cu nanopillars with diameters ranging from 75 up to 500 nm [101] and uniaxial tensile test of 200 nm-thick film [109], have shown that the apparent fracture strain during the ductile phase is significantly affected by the strain rate [110].
Another class of metallic materials that has been actively investigated is represented by bulk metallic glasses (BMG). Under uniaxial tensile load, most monolithic BMGs fail catastrophically without any plastic deformation at room temperature [111]. Plasticity can be observed only in a few specific cases, such as in dynamic testing with high strain rates or in nanoscale size samples. Under stable loading geometries, such as uniaxial compression, however, BMGs often display plasticity before final fracture. The strength and the shear strength of BMG are usually about much smaller than the theoretical strength [112]. The deviation from the theoretical value is attributed to the existence of manufacture flaws or other structural defects. Structural investigations reveal that BMG fail by accumulation and localization of repeated plastic shear events, softening the material up to the formation of a shear band inducing catastrophic failure [113]. This scenario can be framed into the weakest link paradigm if we associate the failure with the appearance of the first shear band overcoming a critical size.
In general, compression experiments on BMG micropillars report marked increases in yield stress and strength over the corresponding bulk values. Examples of this behavior include Zr-based metallic glass samples with diameter going down to 100nm [24], where the yield strength increases as the diameter decreases down to 800 nm, and then remains at its maximum value of 2.6 GPa. Earlier studies on other Zr-based metallic glasses with diameters on the micron range display localized plastic flow, strain bursts during the deformation curve and a large increase (25-86%) of the yield stress with respect to the bulk values [114]. Other measurements are performed in Pd-based metallic glasses with nominal diameters of 2-20 m using quasi-static room temperature compression, showing a 9% increase in yield stress with respect to the bulk values [115] and in Mg-based micro scale metallic glasses where the observed yield stress increment goes up to (60%-100%). More recent measurement on Zr-Cu-Al-Ni metallic glasses reported also a strain rate dependence of the yield stress [116]. In these and other studies [117, 118, 119, 23, 120, 121, 122, 123], the Weibull distribution is used to quantify fluctuations and size effects, confirming the relevance of the weakest-link scenario for the failure of BMG (for a review see also Ref. [113].)
Fracture at the micro and nanoscale: atomistic simulations
Molecular dynamics (MD) simulations are a tool complementing experiments by allowing to investigate and elucidate the microscopic properties of material failure, often revealing details hidden to bulk measurements. Thanks to the improvements in computational power in the last decades, MD simulations have been used as a predictive tool for the macroscopic response, improving experimental design. The main limitation of MD simulations in general, and in their application to fracture in particular, lies in the accessible length and time scales. In practice, it is only possible to simulate a relatively small sample for a limited time interval and therefore experimentally relevant deformation rates are out of reach for MD simulations. Furthermore, MD simulations rely on empirical interatomic potential that are typically validated using quantum mechanical methods or experiments. Most of the potentials are often adapted to the small deformation regime and could therefore provide spurious results in simulating fracture unless special care is taken [124].
CNTs are among the most simulated materials because of many well-established interatomic carbon potentials [125, 126]. Earlier simulations considered single-walled carbon nanotubes (SWCNTs), 6.4 in diameter and 100 in length, with the goal of understanding the influence of topological defects on the mechanical properties[127], in agreement with earlier works [128]. Results showed large fluctuations in the fracture strength due to the randomly distributed defects on the single-walled nanotubes (SWNTs) surface. The statistics was found in good agreement with the Weibull law, as in earlier studies[129]. Other MD simulations demonstrated that the failure strain of CNTs subject to tensile deformation rises by increasing the strain rate and decreases with increasing temperature [130]. Wen et al. proposed a thermally activated model connecting the failure strain to strain rate, temperature and CNT length, comparing the predictions with MD simulations [131]. Simulations with a wider temperature range, from 300K to 2700K, showed that at high temperatures damage accumulates before failure, while at low temperature brittle fracture always occurs shortly after the failure of the first bond [132]. Along the same lines, more recent extensive numerical simulations of relatively large SWCNTs (diameters ranging from 0.63 nm to 4.7 nm, and length equal to 10.6 nm) at varying temperatures (300 to 2400 K) showed tensile ductility for large CNT diameters, over a wide temperature range (500–2400 K) [133]. For smaller diameters, SWCNTs display brittle fracture due to the strong localization of incipient defects, even at high temperatures. The linear increase of the elastic limit of SWCNTs with decreasing temperature is microscopically rooted in defect nucleation and dynamics, promoted by the interplay of thermal and strain energies.
Among their valuable properties, the extremely high stiffness and strength make the CNT the best candidates as reinforcement nanodevices in next-generation structural composite materials. To this end, it is crucial to optimize the load transfer between individual CNTs, either directly or through the matrix (see Figs. 1(a) and 2(a)). Jensen et al. considered an amorphous carbon (AC) matrix and simulated CNT/AC composites[134]. CNT/AC composites were arranged in three different configurations: SWCNTs in a uniformly spaced array, multi-wall nanotubes (MWCNTs) in a uniformly spaced array, and SWCNTs in an array of bundles. Chemical crosslinking was induced by increasing the amount of bonds between the CNTs and the matrix, allowing to probe the trade-off between weakening the CNTs and improving the load transfer.
Large-scale MD simulations of tensile deformation and failure of graphene sheets for a wide range of sample sizes, vacancy concentrations, temperatures and strain rates, have led to a new theory for thermally activated rate-dependent fractures in brittle materials [135] (see Fig.2(b)). The theory was inspired by single-molecule pulling models [136] and generalized the classical extreme values statistics to thermal and rate effects. Theory and simulations showed that the failure strength decreases with raising temperatures and sample size, while it increases with strain rate. The observed deviations from the weakest link hypothesis could all be resolved within this framework, highlighting its predictive power for generic brittle materials.
Si and Si-based materials have been the subject of extensive MD simulations in the last decade. One important aspect of such numerical approaches is the volume scaling effect, and its interplay with the temperature and strain rate dependence, which has strongly motivated the development of new testing methods to study the coupling effects. MD simulations of tensile tests of Si nanowires (NWs) with diameters between 2 nm and 7 nm were reported in a temperature range from 100 K to 1200 [137]. Stress-strain curves highlighted important thermal effect on fracture strength, decreasing monotonically as temperature increased. At the same time, the failure stresses were found to increase with strain rate. The microscopic fracture mechanism was shown to depend not only on temperature but also on the NW diameter, with thinner NWs exhibiting a shear failure mechanism and ductile behavior. On the other hand, larger NWs were observed to fracture by a cleavage mechanism, originating at the surface, leading to brittle failure. The onset of intrinsic plastic size-effects was shown to be in qualitative agreement with experiments, although the critical diameter was substantially smaller than that in tensile experiments. Similar results were reported for ultrathin Si NWs, studied by uniaxial tension and bending [68]. Tensile tests revealed brittle fracture due to the nucleation and propagation of a single crack and cleavage along the (111) planes. Decreasing the NW diameter, the tensile strength tended to increase from 4.4 to 11.3 GPa. Under bending, the Si NWs showed considerable plasticity and for low strains no crack could be detected so that the Si NWs could be repeatedly bent. At higher bending strains, a crack, produced on the tensed side, propagated quickly, allowing the bending strain to localize around the crack tip. Yet, enormous plastic deformation was observed on the compressed side, due to the formation of amorphous structures.
Material properties at the nanoscale cannot be directly extrapolated from their bulk counterparts, and are often hard to achieve using the available material testing techniques. Therefore, in many cases MD simulations provide the appropriate tool to reveale unexpected underlying small-scale-specific mechanisms. Amorphous silica NWs with diameters from 2.23 nm to 10.23 nm and a gauge length of 12.6 nm were simulated in uniaxial tension tests [138]. Stress–strain curves showed that Young modulus, peak stress and ultimate strength all increased as the sample diameter was reduced, but remained always smaller than values for bulk silica. The failure mode, however, showed very different behavior going from small to large diameters: NWs with the smallest diameter ( nm) fractured only by localized necking and void growth did not affect the overall failure. For larger diameters (nm), growth and coalescence of voids occurred inside the NWs, and cracks nucleated and propagated on the surface of NWs.
In the case of metallic glasses, MD simulations were performed for Cu50Zr50 NWs [139]. Compression and tension tests were used on cylindrical specimens with diameters ranging from 8 to 45 nm and a ratio of height to diameter of 3. It was found that shear localization ruled deformation in the case of sub-micro samples, yielding a scaling law, whereas homogeneous deformation mode led to a dependence of the yield strength for nanoscale samples. On the basis of a theoretical model involving surface stress and Mohr–Coulomb criterion, the authors were able to estimate the critical length scale corresponding to a transition from shear localization to homogeneous deformation [139]. More recently, two Cu64Zr36 NWs with a diameter of 20 nm and aspect ratios of 3 and 12.5, respectively, were simulated under uniaxial loading at 50 K and a constant strain rate of (see Fig.2(c)-(d)) [140]. These simulations could provide an atomistic understanding of the deformation mechanism, separating the size effects from the contribution to plasticity due to the aspect ratio. The two NWs did show substantial different plastic regimes once the maximum stress was reached. Although they both exhibited very similar elastic and plastic deformations localized in shear bands, only the high aspect ratio NW failed catastrophically owing to the initiation and propagation of one shear band. A theoretical model was developed, providing a qualitative interpretation of the brittle-to-ductile transition. Finally, metallic glasses with structural flaws were simulated by considering notched and unnotched Fe75P25 nanocylinders[141]. The authors studied the deformation mechanism and failure modes under uniaxial tension, demonstrating that the brittle propagation of cracks in the notched samples was due to void nucleation, growth, and coalescence. In unnotched samples, shear band formation led to failure in a direction not orthogonal to the loading one. In general, structural flaws considerably reduced the sample failure strength and affected both crack initiation and rupture mode, even in the absence of discrete microstructural features.
Statistical theories of fracture
Extreme value theory (EVT) deals with the statistical properties of the extremes (i.e. the maximum or the minimum) of identical independent random variables. The central result is that in the large limit, the distribution of extremes has a limiting form falling into three general classes: the Weibull, the Fréchet or the Gumbel distribution [142, 143, 144]. The Weibull and Fréchet distributions are intimately related, but the Weibull distribution is mostly used in cases that deal with the minimum rather than the maximum, hence the distributions of failure stresses in materials are believed to be either of the Weibull or of the Gumbel type (see Box 1).
The connection between EVT and fracture is provided by the “weakest link hypothesis”: assuming that a sample of volume can be subdivided into representative elements of volume , the fracture strength is determined by the smallest failure stresses of the elements, resulting in an extreme value distribution. This can be seen considering that the probability at a set of elements with random failure stresses survives at a stress is equivalent to the probability that all the elements survive, yielding , where is the survival distribution of the single element. Since by definition is a decreasing function that is always less than one for , when increases the average failure stress must decrease.
The straightforward application to EVT to fracture rests on several assumptions that is sometimes hard to justify, leading to an intense debate [145, 146, 147, 148, 12, 149, 150, 151, 152]. In particular, EVT invariably assumes that the material volume can be decomposed in a set of statistically independent elements or that it has a population of non-interacting crack-like defects, so that global failure occurs as soon as the weakest of these defects starts to grow. This assumption works well for some brittle materials such as glasses or ceramics where the distribution of fracture strength can be derived from the distribution of flaw sizes [9, 10, 11, 12, 13]. To demonstrate this, we should consider the stability of a crack in a linear elastic material, as first derived by Griffith in his pioneering work [4]. According to Griffith’s theory, a crack of length subject to a normal stress is stable as long as
| (1) |
where is the geometry factor of the crack, and is the critical stress intensity factor of the material. If we known the distribution that a volume element does not contain any crack longer than , then we can invert Eq. 1 to derive the survival distribution as
| (2) |
If the crack length distribution is a power law with exponent , then , which leads to a Weibull distribution of fracture strength with modulus [9, 13]. When the crack length distribution is exponential, the survival distribution asymptotically becomes of the Gumbel form [10, 11, 12].
Quasi-brittle materials such as paper [153], granite [154, 155], bone [156], wood [155, 157], and composites [158, 159], typically accumulate damage before fracture. Hence, the weakest defect would not necessarily dominate the fracture properties and multiple defects would also interact via long-range elastic fields so that the assumption of statistical independence becomes questionable. Numerical simulations of network models for fracture [160] indicate that in the large size limit the survival distribution can be successfully rescaled so that, even if volume elements are interacting, the failure distribution converges to the Weibull [13] or Gumbel class [10, 11, 12] depending on the type of disorder. The asymptotic distribution, however, does not simply reflect the initial disordered configuration of the sample but involves a correction due to accumulated damage [12, 13].
In experiments, testing for the independence of individual sub-volume elements can be performed empirically by data collapse, as illustrated in Fig. 3. In particular, for independent sub-volumes should not depend on so that rescaled survival curves obtained from samples with different volumes should all collapse into a single master curve. Successful rescaling also implies that the average failure stress depends on the volume, as shown in Fig. 3c. If we consider a survival distribution obtained from individual volume elements whose failure stresses are not statistically independent, we can not rescale and collapse the data, as shown in Fig. 3b. Hence, volume rescaling of the survival distribution is a crucial test for the applicability of EVT to fracture data.
A straightforward application of EVT to micro and nanoscale materials is even more problematic, since we can not rely on the large scale asymptotic limit. Despite this fact, fitting size effects and strength distributions with Weibull-type laws is extremely common in micro and nanoscale materials mechanics. The main issue in small scale samples is that the volume of representative element is expected to be small and therefore sensitive to thermal fluctuations. This implies that a meaningful statistical theory for fracture size effects should include the effect of temperature and strain rate. Intuitively, if a representative element can fail due to thermal activation then rate effects also become important since the slower the rate, the likelier it is that a critical thermal fluctuation will lead to failure.
A generalization of EVT taking into account strain rate and temperature is discussed in Box 1 [135]. The theory replaces the search for the weakest link by the calculation of the first link to break. In this process, extreme value statistics is changed into a first-passage problem. The interesting observation is that the general structure of the survival probability remains the same in the EVT case, namely , where is a suitable function of stress , temperature and strain rate . This could explain why one can often fit experimental data for micro and nanoscale samples with EVT (see Fig. 3d). Provided that temperature and rate are held constant, the expected size effect law will resemble the predictions of EVT (see Fig. 3d). Yet, for a more precise determination of size effects it is imperative to analyze the role of strain rate and temperature as it has been shown in the case of graphene simulations [135] (see Fig. 3e and 3f). The theory suggests that the relevance of rate and thermal effects can be simply estimated computing a dimensionless parameter , where is the Young modulus, is the Boltzmann constant, is the volume of the representative element and is its characteristic frequency. Only when , thermal and rate effects can safely be ignored.
A data analysis toolbox for fracture statistics
When confronted with a set of data for the fracture strength of different samples, the key question to address is which statistical distribution best represent the data and how does this distribution change with the sample volume. In ideal conditions, we would need a large set of nominally identical samples for each different volume, but unfortunately this is rarely available. In most cases, we have access to a relatively small set of samples, possibly of varying volumes. The question is then to decide the best strategy to analyze them, avoiding possible pitfalls. In Box 2, we provide a set of technical guidelines on how to perform this analysis in practice depending on various scenarios of increasing complexity. In the first scenario (case i in Box 2), we consider a set of samples of equal volume and assume that we can safely disregard rate and thermal effects (i.e. ). Under these conditions, the best strategy is to perform a simple fit of the survival distribution function obtained from the data using a suitable function obtained from EVT.
In practice, can be constructed by rank ordering the experimentally obtained failure stresses: , where is the rank order, from smaller to larger, and then plotting (, ). This procedure provides an estimate of the survival distribution that is free from any binning. Notice, that we have to be extremely careful in applying the same procedure to the common case in which the experimentally tested samples do not share the same volume . If we construct a survival distribution in such a case, we would be mixing together the distributions related to different volumes . Hence, we can not use the EVT prediction derived for identical volume samples to fit the distribution, although this was often incorrectly reported in the past literature. The only viable option to compare data obtained from samples with different volumes is to use the maximum likelihood method (see case ii in Box 2).
Two other scenarios occur when the rate and thermal effects can not be neglected in the fracture process. In those cases, one should again distinguish between the case in which the volume is the same for all samples (case iii in Box 2) or different for each sample (case iv). As in the previous scenarios, equal volume samples can be analyzed either by least square fitting or by the maximum likelihood method, while samples with different volumes can only be analyzed with the second method. In both cases, the reference theory is not classical EVT but a temperature and rate dependent version of it, like the one reported in Box 1.
In Fig. 4a, we report an example from the failure of ultrahigh strength carbon fibers [36]. Experiments were performed at constant strain rate on a set of nominally identical fibers with equal volume. Hence, it is possible to construct the survival curve for each volume and strain rate and then fit the result using the rate dependent theory (Box 1). The resulting range from to , indicating that we can safely neglect thermal and rate effects (case i). Indeed the survival curves all collapse into a single curve when rescaled by the volume (see inset of Fig. 4a) despite the fact that strain rates are different. In the second example reported in Fig. 4b, CNT fibers are fractured at two very different strain rates. In this case, however, volumes vary widely and it is not possible to construct a survival distribution for each volume. Hence, the only available option is to estimate the parameters by the maximum likelihood method. The result indicates that for the highest rate and we should therefore consider explicitly rate effects (case iv).
In general, the use of least-square fitting or maximum likelihood both present benefits and drawbacks [161, 162, 163, 164]. However, once the method is chosen, the problem is to select the correct statistical model for a given dataset, i.e. whether Weibull or Gumbel EVT distribution. In this respect, the maximum likelihood method is the most widely used to discriminate among competing models, by selecting the model with the largest likelihood function [152, 165].
Conclusions
In this review article, we have discussed recent observations of size effects in the failure of materials at the micro and nanoscale. There is currently a growing interest in the development of smaller and smaller materials and devices with increasingly sophisticated experimental methods to test their mechanical properties. Understand and predict when nanomaterials will fail is of uttermost importance for all applications but the presence of size-dependent strength fluctuations makes the issue particularly complex. Reducing the sample scale typically make things worst: Small samples are more susceptible to thermal fluctuations and even very small structural defects can have dramatic effects in driving failure. Even plastic deformation, that in macroscopic samples is essentially size independent and smooth, becomes strongly size-dependent and intermittent at the micron scale and below. The interpretation of these experimental observations needs novel theoretical tools that take disorder and fluctuations explicitly into account.
Here we concentrated our discussion on EVT distributions that are currently widely used to fit experimental data obtained from micro and nanoscale samples. We highlighted that EVT are derived under well defined assumptions and it is very important to understand if they are verified before embarking in a fit. The crucial assumption underlying EVT is that global failure is dictated by a single localized event, so that the theory does not necessarily hold when fracture arises from the coalescence of many localized events. Extensive simulations of disordered network models for fracture reveal that the fracture statistics is asymptotically ruled by EVT, even when failure is preceded by diffuse damage accumulation [12, 13, 166]. The convergence to EVT is shown to occur at relatively small scales [12, 166], justifying the application of EVT to micro and even nanoscale materials. This is confirmed by a wide variety of experimental and numerical results reviewed here.
Despite the successes of EVT in describing a vast heterogeneity of experimental data, there are still cases where its application is more questionable. A notable example is the plastic deformation of crystalline materials, where yielding is due to the motion of a large number of interacting dislocations. The interesting issue of the origin of size effects and yield stress statistics in crystal plasticity is a topic of active research discussed in a number of excellent review articles [7, 25, 22].
Even when failure is ruled by extreme events, an important issue to be considered is the possible relevance of rate and thermal effects during the failure process. We have shown that it is possible to assess this by evaluating a simple dimensionless parameter. The second important issue stems from the nature of the data. In ideal conditions, one would need to compute the fracture strength of a large set of nominally identical samples, but this is rarely the case. In most cases, however, we have only access to a set of samples of varying volumes and possibly strain-rates. Even in this cases it is still possible to estimate useful parameters from the data using the maximum likelihood method. We hope the guidelines we propose here could be useful to understand size effects in micro and nanoscale materials and plan for future experiments in the field.
BOX 1:
Extreme value theory: According to the theory, the survival distribution function , that is defined as the probability that a specimen of volume remains intact up to a stress , is given by
| (3) |
where the volume dependence is hidden in the parameters, so that and
The probability density function (pdf) is given by :
| (4) |
and size effects emerge clearly after calculating the average strength
| (5) |
where represents the gamma function, and is the Euler-Mascheroni constant.
Corrections due to thermal and rate effects. When temperature and/or strain rate effects cannot be neglected, the weakest link hypothesis does not hold anymore: the first elementary volume which breaks does not necessarily coincide with the weakest, although its failure still causes the sample failure. As a consequence, the survival probability expression does not correspond to any of the EVT limit distributions and depends explicitly on temperature and strain-rate. If we assume that global failure is still dictated by the failure of first volume element, we can write the survival distribution as
| (6) |
Here represents the failure strain distributions of the elementary volumes , assuming that they are perfectly brittle. The thermal factor can be derived from the Kramer’s theory for the transition rate as [135]
| (7) |
where is a characteristic frequency, is the Young modulus and the Boltzmann’s constant. Rate effects can be ignored when and the thermal factor tends to 1, recovering classical EVT (see [135] for a detailed derivation). According to Eqs. 6-7, the average failure stress decreases with volume and temperature (see Fig.3(f)) and increases with the strain rate .
BOX 2:
Case i: Samples of equal volume (), no rate and thermal effects. In this case, it is useful to construct the experimental survival distribution function
, and to compare it with EVT distributions (Eq. 3). This is done in practice by performing a linear regression of
with the fitting function for the Weibull distribution and for the Gumbel distribution. An equivalent alternative method is to maximize the likelihood function where is computed according to (4) with parameters
for Weibull and for Gumbel.
Case ii: Samples of different volumes, no rate and thermal effects.
If each measured strength comes from samples with different volumes , the maximum likelihood estimation method is the only viable strategy. Here, the the function takes the form
, with
, where for Weibull and
with for Gumbel.
Case iii: Samples of equal volume, with rate and thermal effects.
As in case i, when samples share the same volume we can compute the experimental survival distribution function which will now
depend on strain rate and temperature. We can use the theory discussed in Box 1 (Eq. 6) to perform least square fitting. Notice that the survival distributions should be computed separately for samples deformed under different conditions of strain-rate and temperature. An alternative method relies in the maximum likelihood method.
Case iv: Samples of different volume, with rate and thermal effects.
In this case, the only available method is the maximum likelihood estimation where the
likelihood function is based on the rate and temperature dependent probability
density function as discussed in Box 1.
References
- [1] da Vinci, L. I libri di Meccanica (Hoepli Milano 1940).
- [2] Weibull, W. A statistical theory of the strength of materials (Stockholm, 1939).
- [3] Gumbel, E. J. Statistics of Extremes (Columbia University Press, New York, 2004).
- [4] Griffith, A. A. Vi. the phenomena of rupture and flow in solids. Philosophical transactions of the royal society of london. Series A, containing papers of a mathematical or physical character 221, 163–198 (1921).
- [5] Weiss, J., Girard, L., Gimbert, F., Amitrano, D. & Vandembroucq, D. (finite) statistical size effects on compressive strength. Proceedings of the National Academy of Sciences 111, 6231–6236 (2014).
- [6] Zaiser, M. & Moretti, P. Fluctuation phenomena in crystal plasticity—a continuum model. Journal of Statistical Mechanics: Theory and Experiment 2005, P08004 (2005).
- [7] Zaiser, M. Scale invariance in plastic flow of crystalline solids. Advances in physics 55, 185–245 (2006).
- [8] Tüzes, D., Ispánovity, P. D. & Zaiser, M. Disorder is good for you: the influence of local disorder on strain localization and ductility of strain softening materials. International Journal of Fracture 205, 139–150 (2017).
- [9] Freundenthal, A. M. Statistical approach to brittle fracture (Academic Press, New York, 1968).
- [10] Duxbury, P. M., Leath, P. L. & Beale, P. D. Breakdown properties of quenched random systems: The random-fuse network. Phys. Rev. B 36, 367–380 (1987).
- [11] Beale, P. D. & Duxbury, P. M. Theory of dielectric breakdown in metal-loaded dielectrics. Phys. Rev. B 37, 2785 (1988).
- [12] Manzato, C. et al. Fracture strength of disordered media: Universality, interactions, and tail asymptotics. Phys. Rev. Lett. 108, 065504 (2012).
- [13] Bertalan, Z., Shekhawat, A., Sethna, J. P. & Zapperi, S. Fracture strength: Stress concentration, extreme value statistics, and the fate of the weibull distribution. Phys. Rev. Applied 2, 034008 (2014). URL https://link.aps.org/doi/10.1103/PhysRevApplied.2.034008.
- [14] Uchic, M. D., Dimiduk, D. M., Florando, J. N. & Nix, W. D. Sample dimensions influence strength and crystal plasticity. Science 305, 986–989 (2004).
- [15] Dimiduk, D., Uchic, M. & Parthasarathy, T. Size-affected single-slip behavior of pure nickel microcrystals. Acta Materialia 53, 4065–4077 (2005).
- [16] Uchic, M. D., Shade, P. A. & Dimiduk, D. M. Plasticity of micrometer-scale single crystals in compression. Annual Review of Materials Research 39, 361–386 (2009).
- [17] Dimiduk, D. M., Woodward, C., Lesar, R. & Uchic, M. D. Scale-free intermittent flow in crystal plasticity. Science 312, 1188–1190 (2006). URL http://dx.doi.org/10.1126/science.1123889.
- [18] Miguel, Vespignani, A., Zapperi, S., Weiss, J. & Grasso, J.-R. Intermittent dislocation flow in viscoplastic deformation. Nature 410, 667–671 (2001). URL http://dx.doi.org/10.1038/35070524.
- [19] Csikor, F. F., Motz, C., Weygand, D., Zaiser, M. & Zapperi, S. Dislocation avalanches, strain bursts, and the problem of plastic forming at the micrometer scale. Science 318, 251–254 (2007).
- [20] Greer, J. R. & Nix, W. D. Nanoscale gold pillars strengthened through dislocation starvation. Physical Review B 73, 245410 (2006).
- [21] Shan, Z., Mishra, R. K., Asif, S. S., Warren, O. L. & Minor, A. M. Mechanical annealing and source-limited deformation in submicrometre-diameter ni crystals. Nature materials 7, 115 (2008).
- [22] Greer, J. R. & De Hosson, J. T. M. Plasticity in small-sized metallic systems: Intrinsic versus extrinsic size effect. Progress in Materials Science 56, 654–724 (2011).
- [23] Wu, W., Li, Y. & Schuh, C. Strength, plasticity and brittleness of bulk metallic glasses under compression: statistical and geometric effects. Philosophical Magazine 88, 71–89 (2008).
- [24] Jang, D., Gross, C. T. & Greer, J. R. Effects of size on the strength and deformation mechanism in zr-based metallic glasses. International Journal of Plasticity 27, 858–867 (2011).
- [25] Kraft, O., Gruber, P. A., Mönig, R. & Weygand, D. Plasticity in confined dimensions. Annual review of materials research 40, 293–317 (2010).
- [26] Sethna, J. P. et al. Deformation of crystals: Connections with statistical physics. Annual Review of Materials Research 47, 217–246 (2017). URL https://doi.org/10.1146/annurev-matsci-070115-032036. https://doi.org/10.1146/annurev-matsci-070115-032036.
- [27] Mielke, S. L., Belytschko, T. & Schatz, G. C. Nanoscale fracture mechanics. Annu. Rev. Phys. Chem. 58, 185–209 (2007).
- [28] Jeon, S. K., Jang, H.-S., Kwon, O. H. & Nahm, S. H. Mechanical test method and properties of a carbon nanomaterial with a high aspect ratio. Nano Convergence 3, 29 (2016).
- [29] Yu, M.-F. et al. Strength and breaking mechanism of multiwalled carbon nanotubes under tensile load. Science 287, 637–640 (2000).
- [30] Barber, A. H., Andrews, R., Schadler, L. S. & Wagner, H. D. On the tensile strength distribution of multiwalled carbon nanotubes. Applied physics letters 87, 203106 (2005).
- [31] Barber, A., Kaplan-Ashiri, I., Cohen, S., Tenne, R. & Wagner, H. D. Stochastic strength of nanotubes: an appraisal of available data. Composites Science and Technology 65, 2380–2384 (2005).
- [32] Zussman, E. et al. Mechanical and structural characterization of electrospun pan-derived carbon nanofibers. Carbon 43, 2175–2185 (2005).
- [33] Deng, F. et al. The properties of dry-spun carbon nanotube fibers and their interfacial shear strength in an epoxy composite. Carbon 49, 1752–1757 (2011).
- [34] Sun, G. et al. A modified weibull model for tensile strength distribution of carbon nanotube fibers with strain rate and size effects. Applied Physics Letters 101, 131905 (2012).
- [35] Zheng, L., Sun, G. & Zhan, Z. Tuning array morphology for high-strength carbon-nanotube fibers. Small 6, 132–137 (2010).
- [36] Naito, K., Yang, J.-M., Tanaka, Y. & Kagawa, Y. The effect of gauge length on tensile strength and weibull modulus of polyacrylonitrile (pan)-and pitch-based carbon fibers. Journal of Materials Science 47, 632–642 (2012).
- [37] Kaplan-Ashiri, I. et al. On the mechanical behavior of ws2 nanotubes under axial tension and compression. Proceedings of the National Academy of Sciences of the United States of America 103, 523–528 (2006).
- [38] Chae, H. G. et al. High strength and high modulus carbon fibers. Carbon 93, 81–87 (2015).
- [39] Hill, F. A., Havel, T. F., Hart, A. J. & Livermore, C. Enhancing the tensile properties of continuous millimeter-scale carbon nanotube fibers by densification. ACS applied materials & interfaces 5, 7198–7207 (2013).
- [40] Jang, H.-S., Jeon, S. K., Lee, H. J. & Nahm, S. H. Mechanical and electrical properties of multi-walled carbon nanotubes by nano-manipulator. Procedia Engineering 10, 2917–2922 (2011).
- [41] Chen, B. et al. Load transfer strengthening in carbon nanotubes reinforced metal matrix composites via in-situ tensile tests. Composites Science and Technology 113, 1–8 (2015).
- [42] Lee, C., Wei, X., Kysar, J. W. & Hone, J. Measurement of the elastic properties and intrinsic strength of monolayer graphene. Science 321, 385–8 (2008).
- [43] Ruiz-Vargas, C. S. et al. Softened elastic response and unzipping in chemical vapor deposition graphene membranes. Nano letters 11, 2259–2263 (2011).
- [44] Kim, K. et al. Ripping graphene: preferred directions. Nano Lett 12, 293–7 (2012).
- [45] Zhang, P. et al. Fracture toughness of graphene. Nature communications 5 (2014).
- [46] Bhushan, B. Nanomechanical properties of nanostructures and scale effects. In Nanotribology and Nanomechanics, 253–299 (Springer, 2017).
- [47] Petrovic, J., Milewski, J., Rohr, D. & Gac, F. Tensile mechanical properties of sic whiskers. Journal of materials science 20, 1167–1177 (1985).
- [48] Nemeth, N. N. et al. Fabrication and probabilistic fracture strength prediction of high-aspect-ratio single crystal silicon carbide microspecimens with stress concentration. Thin Solid Films 515, 3283–3290 (2007).
- [49] Fujii, T. et al. Nano-scale tensile testing and sample preparation techniques for silicon nanowires. Japanese Journal of Applied Physics 52, 110118 (2013).
- [50] Namazu, T., Isono, Y. & Tanaka, T. Evaluation of size effect on mechanical properties of single crystal silicon by nanoscale bending test using afm. Journal of Microelectromechanical Systems 9, 450–459 (2000).
- [51] Li, X. & Bhushan, B. Fatigue studies of nanoscale structures for mems/nems applications using nanoindentation techniques. Surface and Coatings Technology 163, 521–526 (2003).
- [52] Sundararajan, S. & Bhushan, B. Development of afm-based techniques to measure mechanical properties of nanoscale structures. Sensors and Actuators A: Physical 101, 338–351 (2002).
- [53] Espinosa, H. et al. Elasticity, strength, and toughness of single crystal silicon carbide, ultrananocrystalline diamond, and hydrogen-free tetrahedral amorphous carbon. Applied physics letters 89, 073111 (2006).
- [54] Kang, W., Merrill, M. & Wheeler, J. M. In situ thermomechanical testing methods for micro/nano-scale materials. Nanoscale 9, 2666–2688 (2017).
- [55] Kang, W. & Saif, M. T. A. In situ study of size and temperature dependent brittle-to-ductile transition in single crystal silicon. Advanced Functional Materials 23, 713–719 (2013).
- [56] Uesugi, A., Yasutomi, T., Hirai, Y., Tsuchiya, T. & Tabata, O. High-temperature tensile testing machine for investigation of brittle–ductile transition behavior of single crystal silicon microstructure. Japanese Journal of Applied Physics 54, 06FP04 (2015).
- [57] Hoffmann, S. et al. Measurement of the bending strength of vapor- liquid- solid grown silicon nanowires. Nano letters 6, 622–625 (2006).
- [58] Gordon, M. J., Baron, T., Dhalluin, F., Gentile, P. & Ferret, P. Size effects in mechanical deformation and fracture of cantilevered silicon nanowires. Nano letters 9, 525–529 (2009).
- [59] Zhu, Y., Xu, F., Qin, Q., Fung, W. Y. & Lu, W. Mechanical properties of vapor- liquid- solid synthesized silicon nanowires. Nano letters 9, 3934–3939 (2009).
- [60] Zhang, D. et al. In situ electron microscopy mechanical testing of silicon nanowires using electrostatically actuated tensile stages. Journal of Microelectromechanical Systems 19, 663–674 (2010).
- [61] Steighner, M. et al. Dependence on diameter and growth direction of apparent strain to failure of si nanowires. Journal of Applied Physics 109, 033503 (2011).
- [62] Kim, Y.-J. et al. Exploring nanomechanical behavior of silicon nanowires: Afm bending versus nanoindentation. Advanced Functional Materials 21, 279–286 (2011).
- [63] Kizuka, T., Takatani, Y., Asaka, K. & Yoshizaki, R. Measurements of the atomistic mechanics of single crystalline silicon wires of nanometer width. Physical Review B 72, 035333 (2005).
- [64] Han, X. et al. Low-temperature in situ large-strain plasticity of silicon nanowires. Advanced Materials 19, 2112–2118 (2007).
- [65] Zheng, K. et al. Atomic mechanisms governing the elastic limit and the incipient plasticity of bending si nanowires. Nano letters 9, 2471–2476 (2009).
- [66] Wang, L., Zheng, K., Zhang, Z. & Han, X. Direct atomic-scale imaging about the mechanisms of ultralarge bent straining in si nanowires. Nano letters 11, 2382–2385 (2011).
- [67] Östlund, F. et al. Brittle-to-ductile transition in uniaxial compression of silicon pillars at room temperature. Advanced Functional Materials 19, 2439–2444 (2009).
- [68] Tang, D.-M. et al. Mechanical properties of si nanowires as revealed by in situ transmission electron microscopy and molecular dynamics simulations. Nano letters 12, 1898–1904 (2012).
- [69] Jadaan, O. M., Nemeth, N. N., Bagdahn, J. & Sharpe, W. Probabilistic weibull behavior and mechanical properties of mems brittle materials. Journal of materials science 38, 4087–4113 (2003).
- [70] French, P. Polysilicon: a versatile material for microsystems. Sensors and actuators A: Physical 99, 3–12 (2002).
- [71] Boyce, B., Shaw, M., Lu, P. & Dugger, M. Stronger silicon for microsystems. Acta Materialia 58, 439–448 (2010).
- [72] Boyce, B. L., Grazier, J. M., Buchheit, T. E. & Shaw, M. J. Strength distributions in polycrystalline silicon mems. Journal of Microelectromechanical Systems 16, 179–190 (2007).
- [73] Bagdahn, J., Sharpe, W. N. & Jadaan, O. Fracture strength of polysilicon at stress concentrations. Journal of Microelectromechanical Systems 12, 302–312 (2003).
- [74] McCarty, A. & Chasiotis, I. Description of brittle failure of non-uniform mems geometries. Thin Solid Films 515, 3267–3276 (2007).
- [75] Vayrette, R. et al. Size dependent fracture strength and cracking mechanisms in freestanding polycrystalline silicon films with nanoscale thickness. Engineering Fracture Mechanics 168, 190–203 (2016).
- [76] Chasiotis, I. & Knauss, W. G. The mechanical strength of polysilicon films: Part 1. the influence of fabrication governed surface conditions. Journal of the Mechanics and Physics of Solids 51, 1533–1550 (2003).
- [77] Andersons, J., Joffe, R., Hojo, M. & Ochiai, S. Glass fibre strength distribution determined by common experimental methods. Composites Science and Technology 62, 131–145 (2002).
- [78] Brambilla, G. & Payne, D. N. The ultimate strength of glass silica nanowires. Nano letters 9, 831–835 (2009).
- [79] Luo, J. et al. Size-dependent brittle-to-ductile transition in silica glass nanofibers. Nano letters 16, 105–113 (2015).
- [80] Sevillano, J. G., Arizcorreta, I. O. & Kubin, L. Intrinsic size effects in plasticity by dislocation glide. Materials Science and Engineering: A 309, 393–405 (2001).
- [81] Khan, A. S., Farrokh, B. & Takacs, L. Compressive properties of cu with different grain sizes: sub-micron to nanometer realm. Journal of materials science 43, 3305–3313 (2008).
- [82] Kiener, D., Grosinger, W., Dehm, G. & Pippan, R. A further step towards an understanding of size-dependent crystal plasticity: In situ tension experiments of miniaturized single-crystal copper samples. Acta Materialia 56, 580–592 (2008).
- [83] Lin, M.-T., Tong, C.-J. & Shiu, K.-S. Novel microtensile method for monotonic and cyclic testing of freestanding copper thin films. Experimental Mechanics 50, 55–64 (2010).
- [84] Jennings, A. T., Burek, M. J. & Greer, J. R. Microstructure versus size: mechanical properties of electroplated single crystalline cu nanopillars. Physical review letters 104, 135503 (2010).
- [85] Haque, M. & Saif, M. In-situ tensile testing of nano-scale specimens in sem and tem. Experimental mechanics 42, 123–128 (2002).
- [86] Yue, Y. et al. Crystalline liquid and rubber-like behavior in cu nanowires. Nano letters 13, 3812–3816 (2013).
- [87] Motz, C., Schöberl, T. & Pippan, R. Mechanical properties of micro-sized copper bending beams machined by the focused ion beam technique. Acta Materialia 53, 4269–4279 (2005).
- [88] Kiener, D., Motz, C., Schöberl, T., Jenko, M. & Dehm, G. Determination of mechanical properties of copper at the micron scale. Advanced Engineering Materials 8, 1119–1125 (2006).
- [89] Florando, J. & Nix, W. A microbeam bending method for studying stress–strain relations for metal thin films on silicon substrates. Journal of the Mechanics and Physics of Solids 53, 619–638 (2005).
- [90] Vlassak, J. & Nix, W. A new bulge test technique for the determination of young’s modulus and poisson’s ratio of thin films. Journal of Materials Research 7, 3242–3249 (1992).
- [91] Wei, X., Lee, D., Shim, S., Chen, X. & Kysar, J. W. Plane-strain bulge test for nanocrystalline copper thin films. Scripta materialia 57, 541–544 (2007).
- [92] Merle, B., Schweitzer, E. W. & Göken, M. Thickness and grain size dependence of the strength of copper thin films as investigated with bulge tests and nanoindentations. Philosophical Magazine 92, 3172–3187 (2012).
- [93] Brenner, S. S. Tensile strength of whiskers. Journal of Applied Physics 27, 1484–1491 (1956).
- [94] Brenner, S. Growth and properties of” whiskers”. Science 128, 569–575 (1958).
- [95] Richter, G. et al. Ultrahigh strength single crystalline nanowhiskers grown by physical vapor deposition. Nano Letters 9, 3048–3052 (2009).
- [96] Hemker, K. & Sharpe Jr, W. Microscale characterization of mechanical properties. Annu. Rev. Mater. Res. 37, 93–126 (2007).
- [97] Gianola, D. et al. Stress-assisted discontinuous grain growth and its effect on the deformation behavior of nanocrystalline aluminum thin films. Acta Materialia 54, 2253–2263 (2006).
- [98] Gupta, S. & Pierron, O. N. A mems tensile testing technique for measuring true activation volume and effective stress in nanocrystalline ultrathin microbeams. Journal of Microelectromechanical Systems (2017).
- [99] Chen, W., You, Z., Tao, N., Jin, Z. & Lu, L. Mechanically-induced grain coarsening in gradient nano-grained copper. Acta Materialia 125, 255–264 (2017).
- [100] Jennings, A. T. & Greer, J. R. Tensile deformation of electroplated copper nanopillars. Philosophical Magazine 91, 1108–1120 (2011).
- [101] Jennings, A. T., Li, J. & Greer, J. R. Emergence of strain-rate sensitivity in cu nanopillars: Transition from dislocation multiplication to dislocation nucleation. Acta Materialia 59, 5627–5637 (2011).
- [102] Wang, J. et al. In situ atomic-scale observation of twinning-dominated deformation in nanoscale body-centred cubic tungsten. Nature materials 14, 594 (2015).
- [103] Lilleodden, E. Microcompression study of mg (0001) single crystal. Scripta Materialia 62, 532–535 (2010).
- [104] Kunz, A., Pathak, S. & Greer, J. R. Size effects in al nanopillars: Single crystalline vs. bicrystalline. Acta Materialia 59, 4416–4424 (2011).
- [105] Kim, J.-Y., Jang, D. & Greer, J. R. Tensile and compressive behavior of tungsten, molybdenum, tantalum and niobium at the nanoscale. Acta Materialia 58, 2355–2363 (2010).
- [106] Wang, J. et al. Near-ideal theoretical strength in gold nanowires containing angstrom scale twins. Nature communications 4, 1742 (2013).
- [107] Sim, G.-D. et al. An apparatus for performing microtensile tests at elevated temperatures inside a scanning electron microscope. Acta materialia 61, 7500–7510 (2013).
- [108] Sim, G.-D. & Vlassak, J. J. High-temperature tensile behavior of freestanding au thin films. Scripta Materialia 75, 34–37 (2014).
- [109] Vayrette, R., Raskin, J.-P. & Pardoen, T. On-chip fracture testing of freestanding nanoscale materials. Engineering Fracture Mechanics 150, 222–238 (2015).
- [110] Gorham, D. The effect of specimen dimensions on high strain rate compression measurements of copper. Journal of Physics D: Applied Physics 24, 1489 (1991).
- [111] Sun, B. & Wang, W. The fracture of bulk metallic glasses. Progress in Materials Science 74, 211–307 (2015).
- [112] Wang, W. H. The elastic properties, elastic models and elastic perspectives of metallic glasses. Progress in Materials Science 57, 487–656 (2012).
- [113] Greer, A., Cheng, Y. & Ma, E. Shear bands in metallic glasses. Materials Science and Engineering: R: Reports 74, 71–132 (2013).
- [114] Lai, Y. et al. Bulk and microscale compressive behavior of a zr-based metallic glass. Scripta Materialia 58, 890–893 (2008).
- [115] Schuster, B. E. et al. Bulk and microscale compressive properties of a pd-based metallic glass. Scripta Materialia 57, 517–520 (2007).
- [116] Chen, T.-H. & Tsai, C.-K. The microstructural evolution and mechanical properties of zr-based metallic glass under different strain rate compressions. Materials 8, 1831–1840 (2015).
- [117] Calvo, M. Application of the weibull statistics to the characterization of metallic glass ribbons. Journal of materials science 24, 1801–1808 (1989).
- [118] Ocelík, V., Bengus, V., Diko, P. & Hudak, O. Statistical investigations of fracture demonstrations on ni-si-b metallic glass ribbons failed in tension at 4.2 to 300k. Journal of materials science letters 6, 1333–1335 (1987).
- [119] Zhao, Y.-Y., Ma, E. & Xu, J. Reliability of compressive fracture strength of mg–zn–ca bulk metallic glasses: Flaw sensitivity and weibull statistics. Scripta Materialia 58, 496–499 (2008).
- [120] Han, Z., Tang, L., Xu, J. & Li, Y. A three-parameter weibull statistical analysis of the strength variation of bulk metallic glasses. Scripta Materialia 61, 923–926 (2009).
- [121] Shamimi Nouri, A., Gu, X., Poon, S., Shiflet, G. & Lewandowski, J. Chemistry (intrinsic) and inclusion (extrinsic) effects on the toughness and weibull modulus of fe-based bulk metallic glasses. Philosophical Magazine Letters 88, 853–861 (2008).
- [122] Yao, J., Wang, J., Lu, L. & Li, Y. High tensile strength reliability in a bulk metallic glass. Applied Physics Letters 92, 041905 (2008).
- [123] Lee, C. et al. Strength variation and cast defect distribution in metallic glasses. Scripta Materialia 63, 105–108 (2010).
- [124] Pastewka, L., Pou, P., Pérez, R., Gumbsch, P. & Moseler, M. Describing bond-breaking processes by reactive potentials: Importance of an environment-dependent interaction range. Physical Review B 78, 161402 (2008).
- [125] Brenner, D. W. Empirical potential for hydrocarbons for use in simulating the chemical vapor deposition of diamond films. Physical Review B 42, 9458 (1990).
- [126] Van Duin, A. C., Dasgupta, S., Lorant, F. & Goddard, W. A. Reaxff: a reactive force field for hydrocarbons. The Journal of Physical Chemistry A 105, 9396–9409 (2001).
- [127] Yang, M., Koutsos, V. & Zaiser, M. Size effect in the tensile fracture of single-walled carbon nanotubes with defects. Nanotechnology 18, 155708 (2007).
- [128] Lu, Q. & Bhattacharya, B. Effect of randomly occurring stone–wales defects on mechanical properties of carbon nanotubes using atomistic simulation. Nanotechnology 16, 555 (2005).
- [129] Bhattacharya, B. & Lu, Q. The asymptotic properties of random strength and compliance of single-walled carbon nanotubes using atomistic simulation. Journal of Statistical Mechanics: Theory and Experiment 2006, P06021 (2006).
- [130] Yakobson, B., Campbell, M., Brabec, C. & Bernholc, J. High strain rate fracture and c-chain unraveling in carbon nanotubes. Computational Materials Science 8, 341–348 (1997).
- [131] Wen, M., An, B., Fukuyama, S., Yokogawa, K. & Ngan, A. Thermally activated model for tensile yielding of pristine single-walled carbon nanotubes with nonlinear elastic deformation. Carbon 47, 2070–2076 (2009).
- [132] Brenner, D. W. et al. A second-generation reactive empirical bond order (rebo) potential energy expression for hydrocarbons. Journal of Physics: Condensed Matter 14, 783 (2002).
- [133] Tang, C., Guo, W. & Chen, C. Molecular dynamics simulation of tensile elongation of carbon nanotubes: temperature and size effects. Physical Review B 79, 155436 (2009).
- [134] Jensen, B. D., Wise, K. E. & Odegard, G. M. Simulation of mechanical performance limits and failure of carbon nanotube composites. Modelling and Simulation in Materials Science and Engineering 24, 025012 (2016).
- [135] Sellerio, A. L., Taloni, A. & Zapperi, S. Fracture size effects in nanoscale materials: the case of graphene. Physical Review Applied 4, 024011 (2015).
- [136] Dudko, O. K., Hummer, G. & Szabo, A. Intrinsic rates and activation free energies from single-molecule pulling experiments. Physical review letters 96, 108101 (2006).
- [137] Kang, K. & Cai, W. Size and temperature effects on the fracture mechanisms of silicon nanowires: molecular dynamics simulations. International Journal of Plasticity 26, 1387–1401 (2010).
- [138] Zhang, C., Duan, F. & Liu, Q. Size effects on the fracture behavior of amorphous silica nanowires. Computational Materials Science 99, 138–144 (2015).
- [139] Zhou, X., Zhou, H., Li, X. & Chen, C. Size effects on tensile and compressive strengths in metallic glass nanowires. Journal of the Mechanics and Physics of Solids 84, 130–144 (2015).
- [140] Sopu, D., Foroughi, A., Stoica, M. & Eckert, J. Brittle-to-ductile transition in metallic glass nanowires. Nano letters 16, 4467–4471 (2016).
- [141] Gu, X. W. et al. Mechanisms of failure in nanoscale metallic glass. Nano letters 14, 5858–5864 (2014).
- [142] Fisher, R. A. & Tippett, L. H. C. Limiting forms of the frequency distribution of the largest or smallest member of a sample. In Mathematical Proceedings of the Cambridge Philosophical Society, vol. 24, 180–190 (Cambridge University Press, 1928).
- [143] Fréchet, M. Sur la loi de probabilité de l’écart maximum. In Annales de la societe Polonaise de Mathematique ([sn], 1928).
- [144] Gnedenko, B. Sur la distribution limite du terme maximum d’une serie aleatoire. Annals of mathematics 423–453 (1943).
- [145] Danzer, R., Supancic, P., Pascual, J. & Lube, T. Fracture statistics of ceramics – weibull statistics and deviations from weibull statistics. Engineering Fracture Mechanics 74, 2919 – 2932 (2007).
- [146] Lu, C., Danzer, R. & Fischer, F. D. Fracture statistics of brittle materials: Weibull or normal distribution. Phys. Rev. E 65, 067102 (2002).
- [147] Doremus, R. Fracture statistics: A comparison of the normal, weibull, and type i extreme value distributions. Journal of Applied Physics 54, 193–198 (1983).
- [148] Trustrum, K. & Jayatilaka, A. Applicability of weibull analysis for brittle materials. Journal of Materials Science 18, 2765–2770 (1983).
- [149] Nohut, S. & Lu, C. Fracture statistics of dental ceramics: Discrimination of strength distributions. Ceramics International 38, 4979 – 4990 (2012).
- [150] Bazant, Z., Xi, Y. & Reid, S. Statistical size effect in quasi‐brittle structures: I. is weibull theory applicable? Journal of Engineering Mechanics 117, 2609–2622 (1991).
- [151] Rozenblat, Y. et al. Strength distribution of particles under compression. Powder Technology 208, 215 – 224 (2011).
- [152] Basu, B., Tiwari, D., Kundu, D. & Prasad, R. Is weibull distribution the most appropriate statistical strength distribution for brittle materials? Ceramics International 35, 237–246 (2009).
- [153] Salminen, L. I., Tolvanen, A. I. & Alava, M. J. Acoustic emission from paper fracture. Phys. Rev. Lett. 89, 185503 (2002).
- [154] Lockner, D., Byerlee, J., Kuksenko, V., Ponomarev, A. & Sidorin, A. Quasi-static fault growth and shear fracture energy in granite. Nature 350, 39–42 (1991).
- [155] Garcimartin, A., Guarino, A., Bellon, L. & Ciliberto, S. Statistical properties of fracture precursors. Phys. Rev. Lett. 79, 3202–3205 (1997).
- [156] Zioupos, P., Currey, J. & Sedman, A. An examination of the micromechanics of failure of bone and antler by acoustic emission tests and laser scanning confocal microscopy. Medical Engineering & Physics 16, 203 – 212 (1994).
- [157] Reiterer, A., Stanzl-Tschegg, S. E. & Tschegg, E. K. Mode i fracture and acoustic emission of softwood and hardwood. Wood Science and Technology 34, 417–430 (2000).
- [158] Yukalov, V., Moura, A. & Nechad, H. Self-similar law of energy release before materials fracture. Journal of the Mechanics and Physics of Solids 52, 453 – 465 (2004).
- [159] J.-C. Anifrani, C. Le Floc’h, D. Sornette & B. Souillard. Universal log-periodic correction to renormalization group scaling for rupture stress prediction from acoustic emissions. J. Phys. I France 5, 631–638 (1995).
- [160] Alava, M. J., Nukala, P. K. & Zapperi, S. Statistical models of fracture. Advances in Physics 55, 349–476 (2006).
- [161] Wu, D., Zhou, J. & Li, Y. Methods for estimating weibull parameters for brittle materials. Journal of materials science 41, 5630–5638 (2006).
- [162] Wu, D., Zhou, J. & Li, Y. Unbiased estimation of weibull parameters with the linear regression method. Journal of the European Ceramic Society 26, 1099–1105 (2006).
- [163] Ambrožič, M. & Vidovič, K. Reliability of the weibull analysis of the strength of construction materials. Journal of Materials Science 42, 9645–9653 (2007).
- [164] Ambrožič, M. & Gorjan, L. Reliability of a weibull analysis using the maximum-likelihood method. Journal of materials science 46, 1862–1869 (2011).
- [165] Cox, D. R. Further results on tests of separate families of hypotheses. Journal of the Royal Statistical Society. Series B (Methodological) 406–424 (1962).
- [166] Shekhawat, A., Zapperi, S. & Sethna, J. P. From damage percolation to crack nucleation through finite size criticality. Physical review letters 110, 185505 (2013).
- [167] Jang, D. & Greer, J. R. Transition from a strong-yet-brittle to a stronger-and-ductile state by size reduction of metallic glasses. Nature materials 9, 215–219 (2010).
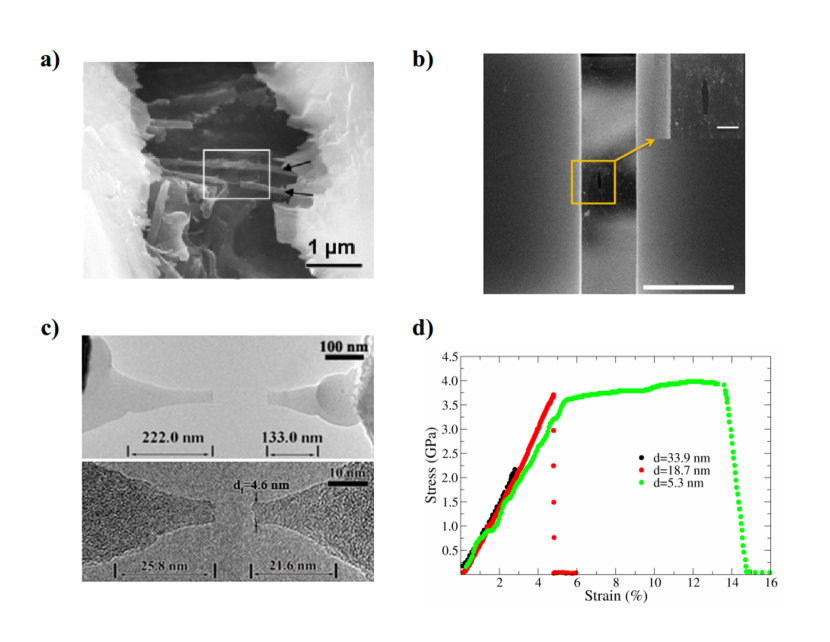
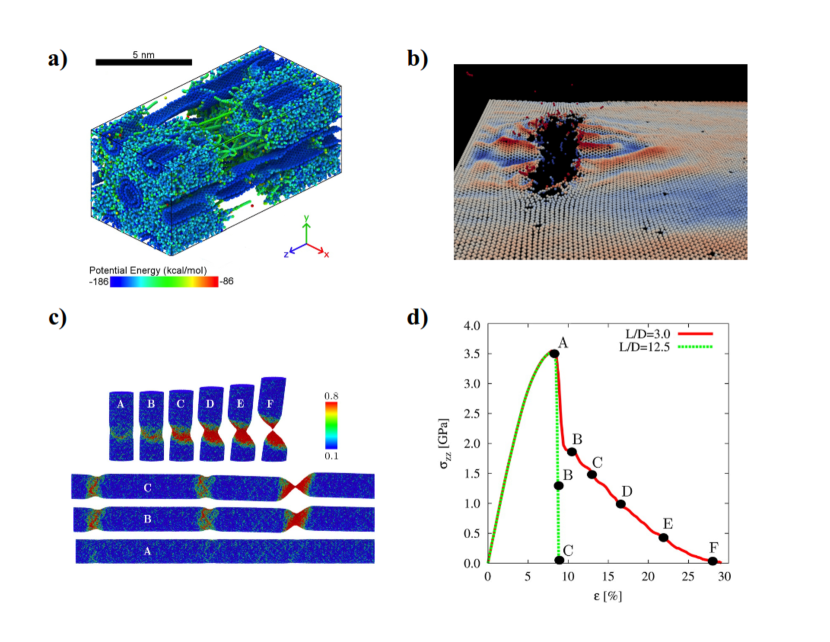
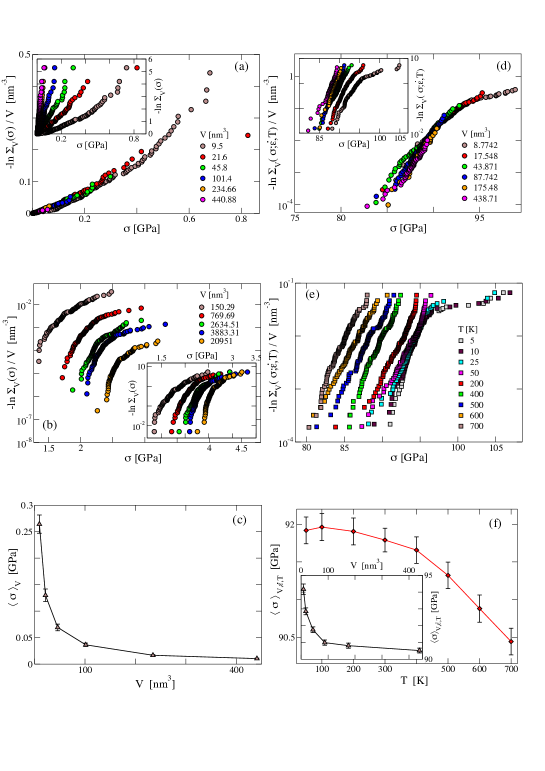
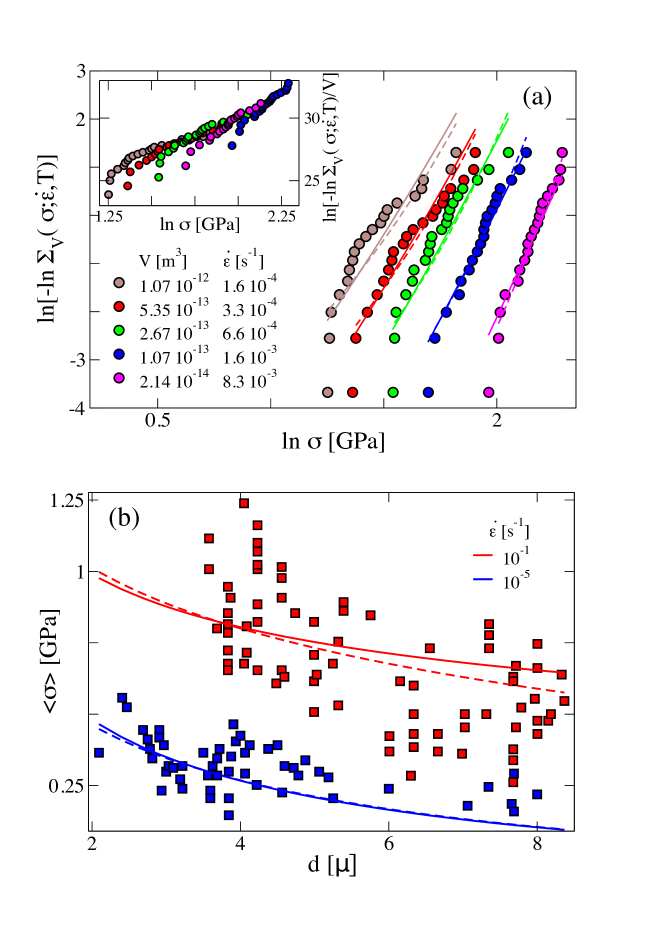
Supplementary Table S1. Acronyms listed in the table: MWCNT = multiwalled carbon nanotube, AD = arc discharge, CVD = chemical vapor deposition, PAN = poly-acrylonitrile, AFM = atomic force microscope, AMCs = Al matrix composites, NW = nanowire, MDE = membrane deflection experiment, MG = metallic glasses, od = outer diameter, l = length, ar = aspect ratio, t = thickness, w = width, uw = upper width, lw = lower width, sd = short dimension, ld = long dimension, r = radius.
| Material and size | Loading conditions | Statistical Analysis | Rate/Thermal effects |
| MWCNT (AD) [29] od = 13-40 nm l = 1.10-10.99 m | tensile (AFM) | Weibull [31] | none |
| MWCNT (CVD) [30] od = 24-144 nm l = 104 m | tensile (AFM) | Weibull [31] | none |
| MW WS2 NT [37] od = 11-36 nm l =0.85-2.95 m | tensile (AFM) | Weibull [31, 37] | none |
| MWCNT fibers [34] d = 4 m l = 6 mm | tensile [35] | Weibull | rate |
| CNT fibers (PAN) [32] d= 10–400 nm ar 1000 | tensile (AFM) | Weibull | none |
| CNT fibers [33] d = 20-50 m | tensile | Weibull | none |
| C fibers (PAN/pitch) [36] d = 5.06, 5.22, 7.37, 5.13, 11.68, 9.35 m l = 1, 5, 12.5, 25, 50, 100, 250 mm | tensile | Weibull | rate |
| C fibers (PAN) [38] d = 4.975 m l = 1, 25.4 mm | tensile | none | none |
| MWCNT (CVD) in AMCs [41] d = 1, 1.5 m | tensile | none | none |
| Monolayer graphene flakes [42] d 100 nm t 1 nm | indentation (AFM) | none | none |
| Mono- and bi-layers of graphene films [43] l 3.5 m | indentation (AFM) | none | none |
| SiC whiskers [47] d = 5-6 m l 10 mm | tensile | Weibull | none |
| SiC (curved, circular-hole, elliptical-hole) [48] w = 0.125mm l = 1.3mm t = 0.2mm | tensile | Weibull | none |
| Material and size | Loading conditions | Statistical Analysis | Rate/Thermal effects |
| Si NW [49] w = 57-235 nm (FIB), 149-314 nm (annealed) t = 221-444 nm (FIB), 263-418 nm (annealed) l = 5.0 m | tensile (MEMS device) | none | none |
| Si NW [68] d 25.3, 8.6 nm | tensile (TEM-AFM), bending | none | none |
| Si beams [50] w = 200, 300, 800 nm t = 255 nm l = 6.0 m | bending (AFM) | Weibull | none |
| Si beams [51] uw = 400 nm lw = 800 nm l = 6 m | bending (nanoindenter) | none | none |
| Si beams [52] uw = 200-600 nm lw = 385-785 nm t = 255 nm l = 6.0 m | bending(AFM) | Weibull | none |
| SiO2 beams [52] uw = 250-700 nm lw =560-990 nm t = 425 nm l = 6.0 m | bending (AFM) | Weibull | none |
| 3C-SiC, UNCD, ta-C films [53] sd = 5, 20 m ld = 100, 200 m | MDE | Weibull | none |
| SCS [55] w= 720nm-8.7m l = 6.5-8.7m | thermomechanical bending | none | temperature |
| SCS [56] w = 4-9m t = 5m l = 120m | tensile test | none | temperature |
| Poly-Si [71] w = 3745, 3819, 3854 3922 nm t = 1029, 999, 958, 970 nm | tensile (“pull-tab” method [72]) | none | none |
| Poly-Si (central hole, symmetric double notches) [73] w = 20, 50 m t = 3.5m | tensile | Weibull | none |
| Poly-Si (circular, elliptical hole) [74] w = 30-340 m l = 250-700 t = 2m | tensile | Weibull | none |
| Poly-Si films [109] w = 1, 2, 4, 6, 8 10 m t = 40, 240 nm | tensile | none | none |
| Material and size | Loading conditions | Statistical Analysis | Rate/Thermal effects |
| SiO2 NW [78] r = 81, 94, 87, 96 nm l 6 mm | tensile | none | none |
| SiO2 nanofibers [79] d = 1-47.5 nm | tensile | none | rate |
| Cu single crystal needles [82] d =m ar = 1-13.5 | tensile | none | none |
| Cu films [83] w = m l =m | tensile | none | none |
| Cu single crystal pillars [100] d = nm, ar = 3-6 | tensile, compression | none | none |
| Al [85] w = m t = 200 nm l = 185 m | tensile (MEMS device) | none | none |
| Cu NW [86] d =5nm l = 45nm | tensile | none | none |
| Cu beams [87] w =m, t =m l=m | bending | none | none |
| Cu beams [88] l =m, ar = | compression bending | none | none |
| Cu films [89] t =m | bending | none | none |
| Cu films [91] t = nm | bulge [90] | none | none |
| Cu films [92] t = nm | bulge [90] | none | none |
| Fe, Cu, Ag whiskers [93] d =m | tensile | none | none |
| Cu whiskers [95] d = nm l=m | tensile | none | none |
| Al films [97] t = nm | tensile | none | none |
| Au beams [98] w =m, l=m t=nm | tensile | none | none |
| Cu pillars [84] d = nm, ar= 3-6 | experimental compression | none | none |
| Cu pillars [101] d= nm | compression | none | rate |
| W NW [102] d = nm | compression | none | none |
| Mg pillars [103] d =m | compression | none | none |
| Material and size | Loading conditions | Statistical Analysis | Rate/Thermal effects |
| Al pillars [104] d = nm-2 m, ar = 3-4 | compression | none | none |
| W, Mo, Ta, Nb pillars [105] d = nm | tensile, compression | none | none |
| Au NW [106] d = nm | tensile | none | none |
| Cu films [107] w =m, l=m t= nm | tensile | none | temperature |
| Au films [108] w =m, l= m t= nm | tensile | none | rate |
| poly-Si, Cu films [109] t = nm | tensile | none | none |
| Zr-based MG pillars [114] d=m | compression | Weibull | rate |
| Pd-based MG pillars [115] d= m ar = 2-2.5 | compression | Weibull | none |
| Zr-based MG pillars [116] d= nm | compression | Weibull | rate |
| Co-based ribbons [117] w = 3.7-4.9 mm t =m 47-57 m l = 50 mm | tensile | Weibull | rate |
| Ni80Si80B10 and Ni80Si5B15 ribbons [118] | tensile | Weibull | rate, thermal |
| Mg-based pillars [118] d = 1.86 mm l = 3.5-4 mm | compression | Weibull | none |
| Zr48Cu45Al7 and (Zr48Cu45Al7)98Y2 [23] d = 1.5 mm l = 3.1-3.3 mm | compression | Weibull | none |
| Zr-based rods [120] d = 1.5 mm l = 30 mm | compression | Weibull | none |
| Fe-based rods [121] d = 1.5-4 mm l = 30-40 mm | bending | Weibull | none |
| Zr48Cu45Al7 [122] w = 1 mm t = 0.7mm l = 4 mm | tensile | Weibull | none |
| Zr63.8Ni16.2Cu15Al5, Pd40Ni40 P20, Au49Ag5.5Pd2.3Cu26.9Si16.34, Mg65Cu25Gd10 pillars [123] d = 3.8 m l = 9 m | compression | Weibull | none |
| Zr35Ti30Co6Be29 specimens [167] d = 330-949 nm l = 3-5 m, 800 nm | tension | none | none |
| Zr35Ti30Co6Be29 specimens [167] d = 330-949 nm l = 3-5 m, 800 nm | tension | none | none |
| Zr35Ti30Co6Be29 pillars [24] d = 117-1710 nm l = 0.9-7.37 m | compression | Weibull | none |