Large cavitation bubbles in the tube with a conical-frustum shaped closed end during a transient process
Abstract
Abstract: The transient process accompanied by extreme acceleration in the conical sections of hydraulic systems (e.g., draft tube, diffuser) can induce large cavitation bubbles both at the closed ends and in the bulk liquid. The collapses of the large cavitation bubbles can cause severe damage to the solid walls. We conduct experiments in the tubes with different conical-frustum shaped closed ends with the ‘tube-arrest’ method and observe bubbles generated at these two locations. For the bubbles generated at the close end of the tube, we propose the onset criteria, consisting of two universal non-dimensional parameters and , of large cavitation bubbles separating the water column. We investigate their dynamics including the collapse time and speed. The results indicate that the larger the conical angle, the faster the bubbles collapse. For the bubbles generated in the bulk liquid, we numerically study the collapse time, the jet characteristics and the pressure pulse at bubble collapse. We observe a much stronger jet and pressure pulse of bubbles in tubes, comparing with a bubble near an infinite plate. Our results can provide guidance in the design and safe operation of hydraulic machinery with complex geometries, considering the cavitation during the transient process.
I Introduction
In engineering applications, pipes with tapered sections, such as draft tube cones behind hydraulic turbine runners, Venturi flow meters, and diffusers are widely used. Cavitation in these conical sections can be induced by 1) excessively high flow speed, such as the cavitation vortex rope in the draft tube Nishi and Liu (2013), the single cavity Mishra and Peles (2006) and attached cavitation Barre et al. (2009); Zhang et al. (2019) in Venturi nozzles, causing pressure fluctuations and cavitation erosions; 2) extreme acceleration during the transient process (e.g., the sudden valve closing). In latter instance, cavitation bubbles can grow to sizes comparable to the pipe diameter and cause water column separation. The collapses of these bubbles may result in large scale damage to the structures, threatening the safety of the hydraulic system Bonin (1960); Bergant, Simpson, and Tijsseling (2006).
Previous studies have been carried out on the large cavitation bubbles originated next to the runner in the draft tube during the load rejection or other transient events in hydroelectric stations Nonoshita, Matsumoto, and Kubota (1999); Pejovic, Karney, and Zhang (2004); Pejovic, Karney, and Gajic (2011); Zhang et al. (2016); He et al. (2022). The results indicate that the onset of large cavitation bubbles is related to the operating factors (e.g., the closing process of the guide vanes or runner Nonoshita, Matsumoto, and Kubota (1999), the speed control of the runner Pejovic, Karney, and Zhang (2004); Pejovic, Karney, and Gajic (2011)) and the pipeline geometrical parameters (e.g., the length of the tailrace tunnel) Nonoshita, Matsumoto, and Kubota (1999). Pressure surges in the hydraulic systems accompanied by the collapses of cavitation bubbles have also been studied in specific transient processes. However, the dynamics of large transient cavitation bubbles in the conical sections (e.g., bubble sizes, evolution of the bubble shape, oscillation periods, and collapse speeds) remain unclear.
In simpler geometries, i.e., straight cylindrical pipelines, cavitation bubbles generated at the closed end (e.g., the closing valve) during the transient process have been studied by both numerical and experimental methods Sharp (1960); Simpson and Wylie (1991); Brunone, Golia, and Greco (1991); Bergant and Simpson (1999); Adamkowski and Lewandowski (2012, 2015). It is shown that the oscillation period and size of the cavitation bubbles are determined by the initial flow velocity and the pressure differences in the system Bergant, Simpson, and Tijsseling (2006); Simpson and Wylie (1991); Bergant and Simpson (1999). However, due to the destructive nature of the phenomena Bonin (1960); Bergant, Simpson, and Tijsseling (2006); Daily et al. (2014), systematical experimental studies using circulating pipe system remain difficult and limited. In contrast, the so-called ‘tube-arrest’ method provides an equivalent and low-cost experimental technique for the study of cavitation bubbles during the transient process Chesterman (1952); Chen and Wang (2004); Xu et al. (2021). In a tube-arrest setup, a tube filled with liquid is driven upwards until it impacts with a buffer, causing rapid liquid deceleration and inducing cavitation bubbles at the bottom of the tube. Based on the experiments in a tube-arrest apparatus, Xu et al. Xu et al. (2021) proposed the onset criteria of large cavitation bubbles generated at the close end of the cylindrical tube. They found that the large cylindrical bubbles collapse at a finite speed, and the collapse time can be estimated by a newly established Rayleigh-type model.
In addition, due to the propagation of the rarefaction waves along the pipeline, large transient cavitation bubbles may appear not only at the quick-closing valve, but also at locations away from the valve Sharp (1960); Bergant and Simpson (1999); Adamkowski and Lewandowski (2012). The characteristics of the large cavitation bubbles generated in the bulk liquid in the middle of the tube remain unclear and deserve our further investigation.
In this paper, we systematically study the dynamics of the large cavitation bubbles in the tubes with different conical-frustum shaped closed ends using the similar tube-arrest method described in Xu et al. Xu et al. (2021). We observe cavitation bubbles generated both at the closed end and in the bulk liquid of the tubes. For the bubbles generated at the closed end of the tube, we propose a universal model for tubes with different cone angles, to describe the onset criteria and dynamics of large cavitation bubbles. For the large bubbles generated in the bulk liquid, we observe the jetting phenomenon of collapsing bubbles, and further investigate the jet characteristics and the pressure impulse resulting from the bubble collapse. The flow focusing effects in the conical geometry accelerate the bubble collapse and the jet, potentially leading to more damage to the structures.
II Experimental Setup
In the current research, the modified tube-arrest setup, adapted from previous work by Xu et al. (see also Fig. 1) Xu et al. (2021), was used to generate and study the cavitation behaviour. An acrylic tube with a conical-frustum shaped closed end filled with deionized water is driven upwards by stepping on the actuator until the tube hits the bottom of the stopper, where buffer material is attached. After the impact, the tube is arrested by the buffer while the liquid column continues moving upwards due to inertia. Cavitation bubbles may thus be induced when the tension in the liquid exceeds the tensile strength.
A high-speed camera (Phantom V711, Vision Research, USA) was used to record the cavitation bubbles with a frame rate of 20,000 fps and an exposure time of 10 s. An LED light with a diffuser was used for illumination. The tube acceleration upon impact was measured by an accelerometer (357B03, PCB, USA) attached on the top of the tube sampling at 102,400 Hz with the uncertainty of 2. The accelerometer and the high-speed camera were triggered synchronously by a delay generator (9524, Quantum composers, USA). The displacement of the tube and the bubble length were measured from the calibrated high speed images. The tube impact velocity was adjusted by how hard one steps on the actuator, and is calculated by linear regression of the displacement of the tube ms before impact, with an uncertainty of 0.03 m/s. In this setup, the tube acceleration upon impact was decoupled from the tube impact velocity , by alternating the materials of the buffer (e.g., rubber, plastic board, marble, and ceramic tile) and thicknesses. The resulting and lay in the range of 0.29 – 2.67 m/s and 88 – 2048 , respectively, in our experiments.
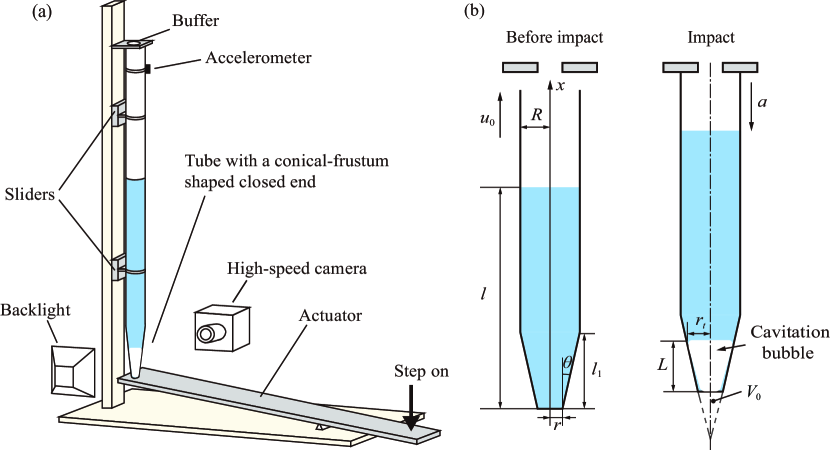
In order to investigate the influence of the tube geometry on the cavitation bubble dynamics, we built six tubes with conical-frustum shaped bottoms. The tubes have different half cone angles varying from to , and the parameters are listed in Table 1. Note, corresponds to a straight cylindrical tube. The total length and wall thickness of the tubes are 1.0 m and 3.0 mm, respectively. Considering the length ratio of the conical to cylindrical section of a draft tube, and to avoid excessive tube diameter, is designed to be relatively small compared to the total tube length. In the experiments, the heights of water column were nominally set as 200 mm, 300 mm, 400 mm, 550 mm, and 600 mm. The uncertainties of the tube diameter and liquid column length are 0.1 mm and 1.0 mm, respectively. The measurement error of the bubble length obtained from the images is less than 20 pixels, and 10 pixels in most cases (approximately 1.7 mm in physical dimension).
It should be noted that the effect of potential nucleation sites in the bulk liquid is significant. We machined and polished the conical-frustum section of each tube as a whole, so that the inner surface at the tube bottom is much smoother than the ones used in previous research of Xu et al. Xu et al. (2021). Thus, aside from bubbles generated on the tube bottom, we expect to observe the bubbles originated in the bulk liquid due to the absence of surface nuclei.
| Tube | (mm) | (mm) | (mm) | |
|---|---|---|---|---|
| 1 | 0 | 9.5 | 9.5 | - |
| 2 | 6 | 5.0 | 17.0 | 114.2 |
| 3 | 15 | 5.0 | 17.0 | 44.8 |
| 4 | 30 | 5.0 | 17.0 | 20.8 |
| 5 | 45 | 5.0 | 17.0 | 12.0 |
| 6 | 45 | 2.0 | 24.5 | 22.5 |
III Experimental observations
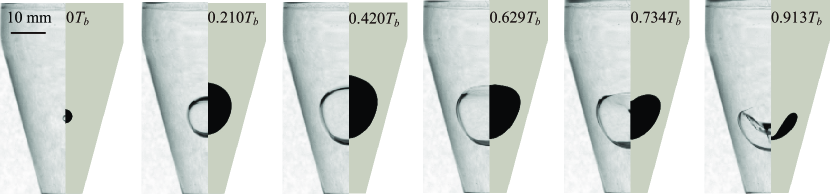
In this section, we will present the experimental results and discuss the onset of the large cavitation bubbles. Figure 2 shows typical high-speed images of cavitation bubbles generated in the conical-frustum shaped tube. In all the cases, the onset of the bubble occurs immediately after the tube is arrested (at time ms). Figures 2(a) and (b) present images of typical evolution of bubbles generated at the tube bottom. In Fig. 2(a) (multimedia view), the bubble firstly undergoes a hemispherical growth (0 – 0.8 ms) until the edge of the bubble contacts the side wall of the tube (at ms). Then the bubble grows mostly in the radial direction along the tube with a slow expansion in the axial direction, to its maximum size (0.8 – 1.3 ms). The bubble’s first collapse occurs afterwards (1.3 – 2.1 ms). In this case, the bubble is small, and the water column separation does not occur during the entire growth and collapse phases of the bubble.
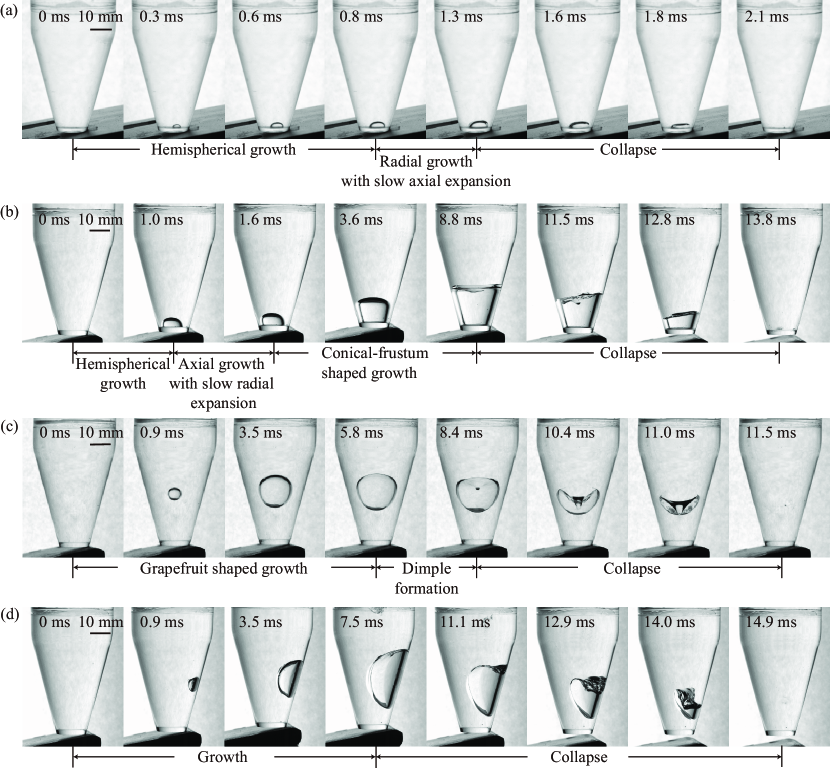
A water column separation case is presented in Fig. 2(b) (multimedia view), where the bubble is much larger than the one showed in Fig. 2(a). The bubble grows in the shape of a hemisphere initially (0 – 1.0 ms). When the bubble approaches the side wall of the tube, the bubble experiences a slow expansion in the radial direction, until the bubble fills up the bottom of the tube (1.0 – 1.6 ms). Afterwards, it develops into a conical-frustum shape, featuring a full water column separation, and continues to grow to its maximum size due to the geometrical confinement (1.6 – 8.8 ms). The bubble then undergoes its first collapse (8.8 – 13.8 ms).
In order to identify the conditions for the occurrence of water column separation, we hereby define that the bubble generated at the bottom of the tube with maximum length larger than the diameter of the bottom (, as shown in Fig. 2(b)) is a ‘large cavitation bubble’. This is in analogy to the categorization proposed by Xu et al. Xu et al. (2021). In the experiments, we observe that water column separation is almost guaranteed to happen if such a large cavitation bubble appears.
We also include two examples where bubbles are in the bulk liquid (Figs. 2(c) and (d)). When the bubble is originated in the middle of the conical section of the tube as shown in Fig. 2(c) (multimedia view), it develops into a tapered shape as it grows, with a slightly narrowed bottom and a flattened top (0 – 5.8 ms). During its collapse, the top of the bubble deform and forms a dimple at the center (5.8 – 8.4 ms). The dimple cusp then develops into a strong downward-shooting jet (8.4 – 11.5 ms). It should be noted that the jetting phenomenon was rarely seen when the bubble was generated at the tube bottom in our experiments. Figure 2(d) presents the evolution of a bubble originated on or near the side wall surface of the tube (multimedia view). We observe that it grows along the side wall to its maximum size (0 – 7.5 ms), and collapses with complex deformation and jetting (7.5 – 14.9 ms), due to the effects of nearby boundaries.
It is seen that the bubble generated in the bulk liquid in the middle of the tube in Fig. 2(c), with a maximum volume of about , does not induce water column separation. However, it already exceeds the critical volume for large bubbles defined above (i.e., ) if it appeared at the tube bottom, given the half cone angle and the radius of the tube bottom . In fact, in our experiments (, and ), we rarely observe the large cavitation bubbles generated in the bulk liquid separating the liquid column, because the bubbles in the middle of the tube are more difficult to fill the whole space under the same conditions.
Therefore, the discussion on the liquid column separation in the following sections, we will focus on the bubbles generated at the bottom of the tube. Since it is well known that the cavitation bubble collapse near a solid boundary can induce high pressure pulses and cause potential damage to the wall Benjamin and Ellis (1966); Philipp and Lauterborn (1998), some discussions on the mechanism and characteristics of large bubbles generated in the bulk liquid (as exemplified in Fig. 2(c)) are useful, and are provided in Section V.
IV Large bubbles at tube bottom
Now we investigate the onset criteria of large cavitation bubbles generated at the bottom. Here, “large” is quantified by the bubble length, which is long enough to yield liquid column separation in a tube (adapted from Xu et al. (2021)). The onset criteria consist of two simultaneous conditions: i) cavitation bubble occurs, and ii) the cavitation bubble can grow to a large size (i.e., ). We hereby show that these two requirements can be described by two independent non-dimensional parameters.
The first parameter shall dictate the criteria of cavitation onset. Recall that Pan et al. Pan et al. (2017) proposed a cavitation number describing the onset criteria in a straight cylindrical tube in transient scenarios, where the influence of liquid acceleration on pressure variation is much greater than that of the flow velocity. The cavitation number was developed based on linear and one-dimensional simplifications, which may fail for complex geometries. Thus, we attempt to derive a universal expression for tubes with varying cross-sectional areas.
First, we discuss the influence of the viscosity on liquid motion. As analyzed in Onuki et al. Onuki, Oi, and Tagawa (2018) and Xu et al. Xu et al. (2021), the thickness of the boundary layer at the side wall of the tube can be estimated as , where is the kinematic viscosity of the fluid and . Given that , m/s, and m, . The thickness of the boundary layer is negligible compared with the tube radius. Moreover, for most cases in our experiments, the interface between the liquid and the bubble generated at the tube bottom remains flat but not quadratic during the collapse, as illustrated in Fig. 2(b). This indicates a uniform velocity distribution in the liquid along the radial direction. Thus we can neglect the viscosity and apply a quasi-one-dimensional model in the following discussion.
Ignoring the liquid viscosity, the quasi-one-dimensional Euler equation of the liquid along the longitudinal direction () of the tube is
| (1) |
where is the density of the liquid, is the cross-sectional area of the tube at different , and is the liquid acceleration upon impact. Integrating Eq. (1) along -direction from the free surface to the bottom of the liquid column gives
| (2) |
where and are respectively the atmospheric pressure and the pressure at the bottom of the column; and are the area of free surface and the bottom of the tube, respectively, and is the volume of the liquid column. Note that the liquid acceleration is approximated by the tube acceleration upon impact in the equation. The justification of this approximation can be referred to Xu et al. Xu et al. (2021). Although the pure water can withstand tension, water in our “dirty” experimental system cannot, so the cavitation tends to occur when ( is the saturated vapor pressure). We then define a non-dimensional number
and suggests that cavitation is likely to occur. Since and , can be simplified as
| (3) |
For a straight cylindrical tube, Eq. (3) readily reduces to where is the length of the liquid column, and is identical to the result proposed in Pan et al. Pan et al. (2017).
.
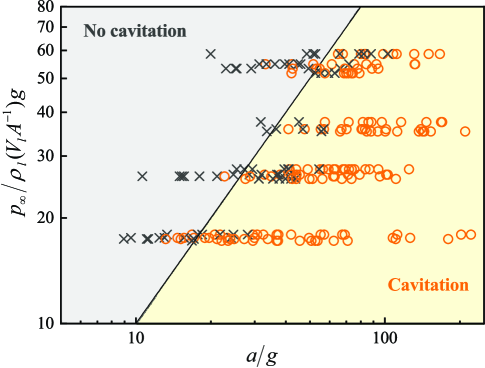
The experimental validation of Eq. (3) with different , ranging from 176 mm to 600 mm, is presented in Fig. 3. More specifically, we set the length of the liquid column 200 mm, 300 mm, 400 mm, and 600 mm in tubes with different half cone angles (), and suppose Pa and at room temperature. In the current research, we detect the cavitation occurrence by observing bubbles equal to or larger than 1 pixel ( mm) in the high-speed images. As shown in Fig. 3, the orange symbols indicating cavitation onset are mainly distributed in the lower right region (), and grey symbols indicating no cavitation cases are mostly clustered in the upper left region (). It is seen that the onset of transient cavitation in the tube can be well predicted by with different conical-frustum shaped closed ends. According to Eq. (3), we know that is proportional to the sectional area and inversely proportional to the volume of the liquid column as well as the acceleration . Thus, for a transient process encountered in engineering scenarios (e.g., rapid closing of valves), to avoid cavitation onset, it is favorable to have a short and thick tube, and a moderate valve closing process for mild liquid acceleration.
The second non-dimensional parameter is derived by evaluating the volume of the cavitation bubbles generated in the transient process. In the experiments, the kinetic energy of the liquid column before the tube collides with the buffer, where is the volume of the liquid column. The liquid velocity can be approximated by the tube impact velocity Xu et al. (2021). After collision, cavitation bubble(s) begins to grow near the bottom of the tube. The velocity of liquid then approaches zero when the bubble(s) reaches the maximum volume . The corresponding potential energy of the bubble(s) can be evaluated as , given that . Neglecting energy losses during this process (e.g., due to liquid viscosity) and equating the initial liquid kinematic energy and the potential energy stored in the cavitation bubble, the normalized maximum bubble(s) volume can be evaluated as
| (4) |
where is the classical cavitation number, whose velocity scale refers to the steady motion of the liquid before the collision of the tube on buffer. For a straight cylindrical tube, Eq. (4) can be simplified as the same expression in Xu et al. Xu et al. (2021)
where is the length of the water column. Note, although the transient cavitation onset is caused by a large liquid acceleration , the maximum volume of the bubbles is irrelevant to . Instead, it is mainly determined by the initial velocity of the flow and the volume of the liquid column.
Now we investigate the maximum bubble length of the conical-frustum shaped bubble on the tube bottom. The maximum bubble volume , where is the radius of the top of the bubble. Rearranging the espression of , a new non-dimensional number can be defined as
| (5) |
for , where , is the volume of the virtual conical end indicated in Fig. 1(b), and is the volume of the water column. This parameter is determined by the classical cavitation number , the half cone angle , the radius of the bottom of the tube , and the volume of the water . Recall that the water column separation is almost guaranteed to occur when , so is the onset criterion of a large bubble originated at the bottom of the tube. In the limit of , i.e., for a straight cylindrical tube, Eq. (5) approaches the same expression in Xu et al. Xu et al. (2021) as below
| (6) |
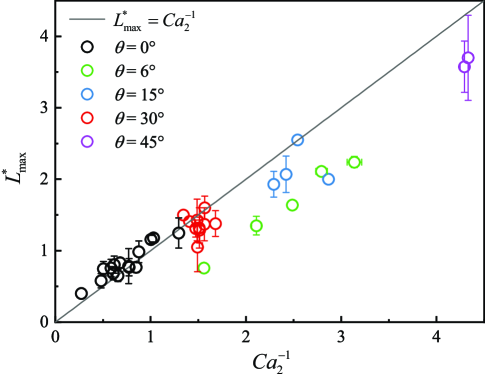
The dependence of on the cavitation number (i.e., Eq. (5) and Eq. (6)) is validated in Fig. 4 against the experimental results from tubes with different . We have to point out that this bubble length relation holds only for conical-frustum shaped bubbles generated at the bottom of the tube (as in Figs. 2(a) and (b)), and is not suitable for bubbles in the bulk liquid (as in Figs. 2(c) and (d)).
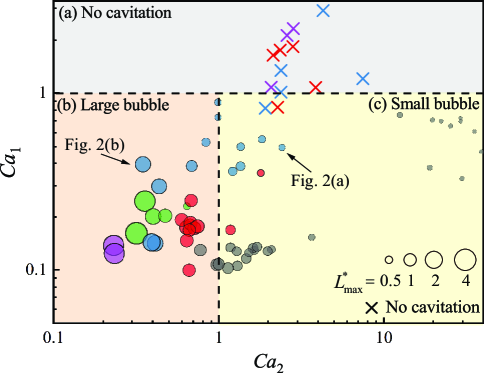
The criteria discussed above for tubes with different are validated against the experimental data on the vs diagram, as shown in Fig. 5. It is seen that the diagram is divided into three regimes by and . First, we observe that almost all the cases with no cavitation are distributed in the region (Regime (a)). Then the region is further divided into two sub-domains (b) and (c). In Regime (b), i.e., and , we observe the occurrence of large cavitation bubbles (), and the water column separation phenomena are almost guaranteed to happen. Most events with small cavitation bubbles () are located in regime (c), where and .
Based on the above analysis, the onset of large cavitation bubbles originated at the bottom of the tube requires both (onset threshold for cavitation, small or large) and (threshold for large bubbles) simultaneously. In engineering contexts, this indicates that in order for the transient cavitation to occur in a tube in a hydraulic system, the transient process needs a large enough liquid acceleration (a small ), e.g., caused by a fast closing valve or guide vanes. However, once the cavitation bubbles are generated, whether they can grow to large sizes that induce water column separations, is no longer influenced by the severity of the transient process, but determined by the steady motion of the liquid before the transient process (a small ). Meanwhile, the specific geometry of the tube with a conical-frustum shaped closed end affects the form of both and : increases with the radius at the top of the conical frustum (), and is closely related to the half cone angle and the bottom radius of the conical frustum.
Now we discuss the oscillation period and the collapse speed of the cavitation bubbles that are essential for the estimation of the magnitude of the pressure pulses in the transient processes. In our experiments, it is commonly seen that for the large cavitation bubble originated at the bottom of the tube, it remains almost conical-frustum shaped with a flat vapor-water interface during its collapse, which is helpful in theoretical analysis.
Ignoring the mass diffusion between the gas and liquid phases, and the influence of the boundary layer flow at the side wall of the tube, the continuity equation of the incompressible liquid reads
| (7) |
where and are respectively the inner radius of the straight section of the tube and the radius of the vapor-liquid surface (see Fig. 1(b)), and and are respectively the velocities of the free surface and the vapor-liquid interface. Invoking the axial component of the momentum equation (Eq. (2)), where the liquid viscosity is ignored, we derive a Rayleigh-type equation for the dynamics of the collapse of the conical-frustum shaped bubble:
| (8) |
where is the volume of the liquid column, and is the acceleration of the free surface.
Applying initial conditions and , integrating Eq. (8) gives , which can then be combined with Eq. (7), the bubble length during the collapse stage can be described as
| (9) |
In this equation is the differential form of the cavitation bubble volume . Given initial conditions that and , integration of Eq. (9) leads to
| (10) |
where is the cross-sectional area of the straight section of the tube, and the maximum bubble volume according to Eq. (4).
Here we define the duration from the cavitation bubble at its maximum size to the first collapse as its collapse time . According to Eq. (10),
| (11) |
In the case of a straight cylindrical tube ( and ), Eq. (11) reduces to
which is consistent with the expression in Xu et al. Xu et al. (2021).
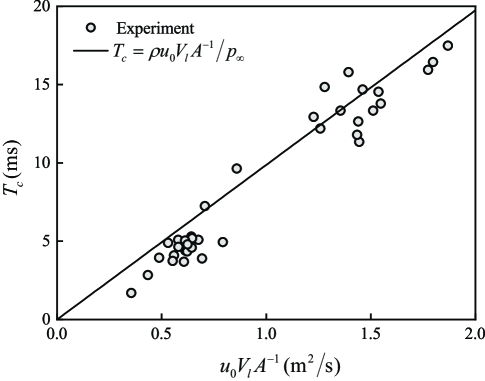
The experimental validation of Eq. (11) is presented in Fig. 6. It is seen that given the liquid density and the atmospheric pressure , the collapse time of a conical-frustum shaped cavitation bubble generated on the tube bottom is determined by the steady flow velocity before the transient process , the volume of the liquid column , and the cross-sectional area of the straight section of the tube. This result is particularly useful in engineering, since the parameters needed for estimating are either geometrical factors of the tube, or bulk flow velocity that can be derived by the volume flow rate going through the tube. In comparison with a classic Rayleigh bubble in an infinite liquid region, whose collapse time is only determined by the maximum bubble size given and , the conical-frustum shaped bubble has a related to the geometric average of and , and the diameter of the tube.
Now we focus on the collapse speed of the cavitation bubble. As analyzed in Xu et al. Xu et al. (2021), the water-hammer pressure generated by the first collapse of the bubble can be estimated as , where is the speed of the sound in water, and is the dimensional collapse speed of the cavitation bubble. According to Eq. (9), we can readily deduce that and estimate the magnitude of the pressure impulse.
To gain further insight into the effect of different tube geometries on the collapse speed, non-dimensional analysis is required. From Eq. (10), noting that where , we can obtain the non-dimensional bubble length
| (12) |
where , and based on Eq. (5). This relation between and indicates that the collapsing dynamics of the conical-frustum shaped cavitation bubble is determined by . For a straight cynlindrical tube with , the limit of Eq. (12) gives the same expression in Xu et al. Xu et al. (2021) as below
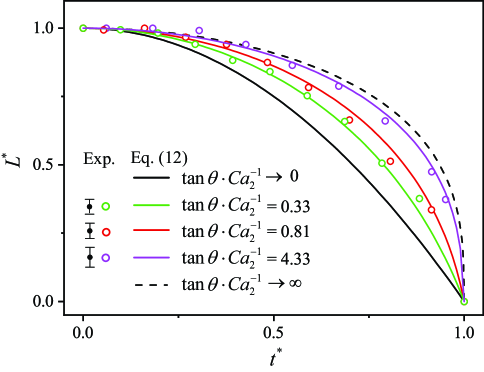
We validate Eq. (12) against experimental results in Fig. 7. It is seen that an increasing results in a larger bubble collapse speed, as theoretically predicted by Eq. (12). Two extreme cases are also presented with theoretical results. The case with a straight cylindrical tube (, hence ) is denoted by the black solid curve in Fig. 7 and is consistent with the validated collapse dynamics in Xu et al. Xu et al. (2021). In the limit of , Eq. (12) gives
which corresponds to the black dashed curve. represents either a hemispherical bubble on an infinite plate in a liquid (), or a conical bubble (). In both scenarios, the collapse speed of the bubble approaches infinity.
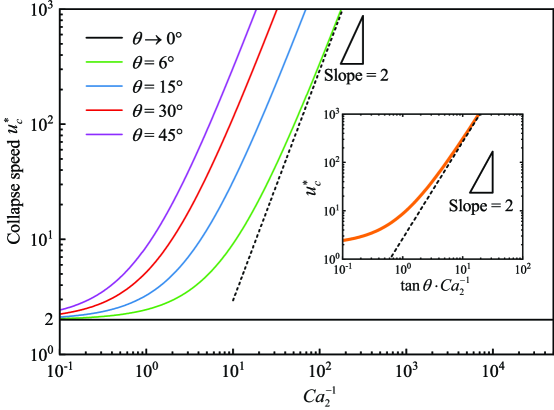
From Eq. (12) we can calculate the non-dimensional bubble collapse speed for
which is plotted in Fig. 8 for several typical values of with various colors.
For a straight cylindrical tube (), and is irrelevant to . When , increases slowly with at moderate values. With a sufficiently large , grows fast, and the versus curves approach asymptotes with the same slope of 2 for different (see the colored lines in Fig. 8), and the larger leads to the earlier fast growth of .
Scaling by , we find that colored lines for different collapse to a universal one (see the thick orange curve in the sub-graph in Fig. 8). This indicates that the non-dimensional bubble collapse speed solely depends on , and is proportional to at large values of . In engineering applications, considering that the pressure pulse at the bubble collapse increases with its collapse speed, we can thus conclude that a large can both reduce the risk of water column separation, and the magnitude of pressure pulse. According to Eq. (5), it is then deduced that increases with the increases of the half cone angle , the steady state liquid velocity before the transient process , and the volume of the liquid column , and the decrease of the radius of the tube bottom . This conclusion is helpful in designing hydraulic components during cavitating transient processes.
V Large bubbles in the bulk liquid
As demonstrated in Section III, large cavitation bubbles can appear both at the bottom of the tube and in the bulk liquid. Regarding to a large bubble initiated in bulk liquid with non-dimensional stand-off distance against the tube bottom ( is the distance between the initial bubble center and the tube bottom, and is the maximum equivalent radius of the bubble), since it grows more freely in both axial and radial directions, a complete liquid column separation is more difficult to occur than a bubble generated at the tube bottom, as exemplified in Fig. 2(c).
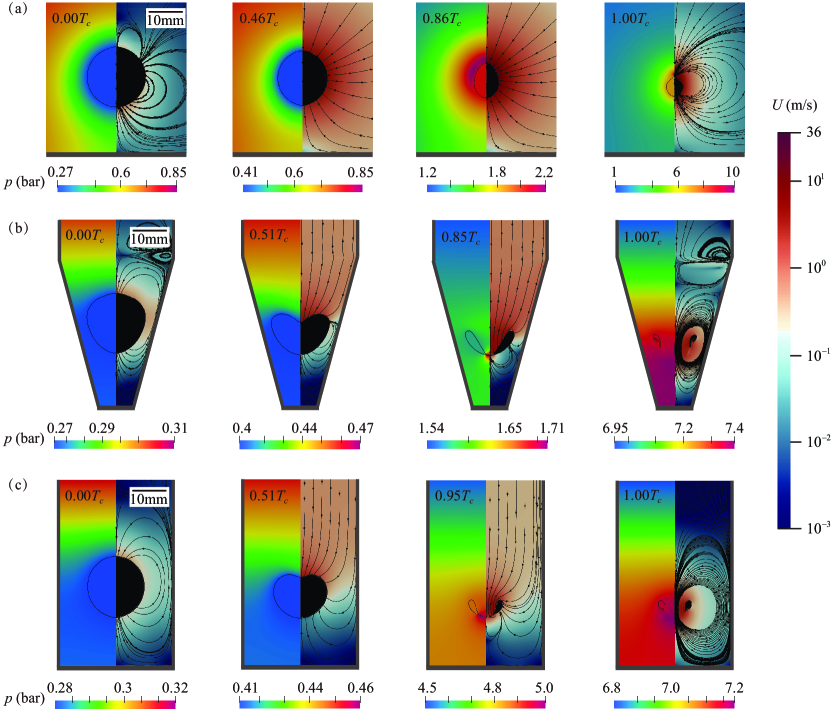
Next, in order to evaluate the damaging power of large cavitation bubbles generated in the bulk liquid in the middle of the tube, we study their dynamics including oscillation periods, jet characteristics and pressure pulses upon collapses. We rely mostly on the numerical simulations for the discussions. The details of the numerical simulations are presented in Appendix A. The numerical technique is firstly validated against the experimental case presented in Fig. 2(c), as shown in Fig. 9. It is seen that the main features of the bubble dynamics during the bubble growth and collapse, especially the bubble deformation and the jetting, match well with the corresponding high-speed images. However, since the adopted numerical approach approximates the evolution of the cavitation bubble with an initially compressed air bubble, and ignores the complex mass transfer by condensation during the bubble collapse, the rebound characteristics of the simulations may deviate from the experimental results Zeng et al. (2018); Wu et al. (2021); Gonzalez-Avila, Denner, and Ohl (2021). We thus focus on the first cycle of bubble expansion and collapse for the following discussions.
To illustrate the influence of the tubes on the dynamics of large bubbles, we first compare three cases, where the bubble locates near an infinite plate, in a straight cylindrical tube, and in a conical-frustum shaped tube section, respectively. The three cavitation bubbles have the same maximum equivalent radius and the same standoff distance from the tube bottom (or the plate), hence . The numerical results are analyzed below.
| Infinite plate () | Conical frustum () | Cylinder () | |
|---|---|---|---|
| (ms) | 1.26 | 7.93 | 7.93 |
| (m/s) | 60.0 | 3.86 | 3.56 |
As summarized in Table 2, the characteristic collapse times of the bubbles in the two tubes ( ms) are much longer than that near the infinite plate ( ms). In fact, when a bubble collapses near a boundary, its collapse time can be theoretically evaluated by modifying Rayleigh equation with a function of Rattray (1951); Plesset and Chapman (1970), and approaches the Rayleigh time of a spherically collapsing bubble determined only by the maximum bubble size as , given the pressure difference and the liquid density . As shown in Fig. 10(a), the flat infinite boundary has relatively limited influence on the dynamics of the bubble during most of the collapse of a bubble with . On the contrary, for large bubbles in the tubes, the tube walls have significant impact on the flow fields even when the boundary of the bubbles are not too close to the bottom of the tubes. Liquids around the bubbles are restricted and the bubbles collapse mostly along the axial direction of the tube, as shown in Fig. 10(b) and (c). Recalling the quasi one-dimensional analysis in Section IV, the collapse times of these bubbles can also be approximated with Eq. 11 and are again determined by not only the maximum bubble sizes, but also the volumes of the liquid columns.
When the bubble in Fig. 2(c) () collapses, its top first flattens and forms a dimple at the center. The dimple then develops into a jet, which eventually penetrates the bottom of the bubble. For such a large bubble in a long tube filled with water, the pressure field anisotropies around the bubble that break its sphericity are attributed to the combined effects of nearby boundaries Benjamin and Ellis (1966); Brennen (1995), gravity Obreschkow et al. (2011), and the asymmetry between the masses of the water column on each side of the bubble Ory et al. (2000). As a result, the jets in the conical and cylindrical tube penetrate the bottom of the bubbles at 0.85 and 0.95 before the first collapse, as shown in Fig. 10(b) and (c). However, the bubble near the plate collapses uniformly during most of the time period of the collapse. A narrow jet is generated until at the end of collapse (as shown in Fig. 10(a)), and grows only significantly in the rebound stage. Therefore, as classified in Ref. Supponen et al. (2016) in term of the occurrence time, the jets in the tubes can be defined as “strong jet” and the jet near the plate is “intermediate” or “weak”. Table 2 also summarizes the maximum jet speed before it penetrates the opposite bubble surface in the three cases. The higher value ( m/s) of the bubble near the plate measures the much larger bubble collapsing velocity, comparing with the finite collapsing velocities of the bubbles in the tubes ( m/s and m/s respectively). The velocity difference between the bubbles in the two tubes indicates that the flow focusing effects in the conical tube section slightly accelerate the downward jet.
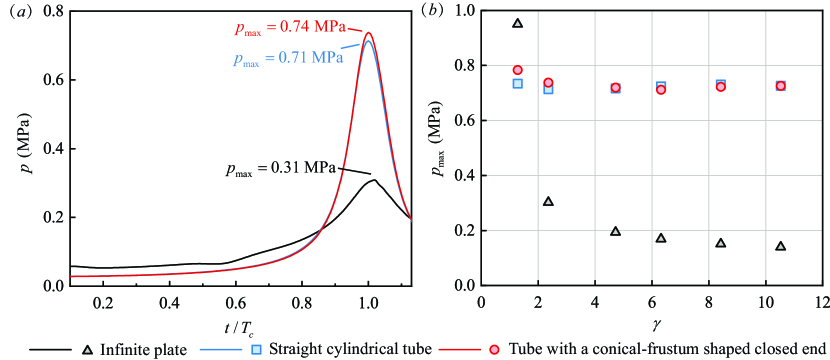
The comparison of the pressure evolution at a pressure monitoring point in the flow field, mm on the symmetry axis in Fig. 12, is shown in Fig. 11(a). The maximum pressure pulse during the bubble collapse can serve as a measure of the damage power to the tube or the plate. It is seen that in all three cases occurs at the moment of the collapse, and that is much higher in tubes (0.74 MPa and 0.71 MPa respectively) than near the plate (0.31 MPa). A large cavitation bubble in a tube exhibits a much stronger damaging ability to the boundaries, and the conical-shaped section further increases its power.
Moreover, the influence of on for the bubbles in three different geometries are investigated. As shown in Fig. 11(b), is compared at six values (1.18, 2.36, 4.72, 6.32, 8.42, and 10.53). For the large range of values covered in the tubes, remains significant. For a bubble very close to a plate, e.g., , it causes rather high pressure resulting from the high-speed jet impacting on the wall surface at collapse. However, when increases, e.g., , the bubble collapse no longer induces substantial pressure increase near the wall. In this sense, a large bubble in a tube is more dangerous as it consistently generates high pressure at the closed end.
VI Conclusions
In the current paper, we investigate the dynamics of large cavitation bubbles generated both at the tube bottom and in the bulk liquid in tubes with conical-frustum shaped closed ends during transient process with the tube-arrest method. Bubbles generated at the tube bottom are more likely to induce full liquid column separation, given the same bubble volume as the ones in the bulk liquid. Thus we focus on the onset criteria of large bubbles for the former cases, and the collapse time, the jet and pressure characteristics for the latter cases.
To evaluate the conditions for the occurrence of cavitation, we modify the results of Pan et al. Pan et al. (2017) in the cylindrical tube during a transient process to include the tube geometric characteristics, and derive a non-dimensional parameter referring to the quasi one-dimensional arguments. To evaluate the maximum size of the bubbles generated at the tube bottom, we derive a more universal non-dimensional parameter considering energy conservation by modifying the criteria described in Ref. Xu et al. (2021). Thus, the onset of large conical-frustum shaped cavitation bubbles generated at tube bottom that induce liquid column separation requires both and , which is validated by systematic experiments based on the tube-arrest approach. We further propose a Rayleigh-type equation to describe the collapse of these bubbles, and reveal that the collapse time is related to both the maximum size of the bubble and the volume of the liquid column . Moreover, the bubble collapse speed increases solely with . Thus, considering alleviating the damage of the cavitation during transient processes in a hydraulic system, it is favorable to have a tube with a small cone angle and a large radius of the tube closed end, a short water column, and a slow steady-state liquid flow in the tube.
For the bubbles generated in the bulk liquid in the middle of the tube, we numerically study their characteristics during collapse. We observe a much stronger jet of bubbles in the tubes, in terms of its time of occurrence, comparing with a bubble near an infinite plate with the same standoff distance from the tube bottom or the plate. The maximum pressure pulse occurs at bubble collapse and remains significant for the large range of values covered in the study. These features indicate that large bubbles generated in the bulk liquid in the middle of the tube are much more damaging than the ones near a plate.
In summary, we conduct systematical studies on large transient cavitation bubbles in a tube, considering the effects of the tube geometry and the bubble location. Our research can provide guidelines in the design and safe operation of hydraulic machinery with complex geometries during the transient processes, for example, the rapid closing of valves or guide vanes in the upstream of the draft tube of a hydraulic turbine.
Supplementary material
See supplementary material for the movie of an example of the cavitation bubble damaging the tube bottom in our experiments.
Acknowledgements.
The work was supported by National Natural Science Foundation of China (No. 52076120 and 52079066), the Academic Research Projects of Beijing Union University (No. ZK90202108), the State Key Laboratory of Hydroscience and Engineering (2019-KY-04, sklhse-2019-E-02, sklhse-2020-E-03 and 2020-KY-01), the Creative Seed Fund of Shanxi Research Institute for Clean Energy, Tsinghua University, and the National Experimental Teaching Demonstration Center for Power Engineering and Engineering Thermophysics, Tsinghua University.Appendix A Details of numerical simulation
The numerical method is adapted from Zeng et al. Zeng et al. (2018), and is briefly introduced below. Simulations are conducted using OpenFOAM. A cavitation bubble is modeled as a non-condensable air bubble starting from a small radius mm with a high internal pressure MPa in the beginning for all our cases.
Ignoring the mass transfer and thermal effects, the flow field is resolved by solving compressible Navier-Stokes equations
where is the fluid density ( is the volume fraction of the liquid phase, and subscripts ‘’ and ‘’ represent respectively liquid and gas phases hereinafter. is the gravitational acceleration. is the source term due to surface tension, which is modelled with the continuous-surface-force (CSF) method. is the viscous stress tensor, in which is the identity tensor and is the dynamic viscosity.
The gas-water interface is captured with the volume-of-fluid (VOF) method Zeng et al. (2018). The transport equation of the volume fraction of the liquid phase reads
where is the velocity field, is the relative velocity between the gas and liquid phases, and for both gas and liquid phases.
The equation of state (EoS) for the liquid is
where and are the reference density and the reference pressure respectively. and are set to be 7.15 and respectively.
For the gas, the adiabatic equation of state is adopted
where is the specific heat ratio and is the reference gas density under reference pressure .
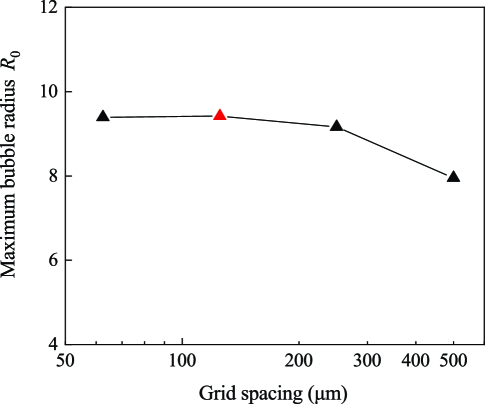
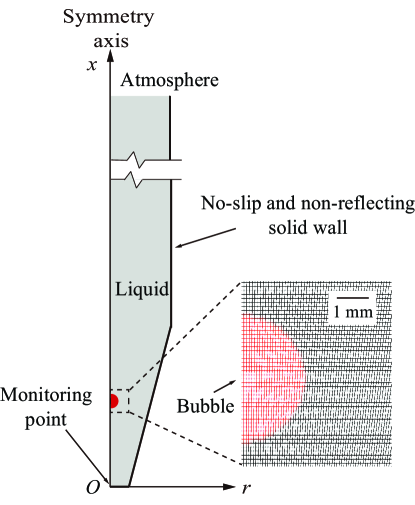
Taking advantage of that the bubble grows and collapses in an axisymmetric fashion as shown in Fig. 2(a)-(c), we define a wedge-shaped ( in circumferential direction) computational domain to reduce the calculation load. The sectional view of the computational domain and the initial mesh system are shown in Fig. 12. For the validation case, the domain is 5 – 17 mm in radial (17 grid points) and 550 mm (550 grid points) in axial directions referring to the experiment. In the area of interest, i.e., where the bubble is located, we specially refine the mesh and perform the grid independence test of the corresponding case in Fig. 2(c). As shown in Fig. 13, the equivalent maximum bubble radius shows good convergence when the grid spacing 250 , and the grid spacing 125 is adopted in our simulation.
A uniform constant atmospheric pressure (101,325 Pa) is imposed on the top boundary (free surface), and no-slip and non-reflecting boundary conditions are used at the rigid boundaries Toro (1997); Trummler et al. (2020). The gravitational acceleration and the surface tension coefficient of the water-air interface are 9.8 and 0.07 N/m respectively. The adjustable time step is chosen to satisfy that the Courant number , where is the size of the mesh.
References
- Nishi and Liu (2013) M. Nishi and S. Liu, “An outlook on the draft-tube-surge study,” Int. J. Fluid Mach. Syst. 6, 33–48 (2013).
- Mishra and Peles (2006) C. Mishra and Y. Peles, “An experimental investigation of hydrodynamic cavitation in micro-venturis,” Phys. Fluids 18, 103603 (2006).
- Barre et al. (2009) S. Barre, J. Rolland, G. Boitel, E. Goncalves, and R. Fortes Patella, “Experiments and modeling of cavitating flows in venturi: attached sheet cavitation,” Eur. J. Mech. B/Fluids 28, 444–464 (2009).
- Zhang et al. (2019) H. Zhang, Z. Zuo, K. A. Mørch, and S. Liu, “Thermodynamic effects on venturi cavitation characteristics,” Phys. Fluids 31, 097107 (2019).
- Bonin (1960) C. Bonin, “Water-hammer damage to oigawa power station,” ASME J. Eng. Power 82, 111 (1960).
- Bergant, Simpson, and Tijsseling (2006) A. Bergant, A. R. Simpson, and A. S. Tijsseling, “Water hammer with column separation: A historical review,” J. Fluids Struct. 22, 135–171 (2006).
- Nonoshita, Matsumoto, and Kubota (1999) T. Nonoshita, H. Matsumoto, Y.and Ohashi, and T. Kubota, “Water column separation in a straight draft tube,” in Proceedings of the Third ASME-JSME Joint Fluids Engineering Conference (San Francisco, USA, 1999).
- Pejovic, Karney, and Zhang (2004) S. Pejovic, B. Karney, and Q. Zhang, “Water column separation in long tailrace tunnel,” in Hydroturbo 2004, International Conference on Hydro-Power Engineering (Brno, Czech Republic, 2004) pp. 18–22.
- Pejovic, Karney, and Gajic (2011) S. Pejovic, B. Karney, and A. Gajic, “Analysis of pump-turbine s instability and reverse waterhammer incidents in hydropower systems,” in 4th International Meeting on Cavitation and Dynamic Problems in Hydraulic Machinery Systems (Belgrade, Serbia, 2011).
- Zhang et al. (2016) X. Zhang, Y. Cheng, L. Xia, and J. Yang, “CFD simulation of reverse water-hammer induced by collapse of draft-tube cavity in a model pump-turbine during runaway process,” IOP Conf. 49, 052017 (2016).
- He et al. (2022) X. He, J. Yang, J. Yang, J. Hu, and T. Peng, “Experimental study of cavitating vortex rope and water column separation in a pump turbine,” Phys. Fluids 34, 044101 (2022).
- Sharp (1960) B. B. Sharp, “Cavity formation in simple pipes due to rupture of the water column,” Nature 185, 302–303 (1960).
- Simpson and Wylie (1991) A. R. Simpson and E. B. Wylie, “Large water-hammer pressures for column separation in pipelines,” ASCE J. Hydraul. Eng. 117, 1310–1316 (1991).
- Brunone, Golia, and Greco (1991) B. Brunone, U. Golia, and M. Greco, “Modelling of fast transients by numerical methods,” in Proceedings of the International Meeting on Hydraulic Transients with Column Separation (Valencia, Spain, 1991) pp. 215–222.
- Bergant and Simpson (1999) A. Bergant and A. R. Simpson, “Pipeline column separation flow regimes,” ASCE J. Hydraul. Eng. 125, 835–848 (1999).
- Adamkowski and Lewandowski (2012) A. Adamkowski and M. Lewandowski, “Investigation of hydraulic transients in a pipeline with column separation,” ASCE J. Hydrual. ENG. 138, 935–944 (2012).
- Adamkowski and Lewandowski (2015) A. Adamkowski and M. Lewandowski, “Cavitation characteristics of shutoff valves in numerical modeling of transients in pipelines with column separation,” ASCE J. Hydraul. Eng. 141, 04014077 (2015).
- Daily et al. (2014) J. Daily, J. Pendlebury, K. Langley, R. Hurd, S. Thomson, and T. Truscott, “Catastrophic cracking courtesy of quiescent cavitation,” Phys. Fluids 26, 091107 (2014).
- Chesterman (1952) W. D. Chesterman, “The dynamics of small transient cavities,” Proc. Phys. Soc. B 65, 846–858 (1952).
- Chen and Wang (2004) Q. Chen and L. Wang, “Production of large size single transient cavitation bubbles with tube arrest method,” Chin. Phys. 13, 564 (2004).
- Xu et al. (2021) P. Xu, S. Liu, Z. Zuo, and Z. Pan, “On the criteria of large cavitation bubbles in a tube during a transient process,” J. Fluid Mech. 913, R6 (2021).
- Benjamin and Ellis (1966) T. B. Benjamin and A. T. Ellis, “The collapse of cavitation bubbles and the pressures thereby produced against solid boundaries,” Phil. Trans. R. Soc. Lond. A 260, 221–240 (1966).
- Philipp and Lauterborn (1998) A. Philipp and W. Lauterborn, “Cavitation erosion by single laser-produced bubbles,” J. Fluid Mech. 361, 75–116 (1998).
- Pan et al. (2017) Z. Pan, A. Kiyama, Y. Tagawa, D. J. Daily, and T. T. Truscott, “Cavitation onset caused by acceleration,” Proc. Natl Acad. Sci. USA 114, 8470–8474 (2017).
- Onuki, Oi, and Tagawa (2018) H. Onuki, Y. Oi, and Y. Tagawa, “Microjet generator for highly viscous fluids,” Phys. Rev. Applied 9, 014035 (2018).
- Zeng et al. (2018) Q. Zeng, S. R. Gonzalez-Avila, R. Dijkink, P. Koukouvinis, M. Gavaises, and C.-D. Ohl, “Wall shear stress from jetting caivtation bubbles,” J. Fluid Mech. 846, 341–355 (2018).
- Wu et al. (2021) S. Wu, B. Li, Z. Zuo, and S. Liu, “Dynamics of a single free-settling spherical particle driven by a laser-induced bubble near a rigid boundary,” Phys. Rev. Fluids 6, 093602 (2021).
- Gonzalez-Avila, Denner, and Ohl (2021) S. R. Gonzalez-Avila, F. Denner, and C.-D. Ohl, “The acoustic pressure generated by the cavitation bubble expansion and collapse near a rigid wall,” Phys. Fluids 33, 032118 (2021).
- Rattray (1951) M. Rattray, Perturbation Effects in Cavitation Bubble Dynamics, Ph.D. thesis, California Institute of Technology (1951).
- Plesset and Chapman (1970) M. S. Plesset and R. B. Chapman, “Collapse of an initially spherical vapour cavity in the neighbourhood of a solid boundary,” J. Fluids Mech. 47, 283–290 (1970).
- Brennen (1995) C. E. Brennen, Cavitation and Bubble Dynamics (Oxford University Press, 1995).
- Obreschkow et al. (2011) D. Obreschkow, M. Tinguely, N. Dorsaz, P. Kobel, A. de Bosset, and M. Farhat, “Universal scaling law for jets of collapsing bubbles,” Phys. Rev. Lett. 107, 204501 (2011).
- Ory et al. (2000) E. Ory, H. Yuan, A. Prosperetti, S. Popinet, and S. Zaleski, “Growth and collapse of a vapor bubble in a narrow tube,” Phys. Fluids 12, 1268–1277 (2000).
- Supponen et al. (2016) O. Supponen, D. Obreschkow, M. Tinguely, P. Kobel, N. Dorsaz, and M. Farhat, “Scaling laws for jets of single cavitation bubbles,” J. Fluids Mech. 802, 263–293 (2016).
- Toro (1997) E. F. Toro, Riemann Solvers and Numerical Methods for Fluid Dynamics (Springer Berlin Heidelberg, 1997).
- Trummler et al. (2020) T. Trummler, S. H. Bryngelson, K. Schmidmayer, S. J. Schmidt, T. Colonius, and N. A. Adams, “Near-surface dynamics of a gas bubble collapsing above a crevice,” J. Fluid Mech. 899, A16 (2020).