Enhancement of superconductivity and its relation to lattice expansion in InTe
Abstract
The quest to govern the driving forces behind superconductivity and gain control over the superconducting transition temperature is as old as the phenomenon itself. Microscopically, this requires a proper understanding of the evolution of electron-lattice interactions in their parameter space. We report such a controlled study on in InxTe via fine-tuning the In stoichiometry . We find that increasing from 0.84 to 1 results in an enhancement of from 1.3 K to 3.5 K accompanied by an increase of the electron-phonon coupling constant from 0.45 to 0.63. Employing first-principles calculations, we show that this behavior is driven by two factors, each taking the dominant role depending on . For , the major role is played by the density of electronic states at the Fermi level. Above , the change in the density of states flattens while the enhancement of continues. We attribute this to a systematic softening of lattice vibrations, amplifying the electron-phonon coupling, and hence, .
I Introduction
Superconductivity has been the subject of continuous research since its discovery more than a century ago in 1911 by Kammerling-Onnes [1]. Despite its long history, the question of what governs and how to control the superconducting transition temperature is still a tempting issue. Even in conventional Bardeen-Cooper-Schrieffer (BCS) superconductors, while seemingly well understood theoretically, there are various strategies how to enhance discussed in the literature. According to the BCS theory [2], larger values are expected for enhanced phonon frequencies involved in Cooper pairing, an enhanced density of states (DOS) at the Fermi level , and an increased electron-phonon interaction. Soon after, Anderson pointed out that in conventional superconductors is barely affected by nonmagnetic impurity scattering and weak disorder [3]. Nevertheless, there are theoretical works where such imperfections are discussed to bear the potential to enhance [4, 5]. Also, the valence-skipping feature of some elements is considered to be capable of improving the superconducting pairing interaction via the so-called negative- mechanism, as pointed out by Varma [6, 7]. Doping is one common approach to exploit these mechanisms, which all work within a BCS framework. Another versatile way to control is by applying physical pressure , which may enhance or suppress , depending on the particular system. Physical pressure is an experimental tool to manipulate solely the unit-cell volume without introducing disorder into the system, which was already phenomenologically discussed by Matthias and others in the 1950s [8, 9]: Arguably, an expanded lattice is often in favor of yielding larger values as compared to compressed lattices.
Against this background, cubic InTe is an interesting superconductor: In is one of these valence-skipping elements found in the periodic table. At first glance, it should take its divalent state here, given the strong electron affinity of Te which tends to be in its state. However, In2+ is energetically unstable [10, 7, 11, 12] and usually takes its or state. A direct correlation between changes in and the In content in InxTe was reported in the past but only phenomenologically explained in terms of a changing ratio of In1+ and In3+ ions with [10, 13]. As reported recently [12], the overall In valence state is likely to be close to in InTe.
In this paper, to elucidate the microscopic mechanism that governs , we vary the In concentration in InxTe. This enables a very fine-tuned and systematic control of from around 1.3 K to about 3.5 K. This composition control allows to study the interrelation of DOS, phonon frequencies, electron-phonon interaction, and lattice expansion by simply changing . Here, we observe an interesting crossover in the nature of the superconductivity around where has increased to about 2.2 K: Initially this enhancement can be traced back to a concomitant increase of DOS with as it is often seen in conventional superconductors. However, above , the DOS enhancement becomes gradual and, hence, solely DOS-based arguments cannot explain the observed continued enhancement of up to . The only material parameter which keeps changing is the cubic InTe lattice constant , as presented in Fig. 1(b). This suggests that the lattice expansion is dominant for the enhancement for in InxTe. For this In concentration range , we develop a simple model with the cubic lattice parameter as only variable. It successfully reproduces qualitatively and quantitatively the experimental evolution of DOS, electron-phonon coupling constant , and with . A lattice-expansion-induced enhancement of the electron-phonon coupling strength is proposed to be responsible for the observed enhancement of in this range.
This paper is organized as follows: After summarizing the experimental and computational methods in the next Section II, we present experimental results in Section III. Our theoretical model is introduced in Section IV. In Section V, theoretical and experimental results for are compared and we discuss possible origins of the continuous enhancement of and its fine-tuned controllability via the composition ratio. We conclude with summarizing this work. Additional data and discussions are provided in the accompanying Supplemental Materials (SM) [14].
II Experimental and Computational Methods
InxTe batches with were grown by melting stoichiometric amounts of In and Te shots in evacuated quartz glass tubes at 950∘C for 24 – 48 h, and subsequently quenching into water. The resulting tetragonal InTe material was ground again and approximately 400 mg powder of each batch were used for high-pressure synthesis (5 GPa, 600∘C, 1 h) to obtain the metastable superconducting phase of InTe with cubic structure at ambient conditions.
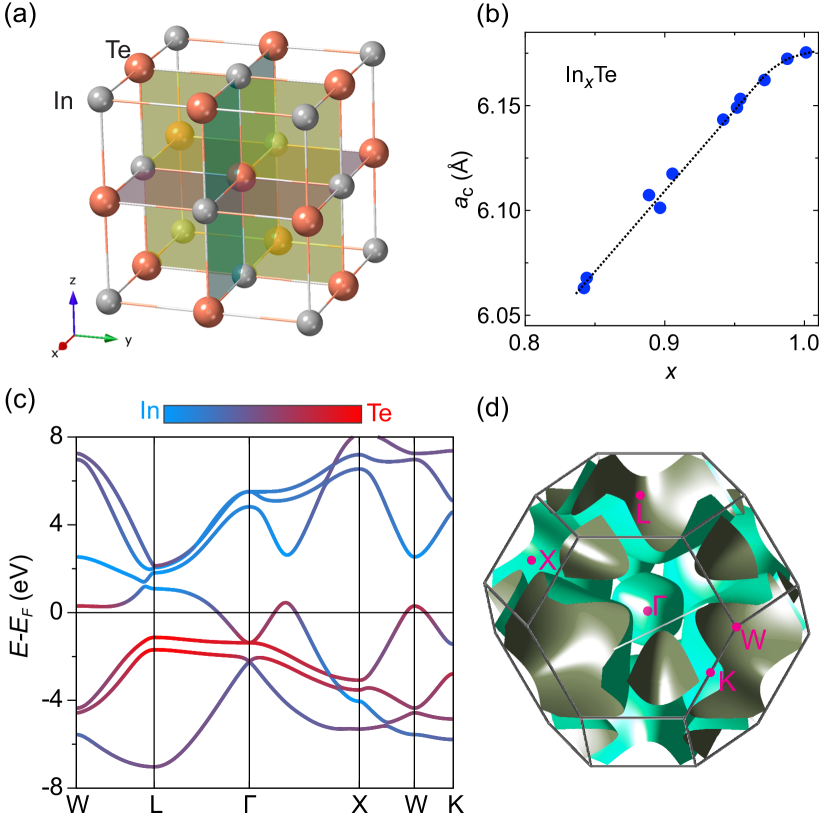
X-ray diffraction patterns were taken on these batches with an in-house x-ray diffractometer (Rigaku). All batches with were found to be single-phase cubic InTe (space group 225; ) with sharp reflection peaks, see Figs. S1 and S2 in [14]. Estimated cubic lattice constants are plotted against in Fig. 1(b), exhibiting a linear variation with a saturation tendency when approaching . Only for the lowest In concentration very tiny impurity peaks are seen, possibly indicating the start of the formation of other phases. To further check this, we also made one test specimen with , where these and additional impurity peaks are more pronounced. This apparently indicates the lower border of stability of cubic InxTe, which seems also reflected in a slight broadening of the peak widths, cf. Section S1 in [14] for a brief discussion. One might also suspect that reducing the In content in InxTe causes antisite defects. However, a careful analysis of our XRD data shows that even for large In deficiency, Te remains on its regular lattice sites without forming antisite defects down to , see Fig. S3 in [14].
The In concentration of all batches was checked by inductively coupled plasma atomic-emission spectroscopy (ICP-AES) chemical analyses. The results are close to the nominal values, cf. Section S2 in [14]. Throughout the paper, the ICP results are used when referring to samples.
The superconducting critical temperatures of all samples were determined by temperature-dependent magnetization measurements (magnetic property measurement system MPMS3 equipped with a 3He insert, Quantum Design). Data were taken upon heating in G after zero-field cooling to the base temperature. All samples exhibit sharp single superconducting transitions. The shielding fractions were roughly corrected for the demagnetization effect according to Ref. [15]. Our data suggest large superconducting phase fractions close to 100%. In magnetization measurements, is defined as the intersection of a linear extrapolation of the transition in with the normal-state signal, cf. Section S3 in [14].
Resistivity and specific heat were measured on selected samples by a standard four-probe technique and relaxation method, respectively (physical property measurement system PPMS equipped with a 3He insert, Quantum Design). In these measurements, is either defined as the temperature at which the resistivity drops to zero, or as midpoint of the superconducting transition in the electronic specific heat divided by temperature , cf. Section S4 in [14]. Measurements of the resistivity under hydrostatic pressure up to approximately 2.25 GPa were performed with a clamp-type pressure cell mounted to a PPMS sample puck (pressure cell HPC-33, ElectroLab Corporation, pressure medium: Daphne 7373 oil). The applied pressure was determined from the suppression of the superconducting of a simultaneously measured Pb standard sample.
The electronic and vibrational properties of InTe were calculated within density functional theory [16] using Perdew-Burke-Ernzerhof exchange-correlation functional [17] and ultrasoft pseudo-potentials as implemented in the Quantum Espresso program package [18, 19, 20]. The plane-wave cut-off energy was set to 35 Ry. The relativistic effects, including spin-orbit coupling, were fully considered. An fcc lattice with a variable lattice constant was chosen for InTe. The corresponding Brillouin zone (BZ) was sampled by a 242424 -mesh. The phonon modes, Eliashberg spectral function , and electron-phonon coupling constant were computed using density-functional perturbation theory employing a -mesh. The calculation of the superconducting transition temperature was done by means of Mc-Millan’s equation modified by Allen and Dynes [21, 22] using the screened Coulomb potential .
III Results
A schematic plot of the face-centered cubic structure of superconducting InTe is shown in Fig. 1(a) [23, 24]. Each Te is octahedrally coordinated with six In ions as its first-nearest neighbors (1NN). The second-nearest neighbors are twelve Te ions, forming cuboctahedral coordination. Te as an anion needs two electrons to complete its shell. The In cations can afford to transfer one electron to their 1NN [12]. To satisfy this situation, hybridization takes place and InTe forms a metallic band structure with a mixed ionic character at and near the Fermi level , cf. Fig. 1(c). Due to the significant In – Te hybridization, many bands exhibit sizable bonding-antibonding dispersions. Accordingly, this creates several energy valleys, appearing as separated electron and hole pockets in the BZ of InTe as sketched in Fig. 1(d). The only electron pocket is centered at the point, whereas the major hole pockets span the BZ around its L points.
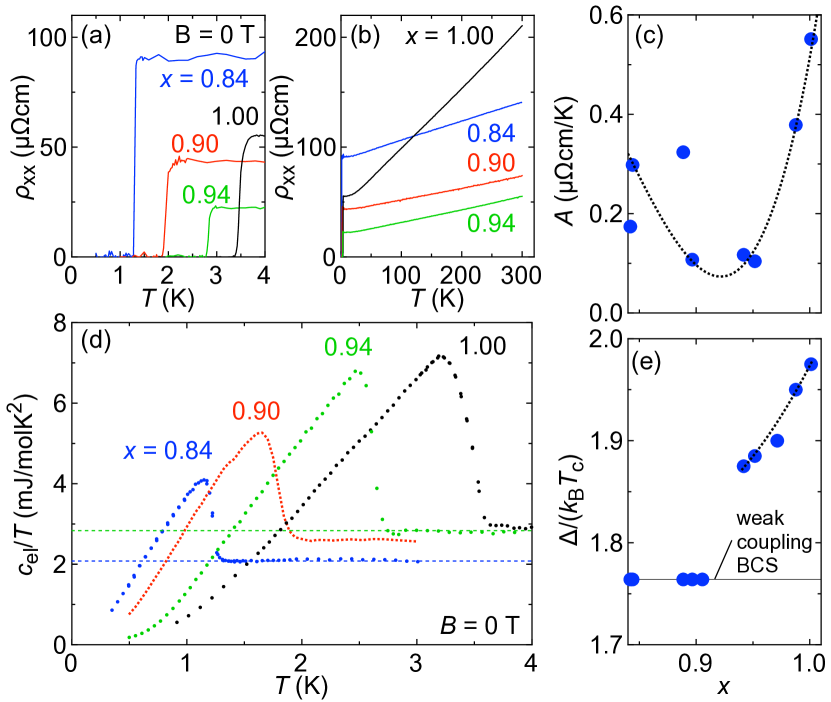
Figure 2 summarizes resistivity and specific-heat data along with fitting results of these quantities on selected samples InxTe with . Resistivity data are presented in Figs. 2(a) and (b) for K and up to room temperature, respectively. We find sharp drops to zero resistivity for all samples examined. In the normal state, all samples exhibit a linear temperature dependence over a wide temperature range K. The -linear slope estimated from fits to the data in this temperature range is plotted as a function of in Fig. 2(c). Although there is some scatter among the data points in the low- region, exhibits a steep increase for , clearly indicating an enhancement of the electron-phonon scattering toward stoichiometric InTe.
Figure 2(d) presents zero-field electronic specific-heat data displayed as vs for K for selected samples. All samples exhibit a clear and sharp jump-like anomaly at , indicating bulk superconductivity in InxTe. The lower and upper dotted horizontal lines represent the normal-state electronic specific-heat coefficient for (blue data) and (green), respectively. Apparently there is a strong enhancement of when increasing the In content from , but this enhancement saturates for . For larger there is no appreciable increase any more. The electronic specific heat is further analyzed in a BCS framework employing the model [25, 26], see Section S4 in [14]. Herein, is a measure of the superconducting coupling strength with the superconducting energy gap (at 0 K), cf. Section S4 in [14] for a detailed description of this approach. Figure 2(e) summarizes . In accord with the observed changes in the slope of the linear resistivity and the flattening of , starts to increase beyond the weak-coupling BCS limit for , reaching almost when approaches . The most striking experimental result here is the clear change in the superconducting response of the system across : , , and increase toward , while saturates, suggesting a change in the dominant ingredients governing the superconductivity in InxTe.
IV Theory
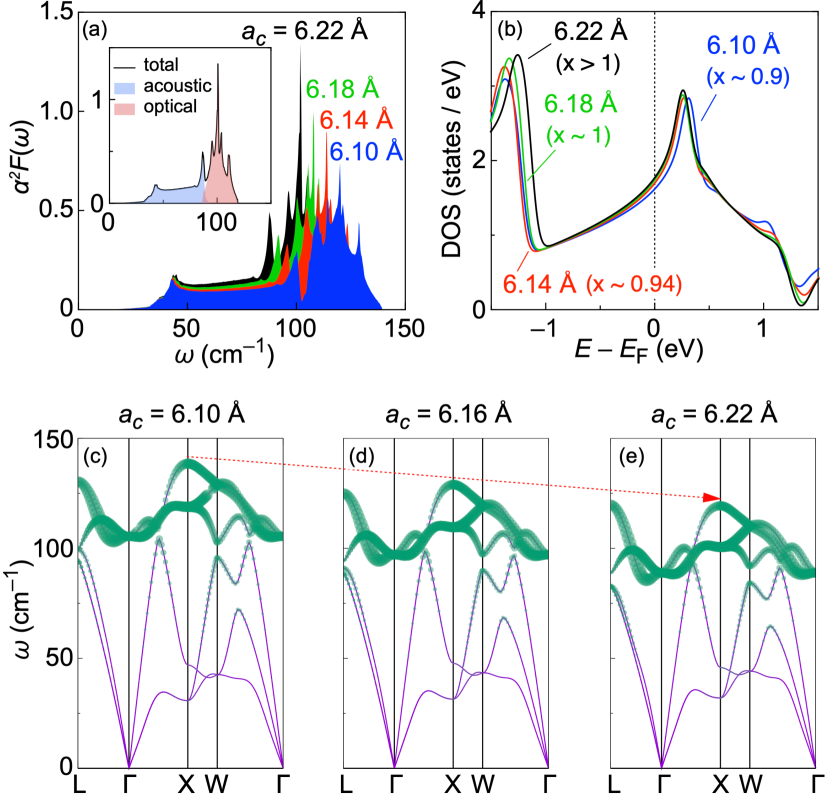
To shed light on this issue, we have developed a mean-field model which successfully reproduces our observations for . The results are summarized in Fig. 3. Starting with Fig. 3(a), we have calculated the Eliashberg function as a function of the phonon frequency for InTe with cubic lattice constants Å (blue), 6.14 Å (red), 6.18 Å (green), and hypothetical 6.22 Å (black), corresponding to , 0.94, 1, and , respectively. The spectral weight of increases with , already suggesting a possible increase in upon expanding the crystal lattice of InxTe, which will become clearer in the next Section. As highlighted in the inset, the optical phonons are the main source of this enhancement. Figure 3(b) shows the calculated electronic DOS data for the same lattice constants.
Figures 3(c) – (e) summarize the calculated energy dispersions of phonon frequencies in InTe for Å, 6.16 Å, and 6.22 Å, respectively. As indicated by the red arrow, the optical phonon frequencies, which are the dominant source of , are strongly softened upon increasing . This points towards a scenario of the superconductivity where the lattice expansion in InxTe may play a significant role.
V Discussion
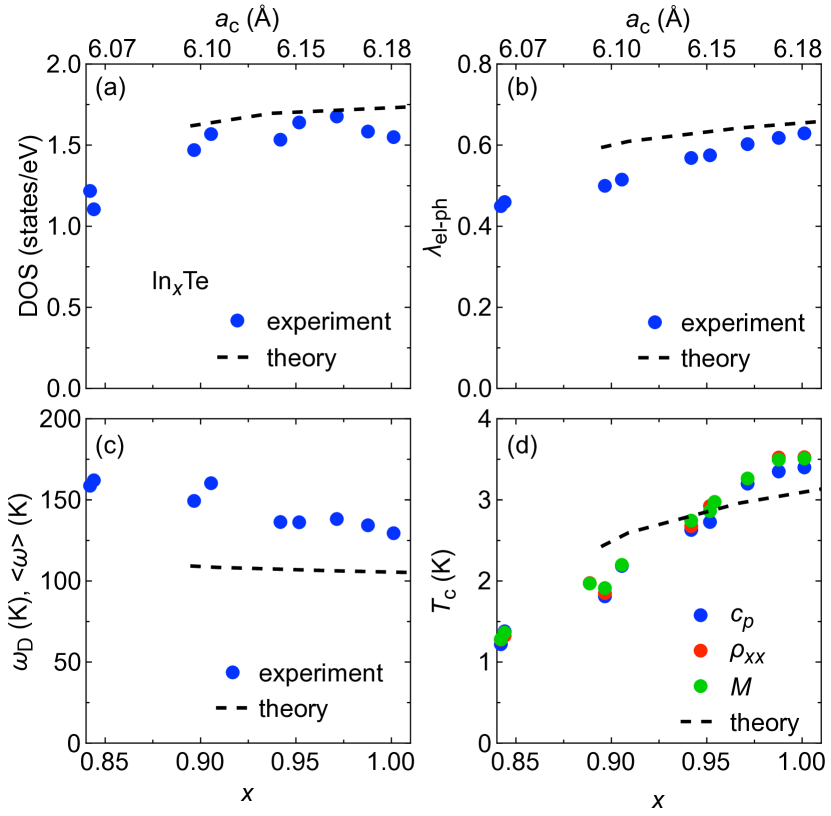
Figure 4 compares experimental and theoretical data of InxTe. Blue data points in all panels are estimated from specific-heat data. Red and green data points in Fig. 4(d) refer to values deduced from resistivity and magnetization data, respectively. The procedure how experimental DOS, , and data were deduced from specific-heat measurements is described in Section S4 in [14]. The theoretical values are calculated as a function of the lattice constant and are plotted in Fig. 4 as black dashed lines against the corresponding In concentration .
Density-of-states data are shown in Fig. 4(a) as a function of . Since theoretical calculations yield the bare DOS without electron-phonon interaction, therein the experimental DOS results are divided by to allow a quantitative comparison. In accordance with the electronic specific-heat data shown in Fig. 2(d), there is an enhancement of DOS upon increasing from 0.84 to 0.92, which amounts to almost states/eV. However, above , the enhancement becomes gradual and DOS seems to saturate. The latter is very well reproduced by our theoretical modeling: the black dashed line is DOS from Fig. 3(b) replotted as a function of , matching well with the experimental data. Figure 4(b) shows the corresponding electron-phonon coupling strength , which increases from 0.45 to 0.63 when varying the In content from to 1.0. The black dotted line therein represents integrated Eliashberg functions [22] shown in Fig. 3(a) which again agrees well with experimental data.
The dependences of the experimental Debye frequency and its theoretical counterpart [22] are given in Fig. 4(c). Experimentally we observe a decrease of with , indicating a softening of the lattice vibrations as suggested by Figs. 3(c) – (e). The negative slope of is reproduced in our model calculations.
Theoretical and experimental values are summarized in Fig. 4(d). For , the smallest K in this study is found [27]. Upon increasing , enhances linearly in accord with Refs. [10, 13]. Close to stoichiometric InTe, the slope decreases and seems to saturate. Again, our theoretical model catches the values for well.
Finally, we will propose a possible scenario of this change in the superconductivity in InxTe. Below , an interpretation of our data in terms of a mainly DOS-driven enhancement of and seems obvious, as suggested by the concomitant increase of DOS with , when comparing Figs. 4(a), (b), and (d). However, above , DOS flattens while and keep increasing. The continuous increase of is ascribed to the softening of phonons in the higher region.
A phenomenological explanation can be given when considering the observed expansion of the cubic lattice with as shown in Fig. 1(b). The lattice expansion is reasonable because more and more voids in the InTe matrix get filled with . The shorter lattice constants at low imply a more rigid lattice than for larger . As a consequence, the electron-phonon interaction is relatively weak at small , and therefore, is small. Upon filling voids in the In sublattice, the crystal lattice expands and atoms are shifted more apart from each other. This allows for an easier vibration of the constituent atoms, leading to softer phonon modes as seen in Figs. 3(c) to (e). This can be regarded as a “negative pressure” effect (lattice expansion) in analogy to the physical pressure effect (lattice contraction). Note that changes in and are induced mainly by DOS changes in conventional cases while these are governed by phonon softening in the present case. A similar phonon-softening induced enhancement of superconductivity is discussed in literature [28].
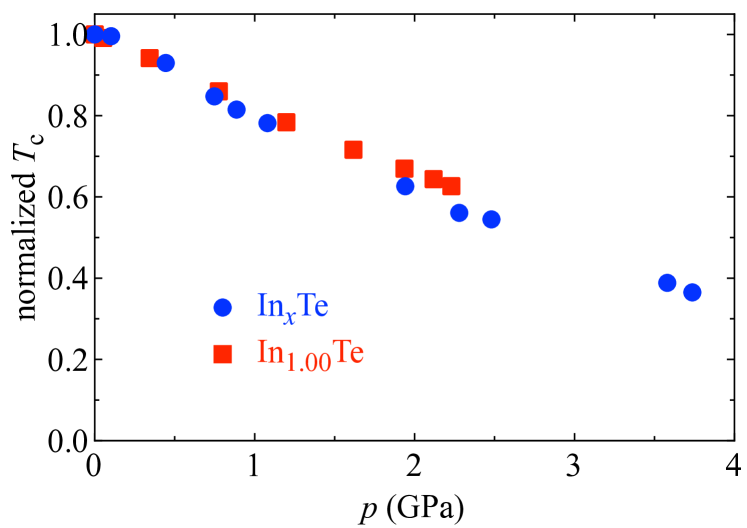
To further test this hypothesis, we converted the “negative pressure” effect into physical pressure, which is shown with blue circle symbols in Fig. 5. The values are normalized with respect to the largest K (for ; all values are from magnetization measurements) and plotted against physical pressure . The latter values are calculated from the change of each sample’s unit-cell volume again with respect to the sample with by using the known bulk modulus [29], cf. Section S5 in [14] for a detailed description of the conversion process. For comparison, we also determined the phyical pressure dependence from resistivity measurements on a sample with . These data are shown with red square symbols in Fig. 5 and are normalized to the ambient-pressure zero-resistance K of this sample, cf. Section S6 in [14]. The agreement between converted and measured is very good and indeed pointing towards a scenario where the lattice expansion plays a significant role.
The total change of in InxTe for corresponds to an applied physical pressure of GPa. To further contextualize this value, a comparison between the case of InxTe and several superconducting elements is shown in Section S5 in [14]. It turns out that InxTe exhibits one of the strongest pressure effects observed in such chemically simple BCS superconductors, emphasizing that the soft lattice in InxTe is indeed in favor of its superconductivity. This may be related to the valence-fluctuation feature of In in the present compound which could be an interesting starting point for future studies.
VI Summary
To summarize, we demonstrate that controlling and fine-tuning superconductivity can be achieved by simply changing the In concentration in InxTe. For , the enhancement of the superconductivity can be straight-forwardly understood as a consequence of an enhanced density of states at the Fermi level. Upon further increasing , this enhancement fades out and the observed continued increase of the superconducting cannot be attributed exclusively to a density-of-states effect any more. Therefore, we modeled this In concentration range theoretically and reproduced well the experimental data of density of states, electron-phonon coupling constant, and superconducting transition temperature for by solely changing the cubic lattice constant. Together with the outcome of our physical pressure experiment, our results suggest that the enhanced superconductivity in this system is closely related to the soft lattice of this simple chalcogenide.
Acknowledgement
This work was partly supported by Grants-In-Aid for Scientific Research (S) from the Japan Society for the Promotion of Science (JSPS, No. 24224009), JST (No. JP16H00924), and PRESTO (JPMJPR15N5) and Grants-In-Aid for Scientific Research (B) (JSPS, No. 17H02770). We thank the RIKEN Materials Characterization Team for compositional analyses. M.K. thanks D. Hashizume, T. Kikitsu, D. Inoue, T. Nakajima, and D. Maryenko for fruitful discussions. M.K. and M.S.B. contributed equally to this work.
References
- Onnes [1911] H. K. Onnes, Further experiments with liquid helium, Communications from the Physical Laboratory of the University of Leiden 124c, 818 (1911).
- Bardeen et al. [1957] J. Bardeen, L. Cooper, and J. Schrieffer, Theory of superconductivity, Phys. Rev. 108, 1175 (1957).
- Anderson [1959] P. Anderson, Theory of dirty superconductors, J. Phys. Chem. Solids 11, 26 (1959).
- Belitz [1987] D. Belitz, Theory of disorder-induced increase and degradation of superconducting , Phys. Rev. B 36, 47 (1987).
- Martin and Phillips [1997] I. Martin and P. Phillips, Local pairing at impurities in BCS superconductors can enhance , Phys. Rev. B 56, 14650 (1997).
- Varma [1988] C. Varma, Missing valence states, diamagnetic insulators, and superconductors, Phys. Rev. Lett. 61, 2713 (1988).
- Hase et al. [2016] I. Hase, K. Yasutomi, T. Yanagisawa, K. Odagiri, and T. Nishio, Electronic structure of InTe, SnAs and PbSb: Valence-skip compound or not?, Physica C 527, 85 (2016).
- Matthias [1953] B. T. Matthias, Transition temperatures of superconductors, Phys. Rev. 92, 874 (1953).
- Rögener [1952] H. Rögener, Zur Supraleitung des Niobnitrids, Z. Phys. 132, 446 (1952).
- Geller et al. [1964] S. Geller, A. Jayaraman, and J. G. W. Hull, Superconductivity and vacancy structures of the pressure-induced NaCl-type phases of the In–Te system, Appl. Phys. Lett. 4, 35 (1964).
- Kriener et al. [2018] M. Kriener, M. Kamitani, T. Koretsune, R. Arita, Y. Taguchi, and Y. Tokura, Tailoring band structure and band filling in a simple cubic (IV, III)–VI superconductor, Phys. Rev. Mater. 2, 044802 (2018).
- Kriener et al. [2020] M. Kriener, M. Sakano, M. Kamitani, M. S. Bahramy, R. Yukawa, K. Horiba, H. Kumigashira, K. Ishizaka, Y. Tokura, and Y. Taguchi, Evolution of Electronic States and Emergence of Superconductivity in the Polar Semiconductor GeTe by Doping Valence-Skipping Indium, Phys. Rev. Lett. 124, 047002 (2020).
- Geller and G. W. Hull [1964] S. Geller and J. G. W. Hull, Superconductivity of Intermetallic Compounds with NaCl-Type and Related Structures, Phys. Rev. Lett. 13, 127 (1964).
- [14] See Supplemental Materials at [URL will be inserted by publisher] for complementing data.
- Brandt [1999] E. H. Brandt, Irreversible magnetization of pin-free type-II superconductors, Phys. Rev. B 60, 11939 (1999).
- Poncé et al. [209] S. Poncé, E. R. Margine, C. Verdi, and F. Giustino, EPW: Electron–phonon coupling, transport and superconducting properties using maximally localized Wannier functions, Comput. Phys. Commun. 116, 2016 (209).
- Perdew et al. [1996] J. P. Perdew, K. Burke, and M. Ernzerhof, Generalized gradient approximation made simple, Phys. Rev. Lett. 77, 3865 (1996).
- Giannozzi et al. [2009] P. Giannozzi, S. Baroni, N. Bonini, M. Calandra, R. Car, C. Cavazzoni, D. Ceresoli, G. L. Chiarotti, M. Cococcioni, I. Dabo, et al., Quantum espresso: a modular and open-source software project for quantum simulations of materials, J. Phys.: Condens. Matter 21, 395502 (2009).
- Giannozzi et al. [2017] P. Giannozzi, O. Andreussi, T. Brumme, O. Bunau, M. B. Nardelli, M. Calandra, R. Car, C. Cavazzoni, D. Ceresoli, M. Cococcioni, et al., Advanced capabilities for materials modelling with quantum espresso, J. Phys.: Condens. Matter 29, 465901 (2017).
- [20] QUANTUM ESPRESSO program package. Version 6.3, (2018), http://www.quantum-espresso.org/.
- McMillan [1968] W. McMillan, Transition temperature of strong-coupled superconductors, Phys. Rev. 167, 331 (1968).
- Allen and Dynes [1975] P. B. Allen and R. C. Dynes, Transition temperature of strong-coupled superconductors reanalyzed, Phys. Rev. B 12, 905 (1975).
- Banus et al. [1963] M. D. Banus, R. E. Hanneman, M. Stroncin, and K. Gooen, High-Pressure Transitions in A(III)B(VI) Compounds: Indium Telluride, Science 142, 662 (1963).
- Bömmel et al. [1963] H. E. Bömmel, A. J. Darnell, W. F. Libby, B. R. Tittmann, and A. J. Yencha, Superconductivity of Metallic Indium Telluride, Science 141, 714 (1963).
- Mühlschlegel [1959] B. Mühlschlegel, Die thermodynamischen Funktionen des Supraleiters, Z. Phys. 155, 313 (1959).
- Padamsee et al. [1973] H. Padamsee, J. Neighbor, and C. Shiffman, Quasiparticle phenomenology for thermodynamics of strong-coupling superconductors, J. Low Temp. Phys. 12, 387 (1973).
- [27] As mentioned in Section II, we also synthesized one sample with a smaller which contains additional minority phases. The of its superconducting main phase fraction is comparable to the of the sample with suggesting that does not further decrease due to the apparent border of stability of cubic InxTe in this range.
- Kudo et al. [2012] K. Kudo, M. Takasuga, Y. Okamoto, Z. Hiroi, and M.Nohara, Giant Phonon Softening and Enhancement of Superconductivity by Phosphorus Doping of BaNi2As2, Phys. Rev. Lett. 109, 097002 (2012).
- Chattopadhyay et al. [1985] T. Chattopadhyay, R. P. Santandrea, and H. G. V. Schnering, Temperature and pressure dependence of the crystal structure of InTe: A new high pressure phase of InTe, J. Phys. Chem. Solids 46, 351 (1985).