Dark matter halo properties of the Galactic dwarf satellites:
implication for chemo-dynamical evolution of the satellites and a challenge to CDM
Abstract
Elucidating dark matter density profiles in the Galactic dwarf satellites is essential to understanding not only the quintessence of dark matter, but also the evolution of the satellites themselves. In this work, we present the current constraints on dark matter densities in the Galactic ultra-faint dwarf (UFD) and diffuse galaxies. Applying our constructed non-spherical mass models to the currently available kinematic data of the 25 UFDs and 2 diffuse satellites, we find that whereas most of the galaxies have huge uncertainties on the inferred dark matter density profiles, Eridanus II, Segue I, and Willman 1 favor cuspy central profiles even considering effects of a prior bias. We compare our results with the simulated subhalos on the plane between the dark matter density at 150 pc and the pericenter distance. We find that the most observed satellites and the simulated subhalos are similarly distributed on this plane, except for Antlia 2, Crater 2, and Tucana 3, which are less than one tenth of the density. Despite considerable tidal effects, the subhalos detected by commonly-used subhalo finders have difficulty in explaining such a huge deviation. We also estimate the dynamical mass-to-light ratios of the satellites and confirm the ratio is linked to stellar mass and metallicity. Tucana 3 deviates largely from these relations, while it follows the mass-metallicity relation. This indicates that Tucana 3 has a cored dark matter halo, despite a significant uncertainty in its ratios.
1 Introduction
Dwarf spheroidal (dSph) galaxies associated with the Milky Way are valuable laboratories to shed light on the nature of dark matter because these galaxies are dark-matter dominated stellar systems, reaching dynamical mass-to-light ratios of up to (e.g., McConnachie, 2012; Simon, 2019). Since the dSphs are sufficiently nearby to resolve individual stars around the galaxies, it is possible to measure an accurate line-of-sight velocity and chemical composition for each star with higher-resolution spectroscopy (e.g., Simon & Geha, 2007; Walker et al., 2009). Therefore, utilizing these spectroscopic data, many early studies have estimated their dark matter distributions and dynamical masses through dynamical analysis (see Battaglia & Nipoti, 2022, for a review).
Recent dynamical studies for the luminous dSphs, so-called classical dSphs, have suggested that although there are still large uncertainties stemmed from insufficient data volume and dynamical modelings, these galaxies show a diversity of the inner dark matter densities (Read et al., 2019; Kaplinghat et al., 2019; Hayashi et al., 2020). Furthermore, this diversity could be explained by the -cold dark matter (CDM) framework combined with baryonic feedback and star formation burst predicted by recent -body and hydrodynamical simulations (e.g., Tollet et al., 2016; Lazar et al., 2020). Thus, the core-cusp problem, which is one of the controversial issues in CDM models (Bullock & Boylan-Kolchin, 2017), can be ameliorated by a baryonic feedback mechanism. Meanwhile, we should bear in mind that other dark matter candidates are still attractive models. For instance, self-interacting dark matter (SIDM) models could also reproduce the diversity by considering a gravothermal instability induced by tidal stripping (e.g., Nishikawa et al., 2020; Correa, 2021). Consequently, from recent observational and computational studies, such luminous dSphs could not hold the pristine dark-matter distributions.
In the ultra-faint dwarf (UFD) galaxies, which are much fainter and less-massive than the classical ones, the impact of baryonic effects on their central dark matter densities can be negligible. Thus the UFDs are promising targets to set constraints on dark matter models through the dark matter distributions. Although the number of observable individual stars are limited because most of their member stars are fainter than the magnitude limits of the current spectroscopy, several studies made an attempt to infer their enclosed masses of dark matter halos and set a constraint on critical parameters for several dark matter models (e.g., Errani et al., 2018; Hayashi et al., 2021a, b). However, the central dark matter density profiles in the UFDs are still unknown.
The currently discovered UFDs have been orbiting around the Milky Way and thus are thought to have experienced tidal stripping and/or disruption. Thanks to the Gaia astrometry (Gaia Collaboration et al., 2018, 2021), the bulk proper motions of all UFDs can be determined accurately, and then their orbits are computed with their known radial velocities (McConnachie & Venn, 2020; Li et al., 2021; Battaglia et al., 2022). For a given model of the gravitational potential of the Milky Way, the pericenter distance is generally determined within % for the satellites within 100 kpc from the Sun, and thereby offering the opportunity to study the evolution of the Galactic satellites (e.g., Miyoshi & Chiba, 2020; Genina et al., 2020a; Di Cintio et al., 2021). From theoretical studies, while tidal stripping removal of dark matter in the satellites is inevitable, an appreciable fraction of their stars can be lost only if they approach the center of the Milky Way very closely (Peñarrubia et al., 2008). In fact, several galaxies show signs of the tidal effects from morphology, possible velocity gradients and so on (e.g., Frebel & Norris, 2015; Simon, 2019).
In terms of tidal effects, Antlia 2 and Crater 2 have drawn attention as unusually diffuse satellite galaxies in the Milky Way (Torrealba et al., 2016, 2019). More surprisingly, these galaxies have exceptionally low velocity dispersion, even though they have large half-light radii (Caldwell et al., 2017; Ji et al., 2021). A central question is whether such diffuse galaxies can be explained by tidal forces in the context of CDM paradigm. Several studies based on simulations indicate that CDM models can reproduce the stellar properties of the diffuse galaxies with strong tidal stripping, especially if the dark matter halo has cored central density induced by stellar feedback and/or the halo has extremely low concentration (e.g., Errani et al., 2015; Rey et al., 2019; Torrealba et al., 2019; Simon et al., 2020; Moreno et al., 2022). Therefore, elucidating their central densities affords the key to understanding the formation history of the Galactic diffuse galaxies.
Given the current situations detailed above, in order to understand the formation of the Galactic satellites, it is essential to consider not only stellar properties such as luminosity and metallicity but also dynamical ones including dark matter distributions. For instance, the mass-metallicity relation (Kirby et al., 2013b, hereafter MZR), which is a tight correlation between stellar mass and mean stellar metallicity, can provide us hints for the formation of the satellites. This relation argues that tidal stripping of their stellar components could not be effective, because this effect reduces the luminosity of a galaxy without noticeably changing its metallicity in the absence of strong metallicity gradients. On the other hand, a large scatter of metallicity at the faint-end of this relation surely exists (Simon, 2019). The possible reason for this scatter is tidal stripping, but it is not conclusive because of a lack of knowledge of dark matter content and extent in the UFDs. Thus, in order to get insight into the roots of this scatter, knowledge of the dark matter halo properties of the UFDs should be essential.
Motivated by the aforementioned standing situation, we analyze the currently available kinematics for 25 UFDs and 2 diffuse satellites to estimate dark matter density profiles and dynamical masses through non-spherical dynamical models based on axisymmetric Jeans equations constructed by our group (Hayashi & Chiba, 2012, 2015; Hayashi et al., 2020). The main reason why we employ the non-spherical mass models is that such models can treat two-dimensional distributions of line-of-sight velocity dispersions and thereby mitigating a strong degeneracy between dark matter density and stellar anisotropy in spherical models (Binney & Mamon, 1982).
This paper is organized as follows. In Section 2, we briefly explain our dynamical models, and then we describe the photometric and spectroscopic data for our sample dwarf galaxies and our fitting procedure. In Section 3, we present the results of the fitting analysis and the estimated dark matter density profiles based on the fitting results. We also show the relation between inner dark matter density slope and stellar-to-halo mass ratio predicted by recent galaxy simulations. In Section 4, using our estimated dark matter halo properties, such as the dark matter central densities and dynamical mass-to-light ratios, we discuss the tidal evolution of the Galactic satellites and the implication for a challenge to CDM paradigm. Finally, the summary and conclusion are presented in Section 5.
2 Models and data
In this section, we briefly introduce our dynamical mass models. In this work, to estimate the dark matter density profiles and dynamical masses in the Galactic satellites, we use the same dynamical analysis as Hayashi et al. (2020). Thus, the further details about this analysis are found in that article.
| Object | Reference | ||||||
|---|---|---|---|---|---|---|---|
| [kpc] | [pc] | (axial ratio) | [dex] | ||||
| Antlia 2 | 283 | (1), (9) | |||||
| Botes I | 66 | (2), (3), (4) | |||||
| Canes Venatici I | 214 | (2), (5), (6) | |||||
| Canes Venatici II | 25 | (2), (5), (7) | |||||
| Coma Berenices | 59 | (2), (5), (8) | |||||
| Crater 2 | 141 | (9), (10) | |||||
| Draco 2 | 9 | (11), (12) | |||||
| Eridanus II | 92 | (2), (13), (14) | |||||
| Grus 1 | 8 | (2), (15) | |||||
| Grus 2 | 19 | (16), (17), (18) | |||||
| Hercules | 18 | (2), (5), (19) | |||||
| Horologium I | 5 | (2), (20) | |||||
| Hydra II | 13 | (2), (21), (22) | |||||
| Leo IV | 18 | (2), (3), (23) | |||||
| Leo V | 7 | (2), (3), (23) | |||||
| Leo T | 19 | (2), (5), (24) | |||||
| Pisces II | 7 | (2), (21), (25) | |||||
| Reticulum II | 25 | (2), (20), (26) | |||||
| Segue 1 | 71 | (2), (19), (27) | |||||
| Segue 2 | 26 | (2), (28), (29) | |||||
| Triangulum II | 13 | (2), (30), (31) | |||||
| Tucana 2 | 19 | (26), (35) | |||||
| Tucana 3 | 26 | (16), (32) | |||||
| Tucana 4 | 11 | (16), (18) | |||||
| Ursa Major I | 39 | (2), (5), (33) | |||||
| Ursa Major II | 20 | (2), (5), (33) | |||||
| Willman 1 | 40 | (2), (34) |
The table lists the number of member stars with velocity measurements available from the kinematic analysis (), V-band absolute magnitudes (), distances from the Sun (), projected half-light radii (), projected stellar axial ratios (), mean metallicities (), and references. Here, a projected stellar axial ratio is related to the intrinsic one via the inclination angle : . This equation can be rewritten as (Hubble, 1926). Thus, the range of inclination angle is confined by .
References: (1) Torrealba et al. (2019); (2) Muñoz et al. (2018); (3) Jenkins et al. (2020); (4) Dall’Ora et al. (2006); (5) Kirby et al. (2013b); (6) Kuehn et al. (2008); (7) Greco et al. (2008); (8) Belokurov et al. (2007); (9) Ji et al. (2021); (10) Torrealba et al. (2016); (11) Laevens et al. (2015a); (12) Longeard et al. (2018); (13) Zoutendijk et al. (2021); (14) Li et al. (2017); (15) Chiti et al. (2022a); (16) Drlica-Wagner et al. (2015); (17) Martínez-Vázquez et al. (2019); (18) Simon et al. (2020); (19) Martin et al. (2008); (20) Koposov et al. (2015b); (21) Kirby et al. (2015); (22) Martin et al. (2015); (23) de Jong et al. (2010); (24) de Jong et al. (2008); (25) Belokurov et al. (2010); (26) Koposov et al. (2015a); (27) Simon et al. (2011); (28) Belokurov et al. (2009); (29) Kirby et al. (2013a); (30) Laevens et al. (2015b); (31) Kirby et al. (2017); (32) Simon et al. (2017); (33) Simon & Geha (2007); (34) Willman et al. (2011); (35) Chiti et al. (2022b)
2.1 Non-spherical mass models
Assuming that a galaxy is an axisymmetric and dark matter dominated steady-state system, the stellar motion of such a system can be described by the axisymmetric Jeans equations, which are taken moments of the steady-state collisionless Boltzmann equation (Binney & Tremaine, 2008). We assume that the cross terms of velocity moments such as vanish and the velocity ellipsoid constituted by is aligned with the cylindrical coordinate. We also assume that the density of tracer stars has the same orientation and symmetry as that of a dark halo and that is a constant velocity anisotropy parameter introduced by Cappellari (2008). Owing to large mass-to-light ratios of the dSphs, we assume the stellar mass to be negligible. Under these assumptions, the Jeans equations are expressed as
| (1) | |||||
| (2) |
where is the three-dimensional stellar density and is the dark matter gravitational potential. In principle, these second velocity moments are defined as , where and are dispersion and streaming motions of stars, respectively. Since the UFDs are largely dispersion-supported stellar systems (e.g., Wheeler et al., 2017), the latter streaming motions can be negligible. To compare observed line-of-sight velocity dispersions with the models, we project the intrinsic velocity dispersions from the equations (1) and (2) into the line-of-sight direction followed by previous works (Romanowsky & Kochanek, 1997; Tempel & Tenjes, 2006; Hayashi & Chiba, 2012).
For the stellar density profile, we adopt the Plummer profile (Plummer, 1911) generalized to an axisymmetric shape, , where and is a half-light radius along the major axis. is an intrinsic axial ratio of the stellar distribution assumed to be independent of position. The surface density profile can be derived from via an Abel transform and the inclination angle, , i.e., the angle between the symmetry axis of the dwarf and the line of sight, which is a free parameter. When a galaxy is edge-on (face-on), (), respectively.
Meanwhile, to determine the dark matter gravitational potential, we assume a generalized Hernquist profile (Hernquist, 1990; Zhao, 1996) but non-spherical shape,
| (3) | |||
| (4) |
where and are the scale density and radius, respectively; is the sharpness parameter of the transition from the inner slope to the outer slope ; and is a constant axial ratio of a dark matter halo. These are the free parameters in our models.
2.2 Data and Analysis
In this work, we scrutinize dark matter halos for 25 UFDs (Boötes I, Canes Venatici I, Canes Venatici II, Coma Berenices, Draco 2, Eridanus II, Grus 1, Grus 2, Hercules, Horologium I, Hydra II, Leo IV, Leo V, Leo T111This galaxy is actually a dwarf irregular galaxy, but we include it in this work because this galaxy has drawn attention as an ideal target to set constraints on dark matter models, especially for primordial black holes (e.g., Faerman et al., 2013; Wadekar & Farrar, 2021; Lu et al., 2021)., Pisces II, Reticulum II, Segue 1, Segue 2, Triangulum II, Tucana 2, Tucana 3, Tucana 4, Ursa Major I, Ursa Major II, Willman 1) and two diffuse galaxies (Antlia 2 and Crater 2) in the Milky Way. The basic stellar properties are shown in Table 1.
The stellar structural parameters (, and with the Plummer profile) of the galaxies are adapted from the original observation articles. For the stellar kinematics of their member stars, we use the currently available data taken from each spectroscopic observation article. For the membership selections for each galaxy, we also adopt the methods in the spectroscopic observation articles. For the influence of unresolved binary stars on stellar kinematics, several articles indicated that multi-epoch observations can exclude binary candidates from stellar spectroscopic data (e.g., Simon & Geha, 2007; Kirby et al., 2017; Jenkins et al., 2020). Therefore, we suppose that the effect of binaries can be negligible.
To perform fitting analysis compering our mass models with the kinematic data of our sample galaxies, we employ the likelihood function assuming that the line-of-sight velocity distribution of each star is a Gaussian shape and centered on the mean velocity of the galaxy 222In this work, we only consider a dispersion of the line-of-sight velocity distribution, hence we assume that this distribution is a Gaussian. However, we should bear in mind that there is still degeneracy between mass distribution and velocity anisotropy under this assumption. To mitigate the degeneracy, information about the shape of velocity distribution function (i.e., kurtosis) should be important. Several papers (e.g., Richstone & Tremaine, 1984; Łokas, 2002; Mamon et al., 2013; Read & Steger, 2017) constructed spherical mass models with taking into account higher-order moments. However, the current available data is possibly too sparse to break the degeneracy because the shape of velocity distribution is sensitive to the data volume and quality.:
| (5) |
where is the line-of-sight velocity of the star in the kinematic sample. The mean velocity of the galaxy is a nuisance parameter. The dispersion can be written by , where the measurement error of the velocity, and is the theoretical line-of-sight velocity dispersion at the sky plane position , which is computed by model parameters and the Jeans equations.
Using the likelihood function , we fit the 8 parameters based on Bayesian statistics. We estimate the posterior distributions of these parameters via Markov chain Monte Carlo by the Metropolis–Hastings algorithm (Metropolis et al., 1953; Hastings, 1970)333We use our own custom-made code for our analysis. To assess the convergence of the Markov Chain Monte Carlo (MCMC) algorithm, we employ a visual inspection method, among several available methods. In our MCMC analysis, we utilize 20 chains, with each chain containing a sample size of 50,000 after discarding the burn-in phase. Specifically, we discard 5,000 samples from each chain as burn-in. Consequently, we have a total of one million samples, excluding the burn-in phase.. We adopt flat or log-flat priors over the following ranges: , , , , , , , and .
3 Results
In this section, we present the results from the MCMC fitting analysis described above, especially for their dark matter density profiles. Furthermore, using the estimated dark matter density profiles, we calculate the dynamical mass-to-light ratios within their half-light radius and the dark matter densities at 150 pc.
3.1 Parameter estimation
We sampled the parameter spaces of our non-spherical mass models using the parametrizations described above. The best-fitting parameters for each galaxy are shown in Table 2 in Appendix A, including the 68% confidence intervals. As a by-product of the fitting results, we also show the dynamical mass-to-light ratio, , within half-light radius and the dark matter density at 150 pc, , computed from the estimated dark matter halo parameters. Moreover, we show the Bayes factors, which are the ratio of the mean posterior distribution of the mass models with the spherical dark matter halo and with all free parameters (subscript “1”), and the ratio of the posterior distribution of the mass models with non-spherical dark matter halo and with all free parameters (subscript “2”). In each model, we keep the stellar distributions have an axisymmetric shape, that is, stellar axial ratios are not unity. The Bayes factors and Akaike Information Criterion show that there is no statistical evidence for the need to an additional free parameter for the halo axis ratio , compared to either spherical () or equal to that of the stars () for small sample-sized dSphs.
From the values of their Bayes factors, it is difficult to determine which spherical or non-spherical dark matter halo is better based on the currently available data.
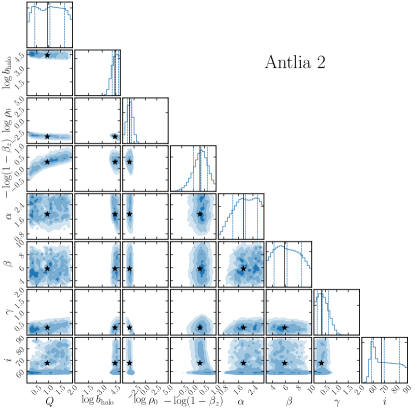
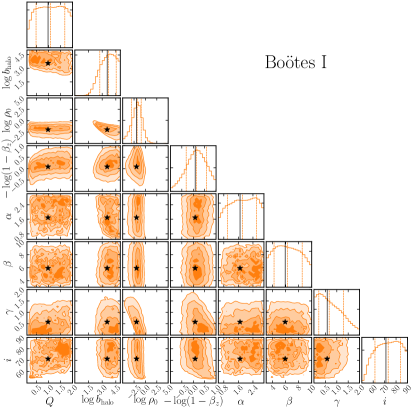
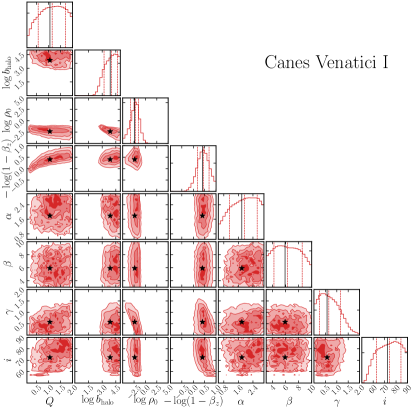
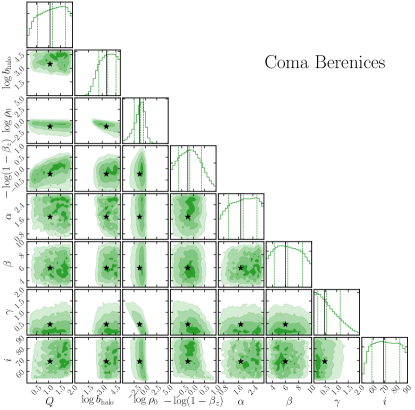
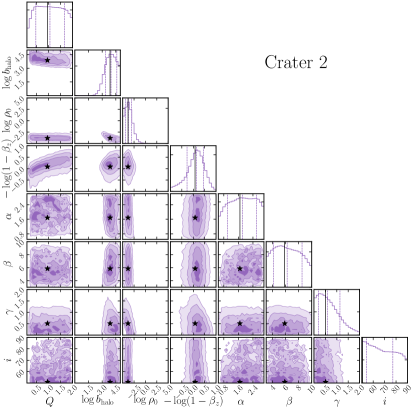
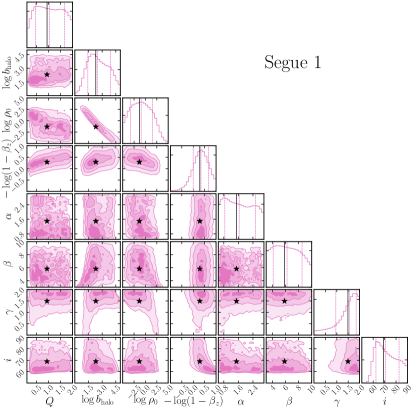
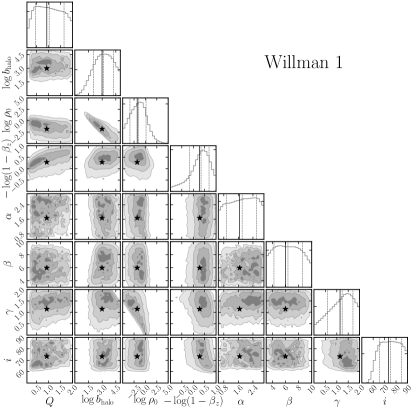
Figures 6 and 7 display the posteriors for all parameters for Antlia 2, Boötes I, Canes Venatici I, Coma Berenices, Crater 2, Eridanus II, Segue 1, and Willman 1 as the representative satellites, which have the largest samples among our studied dwarfs. The results for other satellites are similar to these or are wider distributed in each parameter range. The contours in these figures show 68%, 95%, and 97% confidence intervals. The vertical lines in each histogram also depict the median and 68% confidence upper and lower limits. According to the maps, the parameters , and are widely distributed in these parameter ranges, due to an insufficient number of spectroscopic data. It is confirmed that - and - are clearly degenerate. These results have already known and been discussed in several previous articles (e.g., Binney & Tremaine, 2008; Cappellari, 2008; Geringer-Sameth et al., 2015; Hayashi & Chiba, 2015; Hayashi et al., 2020). The inner slope parameter of the dark matter density profile also shows a wide spread within its prior range. Furthermore, the inner slope appears to be uncorrelated with the other two DM density profile parameters and , hence there is no need to fix and/or . Nonetheless, several UFDs (Eridanus II, Segue 1, and Willman 1) favor cuspy dark matter density profiles. We discuss this further in the next section.
3.2 Dark matter density profile
3.2.1 Profile Recovery
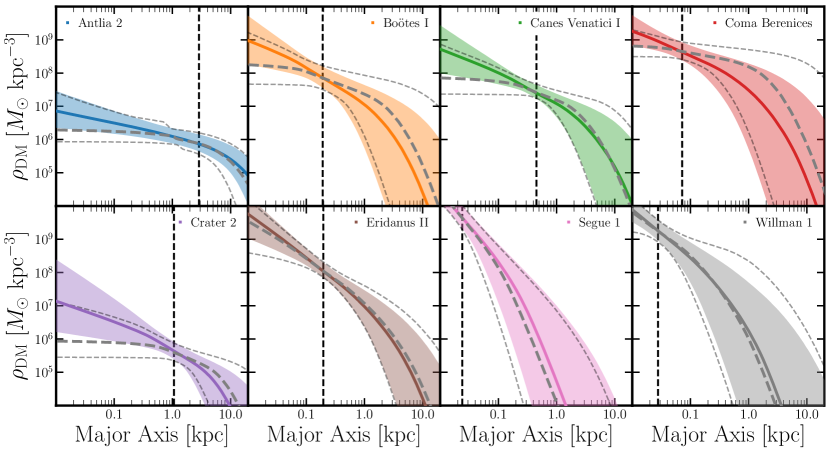
Marginalizing the posteriors of the parameters, we recover the dark matter density profiles of the dwarf galaxies. Figure 1 shows the inferred dark matter density profiles of the representative galaxies. The solid lines show the median, and the shaded region marks the 68% interval. The vertical dashed lines are the projected half-light radii of each galaxy.
Firstly, Segue 1 and Willman 1 favor a sharply cuspy inner slope of their dark matter density profiles ( for Segue 1 and for Willman 1), even considering 95% confidence intervals of the profile. Eridanus II also prefers a cuspy dark matter density profile (), even though the uncertainty for its is larger than for Segue 1 and Willman 1. Intriguingly, the slope of Segue 1 is much steeper than an NFW cusp () but is roughly consistent with ones predicted by the other simulation works (e.g., Fukushige & Makino, 1997; Moore et al., 1999; Springel et al., 2008; Ishiyama & Ando, 2020), while those of Eridanus II and Willman 1 are consistent with the NFW ones. Figure 1 indicates that the uncertainties on the mass density profile are narrowest at near the half-light radius, consistent with Wolf et al. (2010). Moreover, several studies have reported that these UFDs, especially Segue 1 and Willman 1 can provide the strongest constraint on fuzzy dark matter (FDM) and self-interacting (SIDM) models which can create a naturally cored dark matter density profile without relying on any baryonic physics (e.g., Hayashi et al., 2021a, b). This implies that Segue 1 and Willman 1 could have cuspy dark matter halos.
Secondly, the other well-sampled UFDs tend to be somewhat cuspy profiles, but there are huge uncertainties in the inferred density slopes. In fact, they permit , that is, a cored dark matter density within 95% confidence. Therefore, it is impossible to make a final conclusion whether these remaining poorly-sampled galaxies have cored or cuspy dark matter halos. The other galaxies, which are not shown here, also have huge uncertainties on their inner slopes of dark matter density profiles from the 8th column in Table 2, which shows the constraints on .
Thirdly, dark matter densities of the diffuse galaxies (Antlia 2 and Crater 2) are around one order of magnitude less dense than those of the other dwarf satellites. In particular, Antlia 2 favors having the diffuse dark matter halo as well as its stellar component. The dark matter scale density of Antlia 2 is consistent with the result from Torrealba et al. (2019).
We compare our results, especially for , with other studies. Unfortunately, it is not possible to compare the inner slopes of dark matter density profiles in the UFDs. However, there are several papers that have estimated their inner slopes. Errani et al. (2018) adopted the mean density within 1.8 times half-light radius of a dSph and found that cuspy dark matter density profiles () can reproduce the mean densities of Canes Venatici I, Canes Venatici II, Coma Berenices, Leo T, Ursa Major II, Segue 1, Segue 2. Their results are roughly consistent with our results within the 68 % confidence region. On the other hand, Zoutendijk et al. (2021) made an attempt to constrain the dark matter density profile of Eridanus 2 using CJAM (Cappellari, 2008; Watkins et al., 2013) and pyGravSphere (Read & Steger, 2017; Genina et al., 2020b) with a generalized Hernquist profile. From their analysis, the inner slope is constrained as (68 % confidence region). This is also roughly consistent with our estimation within the 68 % confidence region.
3.2.2 Robustness of the estimated density profiles
To investigate the robustness of our results, especially regarding the inner slope of a dark matter density profile, , we perform the same MCMC fitting procedure (see Section 2.2) for the case of a wider range of prior for than the fiducial parameter range (). Namely, we adopt here the case of a flat prior over range , and we impose if has a negative value and otherwise. This is because the fiducial one might lead to a bias toward cuspy density profiles. Using this new wide prior, we re-run the MCMC fitting procedure and estimate the dark matter density profiles for the representative eight galaxies.
Figure 1 shows the comparison of the inferred dark matter density profiles for the eight galaxies for the fiducial and wider prior ranges. The colored solid line and shaded region in each panel show the results from the fiducial case, while the gray dashed lines denote the ones for the case of wider prior ranges. Figure 1 shows that the estimated dark matter density profiles of most galaxies are largely affected by the new prior range. In particular, this prior makes their central densities clearly less dense. Therefore, we note that most of the galaxies with small data volumes should be sensitive to the choice of priors. This point is also highlighted in the mass-orbit modelings of dSphs (e.g., Mamon et al., 2015).
On the other hand, for galaxies with cuspy dark matter, such as Eridanus II, Segue 1 and Wilman 1, the inner slopes are not much changed with the wider range of priors, as expected. The possible reason why these galaxies prefer cuspy dark matter density profiles comes from the following properties of their line-of-sight velocity dispersion profile in the central region. Although the variations of (dark halo shape) and (velocity anisotropy) give a similar effect on entire shape of line-of-sight velocity dispersion profiles (see Cappellari, 2008; Hayashi & Chiba, 2015), the inner slope of dark matter density profile, , can have an impact only on an inner velocity dispersion profile (Hayashi et al., 2020). However, we bear in mind that the assumption of Gaussian line-of-sight velocity distribution causes a bias towards cuspy dark matter density profiles for dSphs with Plummer stellar density profile plus cored dark matter halo (Read et al., 2021).
Note that cuspy dark matter density profiles in Eridanus II, Segue 1 and Willman 1 come mainly from the kinematic sample in the inner part (especially within 10 pc) in our unbinned analysis. The unbinned analysis can trace the inner kinematic structures in galaxies, while the binned one might smear out such information, and thus may not provide such a constraint on inner slopes of dark matter density profile as the unbinned one (e.g., Richardson & Fairbairn, 2014).
Finally, it is worth noting that even if a dSph is largely dominated by a gravitational potential by dark matter, the specific assumption of stellar density profiles can affect the inferred slope of a dark matter density profile at inner parts of a dSph (e.g., Evans et al., 2009; Hayashi & Chiba, 2012). To address this issue, we take into account another functional form for the surface stellar density profile, namely, an exponential density profile444, where and is scale radius. are the sky coordinates aligned with the major and minor axes, respectively.. We adopt this density profile to the same dynamical analysis as for a Plummer model. Taking the case of Segue 1 as an example, the constraints on the model parameters do not differ significantly, despite the differences in the selected stellar density profiles. This result may be attributed to Segue 1 being a poorly-sampled system, where statistical errors dominate the uncertainties in the model parameters. For the case of Antlia 2 as another example, on the other hand, the inner slope of dark matter density estimated by an exponential stellar profile is slightly shallower () than that estimated by a Plummer one, even though those values are roughly consistent within 68% confidence level. This is due to the fact that exponential three-dimensional profiles are somewhat steeper in the central regions compared to Plummer profiles. As a result, we confirm that there are systematic uncertainties, to some extent, for the inner slopes of dark matter density when different stellar density profiles are adopted.
3.2.3 Inner Dark Matter Density Slope versus Stellar-to-halo Mass Ratio
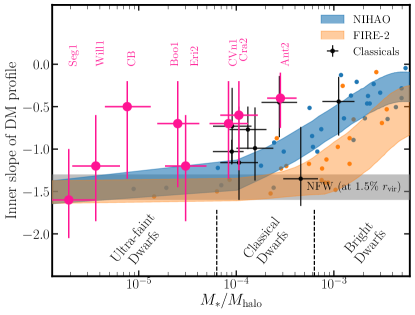
Figure 2 shows the logarithmic slope of the dark matter density profile at 1.5% of the virial radius of the dark halo as a function of the stellar mass-to-halo mass ratio, . This is analogous to figure 6 of Hayashi et al. (2020, originally following ), but including several galaxies studied in our study. The blue and orange dots and shaded bands depict the results from NIHAO (Tollet et al., 2016) and FIRE-2 (Lazar et al., 2020) zoom-in hydrodynamical simulations, while the gray band shows the expected range of dark matter profile slopes for NFW as derived from dark matter-only simulations (Tollet et al., 2016).
To compute the stellar mass-halo mass ratios of the dwarf galaxies, we employ the self-consistent abundance matching model by Moster et al. (2013) and adopt the stellar masses of most dSphs taken from the literature (Table 1). For several UFDs having no information about stellar masses, we calculate those of their UFDs by their luminosities by assuming a stellar mass-to-light ratio of , which is the median value for dSphs measured by Woo et al. (2008). The black points with error bars are the results of classical dSphs estimated by Hayashi et al. (2020), while the magenta ones are the largest eight galaxies among the sample in this work. According to the predictions from the simulations (blue and orange bands), an inner slope of a dark matter density profile in the UFD regime () should not be affected largely by baryonic feedback effects , but we note from this figure that all of their inner dark matter slopes except one (Segue 1) are shallower than predicted by the hydrodynamical simulations. On the other hand, there are large uncertainties in both the inner slopes and the stellar-to-halo mass ratios of the UFDs. Thus, we cannot make a robust conclusion about whether the relation exists or not from the currently available data.
4 Discussion
4.1 Dark Matter densities at 150 pc
Read et al. (2019) introduced the local dark matter density at a common radius of 150 pc from the center of each dSph, , which is more robustly estimated than either the inner dark matter slope or its normalization in their spherical mass models. They also argued that this density is enough different to divide the luminous dwarf galaxies into cusps or cores. Kaplinghat et al. (2019) found that of the Galactic dSphs anti-correlates with their orbital pericenter distance, , estimated by Gaia. In combination with the too-big-to-fail problem (Boylan-Kolchin et al., 2011, 2012), they proposed that this anti-correlation can provide a new incisive test of the nature of dark matter, especially for SIDM models (e.g., Nishikawa et al., 2020; Correa, 2021; Jiang et al., 2021).
Following these works, we calculate along the major axis of the sample dwarf galaxies. The calculated values are tabulated in the 11th column of Table 2. Utilizing the part of these estimations, Ebisu et al. (2022) compared the - relation with that from the dark matter simulations based on CDM and SIDM models with different (velocity independent) self-interaction cross sections ( cm2 g-1). Although the uncertainties of of UFDs are large, the SIDM scattering cross-section less than 3 cm2 g-1 could be favored.
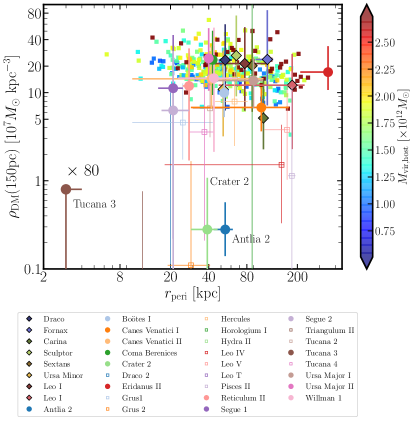
We scrutinize the anti-correlation between - for all sample galaxies. To do this with comparatively secure results, we separate the galaxies into two groups: the first group contains galaxies with at least 20 stars (colored filled circles in Fig. 3), while the second group has fewer than 20 stars (colored thin open circles in Fig. 3)555This is motivated from the number of free parameters in our dynamical models. There are nine parameters to fit the observational quantities in this work.. For the pericenter radius, we adopt the values estimated by Battaglia et al. (2022), which analyzed the latest Gaia data (Gaia EDR3, Gaia Collaboration et al., 2021) assuming a Milky Way potential model with 666 We bear in mind that this pericenter estimation did not consider the dynamical effects of Large Magellanic Cloud (LMC). It is possible that some of the dSphs have passed near LMC and thus have acquired angular momentum during their orbit leading to biases in their pericenters.. Figure 3 displays the relation between and . The filled diamonds with error bars are the inferred of the classical dSphs (Hayashi et al., 2020), while the colored ones are the results of all sample dwarf galaxies in this work. The dwarf galaxies are widely distributed in this plot, even though there are still large uncertainties.
Besides, Antlia 2, Crater 2, and Tucana 3 have very low dark matter densities, and thus they deviate significantly from the other ones. This deviation might be due to tidal effects. In particular, according to several studies of Tucana 3’s orbital evolution based on Gaia satellites, this UFD is very likely to have traveled within 10 kpc from the Galactic center (e.g., Battaglia et al., 2022) and might be embedded in a tidal stream, which is stemmed from tidal disruption (e.g., Drlica-Wagner et al., 2015; Erkal et al., 2018; Li et al., 2018). Therefore, this UFD might have been disturbed strongly by the gravitational potential of the Milky Way, and thus might have experienced a high mass loss.
We also compare dark matter subhalos predicted from dark matter-only simulations based on CDM theory. To create the subhalo sample, the simulated data we use and the selection procedure are the same as Hayashi et al. (2020). We use the ROCKSTAR phase space halo/subhalo finder to select subhalos (Behroozi et al., 2013). In Figure 3, the small filled squares show the predicted subhalos associated with these Milky Way-sized dark matter host halos. These subhalos have km s-1, where is the maximum circular velocity of the subhalo over its assembly history. The color scale of the squares indicates the virial masses of the host halos. The simulated subhalos show a weak anti-correlation, which does not depend on their host halo masses. On the other hand, although it does not seem that the Galactic satellites have such anti-correlation, these are reasonably consistent with the simulated subhalos. As already discussed in the literature (e.g., Hayashi et al., 2020; Genina et al., 2020a), the distribution could be explained by ‘survivor bias’, which means denser central dark matter densities can survive even suffering from strong tidal effects at small pericenter and from repeated tides (e.g., Errani & Navarro, 2021).
However, despite taking into account the tidal effects, the dark matter simulations have difficulty explaining the extremely low dark matter densities of Antlia 2, Crater 2, and Tucana 3. This discrepancy was already argued by several works (e.g., Sameie et al., 2020; Ji et al., 2021; Borukhovetskaya et al., 2022). Obviously, we should bear in mind that our dynamical analysis is based on dynamical equilibrium, while such diffuse systems can deviate from the dynamical equilibrium. Thus, our resultant dark matter densities could have systematic uncertainties stemmed from this assumption. In addition, it can be difficult for commonly-used subhalo finders (e.g., Behroozi et al., 2013) to detect the substructures that have very low dark matter densities, because of low-contrast dark matter densities between a subhalo and the background (i.e., a host halo). Therefore, it should be noted that such diffuse subhalos can be easily overlooked by the subhalo finders.
4.2 Dark matter fractions
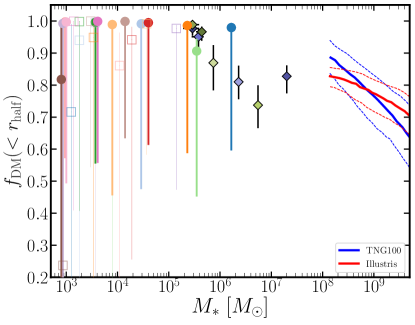
Lovell et al. (2018) investigated the relative content of dark matter and baryonic mass using the IllustrisTNG (TNG, Springel et al., 2018) and Illustris (Vogelsberger et al., 2014) simulations, in order to make theoretical predictions about the relationship between a galaxy’s total mass and its stellar component. They selected simulated galaxies with at , and then computed their dark matter fraction (DMF), within several kinds of radii as a function of galaxy stellar mass (e.g., half-light radius ). They predicted that is around 0.8 at and gradually decreases toward 0.5-0.6 with increasing stellar mass at for the case of DMF within ,.
Following this work, we calculate of the sample dSphs. Figure 4 shows the as a function of . The symbols are the same as those in Figure 3. The TNG100 and Illustris simulated data (taken from Lovell et al., 2018) are shown in blue and red, respectively. The solid and dashed lines denote the median and 68% of their data. While most of low-mass dSphs have , the dark matter fractions of massive ones decrease to , but there are large uncertainties. On the other hand, due to resolution limits, the simulation results cannot reach low-mass galaxies less than . In order to inspect whether the simulated fractions are consistent with the observed ones, it is necessary to perform much more high-resolution cosmological simulations.
4.3 Dynamical mass-to-light ratios
As a by-product of the fitting results, we estimate the dynamical mass-to-light ratios (MLs) within the half-light radii of the dSphs, which we write . This is motivated by the increasing mass-to-light ratio for decreasing dwarf luminosity (Mateo, 1998; Wolf et al., 2010; McConnachie, 2012), whose mass-to-light ratios increase remarkably with decreasing luminosity. We therefore calculate of our sample dwarf galaxies as well as the classical dSphs to examine whether the scaling law still sustain even with considering the non-sphericity of their dark matter halos and the latest data sample.
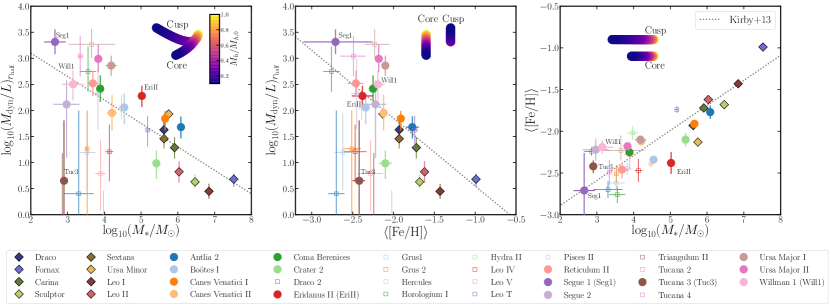
The dynamical MLs we estimated are shown in the 10th column of Table 2, and Figure 5 shows the dynamical mass-to-light ratios of all dSphs in our sample, as a function of stellar mass (left panel) and of averaged metallicity (middle panel). Here, we focus only on the filled symbols, which correspond to the galaxies having large kinematic sample sizes larger than 20 stars. In the left panel of Figure 5, the dotted line indicates , suggested by the scaling relations found by Fattahi et al. (2018) in their hydrodynamical simulations: , and as well as and .
Figure 5 shows that most of the Galactic dSphs agree with the suggested relation. However, there is non-negligible scatter in the MLs, not seen in the simulations (see Figure 7 in Fattahi et al., 2018), especially for the simulated galaxies with low-MLs. There are several explanations for this discrepancy: i) the simulations might not resolve dark matter densities at UFD-mass scales and with very diffuse galaxies, ii) they might not be able to identify the galaxies that were strongly stirred by the tidal effects, and iii) the simulated less-massive galaxies could maintain cuspy dark matter densities even considering stellar feedback effects or iv) biases in the kinematic mass modeling and/or underestimated uncertainties on . To verify these possibilities, high-resolution hydrodynamical simulations of Milky Way analogs are required. However, this is beyond the scope of the present article.
Meanwhile, we confirm that the dynamical ML might anti-correlate with the averaged metallicity even at the low-metallicity end, as shown in the right panel of Figure 5. The dotted line in this panel shows the relation derived by NFW dark matter halo () and the universal MZR (Kirby et al., 2013a), which indicates . From this panel, the observed dSphs are in line with the relation, even though a large scatter still exists.
The scatter in ML with stellar mass and with metallicity, shown in Figure 5, might stem from tidal effects, even though non-sphericity of the dark matter halo and deviation from an NFW density profile could also be possible reasons for the scatters. In the following section, we discuss the tidal effects on the dynamical ML relations, taking into account the emperical tidal evolution models.
Here, we suppose that the metallicities in the dwarf galaxies are unaffected by tidal effects (i.e., they shift only vertically (horizontally) in middle (right) panel).
4.4 Tidal evolution of the dwarf satellites
To examine the tidal effects on and , we estimate the evolution of these based on a simple empirical formula calculated by Errani et al. (2015). This formula, as known as tidal evolutionary tracks, describes parametrically the tidal evolution of the half-light radius , the luminosity averaged velocity dispersion within , the total stellar mass , and the total mass enclosed within , which are all normalized to their initial values under the assumption that the stellar density profile follows that of the Plummer sphere. Errani et al. (2015) performed high-resolution -body simulations for the cases of cored and cuspy dark matter subhalos and searched the empirical fitting parameters to their tidal tracks proposed by Peñarrubia et al. (2008). The fitting formula is written as
| (6) |
Here, is the total mass that remains bound within the initial stellar half-mass radius of the satellite, in units of the pre-stripping value, . and are the fitting parameters. The best-fit values for both core and cusp cases are tabulated in Table 1 in Errani et al. (2015)777In this paper, we adopt the best-fit values as follows. Core cases: for and for , Cusp cases: for and for . In addition, the empirical formula with best-fit values is in accord with the results from APOSTLE simulations, which are cosmological hydrodynamical simulations of the Local Group (Fattahi et al., 2018).
Using the tidal evolutionary tracks of and , relative to their unstripped values, we calculate the tidal evolution of . The estimated tidal evolution of are plotted on the and planes of Figure 5. The thick colored lines in each panel display the evolutionary tracks for the cases of cuspy and cored dark matter subhalos. The color bar indicates the subhalo total mass fraction that is retained against tidal stripping. The yellow color indicates , which means the dark halo is pre-infalling. Here, we assume that metallicities in the dwarf galaxies are unaffected by tidal effects (i.e., they shift only horizontally (vertically) in the middle (right) panel in Figure 5)888If a negative metallicity gradient in a dwarf galaxy exists, the metallicity could be enriched by tides because metal-poor stars in outer parts of a galaxy are preferentially stripped..
The left and middle panels of Figure 5 indicate that for subhalos with cuspy dark matter, tidal stripping does not alter much either scaling relation for and . Instead, for subhalos with constant density cores, is changed more clearly. In the right panel, on the other hand, we find that a stellar mass embedded in a cuspy dark matter halo is decreased prominently by tidal stripping. These apparent counter-intuitive results are already discussed by Errani et al. (2015, see also ). They interpreted that most of particles tagged as ‘stars’ in a cored dark matter halo are associated to the most-bound dark matter particles, whilst a small fraction of stars are associated to dark matter particles with high binding energy in a cusped dark matter halo. In short, Figure 5 indicates that the tidal evolution of dwarf galaxies with cuspy halos does not affect the scaling relations of ML with stellar mass and with metallicity, but does affect the MZR. These results are consistent with the results from cosmological hydrodynamical simulations (Fattahi et al., 2018). Interestingly, the presence of negative metallicity gradients can potentially amplify the above results. Moreover, the results imply that the large scatter of metallicity at the faint-end of the MZR can be explained by tidal stripping of less-massive satellites associated with cuspy dark matter halos , even though this scatter can also be caused by the lack of data to properly measure stellar mass and metallicity.
Indeed, the results of Segue 1 and Willman 1, which favor cuspy dark matter density profiles, can be interpreted by the tidal evolution within their finite uncertainties. The stellar and dark matter halo masses of their progenitors would have been more massive. After the accretion onto the Milky Way, the tidal effects can decrease their stellar masses, but the MLs are not much altered. However, although Eridanus II also appears to have a cuspy dark matter halo, it might not be evolved along the tracks. In particular, the deviation from the MZR cannot be explained by tidal effects. Besides, the pericenter distance of Eridanus II may be very large ( kpc estimated by using Gaia EDR3, e.g., Battaglia et al. 2022), and thus this galaxy should not suffer from tidal forces. Therefore, the chemo-dynamical evolution of this galaxy could be interpreted by the scatter induced from the merging and star formation histories, baryon feedback, and metallicity gradient of isolated systems (e.g., Wetzel et al., 2016; Mercado et al., 2021).
On the other hand, several galaxies, especially Tucana 3, deviate significantly from the scaling relations in Figure 5 except for the MZR. As mentioned above, Tucana 3 might have been disturbed strongly by the tidal force because at pericenter, it is located very close to the center of Milky Way (3-4 kpc according to Battaglia et al. 2022). Thus, the departure of Tucana 3 from the on one hand and on the other hand, combined with its normal mass metallicity relation indicates that Tucana 3 has a cored dark matter halo. Even though several UFDs (such as Draco II, Segue 1, Ursa Major I, Willman 1, etc.) can also be considered as tidally stirred (e.g., Battaglia et al., 2022), they might not have suffered stronger tidal effects than Tucana 3. However, we bear in mind that there is a considerable uncertainty on the estimation of Tucana 3 due to the small number (26) of available velocities and the dynamical non-equilibrium provoked by strong tidal effects.
5 Summary and Conclusion
In this paper, we investigate dark matter halo properties of the Galactic ultra-faint dwarf and diffuse galaxies utilizing non-spherical dynamical mass models based on axisymmetric Jeans equations.
Applying our non-spherical mass models to the latest kinematic data of the 25 UFDs and 2 diffuse galaxies in the Milky Way, we estimate their dark matter density profiles by marginalizing posteriors of non-spherical dark matter halo parameters. We find (Figure 1) that most of these galaxies have large uncertainties on the inferred dark matter density profiles especially for their inner density slopes, which are largely affected by the choice of the range of priors. On the other hand, the dark matter density profiles of Eridanus II, Segue I, and Willman 1 are are not much affected by the choice of priors, and their inner slopes appear to be cuspy.
Utilizing their inferred central dark matter density profiles, we compare them with the predictions from recent cosmological zoom-in hydrodynamical simulations on the relation between the inner slope of a dark matter density profile and stellar mass-to-halo mass ratio in Figure 2. Although some of our sample galaxies are roughly consistent with the predictions from recent numerical simulations, there are large uncertainties in both their inner slopes and stellar-to-halo mass ratios. Thus, we cannot make a conclusion about whether the relation exists or not from the current available data.
We scrutinize the anti-correlation between a dark matter density at a radius of 150 pc and the orbital pericenter distance of a dwarf satellite highlighted by Kaplinghat et al. (2019) and compare it with simulated dark matter subhalos based on CDM models (Figure 3). Although it does not seem that the dwarf galaxies studied here have this anti-correlation, these are roughly consistent with the simulated dark matter subhalos. Nevertheless, Antlia 2, Crater 2, and Tucana 3 have very low central dark matter densities, thus deviating significantly from the anti-correlation. Even after taking into account tidal effects, dark matter simulations have difficulty in explaining such large deviations from the density-mass relation. However, we should bear in mind that commonly-used subhalo finders are not very able to detect substructures that have very low dark matter densities.
Following several simulation works such as the IllustrisTNG and Illustris, we calculate dark matter fraction within a half-light radius, of the sample dSphs. While most of low-mass dSphs have , the dark matter fractions of massive ones decrease to , but there are large uncertainties. On the other hand, due to resolution limits, the simulation results cannot reach low-mass galaxies less than . In order to inspect whether the simulated fractions are consistent with the observed ones, it is necessary to perform much higher resolution cosmological simulations.
We also estimate the dynamical mass-to-light ratios (MLs) within the half-light radii of our sample dwarf galaxies . We confirm that most Galactic dwarf satellites agree with the scaling relation between the dynamical MLs and stellar mass proposed by an NFW dark matter density profile as well as the relation between the MLs and the averaged metallicities at low-metallicity end, even though there are large uncertainties in MLs (Figure 5).
Using these scaling relations for MLs and the universal MZR, we discuss the tidal evolution of the dwarf satellites based on empirical tidal evolutionary tracks. From the evolutionary tracks, if these satellites have cuspy dark matter halos, tidal stripping does not alter much the dynamical mass-to-light ratios. On the other hand, the MLs of the satellites having constant density cores might be changed more clearly. In light of the MZR, tidal stripping might be capable of decreasing a stellar mass. We suggest that these results imply that the large scatter of metallicity at the faint-end of the MZR can be explained by tidal stripping of less-massive satellites associated with cuspy dark matter halos.
To ensure our conclusions, especially for tidal evolution for the satellites, it is necessary to perform high-resolution hydrodynamical simulations in Milky Way analogs so that less-massive dwarf satellites can also be resolved (e.g., Applebaum et al., 2021; Grand et al., 2021; Hirai et al., 2022). In this regard, using high-resolution simulations in our group, we will make an attempt to investigate more details of the chemo-dynamical evolution of the dwarf satellites in a forthcoming paper. It is also important to estimate more accurately the dark matter density profiles of the Galactic dwarf satellites. To this end, incorporating higher-order moments of their velocity distributions can help to determine uniquely the kinematic properties of their stellar systems and to mitigate a degeneracy between dark matter density and stellar anisotropy. Furthermore, the next generation wide-field spectroscopic surveys with the Subaru Prime Focus Spectrograph (Takada et al., 2014; Tamura et al., 2016) and high-precision spectroscopy attached on the Thirty Meter Telescope (Simard et al., 2016) will enable us to obtain unprecedented data for stellar kinematics and chemical abundances for the satellites to tighter constrain their dark matter distributions.
Acknowledgements
We are grateful to the referee for her/his careful reading of our paper and thoughtful comments. This work was supported in part by the MEXT Grant-in-Aid for Scientific Research (No. JP20H01895, JP21K13909, JP21H05447 and JP23H04009 for K.H., No. JP22KJ0157, JP20K14532, JP21H04499, JP21K03614 and JP22H01259 for Y.H., No. JP18H05437, and JP21H05448 for M.C., No. JP20H05245 and JP21H01122 for T.I.). Numerical computations were partially carried out on Aterui II supercomputer at Center for Computational Astrophysics, CfCA, of National Astronomical Observatory of Japan. Y.H. and T.I. have been supported by JICFuS and MEXT as “Program for Promoting Research on the Supercomputer Fugaku” (Structure and Evolution of the Universe Unraveled by Fusion of Simulation and AI, Grant No. JPMXP1020230406). T. I. has been supported by IAAR Research Support Program, Chiba University, Japan. This work was supported in part by the National Science Foundation under Grant No. PHY-1430152 (JINA Center for the Evolution of the Elements).
Appendix A Tabulated model parameter constraints
In this appendix, we present the constraints on the individual model parameters for all sample dwarf galaxies. Table 2 shows the estimated parameters with the error values indicate the 68% confidence intervals computed from the posterior distribution functions of the parameters. We also show the dynamical mass-to-light ratios within their half-light radii, the dark matter densities at 150 pc, and the Bayes factors for the addition of a free halo axis ratio.
| Object | ( | 2 | 2 | |||||||||
|---|---|---|---|---|---|---|---|---|---|---|---|---|
| [pc] | [ pc-3] | [deg] | [] | [ kpc-3] | ||||||||
| Antlia 2 | 1.0 | 0.5 | ||||||||||
| Botes I | 0.0 | -0.4 | ||||||||||
| Canes Venatici I | -0.1 | 0.0 | ||||||||||
| Canes Venatici II | 0.0 | -0.1 | ||||||||||
| Coma Berenices | 0.0 | 0.0 | ||||||||||
| Crater 2 | 0.3 | 0.0 | ||||||||||
| Draco 2 | -0.1 | -0.1 | ||||||||||
| Eridanus II | -0.1 | 0.4 | ||||||||||
| Grus 1 | 0.1 | 0.2 | ||||||||||
| Grus 2 | -0.1 | -0.1 | ||||||||||
| Hercules | 0.0 | 0.0 | ||||||||||
| Horologium I | 0.1 | 0.1 | ||||||||||
| Hydra II | 0.0 | -0.1 | ||||||||||
| Leo IV | 0.0 | -0.1 | ||||||||||
| Leo V | 0.1 | 0.0 | ||||||||||
| Leo T | -0.1 | 0.0 | ||||||||||
| Pisces II | 0.0 | -0.1 | ||||||||||
| Reticulum II | 0.0 | 0.0 | ||||||||||
| Segue 1 | 0.0 | 0.0 | ||||||||||
| Segue 2 | 0.1 | 0.2 | ||||||||||
| Triangulum II | 0.1 | 0.0 | ||||||||||
| Tucana 2 | -0.2 | 0.1 | ||||||||||
| Tucana 3 | 0.0 | 0.0 | ||||||||||
| Tucana 4 | 0.1 | 0.0 | ||||||||||
| Ursa Major I | 0.1 | 0.3 | ||||||||||
| Ursa Major II | -0.1 | 0.2 | ||||||||||
| Willman 1 | 0.1 | -0.1 |
a The Bayes factor (BF) is defined by for subscript “1”, and for subscript “2”, respectively, where , , and are the mean posterior probabilities of mass models with spherical dark matter halo (), with non-spherical dark matter halo (the axial ratio is fixed as a projected stellar axial ratio: ), and with the best posteriors respectively. In each model, we keep the stellar distributions are axisymmetric shape, that is, stellar axial ratio are not unity. indicates observational data for each dSph. To confirm this BF analysis, Akaike’s Information Criterion with a correction for small sample sizes (c-AIC) is also introduced. We compute c-AIC1 and c-AIC2 (subscript number is the same as the BF) for all dSphs and find that c-AICc-AIC, which means that c-AIC analysis can follow the results from the BF analysis.
Appendix B Posterior PDFs
Here we show the results of parameter estimations based on an MCMC fitting analysis. Figures 6 and 7 display the posterior PDFs for Antlia 2, Boötes I, Canes Venatici I, Coma Berenices, Crater 2, Eridanus II, Segue 1, and Willman 1 as the representative satellites, which have the largest kinematics samples among our sample in this work.
Units of and are [pc] and pc, respectively.

References
- Applebaum et al. (2021) Applebaum, E., Brooks, A. M., Christensen, C. R., et al. 2021, ApJ, 906, 96, doi: 10.3847/1538-4357/abcafa
- Battaglia & Nipoti (2022) Battaglia, G., & Nipoti, C. 2022, Nature Astronomy, doi: 10.1038/s41550-022-01638-7
- Battaglia et al. (2022) Battaglia, G., Taibi, S., Thomas, G. F., & Fritz, T. K. 2022, A&A, 657, A54, doi: 10.1051/0004-6361/202141528
- Behroozi et al. (2013) Behroozi, P. S., Wechsler, R. H., & Wu, H.-Y. 2013, ApJ, 762, 109, doi: 10.1088/0004-637X/762/2/109
- Belokurov et al. (2007) Belokurov, V., Zucker, D. B., Evans, N. W., et al. 2007, ApJ, 654, 897, doi: 10.1086/509718
- Belokurov et al. (2009) Belokurov, V., Walker, M. G., Evans, N. W., et al. 2009, MNRAS, 397, 1748, doi: 10.1111/j.1365-2966.2009.15106.x
- Belokurov et al. (2010) —. 2010, ApJ, 712, L103, doi: 10.1088/2041-8205/712/1/L103
- Binney & Mamon (1982) Binney, J., & Mamon, G. A. 1982, MNRAS, 200, 361, doi: 10.1093/mnras/200.2.361
- Binney & Tremaine (2008) Binney, J., & Tremaine, S. 2008, Galactic Dynamics: Second Edition
- Borukhovetskaya et al. (2022) Borukhovetskaya, A., Navarro, J. F., Errani, R., & Fattahi, A. 2022, MNRAS, 512, 5247, doi: 10.1093/mnras/stac653
- Boylan-Kolchin et al. (2011) Boylan-Kolchin, M., Bullock, J. S., & Kaplinghat, M. 2011, MNRAS, 415, L40, doi: 10.1111/j.1745-3933.2011.01074.x
- Boylan-Kolchin et al. (2012) —. 2012, MNRAS, 422, 1203, doi: 10.1111/j.1365-2966.2012.20695.x
- Bullock & Boylan-Kolchin (2017) Bullock, J. S., & Boylan-Kolchin, M. 2017, /garaa, 55, 343, doi: 10.1146/annurev-astro-091916-055313
- Caldwell et al. (2017) Caldwell, N., Walker, M. G., Mateo, M., et al. 2017, ApJ, 839, 20, doi: 10.3847/1538-4357/aa688e
- Cappellari (2008) Cappellari, M. 2008, MNRAS, 390, 71, doi: 10.1111/j.1365-2966.2008.13754.x
- Chiti et al. (2022a) Chiti, A., Simon, J. D., Frebel, A., et al. 2022a, arXiv e-prints, arXiv:2206.04580. https://arxiv.org/abs/2206.04580
- Chiti et al. (2022b) Chiti, A., Frebel, A., Ji, A. P., et al. 2022b, arXiv e-prints, arXiv:2205.01740. https://arxiv.org/abs/2205.01740
- Correa (2021) Correa, C. A. 2021, MNRAS, 503, 920, doi: 10.1093/mnras/stab506
- Dall’Ora et al. (2006) Dall’Ora, M., Clementini, G., Kinemuchi, K., et al. 2006, ApJ, 653, L109, doi: 10.1086/510665
- de Jong et al. (2010) de Jong, J. T. A., Martin, N. F., Rix, H.-W., et al. 2010, ApJ, 710, 1664, doi: 10.1088/0004-637X/710/2/1664
- de Jong et al. (2008) de Jong, J. T. A., Harris, J., Coleman, M. G., et al. 2008, ApJ, 680, 1112, doi: 10.1086/587835
- Di Cintio et al. (2021) Di Cintio, A., Mostoghiu, R., Knebe, A., & Navarro, J. F. 2021, MNRAS, 506, 531, doi: 10.1093/mnras/stab1682
- Drlica-Wagner et al. (2015) Drlica-Wagner, A., Bechtol, K., Rykoff, E. S., et al. 2015, ApJ, 813, 109, doi: 10.1088/0004-637X/813/2/109
- Ebisu et al. (2022) Ebisu, T., Ishiyama, T., & Hayashi, K. 2022, Phys. Rev. D, 105, 023016, doi: 10.1103/PhysRevD.105.023016
- Erkal et al. (2018) Erkal, D., Li, T. S., Koposov, S. E., et al. 2018, MNRAS, 481, 3148, doi: 10.1093/mnras/sty2518
- Errani & Navarro (2021) Errani, R., & Navarro, J. F. 2021, MNRAS, 505, 18, doi: 10.1093/mnras/stab1215
- Errani et al. (2018) Errani, R., Peñarrubia, J., & Walker, M. G. 2018, MNRAS, 481, 5073, doi: 10.1093/mnras/sty2505
- Errani et al. (2015) Errani, R., Penarrubia, J., & Tormen, G. 2015, MNRAS, 449, L46, doi: 10.1093/mnrasl/slv012
- Evans et al. (2009) Evans, N. W., An, J., & Walker, M. G. 2009, MNRAS, 393, L50, doi: 10.1111/j.1745-3933.2008.00596.x
- Faerman et al. (2013) Faerman, Y., Sternberg, A., & McKee, C. F. 2013, ApJ, 777, 119, doi: 10.1088/0004-637X/777/2/119
- Fattahi et al. (2018) Fattahi, A., Navarro, J. F., Frenk, C. S., et al. 2018, MNRAS, 476, 3816, doi: 10.1093/mnras/sty408
- Foreman-Mackey (2016) Foreman-Mackey, D. 2016, The Journal of Open Source Software, 1, 24, doi: 10.21105/joss.00024
- Frebel & Norris (2015) Frebel, A., & Norris, J. E. 2015, ARA&A, 53, 631, doi: 10.1146/annurev-astro-082214-122423
- Fukushige & Makino (1997) Fukushige, T., & Makino, J. 1997, /gapjl, 477, L9, doi: 10.1086/310516
- Gaia Collaboration et al. (2018) Gaia Collaboration, Helmi, A., van Leeuwen, F., et al. 2018, A&A, 616, A12, doi: 10.1051/0004-6361/201832698
- Gaia Collaboration et al. (2021) Gaia Collaboration, Brown, A. G. A., Vallenari, A., et al. 2021, A&A, 649, A1, doi: 10.1051/0004-6361/202039657
- Genina et al. (2020a) Genina, A., Read, J. I., Fattahi, A., & Frenk, C. S. 2020a, arXiv e-prints, arXiv:2011.09482. https://arxiv.org/abs/2011.09482
- Genina et al. (2020b) Genina, A., Read, J. I., Frenk, C. S., et al. 2020b, MNRAS, 498, 144, doi: 10.1093/mnras/staa2352
- Geringer-Sameth et al. (2015) Geringer-Sameth, A., Koushiappas, S. M., & Walker, M. 2015, ApJ, 801, 74, doi: 10.1088/0004-637X/801/2/74
- Grand et al. (2021) Grand, R. J. J., Marinacci, F., Pakmor, R., et al. 2021, MNRAS, 507, 4953, doi: 10.1093/mnras/stab2492
- Greco et al. (2008) Greco, C., Dall’Ora, M., Clementini, G., et al. 2008, ApJ, 675, L73, doi: 10.1086/533585
- Harris et al. (2020) Harris, C. R., Millman, K. J., van der Walt, S. J., et al. 2020, Nature, 585, 357, doi: 10.1038/s41586-020-2649-2
- Hastings (1970) Hastings, W. K. 1970, Biometrika, 57, 97, doi: 10.1093/biomet/57.1.97
- Hayashi & Chiba (2012) Hayashi, K., & Chiba, M. 2012, ApJ, 755, 145, doi: 10.1088/0004-637X/755/2/145
- Hayashi & Chiba (2015) —. 2015, ApJ, 810, 22, doi: 10.1088/0004-637X/810/1/22
- Hayashi et al. (2020) Hayashi, K., Chiba, M., & Ishiyama, T. 2020, ApJ, 904, 45, doi: 10.3847/1538-4357/abbe0a
- Hayashi et al. (2021a) Hayashi, K., Ferreira, E. G. M., & Chan, H. Y. J. 2021a, ApJ, 912, L3, doi: 10.3847/2041-8213/abf501
- Hayashi et al. (2021b) Hayashi, K., Ibe, M., Kobayashi, S., Nakayama, Y., & Shirai, S. 2021b, Phys. Rev. D, 103, 023017, doi: 10.1103/PhysRevD.103.023017
- Hernquist (1990) Hernquist, L. 1990, ApJ, 356, 359, doi: 10.1086/168845
- Hirai et al. (2022) Hirai, Y., Beers, T. C., Chiba, M., et al. 2022, MNRAS, 517, 4856, doi: 10.1093/mnras/stac2489
- Hubble (1926) Hubble, E. P. 1926, ApJ, 64, 321, doi: 10.1086/143018
- Hunter (2007) Hunter, J. D. 2007, Computing in Science & Engineering, 9, 90, doi: 10.1109/MCSE.2007.55
- Ishiyama & Ando (2020) Ishiyama, T., & Ando, S. 2020, MNRAS, 492, 3662, doi: 10.1093/mnras/staa069
- Ishiyama et al. (2021) Ishiyama, T., Prada, F., Klypin, A. A., et al. 2021, MNRAS, 506, 4210, doi: 10.1093/mnras/stab1755
- Jenkins et al. (2020) Jenkins, S., Li, T. S., Pace, A. B., et al. 2020, arXiv e-prints, arXiv:2101.00013. https://arxiv.org/abs/2101.00013
- Ji et al. (2021) Ji, A. P., Koposov, S. E., Li, T. S., et al. 2021, ApJ, 921, 32, doi: 10.3847/1538-4357/ac1869
- Jiang et al. (2021) Jiang, F., Kaplinghat, M., Lisanti, M., & Slone, O. 2021, arXiv e-prints, arXiv:2108.03243. https://arxiv.org/abs/2108.03243
- Kaplinghat et al. (2019) Kaplinghat, M., Valli, M., & Yu, H.-B. 2019, MNRAS, 490, 231, doi: 10.1093/mnras/stz2511
- Kirby et al. (2013a) Kirby, E. N., Boylan-Kolchin, M., Cohen, J. G., et al. 2013a, ApJ, 770, 16, doi: 10.1088/0004-637X/770/1/16
- Kirby et al. (2013b) Kirby, E. N., Cohen, J. G., Guhathakurta, P., et al. 2013b, ApJ, 779, 102, doi: 10.1088/0004-637X/779/2/102
- Kirby et al. (2017) Kirby, E. N., Cohen, J. G., Simon, J. D., et al. 2017, ApJ, 838, 83, doi: 10.3847/1538-4357/aa6570
- Kirby et al. (2015) Kirby, E. N., Simon, J. D., & Cohen, J. G. 2015, ApJ, 810, 56, doi: 10.1088/0004-637X/810/1/56
- Koposov et al. (2015a) Koposov, S. E., Belokurov, V., Torrealba, G., & Evans, N. W. 2015a, ApJ, 805, 130, doi: 10.1088/0004-637X/805/2/130
- Koposov et al. (2015b) Koposov, S. E., Casey, A. R., Belokurov, V., et al. 2015b, ApJ, 811, 62, doi: 10.1088/0004-637X/811/1/62
- Kuehn et al. (2008) Kuehn, C., Kinemuchi, K., Ripepi, V., et al. 2008, ApJ, 674, L81, doi: 10.1086/529137
- Laevens et al. (2015a) Laevens, B. P. M., Martin, N. F., Bernard, E. J., et al. 2015a, ApJ, 813, 44, doi: 10.1088/0004-637X/813/1/44
- Laevens et al. (2015b) Laevens, B. P. M., Martin, N. F., Ibata, R. A., et al. 2015b, ApJ, 802, L18, doi: 10.1088/2041-8205/802/2/L18
- Lazar et al. (2020) Lazar, A., Bullock, J. S., Boylan-Kolchin, M., et al. 2020, MNRAS, 497, 2393, doi: 10.1093/mnras/staa2101
- Li et al. (2021) Li, H., Hammer, F., Babusiaux, C., et al. 2021, ApJ, 916, 8, doi: 10.3847/1538-4357/ac0436
- Li et al. (2017) Li, T. S., Simon, J. D., Drlica-Wagner, A., et al. 2017, ApJ, 838, 8, doi: 10.3847/1538-4357/aa6113
- Li et al. (2018) Li, T. S., Simon, J. D., Kuehn, K., et al. 2018, ApJ, 866, 22, doi: 10.3847/1538-4357/aadf91
- Łokas (2002) Łokas, E. L. 2002, MNRAS, 333, 697, doi: 10.1046/j.1365-8711.2002.05457.x
- Longeard et al. (2018) Longeard, N., Martin, N., Starkenburg, E., et al. 2018, MNRAS, 480, 2609, doi: 10.1093/mnras/sty1986
- Lovell et al. (2018) Lovell, M. R., Pillepich, A., Genel, S., et al. 2018, MNRAS, 481, 1950, doi: 10.1093/mnras/sty2339
- Lu et al. (2021) Lu, P., Takhistov, V., Gelmini, G. B., et al. 2021, ApJ, 908, L23, doi: 10.3847/2041-8213/abdcb6
- Mamon et al. (2013) Mamon, G. A., Biviano, A., & Boué, G. 2013, MNRAS, 429, 3079, doi: 10.1093/mnras/sts565
- Mamon et al. (2015) Mamon, G. A., Chevalier, J., Romanowsky, A. J., & Wojtak, R. 2015, in Galaxy Masses as Constraints of Formation Models, ed. M. Cappellari & S. Courteau, Vol. 311, 16–19, doi: 10.1017/S1743921315003312
- Martin et al. (2008) Martin, N. F., de Jong, J. T. A., & Rix, H.-W. 2008, ApJ, 684, 1075, doi: 10.1086/590336
- Martin et al. (2015) Martin, N. F., Nidever, D. L., Besla, G., et al. 2015, ApJ, 804, L5, doi: 10.1088/2041-8205/804/1/L5
- Martínez-Vázquez et al. (2019) Martínez-Vázquez, C. E., Vivas, A. K., Gurevich, M., et al. 2019, MNRAS, 490, 2183, doi: 10.1093/mnras/stz2609
- Mateo (1998) Mateo, M. L. 1998, ARA&A, 36, 435, doi: 10.1146/annurev.astro.36.1.435
- McConnachie (2012) McConnachie, A. W. 2012, AJ, 144, 4, doi: 10.1088/0004-6256/144/1/4
- McConnachie & Venn (2020) McConnachie, A. W., & Venn, K. A. 2020, Research Notes of the American Astronomical Society, 4, 229, doi: 10.3847/2515-5172/abd18b
- Mercado et al. (2021) Mercado, F. J., Bullock, J. S., Boylan-Kolchin, M., et al. 2021, MNRAS, 501, 5121, doi: 10.1093/mnras/staa3958
- Metropolis et al. (1953) Metropolis, N., Rosenbluth, A. W., Rosenbluth, M. N., Teller, A. H., & Teller, E. 1953, J. Chem. Phys., 21, 1087, doi: 10.1063/1.1699114
- Miyoshi & Chiba (2020) Miyoshi, T., & Chiba, M. 2020, ApJ, 905, 109, doi: 10.3847/1538-4357/abc486
- Moore et al. (1999) Moore, B., Quinn, T., Governato, F., Stadel, J., & Lake, G. 1999, MNRAS, 310, 1147, doi: 10.1046/j.1365-8711.1999.03039.x
- Moreno et al. (2022) Moreno, J., Danieli, S., Bullock, J. S., et al. 2022, Nature Astronomy, 6, 496, doi: 10.1038/s41550-021-01598-4
- Moster et al. (2013) Moster, B. P., Naab, T., & White, S. D. M. 2013, MNRAS, 428, 3121, doi: 10.1093/mnras/sts261
- Muñoz et al. (2018) Muñoz, R. R., Côté, P., Santana, F. A., et al. 2018, ApJ, 860, 66, doi: 10.3847/1538-4357/aac16b
- Nishikawa et al. (2020) Nishikawa, H., Boddy, K. K., & Kaplinghat, M. 2020, Phys. Rev. D, 101, 063009, doi: 10.1103/PhysRevD.101.063009
- Peñarrubia et al. (2008) Peñarrubia, J., Navarro, J. F., & McConnachie, A. W. 2008, ApJ, 673, 226, doi: 10.1086/523686
- Plummer (1911) Plummer, H. C. 1911, MNRAS, 71, 460, doi: 10.1093/mnras/71.5.460
- Read & Steger (2017) Read, J. I., & Steger, P. 2017, MNRAS, 471, 4541, doi: 10.1093/mnras/stx1798
- Read et al. (2019) Read, J. I., Walker, M. G., & Steger, P. 2019, MNRAS, 484, 1401, doi: 10.1093/mnras/sty3404
- Read et al. (2021) Read, J. I., Mamon, G. A., Vasiliev, E., et al. 2021, MNRAS, 501, 978, doi: 10.1093/mnras/staa3663
- Rey et al. (2019) Rey, M. P., Pontzen, A., Agertz, O., et al. 2019, ApJ, 886, L3, doi: 10.3847/2041-8213/ab53dd
- Richardson & Fairbairn (2014) Richardson, T., & Fairbairn, M. 2014, MNRAS, 441, 1584, doi: 10.1093/mnras/stu691
- Richstone & Tremaine (1984) Richstone, D. O., & Tremaine, S. 1984, ApJ, 286, 27, doi: 10.1086/162572
- Romanowsky & Kochanek (1997) Romanowsky, A. J., & Kochanek, C. S. 1997, MNRAS, 287, 35, doi: 10.1093/mnras/287.1.35
- Sameie et al. (2020) Sameie, O., Chakrabarti, S., Yu, H.-B., et al. 2020, arXiv e-prints, arXiv:2006.06681. https://arxiv.org/abs/2006.06681
- Simard et al. (2016) Simard, L., Ellerbroek, B., Bhatia, R., Radovan, M., & Chisholm, E. 2016, in Society of Photo-Optical Instrumentation Engineers (SPIE) Conference Series, Vol. 9908, Ground-based and Airborne Instrumentation for Astronomy VI, ed. C. J. Evans, L. Simard, & H. Takami, 99081V, doi: 10.1117/12.2234058
- Simon (2019) Simon, J. D. 2019, ARA&A, 57, 375, doi: 10.1146/annurev-astro-091918-104453
- Simon & Geha (2007) Simon, J. D., & Geha, M. 2007, ApJ, 670, 313, doi: 10.1086/521816
- Simon et al. (2011) Simon, J. D., Geha, M., Minor, Q. E., et al. 2011, ApJ, 733, 46, doi: 10.1088/0004-637X/733/1/46
- Simon et al. (2017) Simon, J. D., Li, T. S., Drlica-Wagner, A., et al. 2017, ApJ, 838, 11, doi: 10.3847/1538-4357/aa5be7
- Simon et al. (2020) Simon, J. D., Li, T. S., Erkal, D., et al. 2020, ApJ, 892, 137, doi: 10.3847/1538-4357/ab7ccb
- Springel et al. (2008) Springel, V., Wang, J., Vogelsberger, M., et al. 2008, MNRAS, 391, 1685, doi: 10.1111/j.1365-2966.2008.14066.x
- Springel et al. (2018) Springel, V., Pakmor, R., Pillepich, A., et al. 2018, MNRAS, 475, 676, doi: 10.1093/mnras/stx3304
- Takada et al. (2014) Takada, M., Ellis, R. S., Chiba, M., et al. 2014, PASJ, 66, R1, doi: 10.1093/pasj/pst019
- Tamura et al. (2016) Tamura, N., Takato, N., Shimono, A., et al. 2016, in Society of Photo-Optical Instrumentation Engineers (SPIE) Conference Series, Vol. 9908, Ground-based and Airborne Instrumentation for Astronomy VI, ed. C. J. Evans, L. Simard, & H. Takami, 99081M, doi: 10.1117/12.2232103
- Tempel & Tenjes (2006) Tempel, E., & Tenjes, P. 2006, MNRAS, 371, 1269, doi: 10.1111/j.1365-2966.2006.10741.x
- Tollet et al. (2016) Tollet, E., Macciò, A. V., Dutton, A. A., et al. 2016, MNRAS, 456, 3542, doi: 10.1093/mnras/stv2856
- Torrealba et al. (2016) Torrealba, G., Koposov, S. E., Belokurov, V., & Irwin, M. 2016, MNRAS, 459, 2370, doi: 10.1093/mnras/stw733
- Torrealba et al. (2019) Torrealba, G., Belokurov, V., Koposov, S. E., et al. 2019, MNRAS, 488, 2743, doi: 10.1093/mnras/stz1624
- Virtanen et al. (2020) Virtanen, P., Gommers, R., Oliphant, T. E., et al. 2020, Nature Methods, 17, 261, doi: 10.1038/s41592-019-0686-2
- Vogelsberger et al. (2014) Vogelsberger, M., Genel, S., Springel, V., et al. 2014, MNRAS, 444, 1518, doi: 10.1093/mnras/stu1536
- Wadekar & Farrar (2021) Wadekar, D., & Farrar, G. R. 2021, Phys. Rev. D, 103, 123028, doi: 10.1103/PhysRevD.103.123028
- Walker et al. (2009) Walker, M. G., Mateo, M., & Olszewski, E. W. 2009, AJ, 137, 3100, doi: 10.1088/0004-6256/137/2/3100
- Watkins et al. (2013) Watkins, L. L., van de Ven, G., den Brok, M., & van den Bosch, R. C. E. 2013, MNRAS, 436, 2598, doi: 10.1093/mnras/stt1756
- Wetzel et al. (2016) Wetzel, A. R., Hopkins, P. F., Kim, J.-h., et al. 2016, ApJ, 827, L23, doi: 10.3847/2041-8205/827/2/L23
- Wheeler et al. (2017) Wheeler, C., Pace, A. B., Bullock, J. S., et al. 2017, MNRAS, 465, 2420, doi: 10.1093/mnras/stw2583
- Willman et al. (2011) Willman, B., Geha, M., Strader, J., et al. 2011, AJ, 142, 128, doi: 10.1088/0004-6256/142/4/128
- Wolf et al. (2010) Wolf, J., Martinez, G. D., Bullock, J. S., et al. 2010, MNRAS, 406, 1220, doi: 10.1111/j.1365-2966.2010.16753.x
- Woo et al. (2008) Woo, J., Courteau, S., & Dekel, A. 2008, MNRAS, 390, 1453, doi: 10.1111/j.1365-2966.2008.13770.x
- Zhao (1996) Zhao, H. 1996, MNRAS, 278, 488, doi: 10.1093/mnras/278.2.488
- Zoutendijk et al. (2021) Zoutendijk, S. L., Brinchmann, J., Bouché, N. F., et al. 2021, A&A, 651, A80, doi: 10.1051/0004-6361/202040239