Abstract
In this paper we critically discuss several examples of two-dimensional electronic systems displaying interaction-driven metal-insulator transitions of the Mott (or Wigner–Mott) type, including dilute two-dimension electron gases (2DEG) in semiconductors, Mott organic materials, as well as the recently discovered transition-metal dichalcogenide (TMD) moiré bilayers. Remarkably similar behavior is found in all these systems, which is starting to paint a robust picture of Mott criticality. Most notable, on the metallic side a resistivity maximum is observed whose temperature scale vanishes at the transition. We compare the available experimental data on these systems to three existing theoretical scenarios: spinon theory, Dynamical Mean Field Theory (DMFT) and percolation theory. We show that the DMFT and percolation pictures for Mott criticality can be distinguished by studying the origins of the resistivity maxima using an analysis of the dielectric response.
keywords:
Mott transition; quantum criticality; resistivity maxima; dielectric response; dilute 2DEGs; Mott organics; twisted transition-metal dichalcogenide bilayers; dynamical mean field theory; percolation theory; spinon theory1 \issuenum1 \articlenumber0 \externaleditorAcademic Editor: Dmitri Donetski \datereceived4 May 2022 \dateaccepted3 June 2022 \datepublished28 June 2022 \hreflinkhttps://doi.org/ \TitleHow to Recognize the Universal Aspects of Mott Criticality? \TitleCitationHow to Recognize the Universal Aspects of Mott Criticality? \AuthorYuting Tan 1,*, Vladimir Dobrosavljević 1,* and Louk Rademaker 2,* \AuthorNamesYuting Tan, Vladimir Dobrosavljević and Louk Rademaker \AuthorCitationTan, Y.; Dobrosavljević, V.; Rademaker, L. \corresCorrespondence: ytan@magnet.fsu.edu (Y.T.); vlad@magnet.fsu.edu (V.D.); louk.rademaker@gmail.com (L.R.)
1 Introduction
The physics of strongly correlated matter has many faces. Still, for a majority of systems the underlying theme is the role of “Mottness” Phillips (2006). It is clear that if one aspect of strong correlations should be understood first, it should be the fundamental nature of the Mott metal-insulator transition Mott (1990). Its simplest reincarnation is the transition induced by tuning the bandwidth at half-filling, a setup that produced rather spectacular advances in recent years. Several systems were identified as nearly-ideal realizations of this paradigm, allowing systematic study using a wide arsenal of experimental probes.
In this article we present an overview of three classes of two-dimensional experimental systems that exhibit bandwidth-controlled Mott criticality: dilute two-dimensional electron gases in semiconductors, “Mott-organic” compounds, and transition-metal dichalcogenide moiré systems. Thereby we aim to present the experimental facts as “bland” as possible, in Section 3, without favoring one or the other theoretical explanation. The remarkable similarities between these model systems suggests a robust universality, including characteristic behavior such as the appearance of resistivity maxima.
Possible explanations of two-dimensional Mott criticality follow in the section thereafter (Section 4), where the experimental distinguishable features of each theory takes the forefront. This is followed by a separate discussion of the largely-overlooked utility of dielectric spectroscopy in Section 5, in not only identifying phase segregation and spatial inhomogeneity, but also in revealing the thermal destruction of coherent quasiparticles associated with Landau’s Fermi liquid theory.
2 In Search of Mott Criticality
Condensed matter physics, or recently for sales purposes re-branded as “quantum matter physics”, is the study of electric and magnetic properties of materials that surround us. The grand question that trumps all others is: how to understand which materials conduct electricity and which are insulating? Traditionally, a conducting material is called a metal—not to be confused with the chemical, metallurgical or astronomical meaning of that word. Our main question (metal or insulator?) has not only tremendous technological applications (in fact, all modern electronic technology depends on our ability to rapidly switch materials between metallic and insulating behavior), but also requires a thorough understanding of the problem of emergent behavior of many interacting quantum-mechanical electrons and ions.
Only at zero temperature does there exist a sharp difference between insulators and metals Dobrosavljević et al. (2012). There are three distinct possibilities: zero conductivity means insulating; zero resistivity means a superconductor; and anything in between is a metal . At any nonzero temperature, an insulator typically has activated behavior whereas the standard Fermi liquid theory of a metal predicts a temperature-squared increase of the resistivity . It has therefore become common-place to use the derivative of the resistivity as a measure of whether something is conducting () or insulating ()—but this is highly misleading! As we will show later in Section 3, close to a Mott metal-insulator transition we often find non-monotonic behavior of the resistivity as a function of temperature, making the ‘derivative’ criterion useless. Even worse, there exist cases where the resistivity has but at zero temperature it does not diverge, signalling that this is not a true insulator (see e.g., Cao et al. (2018); Szentpéteri et al. (2021)). Another example is the case of Mooij correlations Mooij (1973); Ciuchi et al. (2018), where the temperature-derivative of the resistivity in a metal can become negative. Consequently, since only at zero temperature the insulator/metal distinction is well-defined, we must stick with that definition. Regardless of the slope, a material is a metal if its resistivity does not diverge as .
Many materials can be understood within the framework of band theory and its extensions such as Fermi liquid, Boltzmann transport, and density functional theory. This framework provides a very simple answer to the metal-or-insulator question: if the Fermi level lies in the middle of a band gap, the system is insulating; otherwise, the system behaves as a metal. This concept has the important consequence that for a crystalline material with (up to some weak disorder) well-defined unit cells, insulators can only appear when there is an even number of electrons per unit cell. Consequently, within the band theory picture, there exist only three possible routes to induce a metal-to-insulator transition: by changing the electronic density; via spontaneous symmetry breaking; or via band overlap when the filling is even. An example of the first is doping a semiconductor, which is the metal-insulator transition we induce on a daily basis inside transistors. An example of the second is the transition into antiferromagnetic ordering: when the system is at half-filling of a band (meaning one electron per unit cell), after antiferromagnetic unit cell doubling there are two electrons per unit cell, and the system can become a band insulator. The third case can be realized by for example straining a system such that the band gap changes from positive to negative.
There are, however, two main exceptions to the paradigm of band theory. On the one hand, disorder can become so large as to prevent the motion of the charge carriers—this is known as Anderson localization Evers and Mirlin (2008). On the other hand, the presence of very strong electron-electron interactions can force the electrons to become “stuck” like in a traffic jam—this is known as Mott insulation Mott (1990). The standard model of Mott insulation is the Hubbard model with a tight-binding Hamiltonian:
| (1) |
where is the nearest-neighbor hopping on some lattice and is the onsite repulsion. When , the system is a metal when half-filled. When , it becomes energetically favorable to occupy each site with exactly one electron rather than to fill bands up to the Fermi level. The resulting Mott state can therefore not be described by band theory!
Mott insulators have been observed in a wide variety of materials, most famously transition-metal oxides, including high superconducting cup rates Imada et al. (1998). Observing a clear transition from a standard Fermi liquid metal to a Mott insulator, however, is quite elusive. This transition can be induced either by changing the electronic density (“filling-controlled”) or by changing the ratio (“bandwidth-controlled”). The filling-controlled Mott transition Lee et al. (2006) notoriously leads to a whole zoo of different instabilities, pseudogaps, and strange metal behavior, and is typically masked at low temperatures by superconductivity. The bandwidth-controlled Mott transition is, in contrast, often masked by (antiferromagnetic) spin order that hides any Mottness behind the veil of unit cell doubling.
This might, at first, suggest that Mott criticality is something unattainable. By “criticality” we mean that approaching the Mott transition we find vanishing energy scales, and that the resistivity curves display scaling behavior. There are, however, two clever tricks to realize Mott criticality. The first trick is dimensionality: a transition that is strongly first-order in dimensions often becomes continuous or weakly first-order in dimensions. The most striking example of this is, of course, the solidification of 3He. The second, and perhaps even more important trick is frustration: if the lattice structure is highly frustrated (with competing magnetic interactions) one can avoid Balents (2010) antiferromagnetic ordering altogether—revealing the true Mott transition.
In this review we, therefore, focus on three classes of systems that are indeed (quasi) two-dimensional as well as frustrated: Wigner crystals in extremely dilute two-dimensional electron gases; layered Mott organic compounds; and the more recent addition of transition-metal dichalcogenide (TMD) moiré bilayers. Indeed, as we will show in Section 3, these systems all seem to exhibit remarkably similar distinct features, including clear signatures of critical resistivity scaling. Because these systems all have a fixed electron density per unit cell of (at least in the insulating limit), the observed transitions are plausibly within the universality class of bandwidth-tuned Mott transitions.
A brief side-note is in order: we briefly mentioned superconductivity and disorder-induced insulators. These phases can also have a continuous transition between them, the so-called superconductor-to-insulator transition Sondhi et al. (1997); Saito et al. (2016). This, however, is an interesting topic that falls outside the scope of this review. Similarly, we also will not consider disorder-driven metal-insulator transitions Lee and Ramakrishnan (1985); Belitz and Kirkpatrick (1994), since this regime typically does not include any Mottness. More general but also somewhat older reviews of metal-insulator criticality can be found in Refs. Imada et al. (1998); Abrahams et al. (2001); Spivak et al. (2010); Dobrosavljević et al. (2012); Kravchenko (2017).
3 Experiments
Given that experimental results should always be leading, the aim of this section is to introduce three material systems that are likely exhibiting a bandwidth-tuned Mott metal-insulator transition: dilute 2DEGs, organics, and moiré systems. To support the clarity of interpretation, we will stress experimental similarities between these systems without much room for theoretical guesswork—that is the next section’s realm.
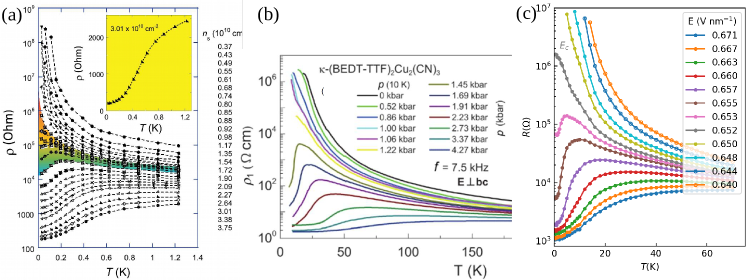
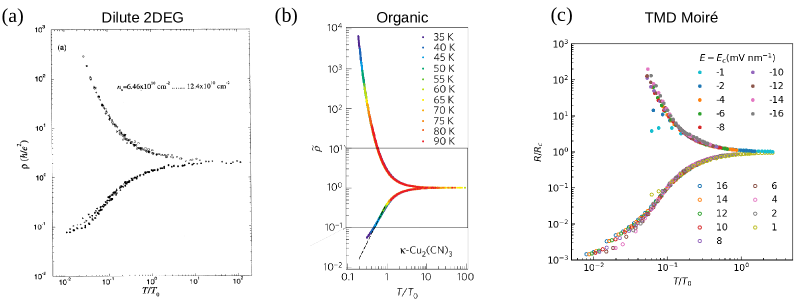
While each system has a different tuning parameter (density, pressure, or field), the electrical resistivity through the transition is the key observable, see Figure 1. Its behavior reveals how the transport gap decreases when we approach the transition from the insulating side; as well as how the resistivity behaves on the metallic side, where Fermi liquid behavior is typically seen at with an enhanced effective mass . Remarkably, in all systems one also observes distinct resistivity maxima at , signalling the breakdown of coherent transport. Crossover to the quantum critical regime is described by an additional temperature scale , which is extracted from the scaling collapse of the resistivity curves as shown in Figure 2.
A practical summary of the experimental results is presented in Table 1.
| System | Dilute 2DEG | Mott Organics | TMD Moiré Bilayers |
|---|---|---|---|
| Transition Type | continuous? |
weakly first order
(at ) |
continuous? |
|
,
|
,
|
||
| ? | ? | ||
|
,
|
,
|
,
|
|
| ? |
,
|
||
|
,
|
3.1 Dilute 2DEG in Semiconductors
In dilute two-dimensional electron gases (2DEG) Ando et al. (1982), the electron density can be quantified by the dimensionless parameter where is the electron density and the Bohr radius. The ratio of interaction energy versus kinetic energy scales as , and therefore at large enough (of the order in 2D) the electrons will spontaneously crystallize into a Wigner solid. In a two-dimensional Wigner crystal, the electrons form a triangular lattice with exactly one electron per unit cell—essentially forming a frustrated Mott insulator. When the electron density is varied, the size of the unit cell changes accordingly so that the Wigner crystal always remains fixed at one electron per unit cell. The transition from an insulating Wigner crystal to a metal can therefore be plausibly viewed as a bandwidth-tuned Mott transition. Note that this is counter-intuitive: after all, one tunes the electron density! However, what matters is the electron density counted per unit cell and that remains constant. This idea suggests Camjayi et al. (2008); Amaricci et al. (2010); Radonjić et al. (2012) that the melting of a Wigner solid by increasing density should be viewed as a Wigner–Mott transition, possibly bearing many similarities to Mott transitions in narrow-band crystalline solids such as Mott organics or transition-metal oxides. If this viewpoint is correct, then the resulting metal above the transition should display resemble other strongly correlated Fermi liquids, a notion that is starting to gain acceptance on the base of recent experiments Shashkin et al. (2020, 2022); Moon et al. (2020).
Experimentally, high-quality 2DEGs can be realized in metal-oxide-semiconductor field-effect devices (MOSFETs) in various semiconductors Kravchenko et al. (1995); Popović et al. (1997); Shashkin et al. (2020); Moon et al. (2020). Through electrostatic gating the electronic density can be elegantly tuned, typically in the range of – cm-2. The peak electron mobility in ultra-clean samples can be as high as cm2/V s Melnikov et al. (2019), which implies that down to very low temperatures the transport properties are dominated by electron-electron interactions (like Wigner crystallization) rather than extrinsic disorder effects. Lower-mobility devices have also been extensively studied (for a review see Chapter 5 of Ref. Kravchenko (2017)), displaying different types of metal-insulator transitions displaying electron glass dynamics Bogdanovich and Popović (2002), which we will not discuss here.
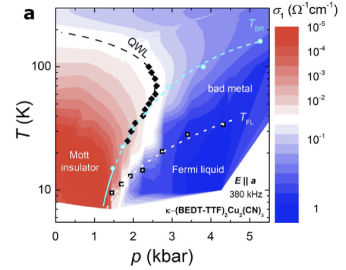
Indeed, tuning the electronic density leads to insulating transport below a critical density, typically around cm-2 Kravchenko et al. (1995); Popović et al. (1997), see Figure 1a. Activated behavior is often observed close to the transition Shashkin et al. (2001); Bogdanovich and Popović (2002), with the activation energy . Further on the insulating side disorder effects may become important, where Efros-Shklovskii hopping (and other effects of disorder) is also observed Kravchenko et al. (1995), but only at the lowest temperatures. On the metallic side, a pronounced resistivity drop (often by a factor of 10 or more) is observed Kravchenko et al. (1995); Shashkin et al. (2020) below the temperature which decreases as the transition is approached. Characteristic scaling of the resistivity maxima has been reported in several systems Shashkin et al. (2020, 2022); Moon et al. (2020), see Figure 3, which has been interpreted as evidence for strong correlation effects. However, the expected dependence of the resistivity has not been observed, despite the reported effective mass enhancement Shashkin et al. (2002), characteristic of correlated Fermi liquids. Quantum critical scaling collapse of the resistivity curves has also been demonstrated Kravchenko et al. (1995) around the critical density, albeit excluding the lowest temperatures data, as shown in Figure 2a. This is achieved by rescaling by a crossover scale , with . The resulting scaling function reveals surprising “mirror symmetry” Simonian et al. (1997), which was phenomenological interpreted Dobrosavljević et al. (1997) as evidence “strong-coupling quantum criticality”. Similar systems to these 2DEGs include the observation of a Wigner crystal in low-density doped monolayer WSe2 Smolenski et al. (2021), where more detailed experiments still need to be performed.
3.2 Organic Compounds
An organic compound Dressel and Tomić (2020) refers to a crystalline system where each unit cell contains an entire molecule, rather than just loosely bound ions. A particularly interesting class of organic compounds is based on the molecule bis-(ethylendithio)-tetrathiafulvalen (BEDT-TTF or ET), which can be fabricated with other ions into quasi-two-dimensional layered systems. Compounds based on BEDT-TTF exhibit a spectrum of interesting quantum matter phenomena, ranging from superconductivity Jerome (1991) to electron glass behavior Kagawa et al. (2013).
Our interest goes out especially to -(ET)2Cu[N(CN)2]Cl and , where the molecules are organized in triangular lattice layers Dressel and Tomić (2020). These materials are strongly correlated, and indeed, despite being half-filled they are insulating at ambient pressures. Due to the geometric frustration of the triangular lattice Balents (2010), no magnetic order has been observed in -Cu2(CN)3 and antiferromagnetic order only at relatively low temperatures () in -Cl. The absence of magnetic order is the strongest indication that -Cu2(CN)3 might realize a spin liquid ground state Kurosaki et al. (2005); Pustogow et al. (2018).
Upon applying pressure, a zero-temperature first-order phase transition brings the system into a paramagnetic metallic phase at MPa (-Cu2(CN)3) or MPa (-Cl), see Figure 1a Furukawa et al. (2015); Pustogow et al. (2021). The first order phase boundary ends in a critical point at K or K, respectively. It is important to emphasize that these temperatures are very small compared to the electronic energy scales. The Hubbard repulsion and bandwidth are both on the order of a fraction of eV Pustogow et al. (2018), which implies . As such, even though the observed Mott criticality appears at nonzero temperatures, much of the observed phenomena above can be described as if the system resides in the vicinity of a quantum critical point Furukawa et al. (2015).
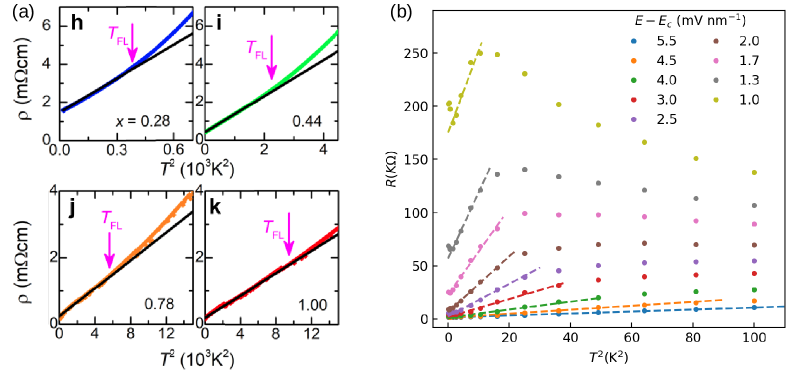
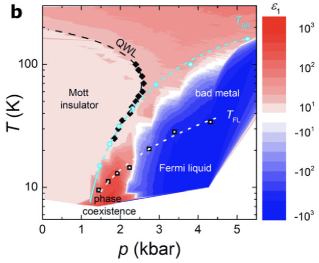
Above , a crossover pressure can traced Furukawa et al. (2015) where the measured resistivity exhibits an inflection point, see Figure 4. This defines the “quantum Widom line” (QWL) Vučičević et al. (2013) by analogy to the standard liquid-gas crossover. Defining the critical resistivity to be the resistivity along the QWL, all resistivity curves collapse onto each other when plotted as vs. , as shown in Figure 2b. Here the scale reflects a critical energy scale that vanishes at the critical pressure, for Cu and for -Cl Furukawa et al. (2015). On the insulating side of the transition, the resistivity is approximately activated Pustogow et al. (2018). On the metallic side, it follows Pustogow et al. (2021) the standard Fermi liquid behavior at low temperatures , up to a temperature scale , see Figure 5a. This destruction of the Fermi liquid seems to correspond to the appearance of a maximum in the resistivity Pustogow et al. (2021).
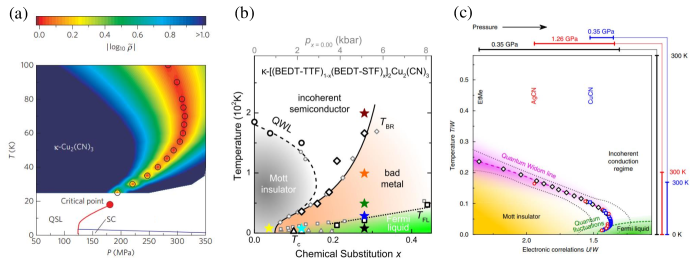
In addition to transport measurements, and in contrast to other systems we consider, Mott organics have also been carefully investigated using optical probes. This allowed to directly identify Pustogow et al. (2018) the quantum Widom line, which is back-bending towards the insulating side at higher temperatures following the closing of the Mott gap. In addition, the “Brinkman–Rice” line traced by was identified as marking the thermal destruction of Landau quasiparticles, as seen by the vanishing of the Drude peak in the optical conductivity Pustogow et al. (2021), see Figure 6.
Finally, the controversy about the presence or absence of the low- phase coexistence region has been resolved in Mott organics, by using dielectric spectroscopy Pustogow et al. (2021). Its precise location on the phase diagram has been identified by the observation Pustogow et al. (2021) of colossal dielectric response, as a smoking gun for percolative phase coexistence. In addition, the same technique was able to demonstrate the coincidence of the resistivity maxima in the (uniform) metallic phase, with the thermal destruction of Landau quasiparticles. This is seen as a dramatic drop and a change Pustogow et al. (2021) of sign of the dielectric function at . These experimental results are shown in Figure 6, and discussed in more detail in Section 5.
3.3 Moiré Materials
The most recent addition to the field of strongly correlated systems are moiré materials. These are bilayer structures made of Van der Waals materials such as graphene and transition-metal dichalcogenides (TMDs). A lattice mismatch or relative twist angle between the layers causes a large-scale geometric “moiré” pattern. This larger unit cell (typically in the range of 5–10 nm) drastically reduces the effective electron kinetic energy such that the bandwidth is on the order of meV. As a result, the systems become strongly correlated, with or larger. Using electrostatic gating one can tune the electronic density, typically in the range of a few electrons or hole per moiré unit cell (corresponding to cm-2).
While the most famous of correlated moiré materials is without a doubt twisted bilayer graphene, more convincing evidence for Mott correlations has so far only been observed in TMD bilayers. Here, we focus on one particular system: the heterobilayer MoTe2/WSe2 Li et al. (2021). The lattice mismatch between MoTe2 and WSe2 gives rise to a moiré period of nm. At half-filling of the first valence band, an insulating phase appears which can be tuned into a metal by applying a vertical displacement field . This flat valence band can be described by a spin-orbit coupled triangular lattice Hubbard model, where the displacement field tunes the bandwidth Rademaker (2021).
The temperature-dependent resistivity across the transition is shown in Figure 1c. On the insulating side, the system has well-defined activated behavior of the resistivity with a gap continuously vanishes as the critical displacement-field value is approached, . At the critical point, the resistivity is claimed to follow a powerlaw, , although the reliability of the low- data may be questionable. On the metallic side, the low- resistivity follows the Fermi liquid law where the quadratic prefactor diverges . This clear Fermi liquid does not persist up to all temperatures, instead, a resistivity maximum appears at , see Figure 5b. No magnetic order has been observed, which might be due to the geometric frustration of the triangular moiré lattice structure. Remarkably, this experiments uses the recently-developed excitonic sensor Li et al. (2021) , which allows the measurements of the spin susceptibility across the transition. This reveals Curie-law behavior over a broad temperature range, thus demonstrating the presence of localized magnetic moments, as expected for a Mott system.
Finally, among other moiré systems it is worth mentioning the twisted hetero-bilayer WSe2 Ghiotto et al. (2021). Though it was claimed to exhibit some sort of Mott-related criticality, it is not certain whether a true insulating phase has indeed been observed given that the activated transport does not continue down to the lowest measured temperatures. In addition, insulating behavior seems to disappear above a relatively low of the order of 5–10 K, which is similar to twisted bilayer graphene, but much smaller than the estimated bandwidth of the order of 100–200 K. Furthermore, no clear resistivity maxima on the metallic side have been observed. Whether or not tbWSe2 can be classified as a true Mott insulator is therefore quite controversial. Alternatively, the observed behavior could be a result of some sort of magnetic order, which may arise close to half filling even in weakly-coupled systems.
3.4 Universal Criticality
The resistivity curves of the three systems, as shown Figures 1 and 2, show remarkable universality, reflected in the fact that all curves can be collapsed by scaling with where is the tuning parameter and the critical exponent. It is important to realize, however, that the precise scaling procedure applied was not identical in the three cases, and the resulting critical exponent also somewhat depend on the system.
So what is different between these systems? Let us first focus on the energy scale. The typical bandwidth ranges from 100 s meV in Mott organics, to 10 s meV in the moiré systems, to 0.1–1 meV in the dilute 2DEGs. A finite temperature critical point is only observed in the organics, though at about —which leaves open the possibility that a finite critical endpoint exists in the other two systems. Indeed, most experiments are performed (so far) above the Kelvin range in moiré materials, and above 100 mK in 2DEG, which makes it hardly possible to reliably explore the -range below few percent of the bandwidth.
Secondly, in order to achieve quantum critical scaling in Mott organics, one needs to first identify a Widom line as a demarcation of the finite-temperature crossover from insulator to metal. A similar analysis was carried out for moiré materials, although the obtained Widom line displayed no apparent “curving” as a function of temperature. This is manifestly not performed in the dilute 2DEGs. It might be interesting to see whether better collapse can be achieved through such a method.
Thirdly, with a bit of good-will, the critical exponents in organics and Moiré systems are in the same ballpark; whereas the critical exponent in the dilute 2DEGs with is significantly larger. It is also important to realize that in 2DEGs there has not been a clear observation of a Fermi liquid regime—unlike in organics and Moiré systems, see Figure 5. These ways in which 2DEGs stand out might be related to the fact that there is no underlying (Wigner) lattice on the metallic side, which could point to a perhaps nontrivial role of significant charge density fluctuations on the metallic side, an effect not present in lattice Mott systems.
4 Competing Theoretical Pictures
As we mentioned in Section 2, the observation of Mott criticality and scaling opens big questions on the theoretical front. Currently, there exist three main different physical pictures to address these issues.
A true Mott transition should not be hidden by some period doubling symmetry breaking. The Lieb-Schultz-Mattis theorem states that in absence of spin order, the ground state of Mott insulator must be a spin liquid Savary and Balents (2016). This leads directly to the first theoretical picture: Mott criticality can only occur if the Mott phase is a spin liquid, where inter-site spin correlations play an important role. The theory of Senthil Senthil (2008) chooses this path, by introducing an explicit spinon theory of the Mott spin liquid.
Alternatively, one focuses on local electronic processes only, ignoring inter-site spin correlations. Then the Mott transition at low temperature becomes first-order; however, it is only weakly first order. A first order transition line always ends at a critical point , and as long as is sufficiently low compared to any experimental scale, one still finds criticality and scaling. This is the picture emerging from Dynamical Mean Field Theory (DMFT) Georges et al. (1996), a strong-coupling self-consistent approach to calculate the local electronic self-energy.
The third picture again accepts the first-order nature of a Mott transition, but this time embraces it. A first-order transition is always accompanied by a region where both phases coexist. Minor disorder or self-generated pattern formation Spivak and Kivelson (2004, 2006) can smear this phase coexistence region into a continuous-looking transition exhibiting nontrivial electron dynamics. This is the ‘percolation theory’ picture of Mott criticality.
The goal of this review paper is to put the main theoretical predictions next to the experimental findings. As such, we will not dive into the pros and cons of each theoretical picture. A summary of the main theoretical predictions is provided in Table 2.
| Theory Predictions | 2D Spinon Theory | DMFT | Percolation Theory |
|---|---|---|---|
| Transition Type | continuous |
weakly first order
(at ) |
first order |
|
,
|
,
|
remains finite | |
| weak: | strong: | no divergence | |
| ? |
constant
(KW law obeyed) |
diverges: ; | |
4.1 Spin Liquid Picture of the Mott Point
A popular approach to describe a spin liquid state is through spin-charge separation. In Ref. Senthil (2008), the electron is split into a charge-0 spin- fermionic spinon and a charge- spin-0 bosonic chargon . The Mott transition, in this picture, amounts to the condensation of the chargon field, whose critical behavior falls within the 3D universality class. The Fermi liquid corresponds to the condensed phase of the chargon, whereas the Mott insulator corresponds to a gapped phase of the charged boson. The splitting of the electron leads to redundant degrees of freedom described by an emergent gauge field. Fluctuations of this gauge field lead to a logarithmic enhancement of the quasiparticle effective mass,
| (2) |
where is the tuning parameter and is the critical value. However, as in any theory with a non-local electronic self-energy, the quasiparticle residue is not simply proportional to the inverse effective mass; instead . Furthermore, approaching the Mott transition from the metallic side the spin susceptibility remains constant whereas the compressibility vanishes. Physically, these effects result from important inter-site spin correlations, where a gapless spin liquid can be viewed as a certain superposition of spin singlets formed by pairs of spins in the Mott insulating state. As a result, there emerges a finite gap to charge excitations, while the rearrangement of singlets leads to characteristic gapless spin excitations with fermionic quasiparticles. This picture is a specific realization of the famous RVB picture of Baskaran and Anderson Baskaran et al. (1987), first proposed in the context of high- superconductors.
Another significant consequence of describing the Mott transition as chargon condensation, is that the conductivity is not continuous. The electron resistivity will display a universal jump from a (disorder)-dependent constant value in the Fermi liquid; to (with of order one) at the critical point; to in the Mott insulator. On the metallic side, the Fermi liquid is predicted to break down above and give rise to a marginal Fermi liquid state, which in turn survives up to . In both cases, is the 3D correlation length exponent. On the insulating side, the boson condensation picture implies that the charge gap vanishes as . The spinons, however, remain gapless and form a spinon Fermi surface, with low-temperature specific heat scaling as .
Note that the original work in Ref. Senthil (2008) does not directly provide a detailed description for finite temperature dependence of the resistivity, and thus no explicit prediction for a possible deviation from the Kadowaki-Woods (KW) law ( constant) Jacko et al. (2009). On the other hand, Ref. Jacko et al. (2009) presents arguments that the physical requirement for the validity of the KW law is the locality of the electronic self-energy (as in DMFT theory) Georges et al. (1996), a condition which is not obeyed by the RVB-type spin-liquid theories such as the Senthil’s spinon picture.
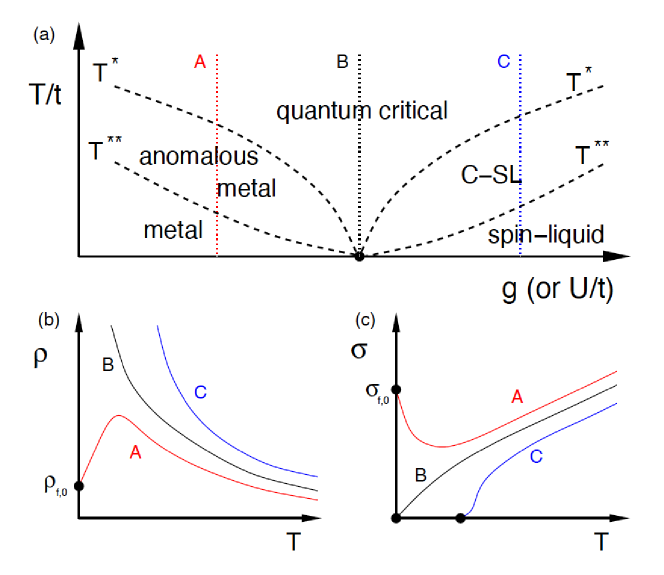
It should be stressed that the spinon theory makes one sharp prediction about finite temperature transport in the critical regime. Namely, the critical resistivity curve is predicted to assume a universal power-law form in Podolsky et al. (2009), but remain -independent in , see Figure 7. This therefore leads to distinct resistivity maxima in 3D, but not in 2D Senthil (2008), where monotonic -dependence should be found on both sides of the transition, albeit with opposite slope. Physically, this difference reflects the proposed importance of “infrared” (IR, long distance) effects due to gauge fields, which should have strong (spatial) dimensionality dependence. Concerning quantum critical scaling, it is interesting that this theory proposes the emergence of two crossover temperature scales, both of which vanish at the transition.
4.2 Dynamical Mean Field Theory Picture of the Mott Point
Our second theory of interest is Dynamical Mean Field Theory (DMFT), which explicitly ignores all nonlocal (spin or charge) spatial correlations, and therefore aims to self-consistently calculate the local electronic self-energy Georges et al. (1996). Physically, its real part describes the modifications of the electronic spectra, while its imaginary part encodes the frequency and temperature dependence of the electron-electron scattering rate. In this way, this theory is not limited to low-temperature excitations only, but is able to capture strong inelastic scattering at high temperatures, and therefore describe both the (coherent) Fermi liquid regime, and also the incoherent high-temperature transport, for example the famed bad metal behavior Emery and Kivelson (1995); Vučičević et al. (2015) above the MIR limit ‖ et al. (2004).
While there exist some limiting cases where an analytic solution is possible, it is mainly a numerical approach at finite temperature. DMFT is exact in the limit of large coordination, which physically corresponds to maximal magnetic frustration. Therefore, in the simplest implementation, DMFT describes Mott physics in absence of any magnetic order, nor does it include any (inter-site) spin liquid correlations. We should mention that extensions of DMFT have recently been proposed Lee et al. (2016) that include spinon effects, based on an alternative (matrix M,N) rotor representation. This theory, which includes some dynamical effects even at the saddle-point level, suggest that coherent spinon excitations are very fragile to charge fluctuations emerging upon the closing of the Mott gap, suppressing the spin liquid correlations not only on the metallic side, but also within the critical region. We will not further discuss these most sophisticated approaches here, but will limit our attention to the predictions of the simplest single-site DMFT theory.
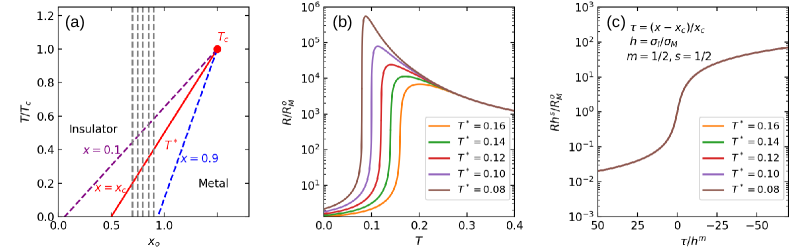
When applied to the single-band Hubbard model on a frustrated lattice (such as the triangular lattice), DMFT predicts that on the metallic side the quasiparticle mass diverges linearly at a critical value (similar to the prediction of the Brinkman–Rice (BR) theory of the Mott transition Brinkman and Rice (1970)). The quasiparticle weight is inversely proportional to . Similarly, other features of the Fermi liquid such as the Kadowaki-Woods law are upheld. This Fermi liquid behavior persists up to a temperature that vanishes linearly when approaching . Interesting, at the resistivity exhibits a maximum Radonjić et al. (2012). On the insulating side, there exist no well-defined quasiparticles as the self-energy diverges, . The electronic spectrum is split into an upper and lower Hubbard band, separated by a gap that remains nonzero at . The insulating state becomes unstable at a lower value of the interaction , where the gap closes , νz, Eisenlohr et al. (2019). As a result, there emerges a low- first-order metal-insulator transition, and an associated phase coexistence region at Georges et al. (1996). These main predictions are summarized in Figure 8.
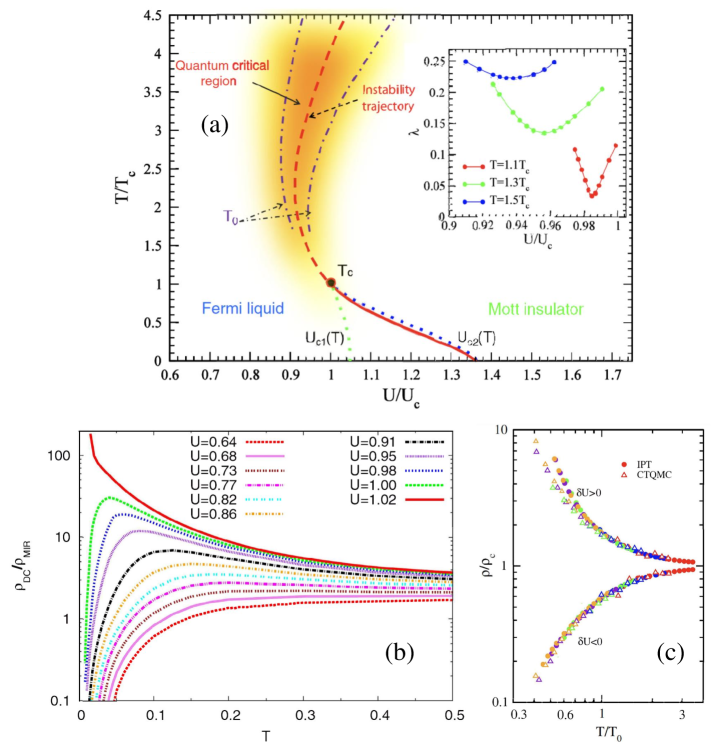
At nonzero temperature, the first-order transition line ends at a critical point at a temperature , significantly smaller than the bare bandwidth . At temperatures the results can be viewed as effectively quantum critical Terletska et al. (2011); Eisenlohr et al. (2019). This quantum critical regime is centered around the so-called quantum Widom line (QWL) Vučičević et al. (2013), which physically represents a finite-temperature instability trajectory of the insulating phase, as shown in Figure 8a. It extends the first-order line past , and can experimentally be detected from an inflection point analysis Furukawa et al. (2015) of the resistivity curves. In this regime, the resistivity satisfies the scaling law with a crossover temperature scale where , see Figure 8c. The crossover scale is a property of the quantum critical regime and should not be confused with the low-temperature scaling of the Fermi liquid temperature . DMFT therefore predicts two different regimes of scaling: the quantum critical regime at , and the metal regime dominated by scaling in .
4.3 Percolative Phase Coexistence Picture
In the early theories of both Mott insulators Mott (1990) and Wigner crystals, the transition from insulator to metal was often assumed to be robustly first order, at least at sufficiently low temperature. However, even the presence of weak disorder or medium-ranged interactions will create an “emulsion” (microscopic phase coexistence) with Mott/Wigner insulating “islands” in between metallic “rivers” as proposed by Spivak and Kivelson in the context of 2DEG systems in semiconductors Spivak and Kivelson (2004); Jamei et al. (2005). If so, then tuning bandwidth and/or temperature should produce a continuous variation of the metallic fraction . As long as it exceeds the percolation threshold (), the system is conducting. At the metallic domains no longer connect across the system, and conduction stops, at least at . Critical behavior now arises because we dealing with a classical percolation transition.
In this picture, the metal-insulator transition may occur without actually closing the insulating gap . Similarly, at the percolation threshold the metallic Fermi liquid at low is still stable, and consequently there is no strict divergence of the effective mass , nor the vanishing of at the percolation threshold. We note, however, that such a (classical) percolation picture should apply only if the characteristic domain size is sufficiently larger than the characteristic correlation (or dephasing) length, therefore strictly speaking not at the lowest temperatures. However, finite-temperature variation of the transport properties should be adequately captured, as abundantly documented Dagotto (2005) in other systems featuring microscopic phase separation, such as Colossal Magneto-Resistance (CMR) manganites, for example.
There is, however, an interesting and nontrivial feature of the percolation picture pertaining to finite temperatures. Because of its localized spins, the entropy of the Mott or Wigner–Mott insulating phase should be higher than that of the of the metal (Fermi liquid). As a result, when raising the temperature in the metallic regime, the insulating volume fraction will increase: a manifestation of the Pomeranchuk effect Pomeranchuk (1950). As a result, the resistivity should increase up to some , above which the metallic domains no longer connect, and resistivity will decrease again Spivak and Kivelson (2006), leading to resistivity maxima. This qualitative picture has been advocated in the work of Spivak and Kivelson, but no concrete prediction of the precise temperature dependence of the resistivity has been made, nor how the corresponding family of curves should scale as the transition is approached.
Interestingly, the same physical picture should in fact apply not only to Wigner–Mott transitions in semiconductors, but also the to conventional Mott transition, provided that there exists a well-defined metal-insulator phase coexistence region around the Mott point. Indeed, recent work on Mott organics Pustogow et al. (2021) revealed precisely such a phase coexistence region, albeit only at very low temperatures of the order of at most few percent of the (bare) Fermi energy. Here, careful theoretical modeling Pustogow et al. (2021) firmly established the validity of the percolation picture, but only within a well-defined phase coexistence region. In contrast, in all the systems studied (2DEG, Mott organics, moiré), the pronounced resistivity maxima persist even much further onto the metallic side, where can reach a substantial fraction of , where phase coexistence is very unlikely. Furthermore, recent experimental work on Mott organics by Kanoda and collaborators demonstrated Urai et al. (2019); Yamamoto et al. (2020) the extreme fragility of such a phase coexistence region to disorder, as generally expected in 2D systems Aharony et al. (1976). Nevertheless, it is extremely useful to have an independent experimental method to distinguish the phase coexistence region (where percolative effects are likely) from the regimes where a more uniform electron fluid/solid resides. The possibility to do so was spectacularly demonstrated in the context of Mott organics. In the next section we discuss how the dielectric response can tell which mechanism (quasiparticle destruction or percolation) is at play in a given regime.
We briefly mention that percolation effects have been also discussed in the context of spinon theory in a recent paper Kim et al. (2022), which does require however significant disorder. On the other hand, the Spivak-Kivelson theory does not require disorder as the micro-emulsion of insulators and metals can be self-generated. This seems to be more in line with the experiments of Section 3: at least the 2DEGs Melnikov et al. (2019) and the Mott organics Dressel and Tomić (2020) are displaying Mott criticality in the cleanest samples possible. It is therefore very plausible that most universal features observed in all critical Mott systems are not the result of disorder, but are instead the inherent manifestations of strong correlation physics.
5 Interpreting Resistivity Maxima
As we have seen from our brief theory overview above, several scenarios were proposed, with sometimes similar predictions for characteristic features seen in experiments. A notable example is the clear emergence of the resistivity maxima on the metallic side, at a temperature , which is seen to decrease towards the transition. What is its physical content? The three theoretical pictures propose very different physical perspectives on what goes on here.
As we mentioned in Section 4.1, spinon theory Senthil (2008) predicts the presence of resistivity maxima only in , but not in . However, robust resistivity maxima are clearly seen all the material systems of Section 3. An understanding of the resistivity maxima must therefore come from either the DMFT perspective on Mott physics, or from the percolative scenario. Both mechanisms provide reasonable albeit very different routes to explain the resistivity maxima. How should one distinguish them and thus identify the precise mechanism at play in a given system? Luckily, important clues were provided by recent experiments on Mott organics Pustogow et al. (2021). Here one finds two distinct regimes, both featuring similar resistivity maxima, but with very different dielectric response. One such regime is corresponds to the (spatially inhomogeneous) metal-insulator phase coexistence region, where colossal enhancement of dielectric response has been found. The other regime was found further on the metallic side, where a dramatic drop and a change of sign the dielectric constant signaled thermal destruction of coherent quasiparticles due to strong correlation effects.
In the following we show how general scaling arguments can be used within each of the two proposed scenarios, to demonstrate the general robustness of these trends, thus providing a new window of what precisely goes on near the Mott point.
5.1 Resistivity Maxima from Thermally Destroying Coherent Quasiparticles
Both experiments and theory provide evidence that a strongly correlated Fermi liquid forms on the metallic side of the Mott point, with a characteristic “Brinkman–Rice” (BR) energy scale , which decreases towards the transition, thus characterizing the heavy quasiparticles. Inelastic electron-electron scattering increases with temperature, eventually leading to the thermal destruction of the quasiparticles around , and the associated modification of both the single particle (ARPES) spectra and the optical conductivity. At higher temperatures, transport assumes incoherent character, which can no longer be understood in terms of the quasiparticle picture or Fermi Liquid ideas alone. Its precise form generally depends on band filling and the correlation strength, but more precise predictions require a specific microscopic model and a theoretical picture.
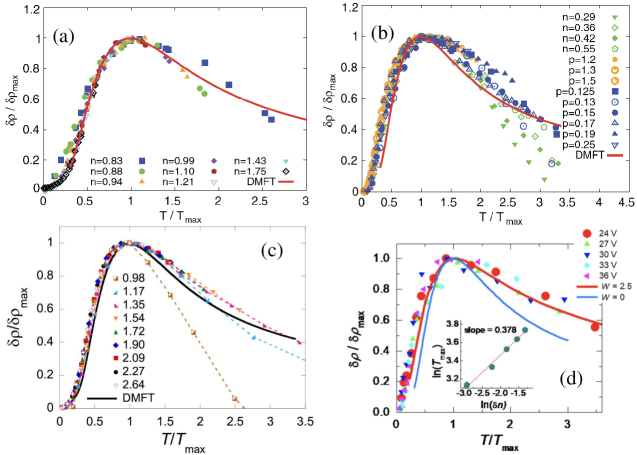
Concrete and quantitative results, in this regime, were given by DMFT theory, which provided first insight into the origin of the resistivity maxima in certain Mott organic materials at half-filling, as well as in certain oxides. Subsequent DMFT studies stressed that the characteristic temperature scale for the resistivity maxima indeed tracks the BR scale of the quasiparticles (), while preserving the functional form of the resistivity curves across this coherence-incoherence crossover. This revealed the scaling behavior of the resistivity curves in the correlated metallic regime, with a universal scaling function of . The predicted scaling behavior has been confirmed by a number of experiments on various systems Radonjić et al. (2012); Shashkin et al. (2020); Moon et al. (2020), displaying even quantitative agreement with the theoretical scaling function, with no adjustable parameters.
Further optical and dielectric studies Pustogow et al. (2021) in Mott organics also confirmed the predicted destruction of the Drude peak around , again signaling the thermal destruction of quasiparticles. They established that it dramatically affects not only DC transport, but also the dielectric response, which in this metallic regime is seen to display a dramatic drop from moderate positive values at to very large but negative values at . These studies, combining experiments and DMFT theory, have firmly established that the dielectric response can be used to directly reveal the thermal destruction of quasiparticles around the BR temperature.
In the following, we extend the systematic studies of Ref.Radonjić et al. (2012), to stress that within DMFT both DC transport and the dielectric response display the characteristic crossover behavior across , and the associated scaling behavior upon approaching the Mott point. To do this we calculate the dielectric function as a function of temperature and interaction , using the same setup as in our recent work Pustogow et al. (2021). For simplicity, we focus on a simple semi-circular band model at half filling, and carry out DMFT calculations using the standard CTQMC impurity solver with the the Maximum Entropy method for analytical continuation to the real axis. Just as in Ref.Radonjić et al. (2012), once we get the single particle self energy from our DMFT equations, we calculate the real part of optical conductivity from the standard Kubo formula, and the imaginary part of optical conductivity using the Kramers-Kroning tranform; the (complex) dielectric function is then obtained via Economou (2005)
| (3) |
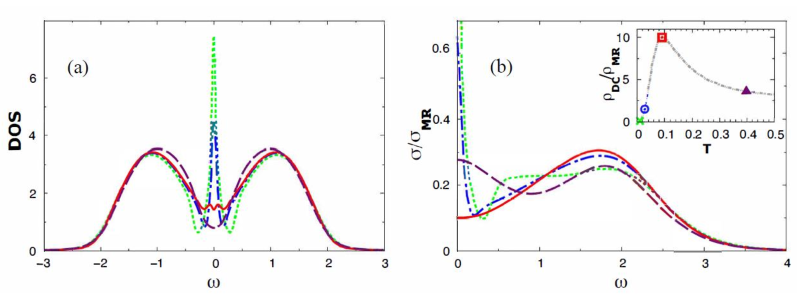
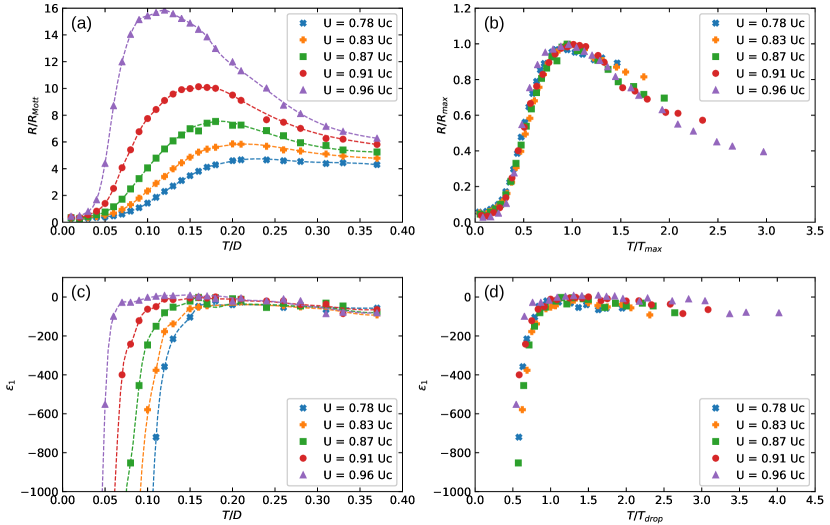
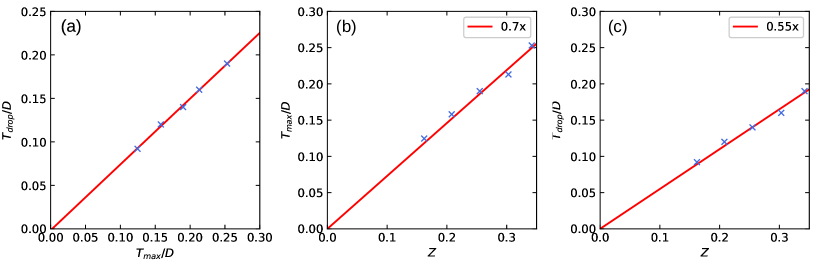
The results for the single-particle density of states and the optical conductivity are shown in Figure 9, and results for the DC transport and the low-frequency dielectric response are displayed in Figure 10, for the parameter range corresponding to the correlated metallic phase (). Here panels (a) and (b) reproduce the results of Ref. Radonjić et al. (2012), showing the characteristic scaling behavior of the resistivity maxima near the Mott point. The analogous behavior for the dielectric function is shown in panels (c) and (d), firmly establishing that the observed crossover behavior assumes a universal scaling form in the correlated metallic regime. The notion that the thermal destruction of quasiparticles lies behind both phenomena is seen even more clearly in Figure 11, where we show how the scale for the resistivity maxima, and the scale of the dielectric response, both scale with the quasiparticles weight , as the transition is approached.
These results establish a way to experimentally recognize the thermal destruction of quasiparticles as a dominant mechanism behind the resistivity maxima within a correlated but uniform metallic phase. Since the correlation processes captured by DMFT are essentially local (i.e. “ultraviolet, UV”), these effects should not display significant dependency on spatial dimensional. Indeed, experiments have shown that similar resistivity maxima are seen within correlated metallic phases both in 2D and in 3D systems.
Note, however, that DMFT predicts very different behavior closer to the Mott point, specifically within the phase coexistence region at and . Here, just as around any first-order phase transition line, we expect hysteresis phenomena and inhomogeneous phase separation, where metallic and insulating domains coexist on a nano-scale. As stressed in the seminal work by Spivak and Kivelson Spivak and Kivelson (2004), thermal effects can modify the relative volume fraction of the two coexisting phases, producing under appropriate conditions the characteristic resistivity maxima. In recent work motivated by experiments, a microscopic “hybrid-DMFT” approach was developed Pustogow et al. (2021) to quantitatively describe this regime in the context of Mott organics, resulting in spectacular agreement with experiments. In the following section, however, we wish to stress that the qualitative aspects of this regime display a number of universal scaling features, which can be precisely understood from the perspective of percolation theory.
5.2 Percolation Scenario Due to Phase Coexistence
To focus on the universal scaling aspects of percolative processes within the metal-insulator phase coexistence region, we follow the seminal ideas of Efros and Shklovskii Efros and Shklovskii (1976), and set up a two-component random resistor network model, with characteristic low-frequency form for the (complex) conductivity for each component:
| (4) |
Here we assumed activated DC transport for the insulating component, with capacitance and a standard Drude form for the conducting component, with finite DC conductivity . To leading order near the percolation point, we ignore the -dependence of , , and , since the dominant effects come from the variation of the respective volume fractions, and the activated form of insulating transport. The temperature is expressed in the units of the activation energy , which is also taken to be a constant. The corresponding expressions for the (complex) dielectric functions of the two components are given by:
| (5) |
Here we ignored the capacitance of the metallic domains, which can be neglected if .
Such a random resistor network model is appropriate for any percolating two component metal-insulator system. To describe formation of the resistivity maxima, an additional physical condition has to be met, as emphasized by Spivak and Kivelson in the context of Wigner–Mott transitions, but which is in fact valid for any Mott-like system in general. As we mentioned before, this “Pomeranchuk effect” Pomeranchuk (1950) requires that the first-order line (and the entire phase coexistence region) be “tilted” towards the metal, so that the higher-entropy phase emerges at higher temperatures. To schematically represent such a situation we assume that, within the phase coexistence region, the volume fraction of the metallic component decreases with temperature. As an illustration, we take the following simple model:
| (6) |
where represents the percolation threshold, defines the width of the coexistence region, and , as illustrated in Figure 12a, for and . In this model, the parameter controls the metallic volume fraction at , which decreases at , and reaches the percolation threshold at . Physically, the the DC resistivity will first increase with as the metallic volume fraction decreases. Past percolation threshold, however, the metallic domains no longer connect. Transport then assumes insulating (activated) form, resulting in subsequent resistivity decrease at , and the emergence of resistivity maxima around . Similarly, the dielectric constant grows (diverges) as the percolation threshold is approached from the insulating side, due to the formation of large metallic clusters with increased polarizability. On the metallic side, however, it displays a rapid decrease, dropping to large negative values within the metallic phase. As a result, dielectric response displays colossal enhancement around the percolation threshold, a phenomenon that can be viewed as a smoking gun for percolative charge dynamics.
To illustrate these ideas, we use the Effective Medium Approximation (EMA) for percolation, which solves the following nonlinear equations for the complex dielectric function:
| (7) |
and for illustration selected , , , and corresponding to 2D transport (). Precisely the anticipated behavior is observed from numerically solving the EMA equation for the corresponding DC resistivity , as shown in Figure 12b. Here, we select several values of , corresponding to (low temperature metallic regime), and plot the resistivity as a function of temperature (following dashed lines in Figure 12a. We observe distinct resistivity maxima around the temperature corresponding to the percolation threshold. Note how the maxima become sharper and sharper as is reduced, corresponding to the exponential (activated) decrease of the “field” . The expected behavior is also seen in dielectric response, as shown in Figure 13a, where we observe sharp maxima at . Here again we see the increased “rounding” of these maxima at higher , corresponding to larger . This behavior can be seen even more clearly in Figure 13b, where is plotted as a function of the reduced concentration , which vanishes at .
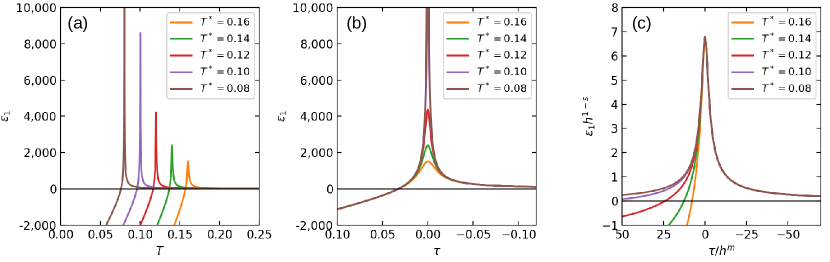
These qualitative trend can be even more rigorously described within the scaling theory for percolation, where the DC conductivity as well as the dielectric constant are known to satisfy the following scaling relations:
| (8) |
where measures the distance to the percolation threshold, and plays a role of the “symmetry breaking field”, which leads to the rounding of the transition. The critical exponents and , as well as the crossover scaling functions and are universal quantities within percolation theory. To illustrate this scaling behavior within EMA, we collapse the family of resistivity curves by plotting as a function of , as shown in Figure 12c, and as a function of s a function of , as shown in Figure 13c. Note how a perfect scaling collapse is observed here, but only around the peak of the dielectric response, i.e. only close to the percolation threshold. Such behavior is, in fact, not surprising, since we expect scaling phenomena to arise only within a given critical region, and not further away from the critical point.
We should stress again that all our qualitative results are rigorously valid within general percolation theory for our two-component phase coexistence model, and EMA was simply used as an illustration. EMA correctly captures the general crossover phenomena associated with percolation, but only introduces approximate values for the critical exponents and , which are otherwise know even more accurately from numerical simulations. These details, however, are not of direct relevance for our purposes. What is important is the result that, within our “Pomeranchuk” model for phase coexistence, the percolation scenario predicts distinct resistivity maxima but also striking colossal dielectric anomalies, at the same temperature scale of which decreases towards the MIT. This behavior is in distinct contrast to the behavior we found from the DMFT picture of a correlated but uniform metallic phase, which also leads to resistivity maxima, but very different behavior of the dielectric response. This observation, which was quantitatively validated in recent experiments on Mott organics Pustogow et al. (2021), thus reveals a distinct criterion to settle the long-lasting controversies between the origin of the resistivity maxima in different systems.
6 Conclusions
In this paper we discussed three different classes of physical systems which all display very similar phenomenology expected for Mott-like metal-insulator transitions. We stressed that most qualitative features are clearly seen in all these examples, including the continuous decrease of the characteristic energy scales , , , towards the transition, the phenomenon of quantum critical scaling seen in transport, as well as the emergence of distinct resistivity maxima on the metallic side. These observations, which are starting to portray a robust and consistent phenomenology of Mott criticality, is putting serious constraints on theory. We discussed which of these features seem compatible with various proposed theoretical pictures of the Mott point, and which ones do not.
In the final section of this paper we also presented new theoretical results, which open the possibility to precisely determine, from experiments, which mechanism dominates in which regime. We argue that the dielectric response offers unique insights, which so far have not been appreciated enough, as a powerful tool to distinguish between different phase coexistence and the thermal destruction of quasiparticles.
A class of issues we did not discuss in any detail in this paper is the (explicit) role of disorder around the Mott point. Given the fact that new classes of ultra-clean material are starting to emerge, with even more pronounced salient features of Mott criticality, it is becoming possible to plausibly minimize the role of disorder on experimental grounds. On the other hand, new experimental efforts are starting Urai et al. (2019); Yamamoto et al. (2020) to emerge in the opposite direction: to systematically add and to control the level of disorder, for example by high-energy X-ray irradiation. These fascinating research directions are guaranteed to open entirely new chapters in the study of metal-insulator quantum criticality. This will require theorists to rekindle the efforts to understand the interplay of strong correlation with disorder Miranda and Dobrosavljević (2005), and perhaps to develop new ideas in the process.
Y.T. carried out theoretical calculations and performed the analyses. V.D. and L.R. designed the project. All authors discussed the data, interpreted the results, and wrote the paper. All authors have read and agreed to the published version of the manuscript.
This work was supported by the NSF Grant No. 1822258, and the National High Magnetic Field Laboratory through the NSF Cooperative Agreement No. 1644779 and the State of Florida. LR acknowledges support by the Swiss National Science Foundation via Ambizione grant PZ00P2_174208.
Not applicable. \informedconsentNot applicable.
Data are provided: https://github.com/yutingtanphysics/ (accessed on 3 May 2022) How-to-Recognize-the-Universal-Aspects-of-Mott-Criticality.
Acknowledgements.
We thank Pak Ki Henry Tsang for providing technical support in doing computer cluster calculations. \conflictsofinterestThe authors declare no conflict of interest. The funders had no role in the design of the study; in the collection, analyses, or interpretation of data; in the writing of the manuscript, or in the decision to publish the results. \reftitleReferencesReferences
- Phillips (2006) Phillips, P. Mottness. Ann. Phys. 2006, 321, 1634–1650. \changeurlcolorblackhttps://doi.org/10.1016/j.aop.2006.04.003.
- Mott (1990) Mott, N. Metal-Insulator Transitions; Taylor & Francis: Abingdon, UK, 1990.
- Imada et al. (1998) Imada, M.; Fujimori, A.; Tokura, Y. Metal-insulator transitions. Rev. Mod. Phys. 1998, 70, 1039–1263. \changeurlcolorblackhttps://doi.org/10.1103/ RevModPhys.70.1039.
- Dobrosavljević et al. (2012) Dobrosavljević, V.; Trivedi, N.; Valles Jr, J.M. Conductor Insulator Quantum Phase Transitions; Oxford University Press: Oxford, UK, 2012.
- Cao et al. (2018) Cao, Y.; Fatemi, V.; Demir, A.; Fang, S.; Tomarken, S.L.; Luo, J.Y.; Sanchez-Yamagishi, J.D.; Watanabe, K.; Taniguchi, T.; Kaxiras, E.; et al. Correlated insulator behaviour at half-filling in magic-angle graphene superlattices. Nature 2018, 556, 80–84. \changeurlcolorblackhttps://doi.org/10.1038/nature26154.
- Szentpéteri et al. (2021) Szentpéteri, B.; Rickhaus, P.; Vries, F.K.d.; Márffy, A.; Fülöp, B.; Tóvári, E.; Watanabe, K.; Taniguchi, T.; Kormányos, A.; Csonka, S.; et al. Tailoring the Band Structure of Twisted Double Bilayer Graphene with Pressure. Nano Lett. 2021, 21, 8777–8784. \changeurlcolorblackhttps://doi.org/10.1021/acs.nanolett.1c03066.
- Mooij (1973) Mooij, J.H. Electrical conduction in concentrated disordered transition metal alloys. Phys. Status Solidi A 1973, 17, 521–530. \changeurlcolorblackhttps://doi.org/10.1002/pssa.2210170217.
- Ciuchi et al. (2018) Ciuchi, S.; Sante, D.D.; Dobrosavljević, V.; Fratini, S. The origin of Mooij correlations in disordered metals. NPJ Quantum Mater. 2018, 3, 1–6. \changeurlcolorblackhttps://doi.org/10.1038/s41535-018-0119-y.
- Evers and Mirlin (2008) Evers, F.; Mirlin, A.D. Anderson transitions. Rev. Mod. Phys. 2008, 80, 1355–1417. \changeurlcolorblackhttps://doi.org/10.1103/RevModPhys.80.1355.
- Lee et al. (2006) Lee, P.A.; Nagaosa, N.; Wen, X.G. Doping a Mott insulator: Physics of high-temperature superconductivity. Rev. Mod. Phys. 2006, 78, 17–85. \changeurlcolorblackhttps://doi.org/10.1103/RevModPhys.78.17.
- Balents (2010) Balents, L. Spin liquids in frustrated magnets. Nature 2010, 464, 199–208. \changeurlcolorblackhttps://doi.org/10.1038/nature08917.
- Sondhi et al. (1997) Sondhi, S.L.; Girvin, S.M.; Carini, J.P.; Shahar, D. Continuous quantum phase transitions. Rev. Mod. Phys. 1997, 69, 315–333. \changeurlcolorblackhttps://doi.org/10.1103/RevModPhys.69.315.
- Saito et al. (2016) Saito, Y.; Nojima, T.; Iwasa, Y. Highly crystalline 2D superconductors. Nat. Rev. Mater. 2016, 2, 74. \changeurlcolorblackhttps://doi.org/10.1038/ natrevmats.2016.94.
- Lee and Ramakrishnan (1985) Lee, P.A.; Ramakrishnan, T.V. Disordered electronic systems. Rev. Mod. Phys. 1985, 57, 287–337. \changeurlcolorblackhttps://doi.org/10.1103/ RevModPhys.57.287.
- Belitz and Kirkpatrick (1994) Belitz, D.; Kirkpatrick, T.R. The Anderson-Mott transition. Rev. Mod. Phys. 1994, 66, 261–380. \changeurlcolorblackhttps://doi.org/10.1103/ RevModPhys.66.261.
- Abrahams et al. (2001) Abrahams, E.; Kravchenko, S.V.; Sarachik, M.P. Metallic behavior and related phenomena in two dimensions. Rev. Mod. Phys. 2001, 73, 251. \changeurlcolorblackhttps://doi.org/10.1103/RevModPhys.73.251.
- Spivak et al. (2010) Spivak, B.; Kravchenko, S.V.; Kivelson, S.A.; Gao, X.P.A. Colloquium: Transport in strongly correlated two dimensional electron fluids. Rev. Mod. Phys. 2010, 82, 1743–1766. \changeurlcolorblackhttps://doi.org/10.1103/RevModPhys.82.1743.
- Kravchenko (2017) Kravchenko, S. Strongly Correlated Electrons in Two Dimensions; Jenny Stanford Publishing: New York, NY, USA, 2017.
- Melnikov et al. (2019) Melnikov, M.Y.; Shashkin, A.A.; Dolgopolov, V.T.; Zhu, A.Y.X.; Kravchenko, S.V.; Huang, S.H.; Liu, C.W. Quantum phase transition in ultrahigh mobility SiGe/Si/SiGe two-dimensional electron system. Phys. Rev. B 2019, 99, 081106. \changeurlcolorblackhttps://doi.org/10.1103/PhysRevB.99.081106.
- Pustogow et al. (2021) Pustogow, A.; Rösslhuber, R.; Tan, Y.; Uykur, E.; Böhme, A.; Wenzel, M.; Saito, Y.; Löhle, A.; Hübner, R.; Kawamoto, A.; et al. Low-temperature dielectric anomaly arising from electronic phase separation at the Mott insulator-metal transition. NPJ Quantum Mater. 2021, 6, 9. \changeurlcolorblackhttps://doi.org/10.1038/s41535-020-00307-0.
- Li et al. (2021) Li, T.; Jiang, S.; Li, L.; Zhang, Y.; Kang, K.; Zhu, J.; Watanabe, K.; Taniguchi, T.; Chowdhury, D.; Fu, L.; et al. Continuous Mott transition in semiconductor moiré superlattices. Nature 2021, 597, 350–354. \changeurlcolorblackhttps://doi.org/10.1038/s41586-021-03853-0.
- Simonian et al. (1997) Simonian, D.; Kravchenko, S.V.; Sarachik, M.P. Reflection symmetry at a B=0 metal-insulator transition in two dimensions. Phys. Rev. B 1997, 55, R13421–R13423. \changeurlcolorblackhttps://doi.org/10.1103/PhysRevB.55.R13421.
- Dobrosavljević et al. (1997) Dobrosavljević, V.; Abrahams, E.; Miranda, E.; Chakravarty, S. Scaling Theory of Two-Dimensional Metal-Insulator Transitions. Phys. Rev. Lett. 1997, 79, 455–458. \changeurlcolorblackhttps://doi.org/10.1103/PhysRevLett.79.455.
- Kravchenko et al. (1995) Kravchenko, S.V.; Mason, W.E.; Bowker, G.E.; Furneaux, J.E.; Pudalov, V.M.; D’iorio, M. Scaling of an anomalous metal-insulator transition in a two-dimensional system in silicon at B=0. Phys. Rev. B 1995, 51, 7038–7045. \changeurlcolorblackhttps://doi.org/10.1103/PhysRevB.51.7038.
- Furukawa et al. (2015) Furukawa, T.; Miyagawa, K.; Taniguchi, H.; Kato, R.; Kanoda, K. Quantum criticality of Mott transition in organic materials. Nat. Phys. 2015, 11, 221–224. \changeurlcolorblackhttps://doi.org/10.1038/nphys3235.
- Ando et al. (1982) Ando, T.; Fowler, A.B.; Stern, F. Electronic properties of two-dimensional systems. Rev. Mod. Phys. 1982, 54, 437–672. \changeurlcolorblackhttps://doi.org/10.1103/RevModPhys.54.437.
- Camjayi et al. (2008) Camjayi, A.; Haule, K.; Dobrosavljević, V.; Kotliar, G. Coulomb correlations and the Wigner–Mott transition. Nat. Phys. 2008, 4, 932–935.
- Amaricci et al. (2010) Amaricci, A.; Camjayi, A.; Haule, K.; Kotliar, G.; Tanasković, D.; Dobrosavljević, V. Extended hubbard model: Charge ordering and Wigner–Mott transition. Phys. Rev. B 2010, 82, 155102.
- Radonjić et al. (2012) Radonjić, M.M.; Tanasković, D.; Dobrosavljević, V.; Haule, K.; Kotliar, G. Wigner–Mott scaling of transport near the two-dimensional metal-insulator transition. Phys. Rev. B 2012, 85, 085133–7. \changeurlcolorblackhttps://doi.org/10.1103/PhysRevB.85.085133.
- Shashkin et al. (2020) Shashkin, A.; Melnikov, M.Y.; Dolgopolov, V.; Radonjić, M.; Dobrosavljević, V.; Huang, S.H.; Liu, C.; Zhu, A.Y.; Kravchenko, S. Manifestation of strong correlations in transport in ultraclean SiGe/Si/SiGe quantum wells. Phys. Rev. B 2020, 102, 081119.
- Shashkin et al. (2022) Shashkin, A.; Melnikov, M.Y.; Dolgopolov, V.; Radonjić, M.; Dobrosavljević, V.; Huang, S.H.; Liu, C.; Zhu, A.Y.; Kravchenko, S. Spin effect on the low-temperature resistivity maximum in a strongly interacting 2D electron system. Sci. Rep. 2022, 12, 5080.
- Moon et al. (2020) Moon, B.H.; Han, G.H.; Radonjić, M.M.; Ji, H.; Dobrosavljević, V. Quantum critical scaling for finite-temperature Mott-like metal-insulator crossover in few-layered MoS 2. Phys. Rev. B 2020, 102, 245424.
- Popović et al. (1997) Popović, D.; Fowler, A.B.; Washburn, S. Metal-Insulator Transition in Two Dimensions: Effects of Disorder and Magnetic Field. Phys. Rev. Lett. 1997, 79, 1543–1546. \changeurlcolorblackhttps://doi.org/10.1103/PhysRevLett.79.1543.
- Bogdanovich and Popović (2002) Bogdanovich, S.c.v.; Popović, D. Onset of Glassy Dynamics in a Two-Dimensional Electron System in Silicon. Phys. Rev. Lett. 2002, 88, 236401. \changeurlcolorblackhttps://doi.org/10.1103/PhysRevLett.88.236401.
- Shashkin et al. (2001) Shashkin, A.A.; Kravchenko, S.V.; Klapwijk, T.M. Metal-Insulator Transition in a 2D Electron Gas: Equivalence of Two Approaches for Determining the Critical Point. Phys. Rev. Lett. 2001, 87, 266402. \changeurlcolorblackhttps://doi.org/10.1103/PhysRevLett.87.266402.
- Shashkin et al. (2002) Shashkin, A.A.; Kravchenko, S.V.; Dolgopolov, V.T.; Klapwijk, T.M. Sharp increase of the effective mass near the critical density in a metallic two-dimensional electron system. Phys. Rev. B 2002, 66, 073303. \changeurlcolorblackhttps://doi.org/10.1103/PhysRevB.66.073303.
- Smolenski et al. (2021) Smolenski, T.; Dolgirev, P.E.; Kuhlenkamp, C.; Popert, A.; Shimazaki, Y.; Back, P.; Lu, X.; Kroner, M.; Watanabe, K.; Taniguchi, T.; et al. Signatures of Wigner crystal of electrons in a monolayer semiconductor. Nature 2021, 595, 53. \changeurlcolorblackhttps://doi.org/10.1038/s41586-021-03590-4.
- Dressel and Tomić (2020) Dressel, M.; Tomić, S. Molecular quantum materials: Electronic phases and charge dynamics in two-dimensional organic solids. Adv. Phys. 2020, 69, 1–120. \changeurlcolorblackhttps://doi.org/10.1080/00018732.2020.1837833.
- Jerome (1991) Jerome, D. The physics of organic superconductors. Science 1991, 252, 1509–1514. \changeurlcolorblackhttps://doi.org/10.1126/science.252.5012.1509.
- Kagawa et al. (2013) Kagawa, F.; Sato, T.; Miyagawa, K.; Kanoda, K.; Tokura, Y.; Kobayashi, K.; Kumai, R.; Murakami, Y. Charge-cluster glass in an organic conductor. Nat. Phys. 2013, 9, 419–422. \changeurlcolorblackhttps://doi.org/10.1038/nphys2642.
- Kurosaki et al. (2005) Kurosaki, Y.; Shimizu, Y.; Miyagawa, K.; Kanoda, K.; Saito, G. Mott Transition from a Spin Liquid to a Fermi Liquid in the Spin-Frustrated Organic Conductor . Phys. Rev. Lett. 2005, 95, 177001. \changeurlcolorblackhttps://doi.org/10.1103/PhysRevLett.95.177001.
- Pustogow et al. (2018) Pustogow, A.; Bories, M.; Löhle, A.; Rösslhuber, R.; Zhukova, E.; Gorshunov, B.; Tomić, S.; Schlueter, J.A.; Hübner, R.; Hiramatsu, T.; et al. Quantum spin liquids unveil the genuine Mott state. Nat. Mater. 2018, 17, 773–777.
- Vučičević et al. (2013) Vučičević, J.; Terletska, H.; Tanasković, D.; Dobrosavljević, V. Finite-temperature crossover and the quantum Widom line near the Mott transition. Phys. Rev. B 2013, 88, 075143.
- Pustogow et al. (2021) Pustogow, A.; Saito, Y.; Löhle, A.; Sanz Alonso, M.; Kawamoto, A.; Dobrosavljević, V.; Dressel, M.; Fratini, S. Rise and fall of Landau’s quasiparticles while approaching the Mott transition. Nat. Commun. 2021, 12, 1571. \changeurlcolorblackhttps://doi.org/10.1038/s41467-021-21741-z.
- Pomeranchuk (1950) Pomeranchuk, I. On the thery of . Zh. Eksp. Teor. Fiz. 1950, 20, 919.
- Terletska et al. (2011) Terletska, H.; Vucicevic, J.; Tanasković, D.; Dobrosavljević, V. Quantum Critical Transport near the Mott Transition. Phys. Rev. Lett. 2011, 107, 026401. \changeurlcolorblackhttps://doi.org/10.1103/physrevlett.107.026401.
- Deng et al. (2013) Deng, X.; Mravlje, J.; Žitko, R.; Ferrero, M.; Kotliar, G.; Georges, A. How Bad Metals Turn Good: Spectroscopic Signatures of Resilient Quasiparticles. Phys. Rev. Lett. 2013, 110, 086401. \changeurlcolorblackhttps://doi.org/10.1103/PhysRevLett.110.086401.
- Emery and Kivelson (1995) Emery, V.J.; Kivelson, S.A. Superconductivity in Bad Metals. Phys. Rev. Lett. 1995, 74, 3253–3256. \changeurlcolorblackhttps://doi.org/10.1103/ PhysRevLett.74.3253.
- ‖ et al. (2004) Hussey, N.E.; Takenaka, K.; Takagi, H. Universality of the Mott–Ioffe–Regel limit in metals. Philos. Mag. 2004, 84, 2847–2864. \changeurlcolorblackhttps://doi.org/10.1080/14786430410001716944.
- Rademaker (2021) Rademaker, L. Spin-Orbit Coupling in Transition Metal Dichalcogenide Heterobilayer Flat Bands. arXiv 2021, arXiv:2111.06208.
- Ghiotto et al. (2021) Ghiotto, A.; Shih, E.M.; Pereira, G.S.S.G.; Rhodes, D.A.; Kim, B.; Zang, J.; Millis, A.J.; Watanabe, K.; Taniguchi, T.; Hone, J.C.; et al. Quantum Criticality in Twisted Transition Metal Dichalcogenides. Nature 2021, 597, 345. \changeurlcolorblackhttps://doi.org/10.1038/s41586-021-03815-6.
- Savary and Balents (2016) Savary, L.; Balents, L. Quantum spin liquids: a review. Rep. Prog. Phys. 2016, 80, 016502–56. \changeurlcolorblackhttps://doi.org/10.1088/0034-4885/80/1/016502.
- Senthil (2008) Senthil, T. Theory of a continuous Mott transition in two dimensions. Phys. Rev. B 2008, 78, 045109. \changeurlcolorblackhttps://doi.org/10.1103/ PhysRevB.78.045109.
- Georges et al. (1996) Georges, A.; Kotliar, G.; Krauth, W.; Rozenberg, M.J. Dynamical mean-field theory of strongly correlated fermion systems and the limit of infinite dimensions. Rev. Mod. Phys. 1996, 68, 13–125. \changeurlcolorblackhttps://doi.org/10.1103/RevModPhys.68.13.
- Spivak and Kivelson (2004) Spivak, B.; Kivelson, S.A. Phases intermediate between a two-dimensional electron liquid and Wigner crystal. Phys. Rev. B 2004, 70, 155114. \changeurlcolorblackhttps://doi.org/10.1103/PhysRevB.70.155114.
- Spivak and Kivelson (2006) Spivak, B.; Kivelson, S.A. Transport in two dimensional electronic micro-emulsions. Ann. Phys. 2006, 321, 2071–2115. \changeurlcolorblackhttps://doi.org/10.1016/j.aop.2005.12.002.
- Baskaran et al. (1987) Baskaran, G.; Zou, Z.; Anderson, P. The resonating valence bond state and high-Tc superconductivity—A mean field theory. Solid State Commun. 1987, 63, 973–976. \changeurlcolorblackhttps://doi.org/10.1016/0038-1098(87)90642-9.
- Jacko et al. (2009) Jacko, A.; Fjærestad, J.; Powell, B. A unified explanation of the Kadowaki–Woods ratio in strongly correlated metals. Nat. Phys. 2009, 5, 422–425.
- Podolsky et al. (2009) Podolsky, D.; Paramekanti, A.; Kim, Y.B.; Senthil, T. Mott Transition between a Spin-Liquid Insulator and a Metal in Three Dimensions. Phys. Rev. Lett. 2009, 102, 186401. \changeurlcolorblackhttps://doi.org/10.1103/PhysRevLett.102.186401.
- Xu et al. (2021) Xu, Y.; Wu, X.C.; Ye, M.X.; Luo, Z.X.; Jian, C.M.; Xu, C. Metal-Insulator Transition with Charge Fractionalization. arXiv 2021, arXiv:2106.14910.
- Musser et al. (2021) Musser, S.; Senthil, T.; Chowdhury, D. Theory of a Continuous Bandwidth-tuned Wigner–Mott Transition. arXiv 2021, arXiv:2111.09894.
- Vučičević et al. (2015) Vučičević, J.; Tanasković, D.; Rozenberg, M.; Dobrosavljević, V. Bad-metal behavior reveals Mott quantum criticality in doped Hubbard models. Phys. Rev. Lett. 2015, 114, 246402.
- Lee et al. (2016) Lee, T.H.; Florens, S.; Dobrosavljević, V. Fate of spinons at the Mott point. Phys. Rev. Lett. 2016, 117, 136601.
- Brinkman and Rice (1970) Brinkman, W.F.; Rice, T.M. Application of Gutzwiller’s Variational Method to the Metal-Insulator Transition. Phys. Rev. B 1970, 2, 4302–4304. \changeurlcolorblackhttps://doi.org/10.1103/physrevb.2.4302.
- Eisenlohr et al. (2019) Eisenlohr, H.; Lee, S.S.B.; Vojta, M. Mott quantum criticality in the one-band Hubbard model: Dynamical mean-field theory, power-law spectra, and scaling. Phys. Rev. B 2019, 100, 155152. \changeurlcolorblackhttps://doi.org/10.1103/PhysRevB.100.155152.
- Radonjić et al. (2011) Radonjić, Miloš M.; Tanasković, D.; Dobrosavljević, V.; Haule K. Influence of disorder on incoherent transport near the Mott transition. Phys. Rev. B 2010, 81, 075118. \changeurlcolorblack https://link.aps.org/doi/10.1103/PhysRevB.81.075118.
- Jamei et al. (2005) Jamei, R.; Kivelson, S.; Spivak, B. Universal Aspects of Coulomb-Frustrated Phase Separation. Phys. Rev. Lett. 2005, 94, 056805-4. \changeurlcolorblackhttps://doi.org/10.1103/physrevlett.94.056805.
- Dagotto (2005) Dagotto, E. Complexity in Strongly Correlated Electronic Systems. Science 2005, 309, 257–262. \changeurlcolorblackhttps://doi.org/10.1126/science.1107559.
- Urai et al. (2019) Urai, M.; Furukawa, T.; Seki, Y.; Miyagawa, K.; Sasaki, T.; Taniguchi, H.; Kanoda, K. Disorder unveils Mott quantum criticality behind a first-order transition in the quasi-two-dimensional organic conductor . Phys. Rev. B 2019, 99, 245139. \changeurlcolorblackhttps://doi.org/10.1103/PhysRevB.99.245139.
- Yamamoto et al. (2020) Yamamoto, R.; Furukawa, T.; Miyagawa, K.; Sasaki, T.; Kanoda, K.; Itou, T. Electronic Griffiths Phase in Disordered Mott-Transition Systems. Phys. Rev. Lett. 2020, 124, 046404. \changeurlcolorblackhttps://doi.org/10.1103/PhysRevLett.124.046404.
- Aharony et al. (1976) Aharony, A.; Imry, Y.; Ma, S.k. Lowering of Dimensionality in Phase Transitions with Random Fields. Phys. Rev. Lett. 1976, 37, 1364–1367. \changeurlcolorblackhttps://doi.org/10.1103/PhysRevLett.37.1364.
- Kim et al. (2022) Kim, S.; Senthil, T.; Chowdhury, D. Continuous Mott transition in moiré semiconductors: Role of long-wavelength inhomogeneities. arXiv 2022, arxiv:2204.10865.
- Economou (2005) Economou, E.N. Green’s Functions in Quantum Physics; Springer: Berlin, Germany, 2005.
- Efros and Shklovskii (1976) Efros, A.L.; Shklovskii, B.I. Critical Behaviour of Conductivity and Dielectric Constant near the Metal-Non-Metal Transition Threshold. Phys. Stat. Sol. B 1976, 76, 475. \changeurlcolorblackhttps://doi.org/10.1002/pssb.2220760205.
- Miranda and Dobrosavljević (2005) Miranda, E.; Dobrosavljević, V. Disorder-driven non-Fermi liquid behaviour of correlated electrons. Rep. Prog. Phys. 2005, 68, 2337.