Searching for High-Energy Neutrino Emission from Galaxy Clusters with IceCube
Abstract
Galaxy clusters have the potential to accelerate cosmic rays (CRs) to ultra-high energies via accretion shocks or embedded CR acceleration sites. CRs with energies below the Hillas condition will be confined within the cluster and will eventually interact with the intracluster medium (ICM) gas to produce secondary neutrinos and rays. Using 9.5 years of muon-neutrino track events from the IceCube Neutrino Observatory, we report the results of a stacking analysis of 1094 galaxy clusters, with masses and redshifts between 0.01 and 1, detected by the Planck mission via the Sunyaev-Zeldovich (SZ) effect. We find no evidence for significant neutrino emission and report upper limits on the cumulative unresolved neutrino flux from massive galaxy clusters after accounting for the completeness of the catalog up to a redshift of 2, assuming three different weighting scenarios for the stacking and three different power-law spectra. Weighting the sources according to mass and distance, we set upper limits at confidence level that constrain the flux of neutrinos from massive galaxy clusters ( ) to be no more than of the diffuse IceCube observations at 100 TeV, assuming an unbroken power-law spectrum.
tablenum \restoresymbolSIXtablenum
1 Introduction
The IceCube Neutrino Observatory has been observing a steady diffuse flux of TeV–PeV astrophysical neutrinos for over a decade (Aartsen et al., 2020a). Despite recent indications of potential point sources of neutrinos (Aartsen et al., 2018a, b, 2020b), the origin of the majority of the flux remains undiscovered. The mystery is closely tied to the sources of ultra-high-energy ( eV) cosmic rays (UHECRs) (Abu-Zayyad et al., 2013; Aab et al., 2017), as well as the GeV–TeV extra-galactic gamma-ray background (EGB) observed by Fermi-LAT (Ackermann et al., 2015a) – both of which have been observed to produce energy fluxes comparable to that of high-energy neutrinos above 100 TeV. This has led several authors to propose a unique astrophysical source class that could explain all three aforementioned fluxes (e.g., Fang & Murase (2018); Zandanel et al. (2015); Murase et al. (2008); Tamborra et al. (2014)). Galaxy clusters are one such viable class of sources.
During large-scale structure formation, clusters of galaxies emerge as a result of accretion and mergers of smaller structures, producing Mpc-scale shock waves (Miniati et al., 2000; Ryu et al., 2003) and a turbulent intra-cluster medium (ICM). The shocks can potentially accelerate CRs to energies as high as eV (Inoue et al., 2007), depending on the mass of the cluster (Fang & Olinto, 2016; Enßlin et al., 2011; Wiener & Zweibel, 2019), through the first order Fermi acceleration mechanism (Blandford & Eichler, 1987). Other proposed candidates for CR acceleration within clusters are embedded compact objects such as active Active Galactic Nuclei (AGN) (Stecker et al., 1991; Winter, 2013; Fang & Murase, 2018) and magnetars (Murase et al., 2009).
The predicted maximum accelerated CR energy and resultant neutrino flux are highly dependent on the properties of the embedded sources, and vary greatly from model to model. For both the Mpc-scale shock and embedded source scenarios, the accelerated CRs are confined in clusters for times exceeding the age of the universe (Berezinsky et al., 1997). These CRs interact with the ICM to produce pions, which decay, yielding neutrinos and rays.
Galaxy clusters remain unobserved in very-high-energy gamma rays ( GeV). Fermi-LAT (Dutson et al., 2013; Huber et al., 2013) as well as Imaging Air Cherenkov Telescopes (IACTs; Arlen et al. (2012); Acciari et al. (2018); Abramowski et al. (2012)) have reported upper limits on the gamma-ray emission from several nearby clusters. A detection of astrophysical neutrinos from galaxy clusters would constitute incontrovertible evidence for proton acceleration in these objects. Previous IceCube analyses have reported constraints on the neutrino emission from five nearby clusters (Abbasi et al., 2011a; Aartsen et al., 2013). However, the source class as a whole remains a largely uncharted territory in terms of neutrino searches. Some works (Hussain et al., 2021; Fang & Murase, 2018) predict that almost the entirety of the diffuse flux observed by IceCube could be explained by the cumulative emission from galaxy clusters. In this work, for the first time, we use cosmological data to test the contribution of galaxy clusters to the diffuse astrophysical neutrino flux. In particular, we focus on testing the scenarios in which the most massive clusters accelerate CRs in accretion shocks and/or cluster mergers (Fang & Olinto, 2016; Hussain et al., 2021, 2022).
2 Galaxy Cluster Catalog
The mass and redshift range of galaxy clusters with the largest contribution to the neutrino flux varies across models. For this study, we choose a catalog of clusters that extends in redshift coverage between 0.01 and 0.97, and has cluster masses above , where is the solar mass. This selection allows us to test neutrino production in some of the largest and latest-formed objects in the universe. Our catalog of galaxy clusters is taken directly from the Planck 2015 survey (Ade et al., 2016a). The catalog consists of all galaxy clusters detected through the variations observed in the brightness of cosmic microwave background (CMB). These variations are caused by the inverse Compton scattering of CMB photons off high-energy electrons in the ICM, known as the Sunyaev-Zeldovich (SZ) effect (Carlstrom et al., 2002). In this work, we solely use the 1094 sources for which a redshift estimate is available. The resulting selection of clusters covers 83% of the sky.
2.1 Catalog Completeness
In order to extrapolate the results from our source sample to the entire population of galaxy clusters, we need an estimate for the completeness of the Planck catalog. This requires a calculation of the fraction of clusters that would be reliably detected by the Planck mission given a theoretical distribution of galaxy clusters in the universe. We extract Planck’s completeness as a function of redshift and cluster mass from the information given in Ade et al. (2016a) using simulations. We describe the steps briefly here and point the reader to Raghunathan et al. (2022) for more details.
We start by simulating maps in individual Planck frequency bands which contain signals from astrophysical foregrounds, the CMB, instrumental noise, and the thermal Sunyaev-Zeldovich (tSZ) signal. The astrophysical foregrounds include contributions from diffuse SZ signals (both kinematic and thermal) and also emission from dusty star-forming and radio galaxies. Galactic foregrounds are ignored since the Planck galaxy-cluster catalog is constructed after applying a mask to remove the majority of the galactic dust emission. The tSZ signal from a hypothetical cluster of given mass and redshift is modeled using a generalized Navarro-Frenk-White (NFW) profile (Nagai et al., 2007) calibrated with X-ray observations by Arnaud et al. (2010). The dimensionless pressure profile of the ICM is integrated along the line of sight to obtain the Compton-y signal , where is a given position on the sky.
Next, we integrate over the angular extent of the cluster, , to obtain the integrated Comptonization parameter, . Here the subscript refers to a sphere where the mean mass over-density of the cluster is at least 500 times the cosmic critical density at the redshift of the cluster. is directly related to the cluster mass (Ade et al., 2016b).
Following the maximum likelihood approach described in Raghunathan et al. (2022), we combine the simulated maps from all Planck frequency bands and obtain the signal-to-noise ratio (SNR) for each cluster as a function of mass () and redshift () in the ranges: in logarithmic steps of 0.1 and in steps of 0.1. For detection, a cluster must have a minimum SNR of 5. Using the detected clusters, we estimate the catalog completeness as (Ade et al., 2016b; Alonso et al., 2016),
| (1) |
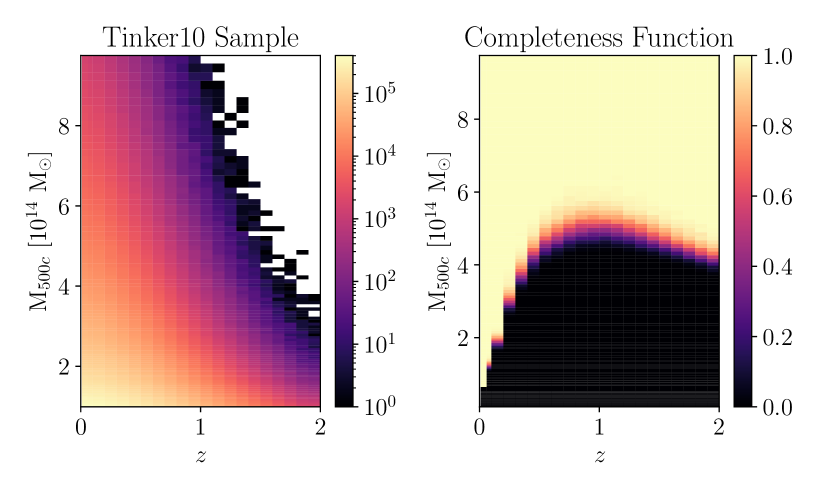
where is the detection threshold, is the measurement uncertainty of the integrated signal estimated above in simulations, and is the true flux. Figure 1 (right panel) shows the completeness obtained as a function of redshift and mass.
We then create a theoretical distribution of galaxy clusters by drawing samples from the Tinker 2010 halo mass function (hmf) (Tinker et al., 2010) binned in redshift and mass (Figure 1, left panel). We only consider galaxy clusters with masses between and and redshifts between 0.01 and 2 in our simulation. In our energy range of interest, and in models where CR acceleration takes place through shock waves due to the ICM accretion onto clusters, clusters with masses below or are not expected to produce a significant flux of neutrinos at earth (Fang & Olinto, 2016). In the aforementioned scenarios, the bulk of the flux contribution comes from in accordance with the cosmological distribution of sources (Fang & Olinto, 2016).
We scale this theoretical distribution with the Planck completeness function obtained above to estimate the fraction of detectable clusters. This fraction is determined by dividing the sum of the scaled distribution by the total number of clusters in the hmf sample. In the case where each redshift and mass bin is equally weighted, we find a catalog completeness of . Other weighting schemes are discussed in the following section. We note that our completeness calculations are robust within under different choices of the hmf.
2.2 Source Weighting
In this work, we consider three scenarios in which the properties of galaxy clusters may be correlated with their neutrino flux on earth. These scenarios are encoded in the weighting schemes used in the stacking analysis (Section 4). We assign each cluster a weight where the index runs over all clusters in the catalog.
The simplest and most conservative scenario is that of equal weights, where we set for all clusters. Here we effectively assign equal relative neutrino intensity to each object in the catalog, regardless of its properties. We note that this is an unphysical scenario, and results based on this weighting scheme represent the most conservative upper bounds obtained with this analysis.
A more realistic scenario is one where the observed neutrino flux from a cluster is inversely proportional to the cluster’s distance squared. In this weighting scheme, we assign weights as , where is the cluster distance obtained from its redshift using the cosmological parameters from Planck (Ade et al., 2016a). We refer to this as “distance weighting” throughout the paper.
In addition to a flux that scales with , more massive clusters with longer formation histories are expected to have a higher CR content (Berezinsky et al., 1997), with the CR luminosity being proportional to the cluster mass (Fang & Olinto, 2016). Our final scenario weights sources by , where is the source mass. We will refer to this weighting scheme as “mass weighting” throughout this paper.
Finally, for each weighting scheme, we calculate an “effective completeness” of the catalog by weighting the mass and redshift bins following the procedure described in Section 2.1. The distance weighting and the mass weighting have an estimated effective completeness of , and , respectively.
We note two caveats with respect to our effective completeness calculation. Our calculation does not extend to scenarios in which the bulk of CR acceleration is driven by sources embedded in less massive ( clusters at high . For example, reducing the minimum halo mass in our simulations from to would decrease the mass-weighted completeness to . In addition, considering a cosmological evolution of source density proportional to (Fang & Murase, 2018) by introducing an additional weighting factor in each redshift bin, would reduce the distance weighted completeness to and mass-weighted completeness to . (X-ray AGN typically evolve with , in which the completeness is further reduced.) Models of diffuse neutrino production through large-scale structure formation are less sensitive to the contribution from low-mass halos or and are therefore suitably tested in our analysis.
3 Detector and Dataset
The IceCube Neutrino Observatory instruments a cubic kilometer of South Pole ice with 5160 digital optical modules (DOMs) deployed between 1450 m and 2450 m below the surface in Antarctica. IceCube is composed of 86 vertical strings, with 60 DOMs per string. The DOMs consist of a photomultiplier tube (PMT) and on-board readout electronics designed to detect Cherenkov light induced by charged particles that can be produced in charged-current (CC) and neutral-current (NC) neutrino interactions (Abbasi et al., 2009, 2010). These secondary particles result in either track-like (CC interactions of muon neutrinos) or cascade-like (all other CC and NC interactions) optical signatures that are recorded by DOMs. The photon counts and timing information are used to reconstruct both the energy deposition and particle direction. IceCube can detect all flavors of neutrinos and can’t discriminate between neutrinos and anti-neutrinos. The angular resolution achieved depends on the optical signature, with tracks yielding the best resolution, typically below 1∘ above 1 TeV (Aartsen et al., 2017a).
Due to their superior angular resolution, the analysis presented in this work uses a 9.5-year data sample consisting exclusively of muon tracks. The data set, recorded between April 2008 and November 2017 (Aartsen et al., 2017a, b), covers the full sky. The majority of the dataset consists of background events induced by atmospheric neutrinos and atmospheric muons created by CR air showers in the upper atmosphere. A detailed description of the dataset and the related reconstruction algorithms used in this work can be found in Aartsen et al. (2014); Abbasi et al. (2011b).
4 Analysis
4.1 Likelihood and Test Statistic
In order to search for the cumulative neutrino emission from our catalog of galaxy clusters in data dominated by atmospheric backgrounds, we perform a stacking analysis using an unbinned maximum-likelihood method (Braun et al., 2008; Achterberg et al., 2006).
The likelihood function for stacked clusters is defined as,
| (2) |
where is the number of signal events, is the spectral index of an assumed unbroken power-law spectrum that is common to all sources, is the total number of data events, is the signal probability distribution function (PDF) for the th neutrino event for the -th source, is the background PDF for the -th neutrino event, and and are stacking weights described below.
The background PDF is a function of both the reconstructed event energy, , and the reconstructed event declination, , and is calculated by randomizing the right ascension of events in a given declination band. The signal PDF is a weighted superposition of the signal PDFs of all sources in our selection of galaxy clusters. A potential source of astrophysical neutrinos should be distinguishable from background due to the spatial clustering of high-energy events in its vicinity. Therefore, each consists of a Gaussian spatial term and an energy term that favors high-energy events,
| (3) |
The term is the angular separation between event and source , 111Only the event angular uncertainty, , is considered because the source angular uncertainty, , is known to much higher accuracy. Planck’s angular resolution is on the order of 1 arcmin (Ade et al., 2016a), while IceCube’s angular resolution is energy dependent, but at least an order of magnitude less accurate (Aartsen et al., 2017a). is the angular uncertainty of event , and is a simulated energy PDF, where is assumed to have a value between 1 and 4. Nearby clusters with extended profiles are not part of our sample, therefore the likelihood function is independent of source extension.
The source weight in Eq. 2 parameterizes the relative contribution of each cluster to the total signal. It is determined by the weighting schemes described in section 2.2. The model-independent term, , depends on the detector acceptance, and is determined by the effective area of the detector at the source location and the assumed neutrino spectrum. For more details see Abbasi et al. (2022a); Aartsen et al. (2017c).
In order to determine the number of signal events and the spectral index that best describe the data, the likelihood in Eq. 2 is maximized with respect to and , and tested against the null hypothesis, which corresponds to the background-only scenario (). For that purpose, we define a test statistic (TS) as,
| (4) |
where and are the best-fit values. We note that each choice of weights will result in a different fitted , and TS.
4.2 Sensitivity
Before looking at the actual data, we performed an ensemble of pseudo-experiments to determine the sensitivity of the analysis. First, we generated a set of background-only pseudo-experiments by randomizing the data in right ascension. For each such scramble, we used the maximum-likelihood method and calculated a corresponding TS. This allowed us to create a background-only TS distribution with 20,000 scrambles.
We then constructed hundreds of simulations where we injected pseudosignal events into the scrambled data. For a fixed number of injected events, we performed several hundreds of pseudo-experiments to determine the corresponding TS distribution. This process was repeated for increased numbers of pseudosignal events. We simulated the pseudosignal neutrinos according to a power-law spectrum with a given spectral index , and injected them at the locations of the galaxy cluster sources. The number of events injected at a given source position is weighted by the corresponding stacking weight of that source. The number of injected signal events for which the TS values exceed the median of the background-only TS distribution 90% of the time is defined as the sensitivity of the analysis for an astrophysical signal originating from galaxy clusters. Alternatively, this sensitivity corresponds to the median upper limit at 90% confidence level (CL) that is set in an ensemble of background-only pseudo-experiments. We find that for a given weighting scheme, this analysis is most sensitive to a hard spectral index of 2.0. This is expected as a hard spectrum is more distinguishable from the atmospheric background which follows a significantly softer spectrum (Abbasi et al., 2011b).
5 Results
We perform a stacking analysis on our catalog as described in Section 4 for the different weighting schemes described in Section 2.2. None of the scenarios we investigate show a significant excess of signal events over background. The best-fit number of signal events, as well as the corresponding TS value, is zero for each weighting scheme.
In order not to report overly constraining limits due to potential under-fluctuations in the data, we set the upper limits at the 90% sensitivity level described above. Table 5 shows the upper limits on the unresolved flux of galaxy clusters at 100 TeV for each weighting scenario after scaling for the effective completeness of the catalog and correcting for the 83% sky coverage of Planck.
The upper limits set in this analysis can then be compared with the diffuse muon-neutrino flux measured by IceCube (Abbasi et al., 2022b) to estimate the maximum contribution of the galaxy cluster population to the diffuse observations. This fraction is also reported in Table 5 for each scenario and assumed spectral index. In addition, Figure 2 shows the upper limits on the neutrino emission from clusters for an assumed power-law spectrum. This limit is directly compared to the diffuse muon-neutrino observations over the full sensitive energy range of IceCube, which have a best fit power-law spectrum (Abbasi et al., 2022b).
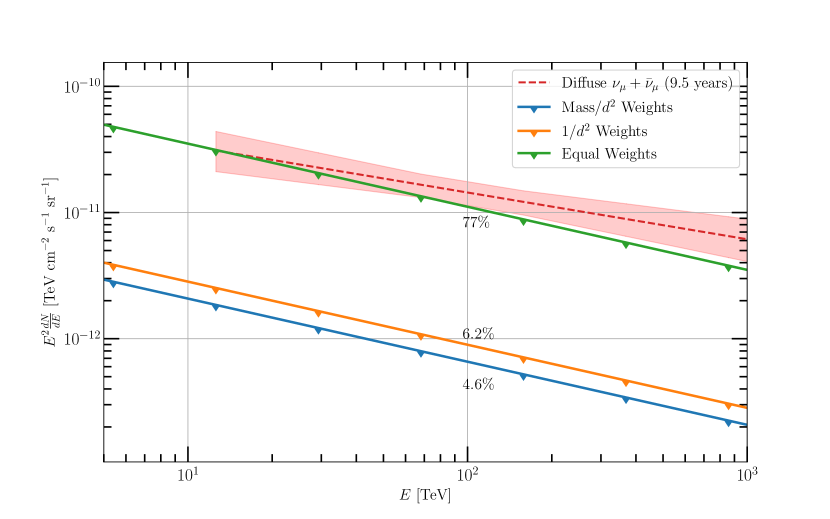
We find the equal-weighting case to provide the weakest constraints across all spectral indices. This is expected, because this weighting scheme is meant to act as a check on our methods, without corresponding to a realistic, physical scenario. The distance weighting and the mass weighting schemes provide similar constraints to one another, which is also expected, as they are similar in terms of both the physics cases they are testing and their effective completeness. Both cases assume that the neutrino flux falls off with the cluster distance as . Distance weighting assumes that galaxy clusters are neutrino standard candles. On the other hand, the mass weighting assumes linear proportionality between neutrino luminosity and cluster mass. For a spectral index of 2.5
the results exclude a maximum contribution of 77% at 100 TeV from galaxy clusters assuming equal weights. Under the more realistic distance and mass weighting schemes, this contribution is constrained down to 6.2% and 4.6% at 100 TeV, respectively.
| Weighting Scheme | Diffuse Contribution | Diffuse Contribution | Diffuse Contribution | |||
|---|---|---|---|---|---|---|
| Equal | 37% | 77% | 32.7% | |||
| Distance | 4.5% | 6.2% | 1.7% | |||
| Mass | 4.3% | 4.6% | ||||
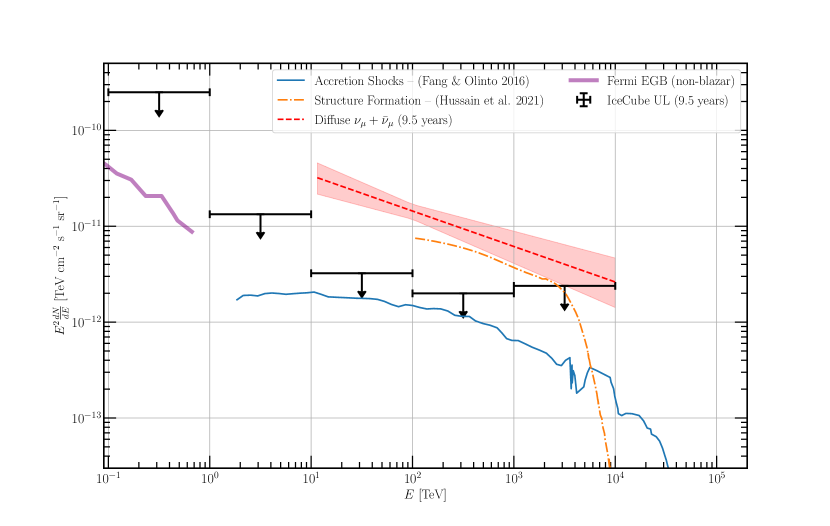
Another useful way of comparing the contribution of galaxy clusters to diffuse neutrino observations is by evaluating the upper limits in quasi-differential energy bins. We calculate the upper limits in one-decade energy bins, assuming an spectrum across the bin. Figure 3 shows the quasi-differential limits for the distance weighting scheme along with comparable theoretical predictions from the mass and redshift range used in this work. The IceCube upper limits obtained in this work are most constraining between 10 TeV and 1 PeV compared to the diffuse neutrino observations, where we find that the population of galaxy clusters in our mass and redshift range of interest cannot contribute to more than 9%–13% of the diffuse neutrino flux.
Our results above 100 TeV constrain the model based on magnetohydrodynamic (MHD) simulations by Hussain et al. (2021), which predicts that most of the contribution to the diffuse neutrino flux can be attributed to clusters with masses above . For the aforementioned model, our limits exclude a CR injection spectrum of 1.5, and a conservative energy conversion rate of 0.5%. Our limits are robust between 100 TeV and 1 PeV to the choice of the injection spectrum and maximum CR-energy. These conclusions can change for a different choice of kinetic energy conversion rates and assumptions about source evolution. We note that certain models of structure formation followed by hadronic interactions in galaxy clusters suggest that the total flux from clusters is indeed very low and not able to explain more than a few percent of the total diffuse flux (Zandanel et al., 2015; Fang & Olinto, 2016). Our analysis is not sensitive enough to probe such models. As explained in section 2.2, models that assume AGN as the embedded sources of CRs in clusters (Fang & Murase, 2018) are not constrained using the mass range of clusters tested in this work.
6 Conclusions
In this work, we presented a search for neutrinos produced by a large catalog of galaxy clusters, which are expected to produce neutrinos through embedded sources, accretion shocks, or both. We performed a stacking analysis with 1094 SZ-selected galaxy clusters from Planck using 9.5 years of muon-track IceCube data. Three different weighting schemes were investigated, i.e., equal weights, distance weights (), and mass weights (). We find no evidence for neutrino emission in any of the scenarios considered. Assuming an unbroken power-law flux common among all galaxy clusters, we compute upper limits at 90% CL on the diffuse neutrino flux from galaxy clusters with masses between and and a redshift between 0.01 and 2 using a (simulated and extrapolated in ) complete catalog of galaxy clusters. We constrain the galaxy-cluster contribution to the diffuse muon-neutrino observations of Abbasi et al. (2022b) at 100 TeV. In particular, for , galaxy clusters can contribute no more than 67%, 6.2%, and 4.6% for the equal, distance, and mass weighting scenarios, respectively.
We also compute quasi-differential limits at 90% CL on the diffuse neutrino flux from galaxy clusters. These limits exclude the MHD model of Hussain et al. (2021) as neutrino-production mechanisms in galaxy clusters. Accretion-shock model predictions by Zandanel et al. (2015); Fang & Olinto (2016) are not constrained by our limits, making our results consistent with scenarios in which accretion shocks make a sub-dominant contribution to the diffuse neutrino flux (Murase & Waxman, 2016).
An absence of GeV–TeV gamma rays from nearby clusters, along with our new IceCube limits, constrains the shock-acceleration efficiencies in galaxy clusters. Galaxy clusters have long been proposed as the single unified solution to explain the diffuse fluxes of UHECRs, neutrinos, and gamma rays (Fang & Murase, 2018). Our results encourage a revisiting of the multi-messenger connections between different classes of these high-energy particles. The next generation of observatories such as IceCube Gen-2 (Aartsen et al., 2021), CTA (Pérez-Romero, 2021) and AMEGO-X (Fleischhack, 2021), offers a promising prospect for the detection of smoking-gun MeV-PeV multimessenger signatures of CR acceleration in galaxy clusters.
References
- Aab et al. (2017) Aab, A., et al. 2017, JCAP, 04, 038, doi: 10.1088/1475-7516/2017/04/038
- Aartsen et al. (2018a) Aartsen, M., Ackermann, M., Adams, J., et al. 2018a, Science, 361, 147–151, doi: 10.1126/science.aat2890
- Aartsen et al. (2018b) —. 2018b, Science, 361, eaat1378, doi: 10.1126/science.aat1378
- Aartsen et al. (2013) Aartsen, M. G., Abbasi, R., Abdou, Y., et al. 2013, The Astrophysical Journal, 779, 132, doi: 10.1088/0004-637x/779/2/132
- Aartsen et al. (2014) Aartsen, M. G., et al. 2014, JINST, 9, P03009, doi: 10.1088/1748-0221/9/03/P03009
- Aartsen et al. (2017a) —. 2017a, Astrophys. J., 835, 151, doi: 10.3847/1538-4357/835/2/151
- Aartsen et al. (2017b) —. 2017b, Astropart. Phys., 92, 30, doi: 10.1016/j.astropartphys.2017.05.002
- Aartsen et al. (2017c) —. 2017c, Astrophys. J., 835, 45, doi: 10.3847/1538-4357/835/1/45
- Aartsen et al. (2020a) —. 2020a, Phys. Rev. Lett., 125, 121104, doi: 10.1103/PhysRevLett.125.121104
- Aartsen et al. (2020b) —. 2020b, Phys. Rev. Lett., 124, 051103, doi: 10.1103/PhysRevLett.124.051103
- Aartsen et al. (2021) —. 2021, J. Phys. G, 48, 060501, doi: 10.1088/1361-6471/abbd48
- Abbasi et al. (2009) Abbasi, R., Ackermann, M., Adams, J., et al. 2009, Nuclear Instruments and Methods in Physics Research Section A: Accelerators, Spectrometers, Detectors and Associated Equipment, 601, 294–316, doi: 10.1016/j.nima.2009.01.001
- Abbasi et al. (2010) Abbasi, R., Abdou, Y., Abu-Zayyad, T., et al. 2010, Nuclear Instruments and Methods in Physics Research Section A: Accelerators, Spectrometers, Detectors and Associated Equipment, 618, 139–152, doi: 10.1016/j.nima.2010.03.102
- Abbasi et al. (2011a) —. 2011a, The Astrophysical Journal, 732, 18, doi: 10.1088/0004-637x/732/1/18
- Abbasi et al. (2011b) Abbasi, R., et al. 2011b, Phys. Rev. D, 83, 012001, doi: 10.1103/PhysRevD.83.012001
- Abbasi et al. (2022a) —. 2022a, Astrophys. J., 926, 59, doi: 10.3847/1538-4357/ac3cb6
- Abbasi et al. (2022b) —. 2022b, Astrophys. J., 928, 50, doi: 10.3847/1538-4357/ac4d29
- Abramowski et al. (2012) Abramowski, A., Acero, F., Aharonian, F., et al. 2012, ApJ, 750, 123, doi: 10.1088/0004-637X/750/2/123
- Abu-Zayyad et al. (2013) Abu-Zayyad, T., Aida, R., Allen, M., et al. 2013, ApJ, 768, L1, doi: 10.1088/2041-8205/768/1/L1
- Acciari et al. (2018) Acciari, V. A., et al. 2018, Phys. Dark Univ., 22, 38, doi: 10.1016/j.dark.2018.08.002
- Achterberg et al. (2006) Achterberg, A., et al. 2006, Astropart. Phys., 26, 282, doi: 10.1016/J.ASTROPARTPHYS.2006.06.012
- Ackermann et al. (2015a) Ackermann, M., et al. 2015a, JCAP, 09, 008, doi: 10.1088/1475-7516/2015/09/008
- Ackermann et al. (2015b) —. 2015b, Astrophys. J., 799, 86, doi: 10.1088/0004-637X/799/1/86
- Ade et al. (2016a) Ade, P. A. R., Aghanim, N., Arnaud, M., et al. 2016a, Astronomy & Astrophysics, 594, A27, doi: 10.1051/0004-6361/201525823
- Ade et al. (2016b) Ade, P. A. R., et al. 2016b, Astron. Astrophys., 594, A24, doi: 10.1051/0004-6361/201525833
- Alonso et al. (2016) Alonso, D., Louis, T., Bull, P., & Ferreira, P. G. 2016, Phys. Rev. D, 94, 043522, doi: 10.1103/PhysRevD.94.043522
- Arlen et al. (2012) Arlen, T., Aune, T., Beilicke, M., et al. 2012, ApJ, 757, 123, doi: 10.1088/0004-637X/757/2/123
- Arnaud et al. (2010) Arnaud, M., Pratt, G. W., Piffaretti, R., et al. 2010, A&A, 517, A92, doi: 10.1051/0004-6361/200913416
- Berezinsky et al. (1997) Berezinsky, V. S., Blasi, P., & Ptuskin, V. S. 1997, The Astrophysical Journal, 487, 529–535, doi: 10.1086/304622
- Blandford & Eichler (1987) Blandford, R., & Eichler, D. 1987, Phys. Rep., 154, 1, doi: 10.1016/0370-1573(87)90134-7
- Braun et al. (2008) Braun, J., Dumm, J., De Palma, F., et al. 2008, Astroparticle Physics, 29, 299–305, doi: 10.1016/j.astropartphys.2008.02.007
- Carlstrom et al. (2002) Carlstrom, J. E., Holder, G. P., & Reese, E. D. 2002, ARA&A, 40, 643, doi: 10.1146/annurev.astro.40.060401.093803
- Dutson et al. (2013) Dutson, K. L., White, R. J., Edge, A. C., Hinton, J. A., & Hogan, M. T. 2013, MNRAS, 429, 2069, doi: 10.1093/mnras/sts477
- Enßlin et al. (2011) Enßlin, T., Pfrommer, C., Miniati, F., & Subramanian, K. 2011, A&A, 527, A99, doi: 10.1051/0004-6361/201015652
- Fang & Murase (2018) Fang, K., & Murase, K. 2018, Nature Physics, 14, 396–398, doi: 10.1038/s41567-017-0025-4
- Fang & Olinto (2016) Fang, K., & Olinto, A. V. 2016, The Astrophysical Journal, 828, 37, doi: 10.3847/0004-637x/828/1/37
- Fleischhack (2021) Fleischhack, H. 2021, PoS, ICRC2021, 649, doi: 10.22323/1.395.0649
- Huber et al. (2013) Huber, B., Tchernin, C., Eckert, D., et al. 2013, A&A, 560, A64, doi: 10.1051/0004-6361/201321947
- Hussain et al. (2021) Hussain, S., Alves Batista, R., de Gouveia Dal Pino, E. M., & Dolag, K. 2021, MNRAS, 507, 1762, doi: 10.1093/mnras/stab1804
- Hussain et al. (2022) Hussain, S., Batista, R. A., Pino, E. M. d. G. D., & Dolag, K. 2022, arXiv pre-print. https://arxiv.org/abs/2203.01260
- Inoue et al. (2007) Inoue, S., Sigl, G., Miniati, F., & Armengaud, E. 2007, in 30th International Cosmic Ray Conference, Vol. 4, 555–558. https://arxiv.org/abs/0711.1027
- Miniati et al. (2000) Miniati, F., Ryu, D., Kang, H., et al. 2000, The Astrophysical Journal, 542, 608–621, doi: 10.1086/317027
- Murase et al. (2008) Murase, K., Inoue, S., & Nagataki, S. 2008, Astrophys. J. Lett., 689, L105, doi: 10.1086/595882
- Murase et al. (2009) Murase, K., Mészáros, P., & Zhang, B. 2009, Phys. Rev. D, 79, 103001, doi: 10.1103/PhysRevD.79.103001
- Murase & Waxman (2016) Murase, K., & Waxman, E. 2016, Phys. Rev. D, 94, 103006, doi: 10.1103/PhysRevD.94.103006
- Nagai et al. (2007) Nagai, D., Kravtsov, A. V., & Vikhlinin, A. 2007, Astrophys. J., 668, 1, doi: 10.1086/521328
- Pérez-Romero (2021) Pérez-Romero, J. 2021, PoS, ICRC2021, 546, doi: 10.22323/1.395.0546
- Raghunathan et al. (2022) Raghunathan, S., Whitehorn, N., Alvarez, M. A., et al. 2022, ApJ, 926, 172, doi: 10.3847/1538-4357/ac4712
- Ryu et al. (2003) Ryu, D., Kang, H., Hallman, E., & Jones, T. W. 2003, The Astrophysical Journal, 593, 599–610, doi: 10.1086/376723
- Stecker et al. (1991) Stecker, F. W., Done, C., Salamon, M. H., & Sommers, P. 1991, Phys. Rev. Lett., 66, 2697, doi: 10.1103/PhysRevLett.66.2697
- Tamborra et al. (2014) Tamborra, I., Ando, S., & Murase, K. 2014, JCAP, 09, 043, doi: 10.1088/1475-7516/2014/09/043
- Tinker et al. (2010) Tinker, J. L., Robertson, B. E., Kravtsov, A. V., et al. 2010, The Astrophysical Journal, 724, 878–886, doi: 10.1088/0004-637x/724/2/878
- Wiener & Zweibel (2019) Wiener, J., & Zweibel, E. G. 2019, Mon. Not. Roy. Astron. Soc., 488, 280, doi: 10.1093/mnras/stz1705
- Winter (2013) Winter, W. 2013, Phys. Rev. D, 88, 083007, doi: 10.1103/PhysRevD.88.083007
- Zandanel et al. (2015) Zandanel, F., Tamborra, I., Gabici, S., & Ando, S. 2015, A&A, 578, A32, doi: 10.1051/0004-6361/201425249