Magnetic dilution effect and topological phase transitions in (Mn1-xPbx)Bi2Te4
Abstract
As the first intrinsic antiferromagnetic (AFM) topological insulator (TI), MnBi2Te4 has provided a material platform to realize various emergent phenomena arising from the interplay of magnetism and band topology. Here by investigating (Mn1-xPbx)Bi2Te4 single crystals via the x-ray, electrical transport, magnetometry and neutron measurements, chemical analysis, external pressure, and first-principles calculations, we reveal the magnetic dilution effect on the magnetism and band topology in MnBi2Te4. With increasing , both lattice parameters and expand linearly by around 2%. All samples undergo the paramagnetic to A-type antiferromagnetic transition with the Nel temperature decreasing lineally from 24 K at to 2 K at . Our neutron data refinement of the sample indicates that the ordered moment is 4.3(1)/Mn at 4.85 K and the amount of the MnBi antisites is negligible within the error bars. Isothermal magnetization data reveal a slight decrease of the interlayer plane-plane antiferromagnetic exchange interaction and a monotonic decrease of the magnetic anisotropy, due to diluting magnetic ions and enlarging the unit cell. For , the application of external pressures enhances the interlayer antiferromagnetic coupling, boosting the Nel temperature at a rate of 1.4 K/GPa and the saturation field at a rate of 1.8 T/GPa. Furthermore, our first-principles calculations reveal that the band inversion in the two end materials, MnBi2Te4 and PbBi2Te4, occurs at the and point, respectively, while two gapless points appear at 0.44 and 0.66, suggesting possible topological phase transitions with doping.
I Introduction
Intrinsic magnetic topological insulators provide a great playground for discovering new topological states of matter such as the quantum anomalous Hall insulators, Chern insulators and axion insulatorsTokura et al. (2019). Recently, MnBi2Te4 with the van der Waals bonding was discovered to be the first example of an intrinsic antiferromagnetic (AFM) TI insulatorLee et al. (2013); Otrokov et al. (2019a); Zhang et al. (2019); Li et al. (2019); Otrokov et al. (2019b), which has triggered extensive theoretical and experimental studies to explore the emergent phenomena arising from the interplay of magnetism and non-trivial band topology. Soon quantum anomalous Hall effect, Chern insulator state and layer-Hall effect were realized in the two-dimensional (2D) limit of MnBi2Te4Deng et al. (2020); Liu et al. (2020); Ge et al. (2020); Gao et al. (2021), opening up great opportunities in low-energy-consumption devices, quantum metrology and quantum computing.
MnBi2Te4 has a rhombohedral crystal structure with the stacking of Te-Bi-Te-Mn-Te-Bi-Te. The Mn2+ ions adopt a high-spin state and order into the A-type AFM structure below 24 K with spins ferromagnetically aligned in-plane and coupled antiferromagnetically along the -axis. It is of particular interest to tune the magnetism and band topology in MnBi2Te4 so that new magnetic topological states and novel functionalities can be realized. Such tuning has been effected by three means.
One is through the structural engineering. Following this line, MnBi2nTe3n+1 () consisting of alternating [Bi2Te3] quintuple layers and one [MnBi2Te4] septuple layer were synthesized Aliev et al. (2019); Hu et al. (2020a); Wu et al. (2019); Hu et al. (2020b); Klimovskikh et al. (2020); Ding et al. (2020); Shi et al. (2019); Chen et al. (2019a); Lee et al. (2019); Tian et al. (2020); Gordon et al. (2019). With increasing , the interlayer Mn-Mn distance increases and thus the AFM interlayer exchange interaction decreases. Consequently, MnBi2Te4, MnBi4Te7 and MnBi6Te10 are Z2 AFM topological insulators while MnBi8Te13 becomes a ferromagnetic axion insulator Hu et al. (2020b).
Another is through external pressure Chen et al. (2019b); Shao et al. (2021); Qian et al. (2022), where pressure-activated metamagnetic transitions Qian et al. (2022) were reported. The third approach is chemical doping. When Sb is doped in MnBi2Te4Chen et al. (2019c); Yan et al. (2019), Sb not only substitutes Bi, but also leads to complex chemical disorders. Due to the similar ionic radius between Mn2+ and Sb3+, the amount of Mn on the Mn site (Mn1 sublattice) decreases while the amount of the MnBi,Sb antisites, that is, the amount of the Mn on the Bi/Sb site (Mn2 sublattice) increases Liu et al. (2021); Hu et al. (2021a). Consequently, holes are doped into the system, and the ground state becomes ferrimagnetic with decreasing saturation moment and saturation field Murakami et al. (2019); Lai et al. (2021). Therefore, the uncontrollable and complex chemical disorders caused by Sb doping make it challenging to differentiate the effect caused by the dilution of the Mn1 sublattice and the growing of the Mn2 sublattice. To investigate the effect of magnetic dilution of the Mn1 sublattice on the magnetism and band topology, here we grew and characterized (Mn1-xPbx)Bi2Te4 single crystals. We find that the MnBi antisites remain negligible. We show that the dilution of the Mn1 sublattice leads to linearly decreasing with doping Nel temperature and saturation field. We further reveal a complicated band inversion evolution upon doping, where two gapless points appear when doping concentration achieves 0.44 and 0.66.
II methods
Single crystals of (Mn1-xPbx)Bi2Te4 were grown using the self flux method Hu et al. (2021b). Pb shots, Mn pieces, Bi and Te chunks were mixed with a ratio of [Pb) Mn]Te : Bi2Te3 varying from 15 : 85, 21 : 79, 29 : 71, 31 : 69, 37 : 63 and 30 : 70 for 0, 0.36, 0.5, 0.6, 0.7 and 0.85. The mixture was loaded into an alumina crucible and vacuum sealed inside a quartz tube. It was then heated to 900 C in 4 hours and cooled to 598 C in 0.5 hours. Then the ampule was cooled from 598C to 592 C in a duration of 3 days and stayed at 592 C for 3 more days. The ampule was then centrifuged and shiny single crystals with lateral sizes 33 can be obtained.
| WDS | |||||||||||
| 0 | Mn0.88(1)Bi2.08(1)Te4 | 0 | 4.3314(2) | 40.915(4) | 23.0 | 5.0 | 5.4 | 4.5 | 0.080 | 0.090 | 1.3 |
| 0.36 | Mn0.64(1)Pb0.16(1)Bi2.16(2)Te4 | 0.20(1) | 4.3560(6) | 41.05(2) | 18.0 | 5.0 | 5.5 | 4.4 | 0.035 | 0.065 | 2.8 |
| 0.5 | Mn0.55(4)Pb0.33(4)Bi2.10(2)Te4 | 0.37(3) | 4.3763(3) | 41.201(7) | 14.5 | 6.5 | 5.7 | 4.5 | 0.030 | 0.055 | 3.5 |
| 0.6 | Mn0.38(1)Pb0.43(1)Bi2.19(1)Te4 | 0.53(2) | 4.3916(7) | 41.33(1) | 9.5 | 4.0 | 6.0 | 4.7 | 0.030 | 0.040 | 4.1 |
| 0.7 | Mn0.24(1)Pb0.55(4)Bi2.15(1)Te4 | 0.69(4) | 4.407(1) | 41.44(1) | 4.5 | 2.5 | 5.7 | 4.6 | 0.025 | 0.025 | 12.9 |
| 0.85 | Mn0.14(1)Pb0.67(1)Bi2.20(1)Te4 | 0.82(4) | 4.4210(5) | 41.56(1) | 2.0 | 0 | 5.7 | 4.7 | 24.6 |
Extra care was paid to select for measurements the purest specimens without any detectable impurities. X-ray diffraction was performed using a PANalytical Empyrean diffractometer (Cu K). Initially, the surface x-ray diffraction was used in order to select a specimen of the right phase, then a small portion of the latter was grounded for powder x-ray (PDXR) diffraction to check for impurities. Once no discernible impurity peaks were detected, the same specimen was then used for all measurements. First, chemical analysis was performed using the wavelength-dispersive spectroscopy (WDS). Hereafter, the doping concentration refers to the molar ratio of Pb/(Pb+Mn) determined by the WDS measurements. Then, the magnetization data were measured in a Quantum Design Magnetic Properties Measurement System (QD MPMS3). Lastly, the sample was cleaved into thin plates and cut into rectangular bars for six-probe electric and Hall resistivity measurements, which were performed in a QD DynaCool Physical Properties Measurement System (QD PPMS).
Transport measurements under pressure were performed on the sample. Hydrostatic pressure was applied in a high pressure cell designed by C&T factory, compatible with the QD PPMS. Daphne Oil 7373 was used as the hydrostatic pressure medium.
Single-crystal neutron diffraction was performed for the sample at 4.85 K and 0 T on the HB-3A DEMAND single-crystal neutron diffractometer located at Oak Ridge National LaboratoryChakoumakos et al. (2011).
The bulk band structures of PbBi2Te4 and MnBi2Te4 were computed using the projector augmented wave method as implemented in the VASP package Blöchl (1994); Kresse and Joubert (1999); Kresse and Furthmüller (1996) within the GGA Perdew et al. (1996) and GGA plus Hubbard U (GGA + U) Dudarev et al. (1998) scheme, respectively. On-site eV was used for Mn orbitals. The spin-orbit coupling was included self-consistently in the calculations of electronic structures with a Monkhorst-Pack k-point mesh 15 15 5. The experimental lattice parameters were used. The atomic positions were relaxed until the residual forces were less than 0.01 eV/Å. In order to simulate the doping effect, we constructed a tight-binding Hamiltonian for both PbBi2Te4 and MnBi2Te4, where the tight-binding model matrix elements were calculated by projecting onto the Wannier orbitals Marzari and Vanderbilt (1997); Souza et al. (2001); Mostofi et al. (2008), which used the VASP2WANNIER90 interface Franchini et al. (2012). We used Bi orbitals and Te orbitals to construct Wannier functions, without performing the procedure for maximizing localization. The electronic structures of the doped compounds were then calculated by a linear interpolation of tight-binding model matrix elements of the Hamiltonians.
III Results
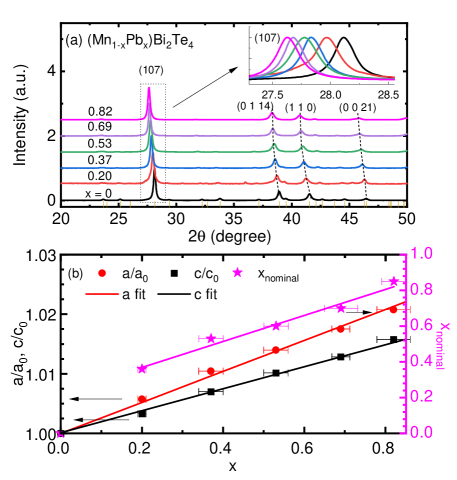
Both WDS and PXRD measurements indicate that Pb successfully substitutes Mn in MnBi2Te4. The results are summarized in Fig. 1 and Table 1. Figure 1(a) shows the PDXR for various doping levels. All the peaks can be indexed by the MnBi2Te4 phase. If there is Bi2Te3 impurity, an additional hump can be seen on the right shoulder of the (107) peak. As shown in the inset of Fig.1(a), the Bi2Te3 phase is almost indiscernible. According to Table. 1 , in MnBi2Te4, the molar concentration of (Mn+Pb) is 0.88(1) while the molar concentration of Bi is 2.08(1). This is consistent with the neutron and x-ray studies which reveal the partial occupancy of Bi atoms on the Mn sites. Upon doping, the amount of (Mn+Pb) stays around 0.80 while the amount of Bi is between 2.1 and 2.2, providing strong evidence that indeed Pb substitutes Mn atoms, not Bi. As plotted in Fig. 1(b), the real doping level defined as Pb/(Pb+Mn) from the WDS data increases with the nominal doping level . From 0.2 to 0.82, a linear fitting results in . Figure 1(b) also shows the evolution of lattice parameters with respect to . The lattice parameters and increase linearly by 2.2 and 1.8 respectively from to 0.82, consistent with Vegard’s law. This is different from the Sb-doped MnBi2Te4 where remains unchanged but decreases with doping.
III.1 Magnetic and electrical transport properties
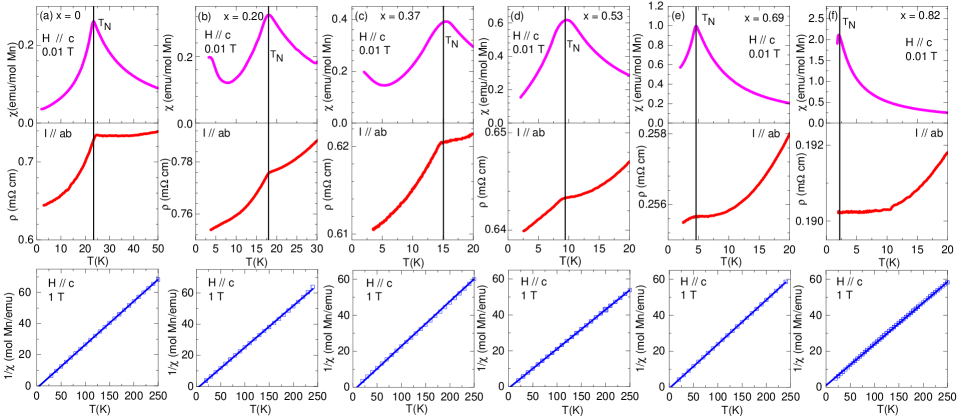
Magnetic and electrical transport properties of this doping series are shown in Figs. 2 and 3. The evolution of the magnetism throughout the doping process can be well traced in the temperature-dependent susceptibility with () and the temperature-dependent resistivity with () in Fig. 2. For , a sharp cusp in and a drop in agree with the previous reports, indicating a paramagnetic (PM) to A-type AFM phase transition at = 24 K. The cusp feature in persists for while the drop in can be observed up to . Together with the small magnitude of across the whole doping series, these observations indicate the A-type AFM ground state with decreasing monotonically from 24 K for to 2 K for . We note the drop in at becomes less dramatic upon doping (indiscernible at ), which is consistent with the fact that the fewer the magnetic scattering centers, the weaker the spin disorder scattering.
The bottom panel of Fig. 2 presents the inverse magnetic susceptibility, , with and T. As one can see, is rather linear in essentially entire range between 40 K to 250 K. The Curie-Weiss fitting results in the effective moment of 5.7 /Mn with no clear doping-dependence (Table I). This is consistent with the theoretical value of 5.9 /Mn for high-spin Mn2+. The Curie-Weiss temperature is positive for , consistent with the strong in-plane FM fluctuation; becomes zero at , suggesting AFM spin fluctuation in the paramagnetic state, likely due to the Mn lattice being very dilute.
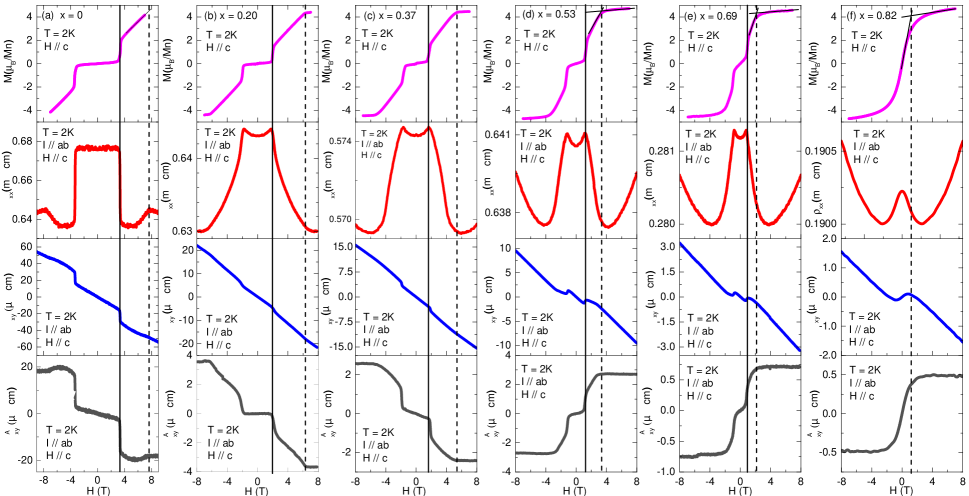
Figure 3 presents the (isothermal magnetization), , (Hall resistivity) and (anomalous Hall resistivity) with at 2 K. Except for the sample, where no spin-flop feature appears at 2 K, all other samples with , a spin-flop transition can be well resolved in . The spin-flop transition field marked by the vertical line decreases with increasing Pb doping, from 3.3 T for to 0.92 T for . Meanwhile, the saturation field marked by the vertical dash line also decreases with , from 7.7 T Yan et al. (2019) for to 2.1 T for and 1.2 T for . Furthermore, unlike Sb-doped MnBi2Te4 where the saturation moment decreases to 2.0 /Mn for MnSb2Te4 due to the formation of 16% of MnBi antisitesYan et al. (2019); Frachet et al. (2020), in all Pb-doped MnBi2Te4 samples, the magnetic moment at 7 T and 2 K remains around 4.5 /Mn (Table. I). This provides strong evidence that the amount of such antisites remains minimal during Pb doing.
Despite Bi and Te dominating the band characters at the Fermi level and the Mn band being a few eV away from the Fermi level, charge transport strongly couples to the magnetism. As shown in the second row in Fig. 3, at , upon increasing the field, a sharp decrease of happens at due to the loss of spin-disorder scattering when the system goes from the AFM state to the canted AFM state; then slightly increases in the canted AFM state and reaches a kink feature at . A negative slope of indicates the electrons dominate the charge transport while the shows a sharp drop at and becomes independent to the in the canted AFM state. Upon doping, electrons remain the dominant carrier in charge transport, which is in stark contrast with the Sb-doped MnBi2Te4, again suggesting the amount of the MnBi antisites remains few. The sharp drop from both and continues to appear at for . As shown by the solid lines, the from three measurements corresponds well with each other. We can determine using and , indicated by the dash lines. For , at 2 K where it just orders, no feature signaling can be observed while the can be consistently determined by both and using the criterion shown in the first row of Fig. 3.
To further investigate the crystal and magnetic structures, single-crystal neutron diffraction was performed on the sample at 4.85 K. The refined structural parameters are summarized in Table II. Since Mn, Bi and Pb co-occupy the Mn site ( site), which complicates the refinement, to make the refinement work, we confined the Pb concentration as the one obtained from the WDS measurement. Meanwhile, if we allow the (Mn, Pb)Bi antisite formation, that is, if we allow Mn and Pb to partially occupy the Bi site ( site) in the refinement, the obtained Bi concentration is too low to agree with the WDS measurement, suggesting that the amount of (Mn, Pb)Bi antisites is negligible within the neutron measurement resolution. Our refinement leads to the chemical formula of Mn0.50(1)Pb0.33(1)Bi2.17(1)Te4, which agrees well with the WDS values. Using the crystal structural information, the refinement of the magnetic Bragg peaks results in an ordered moment of 4.3(1) /Mn at 4.85 K.
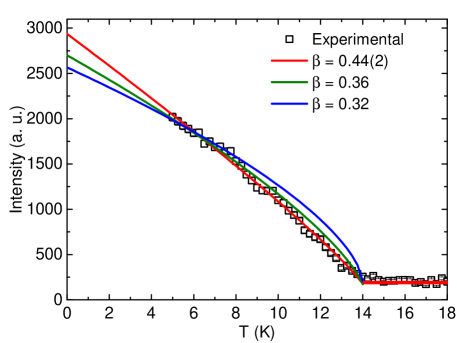
Figure 4 shows the peak intensity of the magnetic reflection (1 0 -0.5). It follows an empirical power law behavior,
| (1) |
where is a proportional constant, is the critical exponent of the order parameter, and is the background. Unlike the undoped sample whose order parameter can be fitted by the 3D Heisenberg model near the critical temperature Ding et al. (2021), from 5 to 20 K, the best fit is shown as the red curve, which yields = 14.1 K and the critical exponent = 0.44(2), considerably larger than that in MnBi2Te4 (0.36)Ding et al. (2021). We also show the curves with = 0.36 (3D Heisenberg case) and = 0.32 (3D Ising case), which clearly deviate from the data. Note that is very close to the mean-field value, 0.5, and cannot represent the true criticality in any sensible Hamiltonian (nor do we expect the Hamiltonian class to change with doping). On the other hand, this number is rather close to critical exponents expected in various percolation models Christensen (2002). Thus, the temperature evolution of the observable order parameter may reflect static percolation, expected in this strongly disordered medium, rather than dynamic fluctuations.
| Atom | site | occ. | Moment at 4.85 K | |||
|---|---|---|---|---|---|---|
| Mn1 | 0 | 0 | 0 | 0.50(1) | 4.3(1) /Mn | |
| Bi1 | 0 | 0 | 0 | 0.17(1) | ||
| Pb1 | 0 | 0 | 0 | 0.33(1) | ||
| Bi2 | 0 | 0 | 0.42645(4) | 1 | ||
| Te1 | 0 | 0 | 0.13459(6) | 1 | ||
| Te2 | 0 | 0 | 0.29202(5) | 1 |
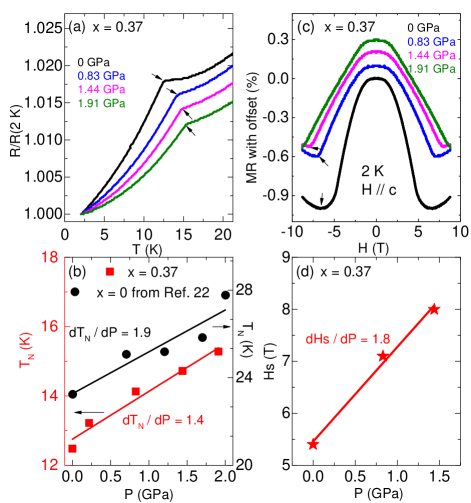
To further study how interlayer and intralayer interactions will affect the magnetism in the doped samples, we measured the sample under different hydrostatic pressure. Figure 5 shows the transport measurements for under pressure. The sample remains in the AFM state for the pressure range we applied while the anomaly at moves to higher temperatures under pressure. As summarized in Fig. 5 (b), linearly increases with pressure at a rate of 1.4 K/GPa, which is smaller than 1.9 K/GPa for Chen et al. (2019b). Figure 5 (c) presents the pressure dependence of MR at 2 K. The drop in MR again suggests the ground state remains AFM. marked with the arrows increases gradually with increasing pressure. The pressure dependence of is summarized in Fig. 5 (d), which suggests a linear increase of at the rate of 1.8 T/GPa. Both the increase of and under pressure indicate that the external pressure enhances the AFM interlayer coupling, which is expected due to the decreasing lattice parameter under external pressure.
III.2 Band topology engineering
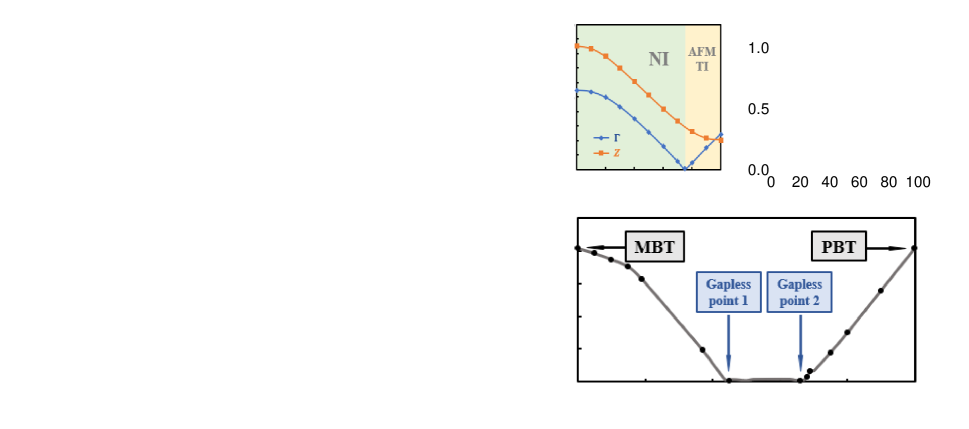
To understand the evolution of band structures as a function of Pb doping, we performed first-principle calculations on the bulk band structures of (Mn1-xPbx)Bi2Te4 using the generalized gradient approximation (GGA) plus correlation parameter U (GGA+U) with spin-orbit coupling (SOC). The results are summarized in Fig. 6. Our calculations reveal an insulating ground state for both MnBi2Te4 and PbBi2Te4, the two end materials. The orbital projection shows that the Bi- orbitals and the Te- orbitals dominate around the Fermi level (EF), while the Mn- orbitals and the Pb- orbitals are far away from the EF (Fig. 6 (a) and (b)). As shown in Fig. 6 (a), for MnBi2Te4, there are clear band inversion features between the Bi- and Te- states at the point, supporting a magnetic topological insulator state which is consistent with the literature. For PbBi2Te4, contrary to MnBi2Te4 whose band inversion appears at the point, the band inversion of PbBi2Te4 occurs at the point, resulting in a strong topological insulator phase due to the preservation of spatial inversion and time-reversal symmetry (Fig. 6 (b)). Our calculation is consistent with the previous research on PbBi2Te4 Menshchikova et al. (2011); Kuroda et al. (2012).
We now investigate the evolution of the band gap via the fine-tuning of the strength of SOC (Fig. 6 (c)). We found that for both MnBi2Te4 and PbBi2Te4, the band gaps at the and points decrease rapidly when increasing the strength of SOC. In particular, for MnBi2Te4, the bulk gap at the point first decreases to zero and then reopens as the SOC is larger than 75. On the other hand, for PbBi2Te4, we find the bulk gap at point is the one that closes first and then reopens at SOC 60 (Fig. 6 (d)). Therefore, topological phase transitions can appear when the SOC increases for both compounds.
Following the line of reasoning, will the Pb doping on MnBi2Te4 induce topological phase transitions? To shed light on this, we calculate the band structures of (Mn1-xPbx)Bi2Te4. Figure 6 (e) shows the minimum gap value between the valence band and conduction band as a function . Generally, topological phase transition between magnetic and nonmagnetic states do not induce additional band inversion, because the two end of states possess different symmetry. However, this concept has its limitations, it is only valid to the trivial to nontrivial phase transition that occurs at the same time-reversal symmetry momenta in the two end systems. As we have shown that the band inversion in MnBi2Te4 and PbBi2Te4 appear at or point, respectively. Thus complicated band inversion diagram is expected. Indeed, our results display two gapless points when doping concentration achieves and . Since the band inversion may exist at and simultaneously between these two ratios, we expect that there might be a new topological phase in this doping regime. Detailed DFT and angle-resolved photoemission spectroscopy (ARPES) study of the effect of doping in this material are left as an open question for future studies.
IV Discussion
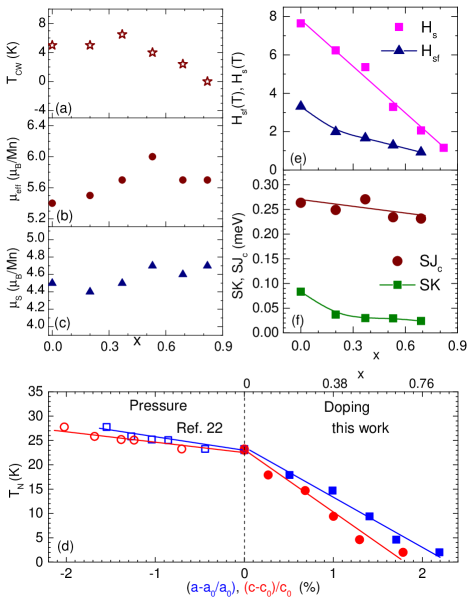
Figures 7(a)-(f) summarize the doping-dependent magnetic properties. The doping-dependence and the magnitudes of (Fig. 7(a)) are not trivial. The system is very 2D and one expects the to be set by strong intraplanar ferromagnetic interactions and scale with the average number of Mn neighbors, , as , which is not the case here, especially in the Mn-rich side. We argue this is because at 40–250 K we may not be in the true Curie-Weiss regime due to the strong FM in-pane fluctuations, as indicated by the (Fig. 7(b)) being slightly smaller than the expected 5.9 /Mn. Indeed, neutron scattering experiments indicate strong FM in-plane correlations even at room temperature for MnBi2Te4McQueeney (2022). Furthermore, in a 2D system where strong fluctuation always exists, one would expect the to be strongly suppressed compared to the mean-field limit value, ; indeed, even in the least-fluctuating square Ising model, is nearly smaller than half of . On the contrary, we obtained using the Curie-Weiss fit of our data for 40-250 K listed in Table I is much smaller than . This may be partially because we are not in the true Curie-Weiss regime as aforementioned. But interestingly, similarly odd behavior was observed in some other quasi-2D ferromagnet or A-type antiferromagnets. For instance, K and high-temperature K for CrCl3 McGuire et al. (2017); K and K for CrI3 McGuire et al. (2015). These large / ratio, to the best of our knowledge, was never explained, since a quantitative theory of spin-susceptibility in Mermin-Wagner systems has never been worked out.
Upon doping, per Mn slightly increases (Fig. 7(c)), suggesting possible reduction in the number of the MnBi antisites, consistent with our neutron scattering refinement. Figure 7(d) shows a comparison of the pressure work Chen et al. (2019b) and our doping work. Apparently, or is much larger in Sb-doped MnBi2Te4 than that in the pressurized MnBi2Te4. This is reasonable since the former comes from both the magnetic dilution and lattice expansion while the latter is only caused by lattice expansion. Furthermore, comparing with (Mn1-xSnx)Bi2Te4 Zhu et al. (2021) where K and T at , Pb doping shows a much stronger suppression of magnetism with K and T at (Fig. 7(d) and (e)). Due to the larger atomic radius difference between Pb and Mn, Pb doping can cause a faster lattice parameter increase than Sn, it is thus reasonable to expect a faster suppression of the AFM coupling, and .
Unlike the monotonic decrease of and in Sb-doped MnBi2Te4 where the Mn1 sublattice is diluted and the Mn2 sublattice gets enhanced upon doping, here and decrease rather linearly as shown in Fig. 7(d) and (e), leading to and up to . The clear difference between these two doping series indicates that indeed the Pb-doping series is ideal to investigate the unadulterated magnetic dilution effect in MnBi2Te4.
So now let us understand these behaviors accounting for the dilution effect when a non-magnetic Pb replaces a magnetic Mn so that the fraction of magnetic site is . In a quasi-2D AFM system, long-range order is impossible without either interlayer coupling, , or uniaxial magnetic anisotropy, . We define the former as the effective coupling strength between two neighboring planes per Mn site and the latter as magnetic anisotropy parameter per Mn site. That is to say, the effective interplanar coupling includes all possible Mn-Mn exchange paths between the planes, and the effective anisotropy includes both single-ion and exchange anisotropies.
We can write the full Hamiltonian as:
| (2) |
where is the Lande factor, labels Mn planes, for AFM and to ensure is the easy axis. Since a magnetic bond needs to have Mn on both ends, arises for the two-site exchange term. Meanwhile, arises for the single-ion magnetic anisotropy and Zeeman terms. Thus the energy in the spin-flop phase is sup ,
| (3) |
where , the upper (lower) sign corresponds to the angle between and as with along the easy axis ( along the hard plane). By minimizing Eq.3 at , we can get the saturation fields,
| (4) | ||||
| (5) |
Similarly, one can estimate the spin-flop threshold:
| (6) |
| (7) | ||||
| (8) |
Note that this scaling is only true if magnetic anisotropy is of a single-ion origin. If there is a contribution from the exchange anisotropy, that contribution will be scaled as , and our in Eq.4-6 will be replaced as where is the single-ion anisotropy parameter and is the exchange anisotropy parameter.
Using Eq.7 and 8, we estimate the effective and , as shown in Fig. 7 (f). slightly decreases from 0.26 meV at to 0.23 meV at , being consistent with the small change in lattice parameter . Meanwhile shows a monotonic decrease with a sharp drop from 0.08 meV at to 0.04 meV at and then a slow decrease to 0.02 meV at . We thus readily see that is linear in , as seen in Fig. 7 (e), because it is defined mostly by . But the behavior of is harder to understand: naively, it can behave either sublinearly, or, in the extreme case of the dominating exchange anisotropy, linearly with . Figure 7 (e) shows that for the behavior is indeed linear, suggesting that the anisotropy there is dominated by the exchange anisotropy. But there is an additional contribution at , of about 0.05 meV, which mostly disappears at . The only plausible explanation is that this contribution comes from the single-ion anisotropy which is strongly affected by the local environment, and only appears if all or nearly all of the nearest neighbors of a given Mn ion are also Mn. It is easy to see that the probability of having a Mn at a given site, having all its neighbors Mn, is , and is only 100% at , 20% at , and 8% at .
We can try to understand the linear doping dependence of by studying the magnetic dilution effect in the mean-field limit (, in the Weiss molecular field theory). We consider an individual Mn ion with the spin and 6 nearest sites. Under doping, the mean-field-theory temperature (we use this notation to distinguish it from the extracted experimentally from for 40–250 K, which, as discussed above, does not represent the true MFT limit) is given by which linearly decreases with . Given that is, generally speaking, nothing but fluctuations-renormalized mean-field-theory temperature, where and are not supposed to change much with doping, is the intraplanar magnetic coupling and , bars means spacial average. As discussed above, and so . Since depends on and logarithmically weakly, we conclude that should roughly follow and thus linearly decreases with .
Lastly, the bottom row of Fig. 3 shows that a sign change of the anomalous Hall resistivity occurs between and , may suggesting possible band structure changed in this regime. Thus we call ARPES experiments to investigate the band structures of this doping series to address this question.
V Conclusion
In summary, we have grown high-quality single crystals of (Mn1-xPbx)Bi2Te4 with ranging from 0 to 0.82. We find that this doping series provides a great platform to investigate the magnetic dilution effect in van der Waals magnets. The Nel temperature and saturation field decrease linearly with doping, which can be well understood in a simple model considering the dilution effects. Moreover, our DFT calculations reveal two gapless points appearing at and . Together with the sign change of the anomalous Hall resistivity between and , this may suggest possible topological phase transitions in this doping series.
Acknowledgments
We thank Robert J. McQueeney and Steven Winter for useful discussions. Work at UCLA was supported by the U.S. Department of Energy (DOE), Office of Science, Office of Basic Energy Sciences under Award Number DE-SC0021117. T.-R.C. was supported by the Young Scholar Fellowship Program from the Ministry of Science and Technology (MOST) in Taiwan, under a MOST grant for the Columbus Program MOST110-2636-M-006-016, NCKU, Taiwan, and National Center for Theoretical Sciences, Taiwan. Work at NCKU was supported by the MOST, Taiwan, under grant MOST107-2627-E-006-001 and Higher Education Sprout Project, Ministry of Education to the Headquarters of University Advancement at NCKU. Work at ORNL was supported by US DOE BES Early Career Award KC0402010 under Contract DE-AC05-00OR22725 and used resources at the Spallation Neutron Source and the High Flux Isotope Reactor, DOE Office of Science User Facilities operated by the Oak Ridge National Laboratory. I. M. acknowledges support from DOE under the grant DE-SC0021089. C. H. thanks was supported by the Julian Schwinger Fellowship at UCLA.
References
- Tokura et al. (2019) Y. Tokura, K. Yasuda, and A. Tsukazaki, Nature Reviews Physics 1, 126 (2019).
- Lee et al. (2013) D. S. Lee, T.-H. Kim, C.-H. Park, C.-Y. Chung, Y. S. Lim, W.-S. Seo, and H.-H. Park, CrystEngComm 15, 5532 (2013).
- Otrokov et al. (2019a) M. M. Otrokov, I. I. Klimovskikh, H. Bentmann, D. Estyunin, A. Zeugner, Z. S. Aliev, S. Gaß, A. Wolter, A. Koroleva, A. M. Shikin, et al., Nature 576, 416 (2019a).
- Zhang et al. (2019) D. Zhang, M. Shi, T. Zhu, D. Xing, H. Zhang, and J. Wang, Physical review letters 122, 206401 (2019).
- Li et al. (2019) J. Li, Y. Li, S. Du, Z. Wang, B.-L. Gu, S.-C. Zhang, K. He, W. Duan, and Y. Xu, Science Advances 5, eaaw5685 (2019).
- Otrokov et al. (2019b) M. M. Otrokov, I. P. Rusinov, M. Blanco-Rey, M. Hoffmann, A. Y. Vyazovskaya, S. V. Eremeev, A. Ernst, P. M. Echenique, A. Arnau, and E. V. Chulkov, Physical Review Letters 122, 107202 (2019b).
- Deng et al. (2020) Y. Deng, Y. Yu, M. Z. Shi, Z. Guo, Z. Xu, J. Wang, X. H. Chen, and Y. Zhang, Science 367, 895 (2020).
- Liu et al. (2020) C. Liu, Y. Wang, H. Li, Y. Wu, Y. Li, J. Li, K. He, Y. Xu, J. Zhang, and Y. Wang, Nature Materials 19, 522 (2020).
- Ge et al. (2020) J. Ge, Y. Liu, J. Li, H. Li, T. Luo, Y. Wu, Y. Xu, and J. Wang, National science review 7, 1280 (2020).
- Gao et al. (2021) A. Gao, Y.-F. Liu, C. Hu, J.-X. Qiu, C. Tzschaschel, B. Ghosh, S.-C. Ho, D. Bérubé, R. Chen, H. Sun, et al., Nature 595, 521 (2021).
- Aliev et al. (2019) Z. S. Aliev, I. R. Amiraslanov, D. I. Nasonova, A. V. Shevelkov, N. A. Abdullayev, Z. A. Jahangirli, E. N. Orujlu, M. M. Otrokov, N. T. Mamedov, M. B. Babanly, et al., Journal of Alloys and Compounds 789, 443 (2019).
- Hu et al. (2020a) C. Hu, K. N. Gordon, P. Liu, J. Liu, X. Zhou, P. Hao, D. Narayan, E. Emmanouilidou, H. Sun, Y. Liu, et al., Nature communications 11, 1 (2020a).
- Wu et al. (2019) J. Wu, F. Liu, M. Sasase, K. Ienaga, Y. Obata, R. Yukawa, K. Horiba, H. Kumigashira, S. Okuma, T. Inoshita, et al., Science advances 5, eaax9989 (2019).
- Hu et al. (2020b) C. Hu, L. Ding, K. N. Gordon, B. Ghosh, H.-J. Tien, H. Li, A. G. Linn, S.-W. Lien, C.-Y. Huang, S. Mackey, et al., Science Advances 6, eaba4275 (2020b).
- Klimovskikh et al. (2020) I. I. Klimovskikh, M. M. Otrokov, D. Estyunin, S. V. Eremeev, S. O. Filnov, A. Koroleva, E. Shevchenko, V. Voroshnin, A. G. Rybkin, I. P. Rusinov, et al., npj Quantum Materials 5, 1 (2020).
- Ding et al. (2020) L. Ding, C. Hu, F. Ye, E. Feng, N. Ni, and H. Cao, Physical Review B 101, 020412 (2020).
- Shi et al. (2019) M. Shi, B. Lei, C. Zhu, D. Ma, J. Cui, Z. Sun, J. Ying, and X. Chen, Physical Review B 100, 155144 (2019).
- Chen et al. (2019a) Y. Chen, L. Xu, J. Li, Y. Li, H. Wang, C. Zhang, H. Li, Y. Wu, A. Liang, C. Chen, et al., Physical Review X 9, 041040 (2019a).
- Lee et al. (2019) S. H. Lee, Y. Zhu, Y. Wang, L. Miao, T. Pillsbury, H. Yi, S. Kempinger, J. Hu, C. A. Heikes, P. Quarterman, et al., Physical Review Research 1, 012011 (2019).
- Tian et al. (2020) S. Tian, S. Gao, S. Nie, Y. Qian, C. Gong, Y. Fu, H. Li, W. Fan, P. Zhang, T. Kondo, S. Shin, J. Adell, H. Fedderwitz, H. Ding, Z. Wang, T. Qian, and H. Lei, Phys. Rev. B 102, 035144 (2020).
- Gordon et al. (2019) K. N. Gordon, H. Sun, C. Hu, A. G. Linn, H. Li, Y. Liu, P. Liu, S. Mackey, Q. Liu, N. Ni, et al., arXiv preprint arXiv:1910.13943 (2019).
- Chen et al. (2019b) K. Chen, B. Wang, J.-Q. Yan, D. Parker, J.-S. Zhou, Y. Uwatoko, and J.-G. Cheng, Physical Review Materials 3, 094201 (2019b).
- Shao et al. (2021) J. Shao, Y. Liu, M. Zeng, J. Li, X. Wu, X.-M. Ma, F. Jin, R. Lu, Y. Sun, M. Gu, et al., Nano Letters 21, 5874 (2021).
- Qian et al. (2022) T. Qian, E. Emmanouilidou, C. Hu, J. C. Green, I. I. Mazin, and N. Ni, arXiv preprint arXiv:2203.11925 (2022).
- Chen et al. (2019c) B. Chen, F. Fei, D. Zhang, B. Zhang, W. Liu, S. Zhang, P. Wang, B. Wei, Y. Zhang, Z. Zuo, et al., Nature communications 10, 1 (2019c).
- Yan et al. (2019) J.-Q. Yan, S. Okamoto, M. A. McGuire, A. F. May, R. J. McQueeney, and B. C. Sales, Physical Review B 100, 104409 (2019).
- Liu et al. (2021) Y. Liu, L.-L. Wang, Q. Zheng, Z. Huang, X. Wang, M. Chi, Y. Wu, B. C. Chakoumakos, M. A. McGuire, B. C. Sales, et al., Physical Review X 11, 021033 (2021).
- Hu et al. (2021a) C. Hu, S.-W. Lien, E. Feng, S. Mackey, H.-J. Tien, I. I. Mazin, H. Cao, T.-R. Chang, and N. Ni, Physical Review B 104, 054422 (2021a).
- Murakami et al. (2019) T. Murakami, Y. Nambu, T. Koretsune, G. Xiangyu, T. Yamamoto, C. M. Brown, and H. Kageyama, Physical Review B 100, 195103 (2019).
- Lai et al. (2021) Y. Lai, L. Ke, J. Yan, R. D. McDonald, and R. J. McQueeney, Physical Review B 103, 184429 (2021).
- Hu et al. (2021b) C. Hu, A. Gao, B. S. Berggren, H. Li, R. Kurleto, D. Narayan, I. Zeljkovic, D. Dessau, S. Xu, and N. Ni, Physical Review Materials 5, 124206 (2021b).
- Chakoumakos et al. (2011) B. C. Chakoumakos, H. Cao, F. Ye, A. D. Stoica, M. Popovici, M. Sundaram, W. Zhou, J. S. Hicks, G. W. Lynn, and R. A. Riedel, Journal of Applied Crystallography 44, 655 (2011).
- Blöchl (1994) P. E. Blöchl, Physical review B 50, 17953 (1994).
- Kresse and Joubert (1999) G. Kresse and D. Joubert, Physical review b 59, 1758 (1999).
- Kresse and Furthmüller (1996) G. Kresse and J. Furthmüller, Computational materials science 6, 15 (1996).
- Perdew et al. (1996) J. P. Perdew, K. Burke, and M. Ernzerhof, Physical review letters 77, 3865 (1996).
- Dudarev et al. (1998) S. Dudarev, G. Botton, S. Savrasov, C. Humphreys, and A. Sutton, Physical Review B 57, 1505 (1998).
- Marzari and Vanderbilt (1997) N. Marzari and D. Vanderbilt, Physical review B 56, 12847 (1997).
- Souza et al. (2001) I. Souza, N. Marzari, and D. Vanderbilt, Physical Review B 65, 035109 (2001).
- Mostofi et al. (2008) A. A. Mostofi, J. R. Yates, Y.-S. Lee, I. Souza, D. Vanderbilt, and N. Marzari, Computer physics communications 178, 685 (2008).
- Franchini et al. (2012) C. Franchini, R. Kováčik, M. Marsman, S. S. Murthy, J. He, C. Ederer, and G. Kresse, Journal of Physics: Condensed Matter 24, 235602 (2012).
- Frachet et al. (2020) M. Frachet, I. Vinograd, R. Zhou, S. Benhabib, S. Wu, H. Mayaffre, S. Krämer, S. K. Ramakrishna, A. P. Reyes, J. Debray, et al., Nature Physics 16, 1064 (2020).
- Ding et al. (2021) L. Ding, C. Hu, E. Feng, C. Jiang, I. A. Kibalin, A. Gukasov, M. Chi, N. Ni, and H. Cao, Journal of Physics D: Applied Physics 54, 174003 (2021).
- Christensen (2002) K. Christensen, Imperial College London 1 (2002).
- Menshchikova et al. (2011) T. V. Menshchikova, S. V. Eremeev, Y. M. Koroteev, V. M. Kuznetsov, and E. V. Chulkov, JETP letters 93, 15 (2011).
- Kuroda et al. (2012) K. Kuroda, H. Miyahara, M. Ye, S. Eremeev, Y. M. Koroteev, E. Krasovskii, E. Chulkov, S. Hiramoto, C. Moriyoshi, Y. Kuroiwa, et al., Physical Review Letters 108, 206803 (2012).
- McQueeney (2022) R. McQueeney, private communication (2022).
- McGuire et al. (2017) M. A. McGuire, G. Clark, K. Santosh, W. M. Chance, G. E. Jellison Jr, V. R. Cooper, X. Xu, and B. C. Sales, Physical Review Materials 1, 014001 (2017).
- McGuire et al. (2015) M. A. McGuire, H. Dixit, V. R. Cooper, and B. C. Sales, Chemistry of Materials 27, 612 (2015).
- Zhu et al. (2021) J. Zhu, M. Naveed, B. Chen, Y. Du, J. Guo, H. Xie, and F. Fei, Physical Review B 103, 144407 (2021).
- (51) See Supplemental Material .