Supplemental material for “A simple method to reprogram the binding specificity of DNA-coated colloids that crystallize”
1 Supplementary Methods
1.1 Particle Synthesis
We synthesized DNA-grafted colloidal particles following a modified version of the method described in Ref. [1]. In brief, the method is comprised of three steps: 1) Azide groups are attached to the ends of polystyrene-poly(ethylene oxide) (PS-PEO) diblock copolymers; 2) The azide-modified PS-PEO copolymers are physically grafted to the surface of polystyrene colloids; and 3) Single-stranded DNA molecules are conjugated to the ends of the grafted PS-PEO copolymers by strain-promoted click chemistry. The specific protocol we use is described below.
We made azide-modified PS-PEO by first functionalizing PS-PEO with a methanesulfonate (Ms) group and then substituting the Ms groups with azide groups. To obtain PS-PEO-Ms, we mixed 100 mg of PS-PEO, 2 mL of dichloromethane, and 42 of triethylamine in a glass vial, and stirred the mixture for 15 minutes on ice. Next we added 23.5 of methanesulfonyl chloride, stirred the solution on ice for 2 hours, removed it from the ice bath and stir at room temperature for 22 hours. After the reaction, we dried the solution overnight in a vacuum dessicator and washed the dried pellet twice with a mixture of 10 mL anhydrous methanol (MeOH) and 243 of 37% hydrochloric acid, and then twice with a solution of 3 mL of MeOH and 40 mL of diethyl ether. In each washing step, we dissolved the pellet and then precipitated the PS-PEO by placing the sample in the freezer for one hour. Then we centrifuged the solution at 4500 rpm at 2 °C for 10 minutes to form a pellet and poured off the supernatant. After washing, we dried the pellet again.
Next, we substituted the Ms groups with azide groups. We mixed 10 mg of sodium azide, 2 mL of dimethylformamide, and the dried PS-PEO pellet. We placed the solution in a 65 °C oil bath and stirred at 1500 rpm for 24 hours. After the reaction, we washed the mixture with 40 mL of diethyl ether and then with a solution containing 3 mL of MeOH and 40 mL of diethyl ether three times. We used the same washing procedure as we previously described. Then we dried the pellet overnight in a vacuum dessicator and resuspended the dried PS-PEO-N3 pellet in deionized (DI) water to a concentration of .
We attached the azide-modified PS-PEO copolymer to the surface of polystyrene colloids using a physical grafting method. We first adsorbed PS-PEO-N3 to the surface of polystyrene colloids by mixing 160 of 100 mM PS-PEO-N3, 160 of tetrahydrofuran, 40 of deionized (DI) water, and 40 of 10%(v/v) 600-nm-diameter PS particles (Molecular Probes), and then vortexed the mixture for 30 minutes. Next, we diluted the mixture 10x with DI water, washed the particles with DI water five times, and concentrated the particles back to 1%(v/v) after washing.
We dyed particles with different fluorophores so that we could distinguish between different particle species. Specifically, we labeled three types of particles, one with nile red, one with pyrromethene green, and one with both. We first made saturated solutions of fluorescent dye dissolved in toluene. We mixed 4 of 10% saturated nile red or 50% saturated pyrromethene green in toluene and 400 1% azide-functionalized PS particles and rotated end-over-end for 7 hours. Next we opened the sample to air and heated it in an oven at 90 °C for 12 minutes. After that, we washed the dyed particles five times in DI water by centrifugation and resuspension.
Finally, we attached DNA molecules to the azide-modified PS-PEO copolymers using strain-promoted click chemistry. We mixed of 1% azide-functioned PS particles, of ssDNA, and 1x TE/ NaCl buffer containing wt% Pluronic F127, and heated the sample in an oven at 70 °C for 24 hours. After the reaction, we washed the DNA-coated particles with DI water five times by centrifugation and resuspension.
1.2 PER Reaction
To append new sequences onto the DNA grafted to the particles, we used an adapted version of the Primer Exchange Reaction (PER) described in Ref.[2]: First we prepared a PER reaction mixture containing final concentrations of 1x Thermopol DNA polymerase buffer (New England Biolabs, provided at 10x concentration with the DNA polymerase), MgCl2 (New England Biolabs, provided as a solution with the DNA polymerase), and of each dATP (deoxyribose adenine triphosphate, ThermoFisher, ), dCTP, and dTTP. No dGTP was added to the mixture because only ACT sequences were appended onto particles and a G-C pair was used as a stop sequence (see section: “Design Considerations”). Note, for the purple co-assembler particles in Figure 4 a different reaction mixture was prepared containing dGTP, but no dCTP. There an AGT sequence was appended onto the particle and a C-G pair was used as stop sequence. All solutions were prepared in Millipore purified water. DNA was stored at °C and DNA-coated particles were stored at °C
For the primer exchange reaction, we mixed of wt% DNA-coated particle suspension to a final concentration of wt%; of DNA hairpin solution to a final concentration of ; of the premixed PER reaction mixture; and of U/ Bst Large Fragment DNA polymerase (New England Biolabs) to a final concentration of U/ ; and water to a total reaction volume of in a Eppendorf tube. For Figure S1 larger concentrations of Bst DNA polymerase were used as indicated in the figures. For Figure 2 and S2 varying hairpin concentrations were used as indicated in the figures
The reaction mixture was rotated at room temperature (approximately 24 °C) for 1 hour, after which the reaction was terminated by washing. We found that the rotation to prevent sedimentation is not essential for reaction times under hours. We washed by centrifuging the particles 4 times at for 3 minutes, removing reaction mixture each time and resuspending the particles in by adding of water. Reaction times were varied for Figures 2 and 3c as indicated in the figures.
Except for the DBCO-modified DNA, all DNA was purchased unpurified (i.e. standard desalting) from Integrated DNA Technologies, in the “lab ready” formulation (dissolved in IDTE buffer at ). The DBCO-modified DNA (Integrated DNA Technologies) was HPLC purified.
1.3 Crystallization Experiments
To prepare samples for crystallization we mixed 1 of 1%(v/v) each of two complementary DNA-coated particle types (2 total) with 2 of 1xTE Buffer with 500 mM NaCl, for a total sample volume of 4 . We take 1.6 of the solution and pipette it onto a plasma-cleaned 24 mm x 60 mm coverslip in the center of a thin, open ring of high vacuum grease (Dow Corning). A second piece of 15 mm x 15 mm plasma-cleaned coverslip is placed on top, making a seal with the vacuum grease. When sealing the chamber we removed as much air as possible without allowing the solution to move past the vacuum grease ring before it closes off. For longer timescale experiments, an additional seal of UV glue was used on the edges of the coverslip to prevent shear on the chamber as well as reduce further the chance for evaporation to break the grease seal.
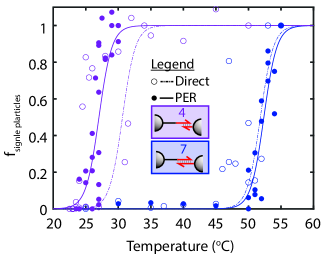
To control the temperature of the sample, we taped it to home-built temperature stage consisting of a peltier element with a thermistor controlled by a PID controller. We started experiments by raising the temperature to the point where all aggregates melted. The sample was left at this temperature for approximately 30 minutes until the particle density became uniform across the chamber. The temperature was then lowered in 0.5 °C steps and held for 5 minutes at each point. By looking at the fraction of particles that have aggregated at each temperature we found the melting temperature, where 50% of particles are aggregated. To form crystals, we melted the sample and then held the temperature 0.3 °C above the melting temperature. It took about three hours for crystal domains to form.
We imaged the samples using either an inverted, brightfield microscope (Nikon Eclipse TE2000-E) or a confocal microscope (Leica SP8) equipped with 20x air, 40x air, and a 60x oil immersion objectives.
1.4 Flow Cytometry
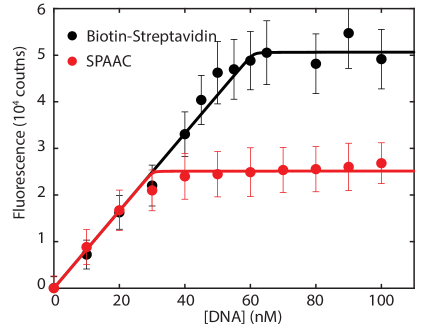
Flow cytometry experiments were performed on a BD FACSCanto high-throughput analytical flow cytometer. Samples were prepared in a Eppendorf tube by diluting of wt% into buffer containing Tris-HCl (pH=7.5), NaCl, and EDTA and varying concentrations of fluorescently labeled DNA complementary to the DNA on the particle. In Figure 2 we added of reporter strand to a final concentration of . In Figure S4, the concentrations varied as indicated in the figure.
The samples were left to equilibrate for at least one hour, then they were diluted in of the same buffer (without additional reporter strand), vortexed, and transferred to a flow cytometry tube immediately. The fluorescent signal of 10 thousand particles was collected over approximately 5 minutes, using the low flow rate setting.
Of all measured events, only the subpopulation involving single particles was selected by applying a gate based on forward and side scatter intensity. Events involving dimers, or larger aggregates were discarded. Data were analyzed in FCS Express 6 Flow Research Edition.
1.5 Gel electrophoresis
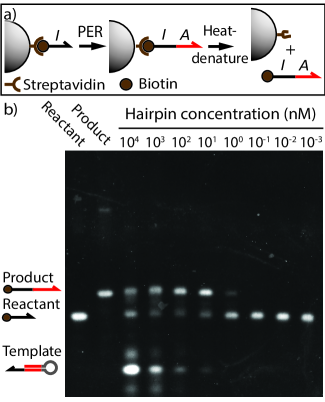
We measured whether PER on particles led to any unintended side products, such as shorter or longer strands than the intended product. To visualize the length of a DNA strand in an electrophoresis gel, it needs to be removed from the particle. Therefore, we PER-edited particles coated with DNA via the streptavidin-biotin bond. This bond can be broken by heat denaturing in formamide, to release the DNA after the reaction.
We first prepared DNA-coated particles from streptavidin-coated particles ( in diameter, Bangs Labs) by mixing wt% particles with biotin-functionalized DNA in a total volume of . The particles were placed on a rotator for 1 hour and washed by centrifugation and resuspension (3x, 3 min at 3000 rcf). Then the DNA on their surface was converted using PER according to the description above. The reaction was stopped and the DNA removed from the particle simultaneously by adding loading buffer in formamide and heat denaturing the sample at C for 5 minutes. This step deactivated the DNA polymerase and broke the biotin-streptavidin bond. The samples were then centrifuged and the supernatants were loaded into a polyacrylamide gel in a bath of 1x Tris/Borate/EDTA (TBE) buffer heated to C. Then V was applied for 2 hours. The gels were stained with Sybr gold dye and imaged using a SynGene Genebox gel imager operated with the Genesys software.
1.6 DNA Sequences
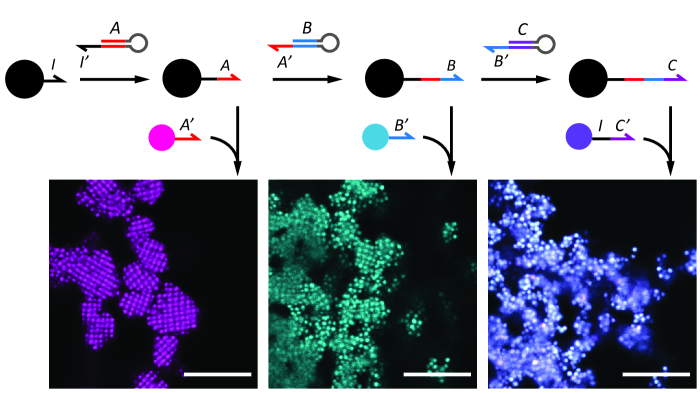
Here we list the DNA sequences (Integrated DNA Technologies) that we used for this work. The sequences are color coded to match Figure 1: the input domain is in black and bold, output A and its sequence complement in red, output B and its sequence complement in blue, and output C and its sequence complement in purple.
![[Uncaptioned image]](/html/2206.00952/assets/x1.png)
2 Design considerations
While PER has clear advantages in the preparation of DNA-coated colloids, there are also some specific limitations, as well as considerations for designing the templates that should be taken into account.
2.1 Inherent limitations
First, PER can only extend sequences from the 3’ end of DNA. Whenever a 5’ sticky end on the DNA is required, our method cannot be used and the particles must be synthesized using click chemistry. Second, PER can not be used to produce grafted DNA molecules with non-natural bases or chemical modifications. Third, our method only works well if the DNA on the feed stock particles already have a single-stranded domain of at least 8 bases.
2.2 Template design principles
To design a new template, it is important to follow three design principles that relate to the three sections of the template: the single-stranded binding domain, the sequence template domain, and the stop sequence.
The single-stranded binding domain is complementary to the input sequence and is responsible for hybridization to the input strand. The length of this binding domain determines the rate of the reaction. In our earlier work on PER [4], we found that the reaction halftime is given by , where the polymerization rate , the DNA hybridization rate , the reactant concentration , the catalyst concentration varies, and is the equilibrium constant for catalyst-reactant binding. depends on the sequence and length of the binding domain and can be predicted using the well-established parameters of DNA hybridization thermodynamics [5]. The rate is optimal for . At room temperature and for sequences with GC-content, this corresponds to an optimal domain length of 9 nucleotides.
The second design rule considers the template domain, which is the double-stranded domain that contains the sequence of the DNA that will be appended onto the input sequence. Long template strands likely result in slow reaction kinetics, so the addition of domains longer than ten nucleotides should be done in consecutive PER reaction steps (Supp. Fig. 5). Kishi et al. showed that multiple PER conversions can be done in a one-pot reaction using multiple hairpins [2]. We anticipate that this same scheme could be used to make DNA-coated colloids with appended domains that are longer than ten nucleotides, but we have not tested it. We also expect that appending shorter-than-ten-nucleotide domains is not a problem, but have not tested it.
The final design rule considers the DNA stop sequence. The DNA template used for PER requires a stop sequence that the DNA polymerase cannot copy. One useful trick is to append a DNA sequence that contain only 3 out of the 4 nucleotides, which allows you to use a stop sequence that is the fourth nucleotide. For example, if one adds a sequence only containing A’s, C’s, and T’s, the stop sequence can be a G-C pair with the G on the non-template strand. In that case, the reaction mixture should not contain any dGTP so that the DNA polymerase stops copying the sequence at the G-C pair. We used this method for the experiments presented in this paper. It is also possible to append sequences containing all four nucleotides by using a non-natural base-pair, such as iso-dC and iso-dG or methylated RNA bases as a stop sequence. However, strands containing these non-natural bases are more expensive and time-consuming to produce.
References
- [1] Oh, J.S.; Wang, Y.; Pine, D.J.; Yi, G-R. High-Density PEO-b-DNA Brushes on Polymer Particles for Colloidal Superstructures. Chem. Mater. 2015, 27, 8337–8344. doi:10.1021/acs.chemmater.5b03683
- [2] Kishi, J.Y.; Schaus, T.E.; Gopalkrishnan, N.; Xuan, F.; Yin, P. Programmable autonomous synthesis of single-stranded DNA Nature Chemistry 2018, 10, 155-164. doi:10.1038/nchem.2872
- [3] Tong, X.; Smith, L. M. Solid-Phase Method for the Purification of DNA Sequencing Reactions. Analytical Chemistry 1992, 64, 2672-2677. doi:10.1021/ac00046a004
- [4] Moerman, P.G.; Gavrilov, M.; Ha, T.J.; Schulman, R. Catalytic DNA Polymerization Can Be Expedited by Active Product Release. doi:10.26434/chemrxiv-2022-3k98v
- [5] SantaLucia, J. Jr. A unified view of polymer, dumbbell, and oligonucleotide DNA nearest-neighbor thermodynamics. Proc. Natl. Acac. Sci. USA 1998, 95, 1460-1465. doi:10.1073/pnas.95.4.1460