11email: konrad.tristram@eso.org 22institutetext: Leiden Observatory, Leiden University, PO Box 9513, 2300 RA Leiden, The Netherlands 33institutetext: School of Astronomy and Space Science, Nanjing University, Nanjing 210093, PR China 44institutetext: Laboratory of Modern Astronomy and Astrophysics (Nanjing University), Ministry of Education, Nanjing 210093, PR China 55institutetext: European Southern Observatory, Karl-Schwarzschild-Straße 2, 85748 Garching bei München, Germany 66institutetext: Max-Planck-Institut für Radioastronomie, Auf dem Hügel 69, 53121 Bonn, Germany 77institutetext: Dept. of Astronomy, Faculty of Science, King Abdulaziz University, P.O. Box 80203, Jeddah 21589, Saudi Arabia 88institutetext: Xinjiang Astronomical Observatory, Chinese Academy of Sciences, Urumqi 830011, China 99institutetext: Observatoire de Paris, LERMA, Collège de France, CNRS, PSL University, Sorbonne University, 75014 Paris, France 1010institutetext: Observatorio de Madrid, OAN-IGN, Alfonso XII, 3, 28014-Madrid, Spain1111institutetext: Joint ALMA Observatory, Alonso de Córdova 3107, Vitacura, Santiago, Chile1212institutetext: Max-Planck-Insitut für Astronomie, Königstuhl 17, 69117 Heidelberg, Germany
ALMA imaging of the cold molecular and dusty disk in the type 2 active nucleus of the Circinus galaxy
Abstract
Context. The central engines of many active galactic nuclei (AGNs) are thought to be surrounded by warm molecular and dusty material in an axisymmetric geometry, thus explaining part of the observational diversity of active nuclei.
Aims. We aim to shed light on the physical properties and kinematics of the molecular material in the nucleus of one of the closest type 2 active galaxies.
Methods. To this end, we obtained high angular resolution Atacama Large Millimeter/submillimeter Array (ALMA) observations of the nucleus of the Circinus galaxy. The observations map the emission at and with spatial resolutions of and , respectively.
Results. The continuum emission traces cold () dust in a circumnuclear disk with spiral arms on scales of , plus a marginally resolved nuclear emission peak. The latter is not extended in polar direction as claimed based on earlier ALMA observations. A significant amount (of the order of ) of the emission is not related to dust, but most likely free-free emission instead. We detect CO(32) and CO(65) as well as (43), HCN(43), and CS(43). The CO emission is extended, showing a spiral pattern, similar to the extended dust emission. Towards the nucleus, CO is excited to higher transitions and its emission is self-absorbed, leading to an apparent hole in the CO(32) but not the CO(65) emission. On the other hand, the high gas density tracers , HCN, and CS show a strong, yet unresolved () concentration of the emission at the nucleus, pointing at a very small ‘torus’. The kinematics are dominated by rotation and point at a geometrically thin disk down to the resolution limit of our observations. In contrast to several other AGNs, no HCN enhancement is found towards the nucleus.
Conclusions. The Circinus nucleus is therefore composed of at least two distinct components: (1) an optically thin, warm outflow of ionised gas containing clouds of dust which are responsible for the polar mid-infrared emission, but not seen at submillimetre wavelengths; and (2) a cold molecular and dusty disk, traced by submillimetre continuum and line emission. The latter is responsible for the bulk of the obscuration of the nucleus. These findings support the most recent radiative transfer calculations of the obscuring structures in AGNs, which find a similar two-component structure.
Key Words.:
galaxies: active – galaxies: nuclei – galaxies: Seyfert – galaxies: structure – galaxies: individual: Circinus – techniques: interferometric – techniques: submm1 Introduction
In an active galactic nucleus (AGN), the luminosity of at least the inner region of a galaxy (if not the entire galaxy for a powerful quasar) is dominated by the non-stellar continuum emission produced by matter accretion onto the central supermassive black hole. The central accretion disk and broad line region are surrounded by gaseous and dusty material on parsec scales, which absorbs and reprocesses the emission from the accretion disk. This dense material is believed to be distributed in a toroidal distribution, the so-called dusty or molecular torus. The toroidal structure allows for free lines of sight towards the centre when observed face-on (type 1 source), or it obscures the centre when seen edge-on (type 2 source). The axisymmetric structure of the obscuring material is the basis of the unified scheme of AGNs, which has been successful in explaining the main observational characteristics of AGNs (Antonucci, 1993; Urry & Padovani, 1995; Netzer, 2015).
The covering factor of the nuclear obscuring material seems to be relatively high, , even if its dependency on luminosity and redshift is under discussion and the obtained values may be biased by specific methods or the underlying AGNs samples (for a review, see e.g. Ramos Almeida & Ricci, 2017). The large covering factor implies a geometrically thick torus with and raises the question about the physical mechanism keeping the torus geometrically thick and preventing it from collapsing to a thin disk. Several mechanisms, such as radiation pressure (e.g. Pier & Krolik, 1992; Krolik, 2007; Chan & Krolik, 2016), starburst disks providing energy injection from supernovae (e.g. Wada & Norman, 2002; Schartmann et al., 2009; Wada et al., 2009), magnetic-driven winds (e.g. Emmering et al., 1992; Konigl & Kartje, 1994; Begelman & Silk, 2017), or warped disks (Phinney, 1989; Lawrence, 2007), have been proposed as the dominant physical mechanism of keeping the torus geometrically thick. Interferometric observations in the mid-infrared of the thermal emission from the centrally heated dust have revealed a predominance of polar-elongated dust structures (e.g. López-Gonzaga et al., 2016; Leftley et al., 2018) and also deep single-dish observations reveal that the mid-infrared emission is extended in polar direction out to scales, rather than in the equatorial direction (e.g. Packham et al., 2005; Asmus et al., 2014, 2016). This has led to new models explaining the torus as part of a wind (Hönig & Kishimoto, 2017) or a ‘radiation-driven fountain’ (Wada et al., 2016). The actual kinematics of the torus on parsec scales have, however, remained essentially inaccessible to observations apart from the detection of water maser disks and outflows in a few objects with a close to edge-on orientation (e.g. Kuo et al., 2011; Zhao et al., 2018).
Only with the advent of the Atacama Large Millimeter/submillimeter Array (ALMA) has it become possible to investigate the kinematics and physical state of the material using emission lines in the submillimetre. Not surprisingly, the best studied source is the well-known Seyfert 2 nucleus of NGC~1068. A wealth of observations have, however, led to contradicting interpretations: Using CO(65) molecular line emission and the continuum, García-Burillo et al. (2016) detected the dust emission, the molecular gas, and the kinematics of a disk which is interpreted as the submillimetre counterpart of the dusty torus. The lopsided morphology and complex kinematics of this disk (including apparent counter-rotation) are interpreted as a possible ‘signature of the Papaloizou–Pringle instability, long predicted to likely drive the dynamical evolution of active galactic nuclei tori’. Using their own set of CO(65) observations, Gallimore et al. (2016) resolved the low-velocity component into a structure; the higher-velocity emission is found to be consistent with a bipolar outflow perpendicular to the nuclear disk, which is interpreted as ‘compelling evidence in support of the disk-wind scenario’ for the obscuring torus. Imanishi et al. (2016, 2018b) found the dense gas tracers HCN(32) and (32) to be morphologically and dynamically aligned in the east-west direction (i.e. in the expected torus direction, perpendicular to the radio jet), which is seen as a sign for these molecular lines being better probes of the rotating dense molecular gas in the torus than CO(65). More recent observations with improved spatial resolution revealed two apparently nested, counter-rotating disks aligned perpendicular to the radio jet: an inner () disk with Keplerian rotation consistent to an megamaser disk and an outer () counter-rotating disk (Impellizzeri et al., 2019; Imanishi et al., 2020). Broad, blue-shifted absorption is seen as a signature of outflowing dense molecular gas. Finally, García-Burillo et al. (2019) confirm strong departures from circular motions in the torus and the circumnuclear disk using CO(21), CO(32), and (43); these are, however, not interpreted as counter-rotation but as signs for a wide-angle wind reflecting AGN feedback. In summary, studying this one emblematic object has not (yet) lead to a consensus of what constitutes the torus and how it works.
Apart from NGC~1068, several other nearby AGNs have been studied on scales of the molecular and dusty torus, that is on scales of and below. Among them are NGC~613 (Audibert et al., 2019), NGC~1097 (Izumi et al., 2017), NGC~1377 (Aalto et al., 2017), NGC~1808 (Audibert et al., 2021), NGC~3772 (Alonso-Herrero et al., 2019), and NGC~5643 (Alonso-Herrero et al., 2018), as well as the NUGA (‘NUclei of GAlaxies’) sample of seven nuclei (Combes et al., 2019) and the GATOS (‘Galaxy Activity, Torus, and Outflow Survey’) core sample of ten nuclei (García-Burillo et al., 2021). Compact, disk like structures with sizes between and are detected in many of these sources in the submillimetre continuum and in high density gas tracers such as HCN, and CS. On the other hand, CO, especially CO(32) and CO(21), often displays a deficit of emission – a ‘hole’ – at the nucleus. This deficit has been explained by the chemistry as a result of an X-ray Dominated Region (XDR) caused by the AGN (Izumi et al., 2020), or as a true nuclear gas deficit caused by AGN feedback, for example in the form of winds (García-Burillo et al., 2021). It has also been recognised that the continuum emission detected by ALMA in many cases has significant contribution or is dominated by non-dust emission, that is free-free or synchrotron emission. For a significant number of sources the kinematics are clearly dominated by rotation. In addition, many sources display molecular outflows on scales of a few (tens of) pc. A so-called submillimetre HCN enhancement seems to be even clearer at the higher angular resolutions provided by ALMA (Izumi et al., 2016). So despite the many faces of the torus (or more generally the obscuration) in individual AGNs, some of the properties such as the CO deficit, the HCN enhancement or an outflow seem to be more common features and hence point at the dominant physics in the tori. However it remains unclear if these structures are directly the equivalent of the tori in the unified scheme in the sense that they are responsible for the viewing angle dependent obscuration.
In this paper, we present ALMA band 7 and 9 continuum and molecular line observations of the nucleus in the Circinus galaxy. The goal of these observations is to study the kinematics and physical state of the dense obscuring material in this active nucleus.
At a distance of only (), the Circinus galaxy is a prime target for the study of AGN physics and the near-nuclear molecular material. The galaxy is regarded as a prototypical type 2 galaxy (torus edge-on) due to its ionisation cone (e.g. Marconi et al., 1994; Veilleux & Bland-Hawthorn, 1997; Wilson et al., 2000; Mingozzi et al., 2019), large-scale molecular outflow (Curran et al., 1999), broad emission lines in polarised light (e.g. Oliva et al., 1998; Ramos Almeida et al., 2016), and Compton-thick nuclear X-ray emission (e.g. Arévalo et al., 2014; Uematsu et al., 2021). masers at trace a thin, warped disk with a radius of as well as a wide-angle outflow (Greenhill et al., 2003). While the maser disk matches a dense, hot () dust disk, the majority of the thermal dust emission in the mid-infrared is extended in the polar direction on scales of as revealed by mid-infrared interferometry (Tristram et al., 2007, 2014; Isbell et al., 2022). In fact the polar dust emission is visible out to (e.g. Packham et al., 2005) and can be explained by a dusty hollow cone (Stalevski et al., 2017, 2019) or a magnetocentrifugal wind (Vollmer et al., 2018). Atacama Pathfinder EXperiment (APEX) measurements of the CO transitions up to CO(43) reveal higher excitation as well as more violent kinematics towards the nucleus (Zhang et al., 2014).
The nucleus of the Circinus galaxy has been observed before with ALMA. Hagiwara et al. (2013) detected the maser transition at the location of the nucleus. The maser features remain spatially unresolved for their synthesised beam of , but comparing the velocities of both the and maser transitions, it is concluded that both originate from a similar region. The continuum has a total flux density of and shows a bright core and an arm-like substructure extending to the north-east. Most recently, Izumi et al. (2018) presented ALMA maps of the continuum as well as the CO(32) and [C I](10) lines, tracing the molecular and atomic phases of the obscuring structures. Both the continuum and line emission show a circumnuclear disk and spiral arms; the disk is found responsible for a significant contribution to the Compton thickness of this nucleus, and the line ratio found may be due to XDR chemistry at the location of the nucleus. Decomposing the line velocity fields into rotation and dispersion, the diffuse atomic gas is found to be more spatially extended along the vertical direction of the disk than the dense molecular gas. This multi-phase nature of the torus is seen as support for the validity of the radiation-driven fountain model.
2 Observations and data processing
2.1 Observations
We obtained ALMA band 7 and 9 observations of the nucleus of the Circinus galaxy in programme 2012.1.00479.S (PI: K. Tristram), which were mainly targeted at the CO(32) and CO(65) transitions, respectively. For a summary of the technical setup and observational parameters, see Table 1.
| ALMA band | 7 | 9 |
|---|---|---|
| date of observations | 2015-07-16 | 2015-07-26 |
| number of antennas | 39 | 41 |
| proj. baseline lengths | ||
| integration time | ||
| pointing centre (J2000) | 14:13:09.9060 | 14:13:09.9060 |
| -65:20:20.4684 | -65:20:20.4684 | |
| window width | ||
| number of channels | 960 | 1920 |
| channel bandwidth | ||
| spectral window 0 | ||
| spectral window 1 | ||
| spectral window 2 | ||
| spectral window 3 | ||
| primary beam size | ||
| bandpass calibrator | J1427-4206 | J1256-0547 |
| amplitude / flux calib. | J1613-586 | J1613-586b |
| phase calibrator | J1424-6807 | J1147-6753 |
| delay calibrator | J1337-6509 | J1617-5848b |
(b) J1617-5848 and J1613-586 are two different designations for the same source.
The observations in band 7 were carried out on 2015 July 16 with 39 antennas resulting in projected baseline lengths between and . The four wide spectral windows have 960 channels each and thus yield a channel spacing of . The spectral windows were arranged such as to cover the CO(32) (), (43) (), HCN(43) () and CS(65) () lines as much as possible. In order to accommodate the full expected velocity range of the CO(32) line, the HCN(43) line was positioned at the edge of its spectral window and only the blue-shifted part of the line up to the systemic velocity could be covered.
The band 9 observations took place on 2015 July 26 using 41 antennas resulting in very similar projected baseline lengths as for band 7, namely between and . Two wide spectral windows with 1920 channels each and a velocity resolution of were centred at and in order to cover the CO(65) () and HCN(43) () emission lines. The other two 2 GHz wide windows were centred at and respectively, with only 128 channels each to trace the continuum, because they were not expected to contain any line emission.
2.2 Data reduction
The data for both bands were calibrated and reduced manually with the ALMA script generator and the Common Astronomy Software Applications (CASA)222https://casa.nrao.edu/. After flagging the data, the raw phases and amplitudes were corrected by the water vapour radiometer measurements and the system temperature (), respectively, and the positions of the antennas were updated to their latest measurements. For band 7, phases and amplitudes were calibrated as usual using the gain calibrator independently per spectral window. For band 9, the signal to noise of the solutions per spectral window is so low, that the signal from all spectral windows had to be combined after determining the phase offsets between the windows. For the amplitude, it is trickier to combine spectral windows because they originate from different receiver base bands and therefore have different sensitivities. We thus transferred the individual solutions from the band pass calibrator, which was bright enough to provide solutions with a high signal to noise ratio. The limitation of this approach is that the bandpass calibrator is observed at a different elevation than the science target and only once, at the beginning of the observation. However, the sensitivity of the ALMA receivers change very little with elevation, and the frequent measurements effectively compensate for differences in opacity between the bandpass calibrator and science target. Thus the overall error bar on the band 9 flux is probably within the ALMA specification (), but out of precaution, we consider a higher absolute flux uncertainty of . For the band 7 data we adopt a uncertainty.
All imaging was carried out using the clean task in CASA with Briggs weighting and a robust parameter of 0.5. For the continuum imaging, all regions contaminated by emission lines were flagged previous to the imaging; for the emission lines, the continuum was subtracted from the data directly in the UV plane and then imaged. Fluxes were not corrected for the primary beam ( for band 7, and for band 9, respectively) as the regions we are interested in are much smaller.
For band 7, the continuum signal was strong enough to carry out two iterations of phase-only self calibration before the result converges. An attempt to also carry out amplitude self calibration did not lead to any improvement and was therefore not used. The result of the phase-only self calibration was applied to the main data set before continuum subtraction and cleaning the line emission. For CO(32) and (43), the data were imaged between and , in steps. For CS(43), which is much fainter, the data were imaged between and in bins, the best compromise between the low signal to noise ratio of the line and the possibility to separate at least a few velocity bins. Finally, because the HCN(43) line is located at the edge of the spectral window, it could only be imaged in a range from to in steps. All lines were directly imaged centred on the systemic velocity of ().
The band 9 data turn out to be of much lower signal to noise ratio. We nevertheless were able to apply one iteration of phase self calibration on the continuum and apply it to the line data. The only emission line detected is the CO(65) transition, which was cleaned between and in steps.
Both the band 9 continuum and CO(65) line emission are shifted to the north-east of the peak in the band 7 continuum. Because also the velocity map of CO(65) is offset by the same amount, this cannot be a true offset and we therefore shifted the band 9 data so that the continuum peaks of both bands are aligned. This also gives a very good, although not perfect, match of the CO(32) and CO(65) velocity maps. We could not identify an obvious phase error like for instance Izumi et al. (2020), who observed a similar offset between bands in their ALMA data. However, the observed offset is roughly aligned with the parallactic angle. Therefore, a possible reason for the offset of the band 9 data could be a bad phase transfer due to atmospheric refraction in combination with the low signal to noise ratio.
3 Results
In this section we present our observational results for the continuum emission, the line emission as well as the kinematics.
3.1 Continuum emission and astrometry
| line | rest | beam | central peak, deconvolved | integrated flux | integrated flux | |||
| or | frequency | size | central peak | aperture | ||||
| continuum | [GHz] | [ ] | [∘] | [mas] | [mas] | [∘] | [mJy / ] | [mJy / ] |
| B7 cont. | ||||||||
| B9 cont. | ||||||||
| CO(32) | – | – | – | – | ||||
| CO(65) | ||||||||
| CS(43) | ||||||||
| (43) | ||||||||
| HCN(43)a | ||||||||
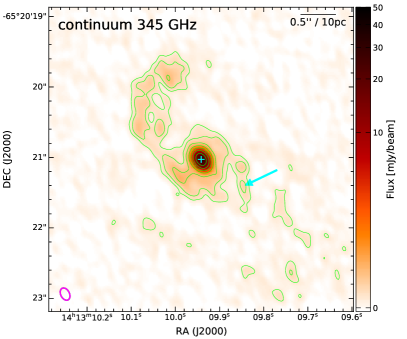
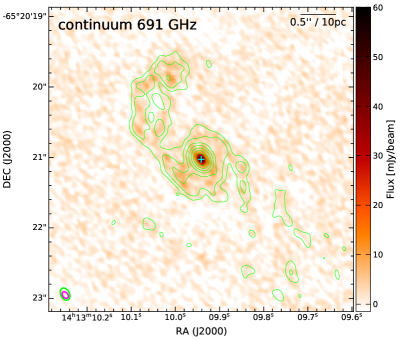
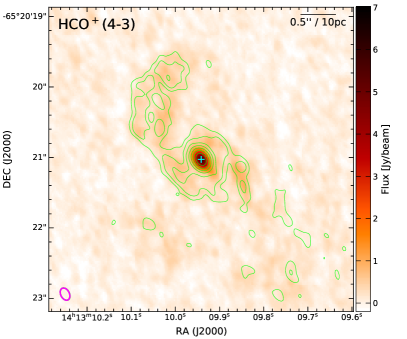
The continuum maps for band 7 (, , ) and band 9 (, , ) are presented in Fig. 1. Only the innermost centred on the nucleus are shown. A central peak plus extended structure out to a radius of () is detected.
The extended structure shows an S-shaped morphology, with a clear spiral arm towards the north-east and a much fainter spiral structure on the opposite side to the south-west which is only barely visible in our band 7 data (but clearly visible in CO(32), see below). Both spiral arms correspond to the circumnuclear disk described by Izumi et al. (2018) and connect to their spiral arms 2 in the south and 3 in the north. The brighter spiral arm to the north-east was actually first seen as an extension in the continuum map of Hagiwara et al. (2013). There seems to be an enhancement of the emission towards the outer, convex edge of the spiral. Towards the south-west, at a distance of () from the nucleus, there is a ridge-like structure extending about in north-south direction which will be discussed in more detail in Sect. 3.4.
We are however mainly interested in the emission from the core which we expect to be related to the dusty and molecular torus. We use imfit in CASA to characterise this core; its main properties are summarised in Table 2. The emission has very similar apparent sizes, and at and , respectively, despite the difference in beam sizes by a factor of two. While at , the emission hence remains essentially unresolved (the size being only marginally larger than the beam at this frequency), the nuclear source is clearly resolved at , with a deconvolved size of (i.e. ). We do not expect the emission to be more compact at lower frequencies if originating from dust. Therefore the very compact, deconvolved size of obtained with imfit for the emission at may simply not be a very reliable estimate, or it may point at an emission mechanism other than thermal dust emission to play a significant role (see Sect. 4.1). The central peak appears elongated along the expected equatorial direction of the torus as well as the major axis of the galaxy. However at this is mainly due to the elongation of the beam in this direction, and even at the beam is most likely dominating the observed elongation as is implied by the large uncertainty on the position angle of the deconvolved emission components (see Table 2). In conclusion, we find the nuclear emission to be very compact, possibly elongated in the equatorial direction and with a size of . This is not much larger than the emission by the dust at traced by mid-infrared interferometry (Tristram et al., 2014; Isbell et al., 2022).
We measure fluxes of and for the central peak, at and , respectively. Additionally the peak is surrounded symmetrically by extended emission with a diameter of , corresponding to . Including this emission by carrying out photometry with an aperture of diameter, the flux increases by at and by more than a factor of two at .
The continuum peak at is located at and (J2000) with an uncertainty of the fitted position of about . This uncertainty is consistent with that expected following equation 10.7 in the ALMA Technical Handbook. Comparing the locations of the amplitude and delay calibrators associated to our observations, we find offsets of and , respectively, to the coordinates given in SIMBAD. Both calibrators are further away from the phase calibrator than the Circinus nucleus. Conservatively, this implies an uncertainty in the position of the nucleus of from the continuum map alone. As mentioned in Sect. 2.2, our data have an offset of with respect to the data, most likely due to the lower signal to noise ratio and a poor phase transfer at this higher frequency. We therefore consider the position obtained at as a better estimate.
Greenhill et al. (2003) specify the position of the maser disk444Actually, Greenhill et al. (2003) give the position for the maser detection at ; the centre of the maser disk (i.e. the central engine) is offset by to the east and to the north of this position. This small offset is, however, much smaller than the uncertainty in the absolute astrometry. with and . This is about to the south-east of our estimate from the data, but within of the astrometric uncertainties of the water masers position. An astrometric alignment for the near-infrared emission carried out by Prieto et al. (2004) results in a location of the infrared core at and . Although to the north of our coordinates, this is in rough agreement with our position considering the uncertainty of cited for the infrared position. Moreover, the infrared emission peak may not be centred on the very nucleus due to obscuration effects playing a role in the infrared. Izumi et al. (2018) and Hagiwara et al. (2013) give coordinates for the continuum peak at and that are located to the east and to the north-east of our coordinate, respectively. The reason for these relatively large differences in the astrometry of the nucleus with ALMA remain unclear. The larger offset to the position in Hagiwara et al. (2013) may be related to the fact that those observations were carried out in cycle 0 with only 18 antennas.
In conclusion, we estimate the uncertainty on the absolute astrometry of the central engine in the Circinus galaxy to be of the order of . This means we find a position of the core of and from our data.

3.2 CO(32) and CO(65) line emission
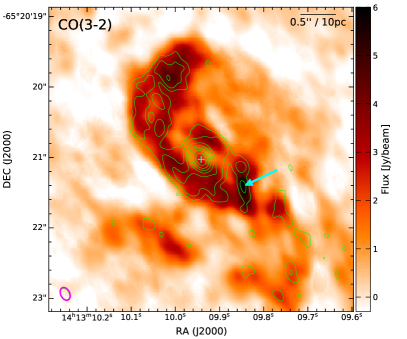
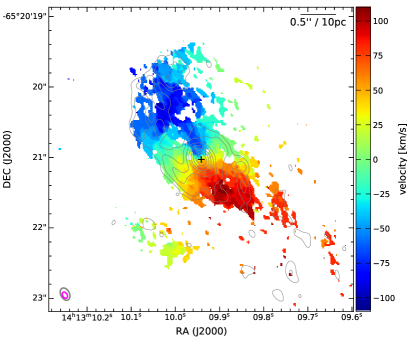
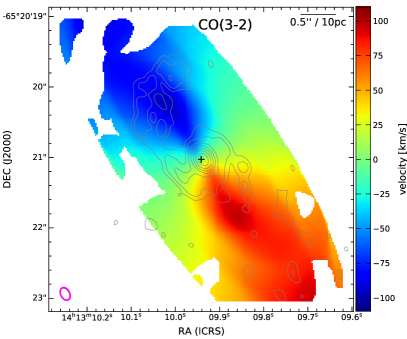
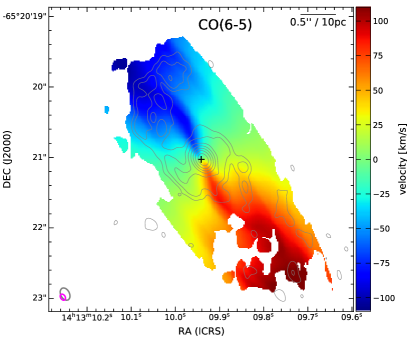
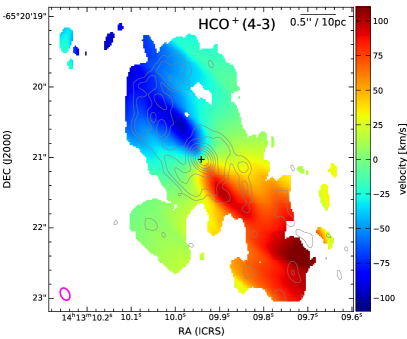
Both the CO(32) (, ) and CO(65) (, ) emission lines are clearly detected, see Fig. 2. The CO(32) map reveals very strong extended and patchy emission out to scales of . The larger scale structure of the CO(32) emission are very well described in Izumi et al. (2018), who present maps with slightly lower resolution but higher sensitivity. Their data hence better trace the extended and fainter emission, revealing three spiral arms. A large part of this large-scale emission is resolved out in our data and we therefore concentrate only on the innermost region. The structure on scales of largely follows that of the continuum emission with an S-shaped morphology composed of a strong spiral arm to the north-east of the nucleus and a weaker spiral arm to the south-west. Intensity peaks in the CO line emission correspond to peaks in the continuum. The line emission in the north-eastern spiral arm is, however, more located towards the inner side of the spiral arm, while the dust emission is stronger along the outer edge. Surprisingly, the CO(32) emission does not have a central peak like the continuum or the other emission lines. In fact, there is a slight decrease of the emission levels, in the innermost (). The only structure at the location of the nucleus is a () large finger of emission reaching towards the nucleus from the south. The nucleus is surrounded by a patchy ‘ring’ of emission with peak intensities of . Due to the absence of any core, only aperture photometry can be carried out. We obtain a total flux of within an aperture of (cf. Table 2). The brightest emission of the CO(32) line is actually located to the south-west of the nucleus in the ridge-like structure extending in north-south direction (, , cyan arrow in Fig. 2). The structure is hence much more prominent in CO than in the continuum or other emission lines.
The CO(65) emission has much lower signal to noise ratio but essentially traces similar structures as the CO(32) emission, although with significant differences. It also shows the S-shaped spiral structure, including similar substructure such as the ridge-like structure to the south-west of the nucleus. The main difference is that this transition has a clear peak at the location of the nucleus (within a relative astrometric precision of to the continuum peak at ). With a size of , the emission is clearly resolved considering a beam size of . The integrated fit of the central core is , while the emission within an aperture of amounts to , that is most of the CO(65) emission comes from extended scales.
3.3 Dense gas emission lines
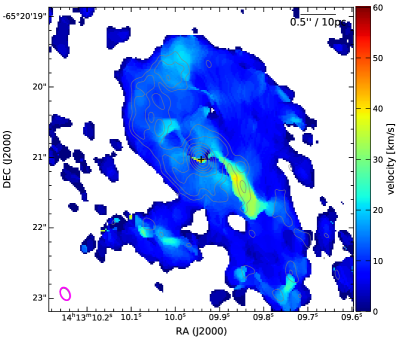
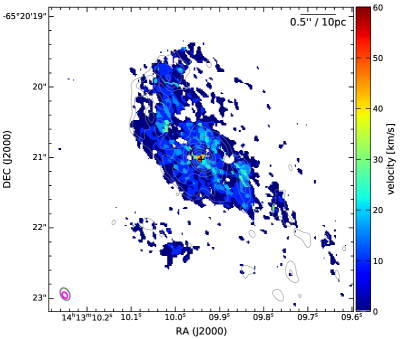
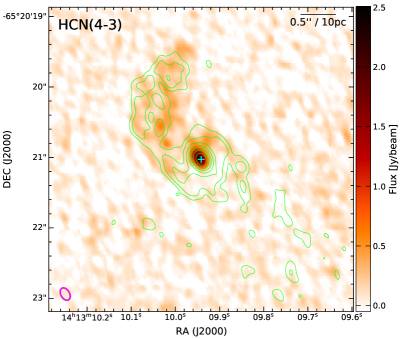
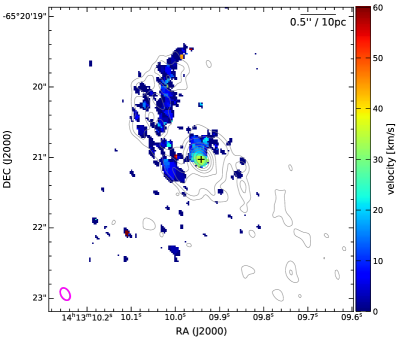
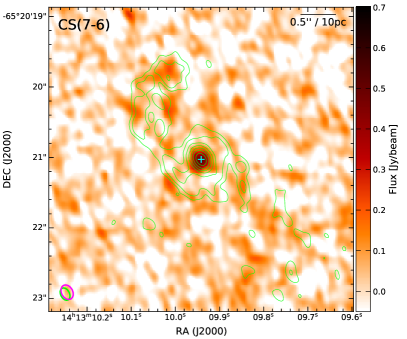
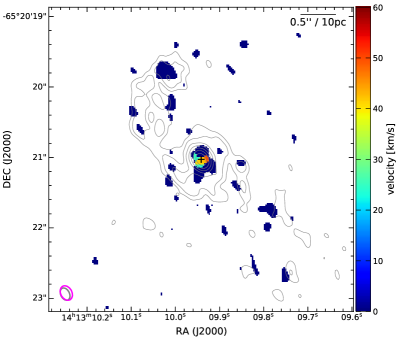
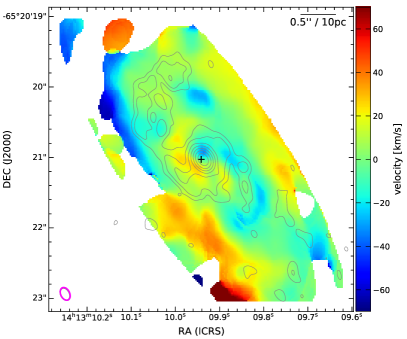
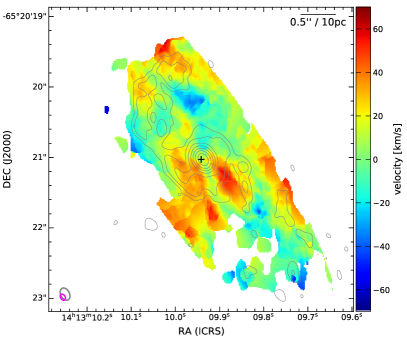
Except for the CO lines, the data contain three additional emission lines: (43) (, , Fig. 3 left panels), HCN(43) (, , Fig. 3 right panels) and CS(43) (, , Fig. 4), all in band 7. In band 9, no other emission lines apart from CO(65) are detected.
is clearly detected even for a high sampling in velocity space. The morphology of the emission in is very similar to the continuum emission, with a strong emission peak at the nucleus, surrounded by the S-shaped spiral structure. Even clearer than for CO(32), is stronger on the inside of the spiral arm in comparison to the continuum emission which is enhanced on the outer edge of the spiral arm. Considering the counter-clockwise rotation of the gas (see below), material is entering the spiral arm from the concave inside of the arm, such that the spiral arms are trailing. There might be a shock where the gas enters the arm, and star-formation may take place. Dust and continuum emission occurs later in the flow, towards the convex outside of the arm. The nuclear peak contains a flux of and is possibly resolved slightly with an elongation along a position angle of (see Table 2). This would imply that we start to resolve the nuclear dense gas emission along the equatorial direction.
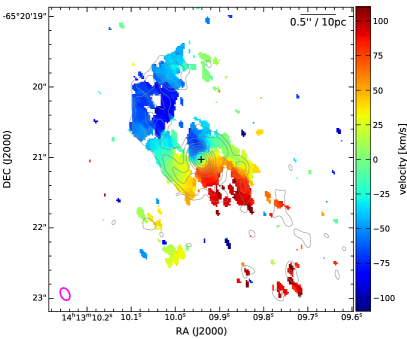
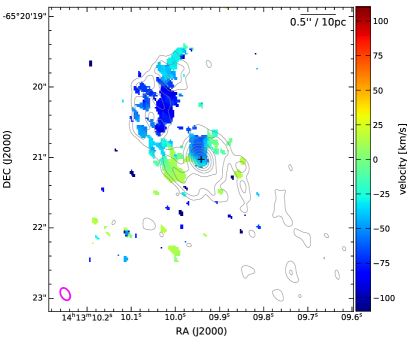
For the HCN(43) emission line, only the blue-shifted part is covered by our ALMA observations (see Sect. 2.1). The morphology of this part is very similar to that of the emission. Also HCN(43) shows an emission peak at the nucleus; however, the peak in the moment 0 map is truncated towards the south-west because the red-shifted velocities of the line are missing. The signal to noise of the HCN(43) map is, however, clearly lower than for the line.
Finally, the emission of the CS line is faint but clearly detected when strongly binning in velocity space (see Sect. 2.2). Most of the CS emission is concentrated towards the position of the nucleus with a peak flux of . Faint emission on the level also traces the S-shaped spiral arms.
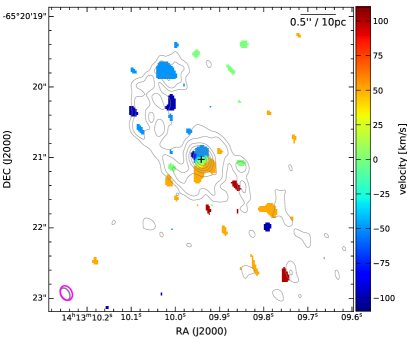
3.4 Line kinematics
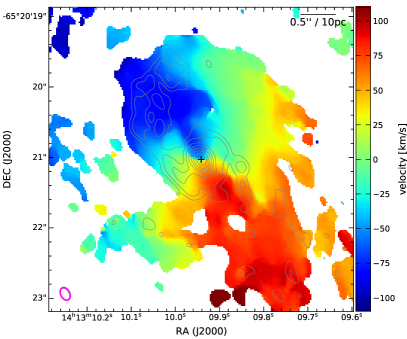
The velocity fields of all emission lines are similar, tracing a rotating pattern with velocities between and (see Figs. 2 to 4). The approaching, blue-shifted part of the rotation is located towards the north-east and the receding, red-shifted part towards the south-west. This velocity field is in agreement to the one found for the galactic disk on kpc scales (e.g. Freeman et al., 1977; Elmouttie et al., 1998; Curran et al., 2008; Zschaechner et al., 2016), as well as the one on smaller, sub-parsec scales traced by the water masers (Greenhill et al., 2003). Within (i.e. ) from the nucleus, the velocities in the polar region to the south-east are generally more red-shifted (up to ), while the gas towards the north-western side has lower velocities (down to ). This may be a sign for outflowing gas and is further discussed in Sect. 4.3.
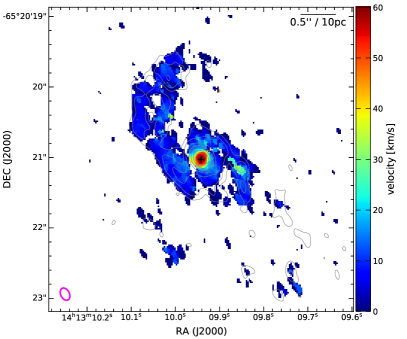
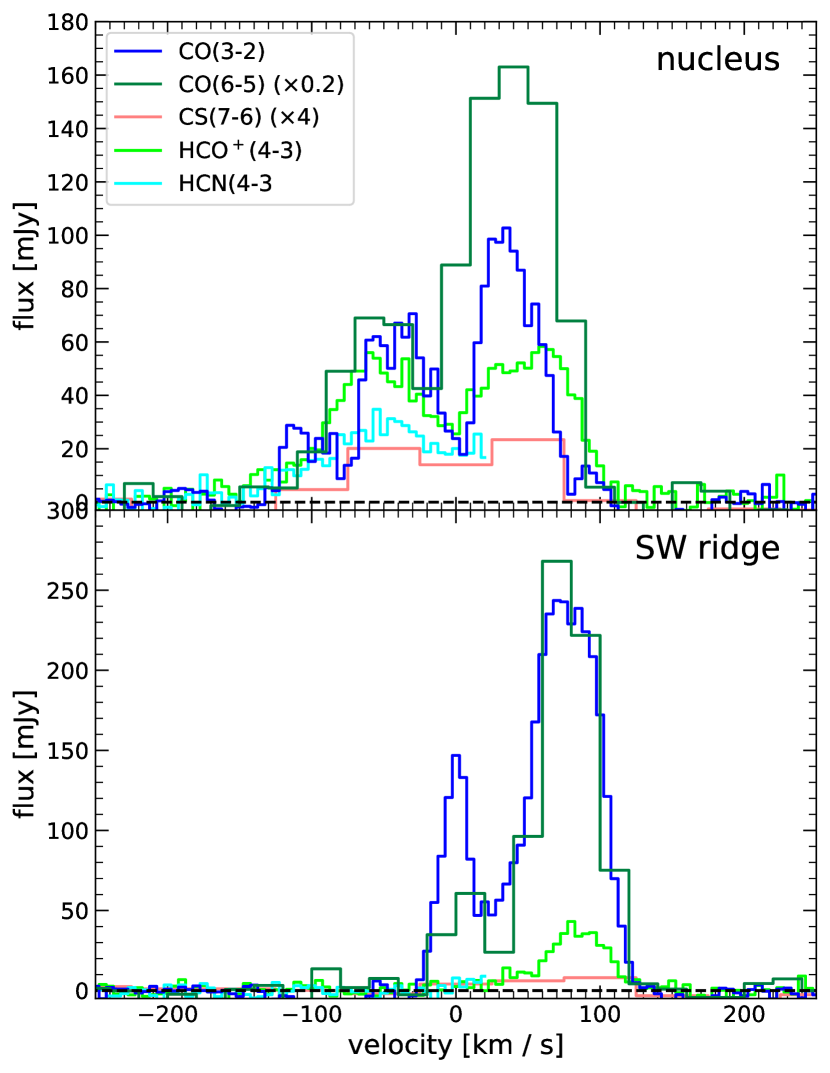
In Fig. 5, spectra for two locations are shown: at the nucleus itself and for the ridge-like structure (cyan cross and tip of the cyan arrow in the top left panel of Fig. 2, respectively). At the nucleus itself, the spectra of all emission lines show a double peak with the two maxima located at . For CO(32), the overall width of the emission and the separation of the peaks is smaller than for the other lines, while the central minimum at is deeper. and HCN (at least on the blue-shifted side which is covered by our observations) are displaying the highest velocities at the centre (up to , that is significantly more than the rotational pattern of the nuclear disk) and show a less deep dip of the profile close to the systemic velocity. This is also reflected by the velocity dispersion, which is the lowest for CO(32), and the highest for (43) (cf. Fig. 3, bottom left panel). The reason for these differences is discussed in Sect. 4.3.
Most of the line emission outside the nucleus comes from only one relatively narrow velocity component with , as can be deduced from the respective intensity-weighted velocity dispersion (moment 2) maps. The dispersion of (43) is the same or slightly lower as that of CO(32), while for the other transitions the dispersions agree within uncertainties.
There are, however, several regions in the spiral arms, where multiple distinct velocity components can be separated. The clearest example is the ridge-like structure to the south-west of the nucleus (see Sect. 3.2). At its northern end, it has a single broad component (, ), which splits up into two velocity components towards the southern end (cf. bottom panel of Fig. 5). This is most clearly seen in the CO(32) data, where the main component is found at with a velocity dispersion of and a second, fainter component is found at the systemic velocity with a lower velocity dispersion (, ). The first, red-shifted component corresponds to the normal velocity field of a rotating disk expected at this location. The two components lead to the increased dispersion along the ridge clearly visible in the moment 2 map of CO(32), see the lower left panel in Fig. 2. CO(65) has a similar two component velocity structure as CO(32), although the systemic peak has a much lower relative intensity (its intensity is much less compared to the redshifted peak than for CO(32)). For HCN, we only see a marginal increase in the spectrum at at the end of the spectral coverage for this line, which could indicate that it also traces the systemic component. The (43) emission, on the other hand, clearly does not show the velocity component at systemic velocity, it only shows the broader, red-shifted component which is consistent with disk rotation. The CS line has too low signal to noise and spectral resolution to separate any two components clearly. We hence interpret the narrow systemic velocity component as a lower density filament behind the disk, along which material is falling toward the disk, that is it has a lower line-of-sight velocity than the gas in the disk at this location. The gas is of lower density and excitation than the gas in the disk, because it is comparatively weaker in CO(65) and not detected in (43). Alternatively, this could be material in front of the disk, similar to dust and gas causing self-absorption at the nucleus, that is material which is lifted up from the disk towards us, although the physical mechanism responsible for this would be unclear.
More or less symmetrically to the ridge on the other side of the nucleus to the north-east, there also seems to be a slight enhancement of the velocity dispersion for CO(32) and also CO(65). The spectrum at this location in fact shows a significantly broader line emission, with an indication of two velocity components separated by . Most other regions with in the moment 2 map of CO(32) similarly show multiple velocity components; in some cases up to three distinct components. These are much less clear or absent in the other emission lines, indicating that this is most likely lower density material above or below the disk in a filamentary structure.
In conclusion we find the kinematics of the molecular material in the nuclear region dominated by rotation, with some perturbation by the spiral arms and by filaments of less dense material above or below the disk with distinct velocity components. In all cases, the velocity dispersion is much lower than the rotational velocity (see also Sect. 4.3).
4 Discussion
4.1 Origin of the continuum emission
Continuum emission at submillimetre wavelengths can have its origin in three different emission mechanisms: thermal free-free emission (bremsstrahlung), synchrotron emission and thermal emission from dust grains. All three mechanisms have characteristic power law spectral indices (for ): for (optically thin) free-free emission, and for synchrotron emission. For thermal dust emission, , depending on the dust emissivity index 555The dust emission is commonly assumed to follow a modified blackbody spectrum, where is the Planck function depending on the temperature , and is the frequency dependent opacity of the dust (Hildebrand, 1983). In the Rayleigh-Jeans regime, this simplifies to , which in turn depends on the dust composition and grain size distribution. In the following we investigate which emission mechanisms are most likely to contribute to the submillimetre continuum emission in the nucleus of the Circinus galaxy.
4.1.1 Continuum ratio map
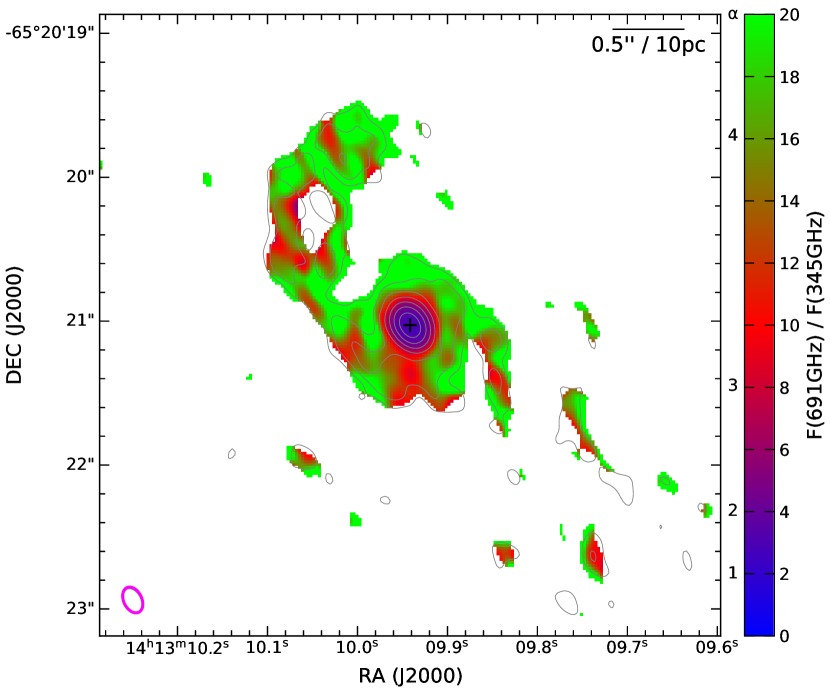
To investigate the origin of the continuum emission seen by ALMA in the nucleus of the Circinus galaxy, we create a map of the flux ratio between the continuum emission at and , after smoothing and regridding the higher resolution map to the resolution of the map. This map is displayed in Fig. 6. For the extended emission at from the nucleus, we obtain a flux ratio of , which corresponds to spectral indices of . This very steep (inverted) slope strongly suggests that this emission is the Rayleigh-Jeans tail of warm dust. The spectral slope corresponds to a dust emissivity index of . This is the ‘classical’ value for dust in the interstellar medium, following for example the ‘Chicago assumptions’ (Hildebrand, 1983) or the calculations of Draine & Lee (1984).
In the nucleus, on the other hand, significantly lower ratios of are measured. This corresponds to a spectral index of . The ratio and hence the spectral index might be somewhat higher, considering that not all flux at may be concentrated at the centre due to remaining phase residuals in the band 9 data. Nevertheless, the very different spectral index in comparison to those at larger distances indicates that the emission from the nucleus may be due to a different mechanism, at least partially.
4.1.2 Spectral energy distribution
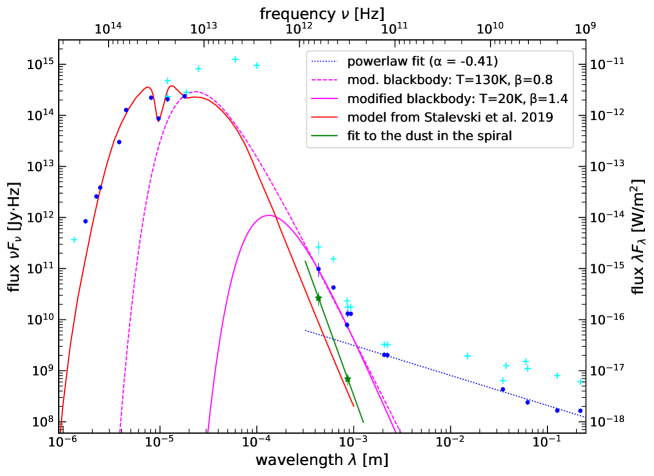
To investigate this possibility further, we complement the high resolution spectral energy distribution (SED) of the nucleus compiled in Prieto et al. (2010) with new measurements at submillimetre wavelengths with ALMA. These new measurements are listed in Table 3. In all cases we used the flux from the central beam, for which the size is also indicated in Table 3. The SED is displayed in Fig. 7. Also given for reference (blue crosses) are ALMA fluxes integrated in larger apertures () or lower resolution data, such as the low resolution measurements with IRAS.
The SED is dominated by two regions: For the emission is dominated by a large bump. Towards longer wavelengths (), the emission is dominated by a power-law.
The large bump at is caused by thermal emission from dust grains heated by the AGN. Fig. 7 includes the SED of the dusty disk and hyperboloid cone model from Stalevski et al. (2019, red continuous line). This model was created to describe the SED and interferometric measurements in the infrared, that is the leftmost () data points in Fig. 7. Our ALMA measurements are well above the Rayleigh-Jeans part of that model, indicating that additional emission from cooler dust must be present. Fig. 7 includes two modified blackbody emitters to represent such an additional component of dust: first, a warm emitter with and (dashed magenta line); second, a cool dust component with and (continuous magenta line). There is a degeneracy between the temperature and the dust emissivity index when fitting far-infrared and submillimetre SEDs using a modified blackbody (see e.g. Shetty et al., 2009), even more so when only considering our two submillimetre continuum measurements. It is therefore not possible to put tighter constraints on the temperature and dust emissivity for such an additional dust component. However, as can be seen from Fig. 7, a component of dust with would be inconsistent with the measurement at and can hence be ruled out. On the other hand, we do not expect the dust in the vicinity of the AGN to be much cooler than . Therefore, we expect any additional dust to have . This implies values of . Such low values may either be caused by very different dust properties in the nucleus, such as large grain sizes. However, there is no other evidence for ‘abnormal’ dust in the nucleus of the Circinus galaxy; on the contrary, to the first order the dust is found to be similar to that in the interstellar medium of the Milky Way (Duy & Lawson, 2019). Therefore, these values are more likely a result of contamination by emission other than dust to the flux at , leading to an artificially low spectral index.
At longer wavelengths (), the emission is dominated by a power-law with a slope . For this fit, we used the ALMA measurement from Wang et al., in prep., as well as the four measurements with the Australia Telescope Compact Array (ATCA) between and by Elmouttie et al. (1998). Our spectral index is somewhat in between those determined by Elmouttie et al. (1998) for the ‘core’ and the ‘nucleus’ of the Circinus galaxy using the ATCA data alone, and , respectively. We note that the ATCA measurements are from significantly larger apertures than the ALMA measurements. Moreover, due to their increasing apertures towards longer wavelengths, they include increasing flux components from the surrounding radio structures. We therefore expect our fitted value to rather be a lower limit. Both free-free absorption by thermal gas as well as a compact synchrotron core with synchrotron self-absorption have been put forward to explain the Circinus radio emission. Considering the spectral slope and that Circinus does not possess a strong radio jet, we favour the interpretation that the emission is mainly due to thermal free-free emission, similar to what has been found for NGC~1068 (Gallimore et al., 2004; Impellizzeri et al., 2019).
4.1.3 Non-dust contribution at 345 GHz
Whatever the exact origin of the radio emission may be, it means that there is a significant contribution of non-dust emission to the nuclear emission at . Using our power-law fit, we estimate a contribution of to the flux at , that is of the order of , at least . This non-dust contribution can explain the shallower spectral index in comparison to the dust emission from the circumnuclear disk as well as why we measure a more compact size for the nuclear emission at than at , as the size of this component is very compact ( from the data, Wang et al., in prep). Our result is in disagreement with the one of Izumi et al. (2018), who estimated that the emission is dominated by dust emission alone. These authors estimated the non-dust contribution by extrapolating the measurement at from Elmouttie et al. (1998) using a power-law with assuming the main mechanism to be synchrotron emission. However we have shown that the slope is probably significantly flatter, leading to a stronger contribution at .
Also in several other nearby AGNs the continuum emission in the core at has been found to be either dominated or at least significantly influenced by non-dust emission: as mentioned above, the core of NGC~1068 has been identified to be dominated by free-free emission (Gallimore et al., 2004; Impellizzeri et al., 2019); in NGC~7469, the nuclear point source has a significant non-dust contribution, probably from synchrotron emission (Izumi et al., 2015, 2020). For the NUGA sample of seven relatively low luminosity AGNs, the continuum point source is expected to be synchrotron emission (Combes et al., 2019), and for three GATOS targets, NGC~3227, NGC~5643 and NGC~7582, spectral indices between and are found, which is seen as evidence for free-free or a combination of dust and synchrotron emission in the unresolved cores (García-Burillo et al., 2021). The Circinus Galaxy is hence in good company.
In summary, we conclude that the nuclear continuum emission at is dominated to by dust emission, while that at has a significant contribution (of the order of ) most likely from free-free, or possibly from synchrotron emission. This additional non-dust emission at can explain both the significantly shallower (inverted) spectral slope at the nucleus compared to the pure dust emission in the circumnuclear disk and the more compact emission at lower frequencies. We note that if the free-free interpretation is indeed correct, the plasma should produce detectable line emission. A detailed model is, however, outside the scope of this paper and will be discussed in Wang et al., in prep.
4.2 Morphology of the dust distribution
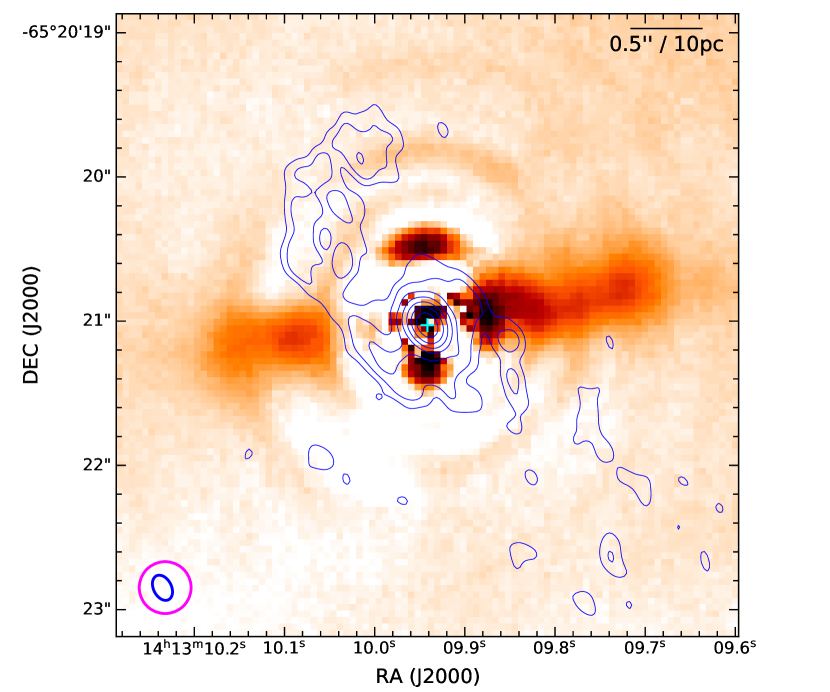
Mid-infrared interferometry and high resolution imaging has revealed that the warm dust in AGNs on scales of several parsecs is extended rather in the polar direction than in the equatorial direction (see Sect. 1). The nucleus of the Circinus galaxy is one of the sources showing the most prominent polar dust extensions. With scales between and , the polar extension covers the same spatial scales as our ALMA data and we therefore compare the mid-infrared to the submillimetre continuum data. Fig. 8 shows the warm dust emission obtained by Stalevski et al. (2017) after subtracting the point spread function (PSF) of the strong unresolved core to better reveal the polar extension out to . Also the core is to a large degree elongated in the polar direction, as revealed by higher resolution mid-infrared interferometric observations (Tristram et al., 2014; Isbell et al., 2022). The polar elongation of the dust emission can be explained by a dusty hollow cone illuminated by an inclined accretion disk (Stalevski et al., 2017). Overplotted are the contours of the ALMA continuum emission at (, the same as in Fig. 1). Clearly there is no morphological resemblance between the two images whatsoever and we see no indications for a polar extension of the emission in our ALMA data. A possible polar extension of the continuum emission at was claimed by Izumi et al. (2018) in their lower resolution data. However we clearly do not see any indications for a polar extension on our higher resolution data and speculate that their fit, although done directly on the visibility data, was affected by the beam. Moreover the polar emission extends out to scales of () in the mid-infrared, which would also be very well resolved in the ALMA data.
We conclude that in the submillimetre we are not just probing the Rayleigh-Jeans tail of the dust emission peaking in the mid-infrared; rather we must be probing two completely different dust components in the mid-infrared and the submillimetre. We therefore paint the following picture: The dust in the polar direction is relatively warm, , and its SED drops sharply towards the submillimetre regime (cf. the red curve in Fig. 7). Furthermore, the emission has a relatively low surface filling factor or column density so that its emission has dropped below our detection limit with ALMA. This emission is coming from optically thin dust in clouds within or at the edge of the outflow. However this dust is not associated with a larger colder dust distribution (which we would see with ALMA). The cold dust, , is mainly distributed in an equatorial plane, roughly following the distribution of the molecular gas. This dust has a higher surface filling factor, so that it dominates the emission at submillimetre wavelengths. This material is most likely located in a turbulent disk as obtained by recent hydrodynamical simulations (e.g. Wada, 2015). It is the material that is responsible for the bulk of the obscuration, on scales of a few parsecs only.
4.3 Kinematics
The kinematics of the nuclear material can give hints on the physical mechanism that keeps the obscuring material geometrically thick. To investigate this, we model the emission line kinematics for the three transitions with the highest signal to noise and completeness, CO(32), CO(65) and (43), using (Di Teodoro & Fraternali, 2015). fits 3D titled ring models to spectroscopic data cubes of emission lines such as those obtained with ALMA. With such a simple model, we aim to obtain rough estimates of the kinematical properties of the gaseous material, considering that the observed kinematics are clearly dominated by rotation. We acknowledge that more complex kinematics, such as streaming motions, lopsidedness and extra-planar gas, will not be captured by this model. The following parameters were fitted for each ring: the inclination angle ( for edge-on); the position angle of the major axis on the receding half of the ring, counted anticlockwise from the north; the rotational velocity ; and the velocity dispersion of the gas ; that is in total four parameters. The software also allows for a fit of the spatial coordinates of the centre as well as for the systemic velocity . However we used the centre as defined by the continuum peaks at and (the latter being identical with the former after correction for the shift between both bands) and set because our data cubes are already corrected for redshift (see Sect. 2.2). Attempts to also fit for these parameters do not result in a significantly improved fit, nor in a significant change of the parameter values with respect to the fixed values. Due to the inhomogeneous line brightness distribution, we chose to normalise the face-on surface density pixel by pixel such that the line intensity maps of the model and the observations are the same. This permits for a non-axisymmetric intensity distribution and avoids that untypical regions, such as areas with strong and clumpy emission or holes affect the global fit (see Di Teodoro & Fraternali, 2015). Furthermore, minimisation was used because it produces significantly more consistent results between rings than the other options.
The fitting was carried out in two steps. In the first step, all four free parameters were fitted independently. In a second step, the inclination and the position angle are regularised using a Bezier function and only the rotation velocity and velocity dispersion are free parameters for the final fit. Uncertainties on the parameters are estimated by the software via a Monte Carlo method. The fits for the Circinus galaxy turn out to be robust and consistent for variations of the radial sampling (ring radii separated by , corresponding to ) and of the initial parameter guesses.
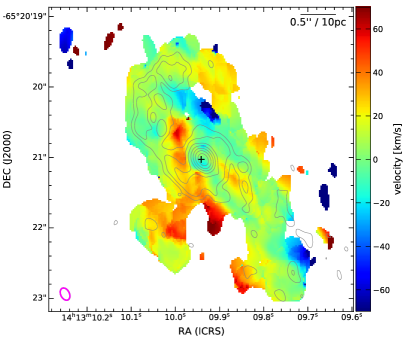
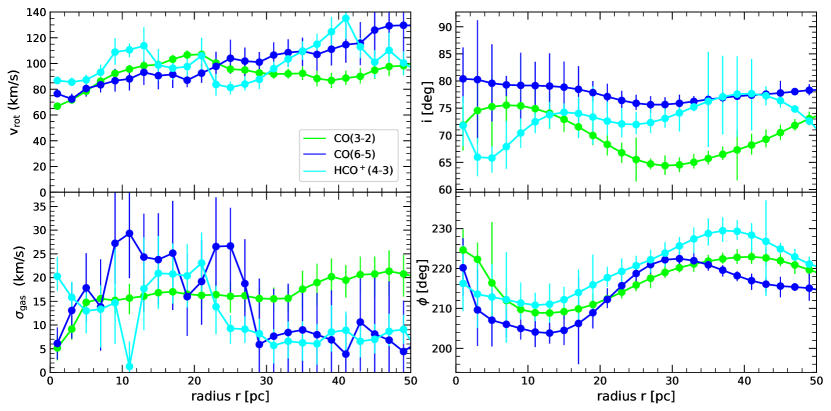
Our fitted velocity maps and velocity residuals are shown in Fig. 9 and the radial dependency of the parameters is displayed in Fig. 10. We find the four fitted parameters to be consistent within uncertainties for all three emission lines, confirming that they trace the same general kinematical structure dominated by rotation. The rotational velocity increases very slowly from at the centre to at a radius of . We find a relatively constant inclination of the rings of , which is in between the lower inclinations found on larger, and the almost edge-on disk found on smaller scales (Curran et al., 2008, and references therein). The residual maps as well as direct comparison of the model cubes to the measured data reveal deviations from the rotation pattern up to in a patchy structure, indicating significant non-circular motions in the circumnuclear disk. Including a radial velocity component in the fit does not significantly reduce these residuals and the fitted radial velocity component is consistent with . This means the deviations are not caused by uniform in- or outflowing motions on scales of the disk, consistent with the result found for molecular hydrogen (Hicks et al., 2009). The residual bulk motions are larger than the typical velocity dispersion of the ring fit model and they are larger than the velocity dispersion of a single velocity component in the data. We see this as evidence for the kinematics of the gas on scales of a few tens of parsecs not being dominated by the random motion of small clouds, but rather by in- or outflowing motions of larger filamentary structures or clouds similar to what is seen in hydrodynamical simulations of the torus (e.g. Schartmann et al., 2009; Wada et al., 2016).
4.3.1 Disk scale height
We try to estimate the disk scale height for the molecular gas via two methods. In the first we assume a self-gravitating (thin) disk, for which the thickness of the disk is given as , where is the mass surface density of the disk of the model (e.g Hicks et al., 2009). With Keplerian rotation and assuming a roughly homogeneous distribution of the material in the disk, that is we obtain and hence for the dense molecular material on scales of ten parsecs.
In the second method, we assume vertical hydrostatic equilibrium and hence for which we obtain a less stringent limit of . Both values are much too low to collimate the ionising radiation to a cone with an opening angle of for which would be required, that is , which is clearly not the case. We conclude that the collimation of the ionising radiation is not carried out by the material in the circumnuclear disk, but rather on scales . Our results are in rough agreement with those found by Izumi et al. (2018), although we find somewhat lower values for the velocity dispersion in our higher resolution data and hence infer lower scale heights. Also our data do not confirm the increase to at seen by Izumi et al. (2018). Our molecular lines trace the (cold) dense mid-plane of the disk. A much higher velocity dispersion, , is measured in molecular hydrogen, (Hicks et al., 2009), implying much higher scale heights for the hot molecular gas component.
4.3.2 Possible signs for a molecular outflow
In the inner to the south east of the nucleus, we find mainly redshifted residual velocities, while to the north-west the residual velocities are mainly blue-shifted; best seen for CO(32), top right panel of Fig. 9. This was already noted in Sect. 3.4 and may be a sign for a molecular outflow in polar direction emanating from the nucleus. The north-western side of this outflow would be slightly oriented out of the plane of the sky towards the observer, similar to the ionisation cone. However any signature of such an outflow is very weak and its velocity, , is significantly lower than the rotational velocity. This is in line with the only extremely weak detection of an outflow in CO(10) on scales of to (Zschaechner et al., 2016). On the other hand, there are several signs for a stronger polar outflow from the AGN in the Circinus galaxy: water masers trace a wide-angle outflow out to (Greenhill et al., 2003), Curran et al. (1999) found an outflow in CO(21) with velocities up to at from the nucleus along the rotation axis and an outflow of ionised gas is clearly observed in the prominent ionisation cone on scales between and with velocities of up to (e.g. Marconi et al., 1994; Veilleux & Bland-Hawthorn, 1997; Fischer et al., 2013). This discrepancy can be explained, if the outflow on parsec scales is mainly in an ionised gas phase and not in a molecular phase. We hence conclude that cold molecular gas is not well suited to trace the outflow in the Circinus galaxy on these scales.
This result is in contrast to those found for various other nearby AGNs, where the kinematics show clear signs of molecular outflows on pc scales, for example the high velocity molecular outflows or jets in NGC~1068 (Gallimore et al., 2016; Impellizzeri et al., 2019) and NGC~1377 (Aalto et al., 2016, 2020), or the AGN-driven molecular outflows in NGC~613 (Audibert et al., 2019) and NGC~3227 (Alonso-Herrero et al., 2019). These outflows are seen as evidence for the disk-wind scenario for the obscuring torus in AGNs. Our results are more similar to those found for NGC~4388, NGC~5506 and NGC~5643, where the kinematics are dominated by rotation and only from the residual velocities or kinematic fits there are much less clear signs for outflows (García-Burillo et al., 2021; Alonso-Herrero et al., 2018). Similar to the case of the Circinus galaxy, the outflows are much clearer identified in the ionised gas components than in the molecular gas in these sources (Fischer et al., 2013; Rodríguez-Ardila et al., 2017).
4.3.3 Self-absorption
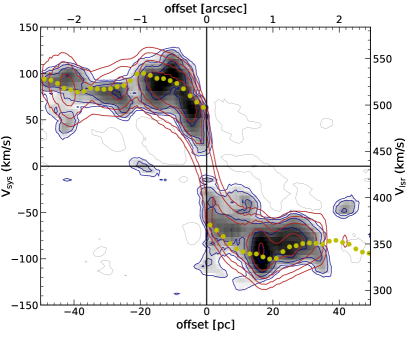
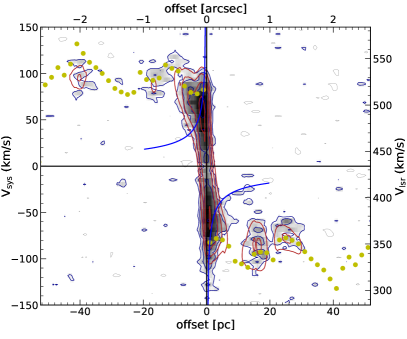
In Sect. 3.4, we found that the nuclear spectrum has a double peaked profile, with varying depth of the dip at systemic velocities and a broader profile for (43) than for CO(32). The tilted ring fit completely fails to reproduce this spectral profile at the centre, especially the dip at the systemic velocity is not reproduced. Although often associated with a rotating disk, a double horned spectral profile is in fact only obtained for a truncated disk, which is clearly not the case for the Circinus nucleus. We therefore see the observed profile as evidence for radiative transfer effects and more precisely for significant amounts of self-absorption (see also Elitzur et al., 2012) as well as absorption against the bright background continuum (e.g. Scoville et al., 2017). Self-absorption is strongest for CO(32), where we expect a lot of foreground material in the galactic disk; it is less strong for higher gas density species such as . This can also be clearly seen in the position velocity diagrams (see Fig. 11), where there is a clear hole in the CO(32) diagram at the position of the nucleus and for zero velocity.
4.3.4 Dynamical mass and black hole sphere of influence
From at (the radius of the innermost ring at ) we obtain a dynamical mass of , which is less than a factor two higher than the mass of the black hole, determined from the maser disk (Greenhill et al., 2003). This means, we just fall short of starting to directly resolve the region kinematically dominated by the supermassive black hole. In fact, (43) and to some degree also CO(65) show significantly higher velocities at the nucleus, up to , especially on the blue-shifted side. We overplotted the expected line-of-sight velocities due to Keplerian rotation around the black hole in the position velocity diagram of (43), right panel of Fig. 11, and it seems that the innermost velocities at the centre are influenced by the black hole potential. Higher resolution observations will be necessary to probe this region in more detail.
4.4 Excitation of the gas
4.4.1 The hole in the CO(32) emission
The apparent deficit in CO(32) emission at the location of the nucleus was already noticed by Izumi et al. (2018) and attributed to the destruction of CO in the X-ray dominated region (XDR) surrounding the nucleus. However, because we clearly detect CO(65) at the nucleus, this hypothesis can be ruled out to a certain degree. Only for the highest velocities at the nuclear position, which start following the Keplerian field of the black hole and are only observed in (43), there might be indications of destruction of CO.
We rather suggest that most of the CO molecules have been excited to higher transitions and that CO(32) is partially self-absorbed or absorbed against the background continuum (see Sect. 4.3.3). The former is supported by the increase of the CO excitation observed already on larger scales in the Circinus galaxy (Zhang et al., 2014), where the high- CO () is likely dominated by the emission from the nucleus. Similar CO excitation has also been found in NGC~1068 from Herschel observations (Spinoglio et al., 2012). Further high resolution observations of several CO transitions will be required to obtain a spectral line energy distribution and confirm this scenario.
In addition to the excitation, also absorption most likely leads to a stronger suppression of the CO(32) emission at the nucleus than for CO(65). This is especially the case for close to systemic velocities, because we expect most of the CO at larger distances from the nucleus, but on the line of sight towards the nucleus, to be in a lower excited state, making CO(32) more absorbed than CO(65).
4.4.2 Emission line ratios
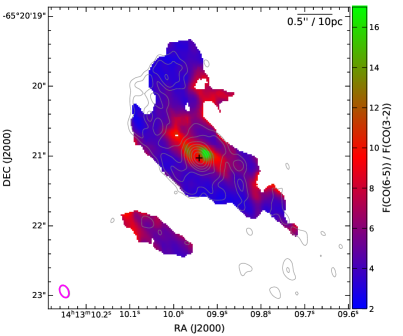
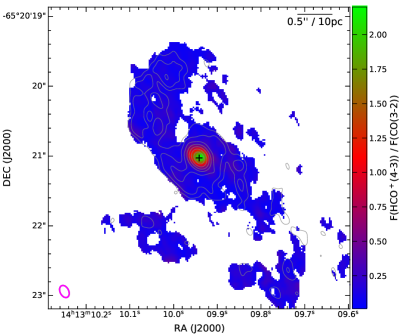
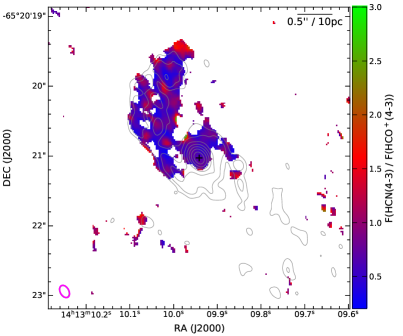
In order to get a first idea of the chemical and physical state of the gas, we show in Fig. 12 the molecular line ratio maps for CO(65) to CO(32), (43) to CO(32) and HCN(43) to (43). For the CO(65) to CO(32) ratio map, the higher resolution CO(65) data from band 9 were smoothed and regridded to match the properties of the CO(32) data in band 7, before calculating the ratio map. For the HCN(43) to (43) ratio map, the (43) line was truncated to velocities in order to match the velocity coverage of the HCN(43) line; the ratio map therefore only covers the north-eastern part of the nucleus.
The line ratio of CO(65) to CO(32) is typically in the extended emission; only in an elongated, disk-like region within of the nucleus, the ratio clearly increases to . This is much higher than the expected ratio under the local thermal equilibrium (LTE) and the Rayleigh-Jeans limit, which is 4 from the scaling (e.g. Narayanan & Krumholz, 2014), indicating a deviation from LTE conditions. Despite that the CO(65) emission peaks at the nucleus, the highest ratio is, however, not directly found at the nucleus itself, but slightly to the north-west with a secondary peak to the north-east. This is mainly caused by the ‘finger’ of emission in CO(32) at the location of the nucleus (see Sect. 3.2). Some of the smaller-scale structures in the ratio map may, however, also be influenced by the low signal to noise of the CO(65) data. Nevertheless we find that CO(65) is clearly enhanced with respect to CO(32) in the inner region. Taken at face value, this trend indicates an increase in excitation and hence in gas temperature towards the nucleus, as has been discussed in the previous section. It is also possible that the increase in the CO(65) line is simply due to an increase of gas density. Also for NGC~1068 (Viti et al., 2014) and Centaurus~A (Espada et al., 2017) an increase by a factor of a few of the CO(65)/CO(32) line ratio has been observed towards the nucleus on scales of tens of parsec. For NGC~1068, the ratio displays a clear peak at the nuclear position, while for Centaurus~A the situation is less clear due to the low resolution and low signal to noise of the data.
In contrast, the (43) to CO(32) ratio clearly shows a very strong enhancement towards the nucleus: While the ratio is outside of the central beam, it rises to values of at the centre. This relative enhancement towards the nucleus hence confirms that this molecule is a better tracer for very dense molecular material than CO. We note that the (43) to CO(32) ratio is between 0.01 and 0.11 in the nuclear region of NGC~1068 (Viti et al., 2014), and that no enhancement of the ratio is observed towards the very nucleus in that galaxy. For NGC~1068, the highest value of this ratio is actually found in the so-called east knot, () to the east of the location of the supermassive black hole, where also the CO(32) emission peaks.
Finally we find a HCN(43)/(43) ratio of around 1, with values ranging between 0.5 and 1.5 in a patchy structure, possibly due to the low signal to noise of the HCN line. We hence do not see any clear enhancement of the HCN/ ratio in the nucleus as has been reported for other galaxies hosting AGNs (e.g. Kohno, 2005; Krips et al., 2008; Imanishi & Nakanishi, 2014; Imanishi et al., 2018a). Our value around unity is similar to that found in the starburst rings of NGC~1068 and NGC~1097 at distance from their nuclei (Viti et al., 2014; Martín et al., 2015), while the HCN/ ratio (in the 43 and 10 transitions, respectively) increases to values of at the nucleus and to values between 2 and 3 in the circumnuclear disk. Also for NGC~613 and NGC~1808, the HCN(43) line is found to be two to three times brighter than (43) in the nuclear region, while at larger distances, , in surrounding star-forming rings lower values of are found for this line ratio (Audibert et al., 2019, 2021).
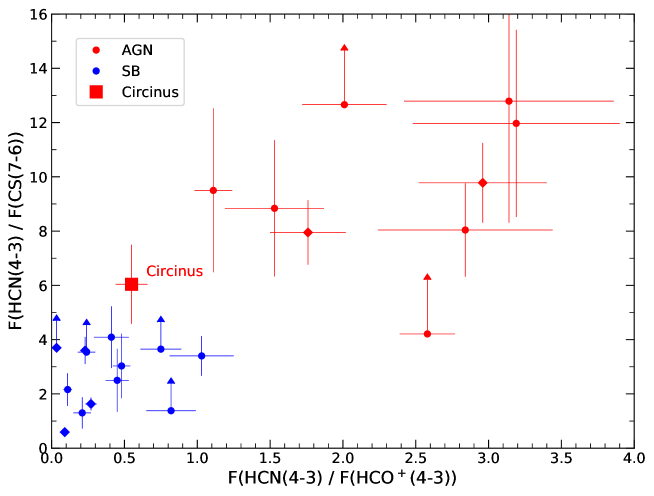
To investigate this further, we show in Fig. 13 the so-called submillimetre HCN diagram, with the HCN(43) to CS(43) ratio plotted as a function of the HCN(43) to (43) ratio following Izumi et al. (2016). Enhanced HCN(43) to (43) and/or HCN(43) to CS(76) intensity ratios have been proposed as an extinction-free energy diagnostic tool for the nuclear regions of galaxies (Izumi et al., 2013, 2016). The HCN enhancement can be explained by either a truly enhanced abundance of HCN compared to and CS in AGNs in contrast to starburst galaxies, that is an astrochemical effect dominated by X-ray activities raised by AGN (e.g. Meijerink et al., 2007; Harada et al., 2013), or by a systematically enhanced gas densities in AGNs. For Circinus, we find and , when integrating the fluxes in a aperture centred on the nucleus and limiting the integration of all lines to the restricted velocity range of the HCN line. The nucleus of Circinus thus has a comparatively low HCN(43) to (43) ratio, in agreement with that found in starburst regions. Only the HCN(43) and CS(43) ratio is slightly higher than for starburst regions. The reason for this lack in AGN-driven enhancement may be due to a relatively weak AGN radiation field in contrast to the starburst intensity. Another explanation may be that the X-rays from the AGN are obscured by the molecular torus, due to the particular edge-on point of view, assuming an exceptionally high optical depth in the HCN line in the mid-plane of the torus.
In conclusion, we find some indications for CO excited to higher transitions as well as increased emission from dense gas tracers, especially (43) in the nucleus of the Circinus galaxy in line with the AGN activity. However, Circinus does not show the HCN enhancement found in several other AGNs. More detailed studies of the molecular composition and excitation using multiple molecules and transitions will be the subject of a future publication.
5 Conclusions
Here we present ALMA band 7 () and band 9 () continuum as well as molecular emission line observations of the nearby Seyfert 2 nucleus in the Circinus galaxy, with unprecedented spatial resolutions of () and (), respectively. Our results can be summarised as follows:
-
•
The continuum emission shows a central peak plus an S-shaped spiral structure out to a radius of . The central peak is essentially unresolved at , with a size of ; at the central peak is slightly resolved with a size of .
-
•
The extended emission at from the nucleus has spectral indices of , which implies that this emission is the Rayleigh-Jeans tail of typical interstellar dust. The nucleus on the other hand has a much lower spectral index of . From an analysis of the infrared to radio SED of the Circinus nucleus, we infer that the nuclear continuum emission at is dominated to by dust emission, while at there is a significant contribution most likely from free-free, or from synchrotron emission. This additional contribution explains both the lower spectral index as well as the more compact emission at .
-
•
No similarity between the morphology of the dust emission at submillimetre wavelengths and at mid-infrared wavelengths is observed. This implies that at these two wavelength ranges we are probing two completely different dust components: a relatively warm dust component with in polar direction for which the SED drops sharply towards the submillimetre regime; as well as a cold dust component with in an equatorial plane, roughly following the distribution of the molecular gas.
-
•
We detect four emission lines in the band 7 data, CO(32), (43), HCN(43) and CS(43), as well as one emission line, CO(65), in the band 9 data.
-
•
All emission lines show a similar morphology as the continuum emission, that is extended emission in an S-shaped structure and a central emission peak. The CO(32) transition is an exception: it does not show a peak at the position of the AGN, but rather a hole (deficit) up to from the nucleus. This deficit can be explained by CO being excited to higher transitions as well as CO(32) being partially self-absorbed or absorbed against the background continuum. We argue that no special XDR chemistry is required to explain the lack of CO(32) at the nucleus.
-
•
The kinematics of the molecular gas is dominated by rotation, with some perturbation by the spiral arms and by filaments of less dense material above or below the disk with distinct velocity components. While the Circinus galaxy hosts a well known ionised outflow in polar direction, we only find very weak signs for a molecular outflow in our ALMA data.
-
•
The velocity dispersion is much lower than the rotational velocity, which implies that the molecular gas is located a relatively thin disk with . This is much too low to collimate the ionising radiation to a cone with an opening angle of . The collimation must hence occur already on scales of , that is the structure playing the role of the ‘obscuring torus’ of the unified scheme of AGNs is compact and yet unresolved by the ALMA observations.
-
•
While we do find indications for CO to be excited to higher transitions and for increased emission from dense gas tracers, especially (43), at the position of the nucleus, the Circinus galaxy does not show the HCN enhancement found in several other AGNs. The Circinus nucleus is rather located in between the loci of starbursts and AGNs in the submillimetre HCN diagram, somewhat questioning the robustness for this diagram to identify AGNs.
Our findings support the most recent radiative transfer calculations of the obscuring structures in AGNs, which find a similar two-component structure. Further observations with even higher angular resolution are, however, required to resolve the region responsible for the collimation of the ionisation cone and the material kinematically dominated by the supermassive black hole.
Acknowledgements.
We thank the anonymous referee for his valuable suggestions to improve the manuscript, which were provided in a record time. We are further grateful to Adele Plunkett for sharing her python routines, to Marko Stalevski for providing the SEDs of his Circinus torus models. Z.-Y. Zh. acknowledges the support of NSFC (grants 12041305, 12173016), the Program for Innovative Talents, Entrepreneur in Jiangsu, China, and the science research grants from the China Manned Space Project with NO.CMS-CSST-2021-A08. This paper makes use of the following ALMA data: ADS/JAO.ALMA#2012.1.00479.S. ALMA is a partnership of ESO (representing its member states), NSF (USA) and NINS (Japan), together with NRC (Canada), MOST and ASIAA (Taiwan), and KASI (Republic of Korea), in cooperation with the Republic of Chile. The Joint ALMA Observatory is operated by ESO, AUI/NRAO and NAOJ.References
- Aalto et al. (2016) Aalto, S., Costagliola, F., Muller, S., et al. 2016, A&A, 590, A73
- Aalto et al. (2020) Aalto, S., Falstad, N., Muller, S., et al. 2020, A&A, 640, A104
- Aalto et al. (2017) Aalto, S., Muller, S., Costagliola, F., et al. 2017, A&A, 608, A22
- Alonso-Herrero et al. (2019) Alonso-Herrero, A., García-Burillo, S., Pereira-Santaella, M., et al. 2019, A&A, 628, A65
- Alonso-Herrero et al. (2018) Alonso-Herrero, A., Pereira-Santaella, M., García-Burillo, S., et al. 2018, ApJ, 859, 144
- Antonucci (1993) Antonucci, R. 1993, ARA&A, 31, 473
- Arévalo et al. (2014) Arévalo, P., Bauer, F. E., Puccetti, S., et al. 2014, ApJ, 791, 81
- Asmus et al. (2016) Asmus, D., Hönig, S. F., & Gandhi, P. 2016, ApJ, 822, 109
- Asmus et al. (2014) Asmus, D., Hönig, S. F., Gandhi, P., Smette, A., & Duschl, W. J. 2014, MNRAS, 439, 1648
- Audibert et al. (2019) Audibert, A., Combes, F., García-Burillo, S., et al. 2019, A&A, 632, A33
- Audibert et al. (2021) Audibert, A., Combes, F., García-Burillo, S., et al. 2021, A&A, 656, A60
- Begelman & Silk (2017) Begelman, M. C. & Silk, J. 2017, MNRAS, 464, 2311
- Chan & Krolik (2016) Chan, C.-H. & Krolik, J. H. 2016, ApJ, 825, 67
- Combes et al. (2019) Combes, F., García-Burillo, S., Audibert, A., et al. 2019, A&A, 623, A79
- Curran et al. (2008) Curran, S. J., Koribalski, B. S., & Bains, I. 2008, MNRAS, 389, 63
- Curran et al. (1999) Curran, S. J., Rydbeck, G., Johansson, L. E. B., & Booth, R. S. 1999, A&A, 344, 767
- Di Teodoro & Fraternali (2015) Di Teodoro, E. M. & Fraternali, F. 2015, MNRAS, 451, 3021
- Draine & Lee (1984) Draine, B. T. & Lee, H. M. 1984, ApJ, 285, 89
- Duy & Lawson (2019) Duy, T. D. & Lawson, W. A. 2019, MNRAS, 488, L75
- Elitzur et al. (2012) Elitzur, M., Asensio Ramos, A., & Ceccarelli, C. 2012, MNRAS, 422, 1394
- Elmouttie et al. (1998) Elmouttie, M., Haynes, R. F., Jones, K. L., Sadler, E. M., & Ehle, M. 1998, MNRAS, 297, 1202
- Emmering et al. (1992) Emmering, R. T., Blandford, R. D., & Shlosman, I. 1992, ApJ, 385, 460
- Espada et al. (2017) Espada, D., Matsushita, S., Miura, R. E., et al. 2017, ApJ, 843, 136
- Fischer et al. (2013) Fischer, T. C., Crenshaw, D. M., Kraemer, S. B., & Schmitt, H. R. 2013, ApJS, 209, 1
- Freeman et al. (1977) Freeman, K. C., Karlsson, B., Lynga, G., et al. 1977, A&A, 55, 445
- Gallimore et al. (2004) Gallimore, J. F., Baum, S. A., & O’Dea, C. P. 2004, ApJ, 613, 794
- Gallimore et al. (2016) Gallimore, J. F., Elitzur, M., Maiolino, R., et al. 2016, ApJ, 829, L7
- García-Burillo et al. (2021) García-Burillo, S., Alonso-Herrero, A., Ramos Almeida, C., et al. 2021, A&A, 652, A98
- García-Burillo et al. (2019) García-Burillo, S., Combes, F., Ramos Almeida, C., et al. 2019, A&A, 632, A61
- García-Burillo et al. (2016) García-Burillo, S., Combes, F., Ramos Almeida, C., et al. 2016, ApJ, 823, L12
- Greenhill et al. (2003) Greenhill, L. J., Booth, R. S., Ellingsen, S. P., et al. 2003, ApJ, 590, 162
- Hagiwara et al. (2013) Hagiwara, Y., Miyoshi, M., Doi, A., & Horiuchi, S. 2013, ApJ, 768, L38
- Harada et al. (2013) Harada, N., Thompson, T. A., & Herbst, E. 2013, ApJ, 765, 108
- Hicks et al. (2009) Hicks, E. K. S., Davies, R. I., Malkan, M. A., et al. 2009, ApJ, 696, 448
- Hildebrand (1983) Hildebrand, R. H. 1983, QJRAS, 24, 267
- Hönig & Kishimoto (2017) Hönig, S. F. & Kishimoto, M. 2017, ApJ, 838, L20
- Imanishi & Nakanishi (2014) Imanishi, M. & Nakanishi, K. 2014, AJ, 148, 9
- Imanishi et al. (2016) Imanishi, M., Nakanishi, K., & Izumi, T. 2016, ApJ, 822, L10
- Imanishi et al. (2018a) Imanishi, M., Nakanishi, K., & Izumi, T. 2018a, ApJ, 856, 143
- Imanishi et al. (2018b) Imanishi, M., Nakanishi, K., Izumi, T., & Wada, K. 2018b, ApJ, 853, L25
- Imanishi et al. (2020) Imanishi, M., Nguyen, D. D., Wada, K., et al. 2020, ApJ, 902, 99
- Impellizzeri et al. (2019) Impellizzeri, C. M. V., Gallimore, J. F., Baum, S. A., et al. 2019, ApJ, 884, L28
- Isbell et al. (2022) Isbell, J. W., Meisenheimer, K., Pott, J.-U., et al. 2022, A&A, accepted
- Izumi et al. (2015) Izumi, T., Kohno, K., Aalto, S., et al. 2015, ApJ, 811, 39
- Izumi et al. (2016) Izumi, T., Kohno, K., Aalto, S., et al. 2016, ApJ, 818, 42
- Izumi et al. (2017) Izumi, T., Kohno, K., Fathi, K., et al. 2017, ApJ, 845, L5
- Izumi et al. (2013) Izumi, T., Kohno, K., Martín, S., et al. 2013, PASJ, 65, 100
- Izumi et al. (2020) Izumi, T., Nguyen, D. D., Imanishi, M., et al. 2020, ApJ, 898, 75
- Izumi et al. (2018) Izumi, T., Wada, K., Fukushige, R., Hamamura, S., & Kohno, K. 2018, ApJ, 867, 48
- Kohno (2005) Kohno, K. 2005, in American Institute of Physics Conference Series, Vol. 783, The Evolution of Starbursts, ed. S. Hüttmeister, E. Manthey, D. Bomans, & K. Weis, 203–208
- Konigl & Kartje (1994) Konigl, A. & Kartje, J. F. 1994, ApJ, 434, 446
- Krips et al. (2008) Krips, M., Neri, R., García-Burillo, S., et al. 2008, ApJ, 677, 262
- Krolik (2007) Krolik, J. H. 2007, ApJ, 661, 52
- Kuo et al. (2011) Kuo, C. Y., Braatz, J. A., Condon, J. J., et al. 2011, ApJ, 727, 20
- Lawrence (2007) Lawrence, A. 2007, in Black Holes from Stars to Galaxies – Across the Range of Masses, ed. V. Karas & G. Matt, Vol. 238, 117–122
- Leftley et al. (2018) Leftley, J. H., Tristram, K. R. W., Hönig, S. F., et al. 2018, ApJ, 862, 17
- López-Gonzaga et al. (2016) López-Gonzaga, N., Burtscher, L., Tristram, K. R. W., Meisenheimer, K., & Schartmann, M. 2016, A&A, 591, A47
- Marconi et al. (1994) Marconi, A., Moorwood, A. F. M., Origlia, L., & Oliva, E. 1994, The Messenger, 78, 20
- Martín et al. (2015) Martín, S., Kohno, K., Izumi, T., et al. 2015, A&A, 573, A116
- Meijerink et al. (2007) Meijerink, R., Spaans, M., & Israel, F. P. 2007, A&A, 461, 793
- Mingozzi et al. (2019) Mingozzi, M., Cresci, G., Venturi, G., et al. 2019, A&A, 622, A146
- Narayanan & Krumholz (2014) Narayanan, D. & Krumholz, M. R. 2014, MNRAS, 442, 1411
- Netzer (2015) Netzer, H. 2015, ARA&A, 53, 365
- Oliva et al. (1998) Oliva, E., Marconi, A., Cimatti, A., & di Serego Alighieri, S. 1998, A&A, 329, L21
- Packham et al. (2005) Packham, C., Radomski, J. T., Roche, P. F., et al. 2005, ApJ, 618, L17
- Phinney (1989) Phinney, E. S. 1989, in NATO Advanced Study Institute (ASI) Series C, Vol. 290, Theory of Accretion Disks, ed. F. Meyer, 457
- Pier & Krolik (1992) Pier, E. A. & Krolik, J. H. 1992, ApJ, 399, L23
- Prieto et al. (2004) Prieto, M. A., Meisenheimer, K., Marco, O., et al. 2004, ApJ, 614, 135
- Prieto et al. (2010) Prieto, M. A., Reunanen, J., Tristram, K. R. W., et al. 2010, MNRAS, 402, 724
- Ramos Almeida et al. (2016) Ramos Almeida, C., Martínez González, M. J., Asensio Ramos, A., et al. 2016, MNRAS, 461, 1387
- Ramos Almeida & Ricci (2017) Ramos Almeida, C. & Ricci, C. 2017, Nature Astronomy, 1, 679
- Rodríguez-Ardila et al. (2017) Rodríguez-Ardila, A., Mason, R. E., Martins, L., et al. 2017, MNRAS, 465, 906
- Schartmann et al. (2009) Schartmann, M., Meisenheimer, K., Klahr, H., et al. 2009, MNRAS, 393, 759
- Scoville et al. (2017) Scoville, N., Murchikova, L., Walter, F., et al. 2017, ApJ, 836, 66
- Shetty et al. (2009) Shetty, R., Kauffmann, J., Schnee, S., & Goodman, A. A. 2009, ApJ, 696, 676
- Spinoglio et al. (2012) Spinoglio, L., Pereira-Santaella, M., Busquet, G., et al. 2012, ApJ, 758, 108
- Stalevski et al. (2017) Stalevski, M., Asmus, D., & Tristram, K. R. W. 2017, MNRAS, 472, 3854
- Stalevski et al. (2019) Stalevski, M., Tristram, K. R. W., & Asmus, D. 2019, MNRAS, 484, 3334
- Tristram et al. (2014) Tristram, K. R. W., Burtscher, L., Jaffe, W., et al. 2014, A&A, 563, A82
- Tristram et al. (2007) Tristram, K. R. W., Meisenheimer, K., Jaffe, W., et al. 2007, A&A, 474, 837
- Uematsu et al. (2021) Uematsu, R., Ueda, Y., Tanimoto, A., et al. 2021, ApJ, 913, 17
- Urry & Padovani (1995) Urry, C. M. & Padovani, P. 1995, PASP, 107, 803
- Veilleux & Bland-Hawthorn (1997) Veilleux, S. & Bland-Hawthorn, J. 1997, ApJ, 479, L105
- Viti et al. (2014) Viti, S., García-Burillo, S., Fuente, A., et al. 2014, A&A, 570, A28
- Vollmer et al. (2018) Vollmer, B., Schartmann, M., Burtscher, L., et al. 2018, A&A, 615, A164
- Wada (2015) Wada, K. 2015, ApJ, 812, 82
- Wada & Norman (2002) Wada, K. & Norman, C. A. 2002, ApJ, 566, L21
- Wada et al. (2009) Wada, K., Papadopoulos, P. P., & Spaans, M. 2009, ApJ, 702, 63
- Wada et al. (2016) Wada, K., Schartmann, M., & Meijerink, R. 2016, ApJ, 828, L19
- Wilson et al. (2000) Wilson, A. S., Shopbell, P. L., Simpson, C., et al. 2000, AJ, 120, 1325
- Zhang et al. (2014) Zhang, Z.-Y., Henkel, C., Gao, Y., et al. 2014, A&A, 568, A122
- Zhao et al. (2018) Zhao, W., Braatz, J. A., Condon, J. J., et al. 2018, ApJ, 854, 124
- Zschaechner et al. (2016) Zschaechner, L. K., Walter, F., Bolatto, A., et al. 2016, ApJ, 832, 142