NuSTAR Observations of AGN with Low Observed X-ray to [OIII] Luminosity Ratios:
Heavily Obscured AGN or Turned-Off AGN?
Abstract
Type 2 active galactic nuclei (AGN) show signatures of accretion onto a supermassive black hole through strong, high-ionization, narrow emission lines extended on scales of 100s to 1000s of parsecs, but they lack the broad emission lines from close in to the black hole that characterize type 1 AGN. The lack of broad emission could indicate obscuration of the innermost nuclear regions, or could indicate that the black hole is no longer strongly accreting. Since high-energy X-rays can penetrate thick obscuring columns, they have the power to distinguish these two scenarios. We present high-energy NuSTAR observations of 9 Seyfert 2 AGN from the IRAS 12 m survey, supplemented with low-energy X-ray observations from Chandra, XMM-Newton, and Swift. The galaxies were selected to have anomalously low observed 2-10 keV luminosities compared to their [O III] optical luminosities, a traditional diagnostic of heavily obscured AGN, reaching into the Compton-thick regime for the highest hydrogren column densities (). Based on updated [O III] luminosities and intrinsic X-ray luminosities based on physical modeling of the hard X-ray spectra, we find that one galaxy was misclassified as type 2 (NGC 5005) and most of the remaining AGN are obscured, including three confirmed as Compton-thick (IC 3639, NGC 1386, and NGC 3982). One galaxy, NGC 3627, appears to have recently deactivated. Compared to the original sample the 9 AGN were selected from, this is a rate of approximately 1%. We also find a new X-ray changing-look AGN in NGC 6890.
1 Introduction
The presence of an actively accreting supermassive black hole (SMBH) in a galaxy is demonstrated through signatures of energetic processes near the central engine. In order of increasing distance from the black hole, the primary signs closest to the black hole are X-ray continuum from the hot corona (found within a few Schwarzschild radii of the SMBH; e.g., Zoghbi et al., 2012), and ultraviolet and optical emission lines with widths greater than from the broad line region (BLR – found within 10s to 100s of light days from the SMBH; e.g., Kaspi et al., 2000, 2005). However, in heavily obscured active galactic nuclei (AGN) for which the line of sight hydrogen column density to the nucleus () exceeds , these signatures are not visible. For AGN with a characteristic luminosity of (i.e., Seyfert galaxies), 60% of sources are in this category (e.g., Burlon et al., 2011; Ricci et al., 2015).
Obscured AGN can still be identified through emission from further out from the central black hole, such as mid-infrared (MIR) thermal continuum from the dusty torus that is thought to surround the AGN accretion disk at distances of 0.1 pc 10s of pc (e.g., Packham et al., 2005; Radomski et al., 2008; Pott et al., 2010; Burtscher et al., 2013; Imanishi et al., 2016; García-Burillo et al., 2016; Gallimore et al., 2016), and the high ionization forbidden lines of the narrow line region (NLR) which occupies 100s to 1000s of pc scales (e.g., Netzer & Laor, 1993; Bennert et al., 2002, 2006; Müller-Sánchez et al., 2011; Ramos Almeida & Ricci, 2017). However, because the torus and NLR are further away from the black hole, it is possible for accretion onto the SMBH to be recently shut off but still preserve the MIR and NLR emission (e.g., within the last 10s to 100s of years; Ichikawa & Tazaki, 2017), creating an AGN that looks like a classical Seyfert 2 with the BLR obscured, but that in truth intrinsically lacks a BLR. This could be related to a so-called ‘true’ Seyfert 2 galaxy (e.g., Bianchi et al., 2008b). While so far in the literature these sources have been assumed to be actively accreting, the lack of a BLR could also be due to an AGN that has recently deactivated.
X-rays with energies greater than 10 keV can penetrate thick obscuring columns and reveal the presence of an actively accreting central engine even in a heavily obscured Seyfert 2 galaxy. As the first focusing X-ray telescope in orbit with sensitivity above 10 keV, the Nuclear Spectroscopic Telescope Array (NuSTAR; Harrison et al., 2013) has identified and studied actively accreting SMBHs obscured by even Compton-thick levels of absorption (; e.g., Annuar et al., 2015; Ricci et al., 2016; Boorman et al., 2016). NuSTAR thus gives us an opportunity to measure what fraction of the local Seyfert 2 population is currently accreting, and thereby constrain the AGN duty cycle.
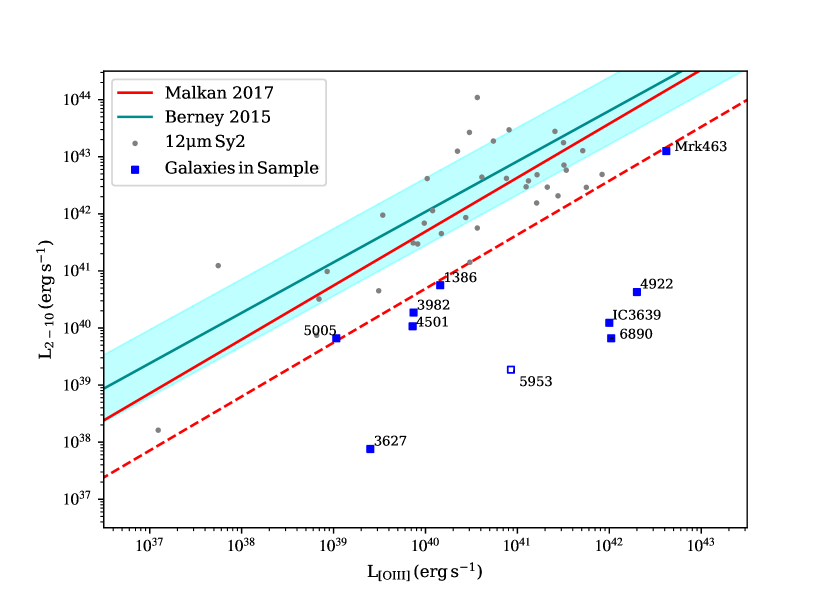
To find Seyfert galaxies without a BLR requires a large sample of galaxies selected based on AGN signatures not blocked by obscuration, such as the warm dust from the torus. The most complete and brightest sample of such galaxies in the local universe are found in the 12 sample of galaxies (Spinoglio & Malkan, 1989; Rush et al., 1993). This sample contains all galaxies in the second Infrared Astronomical Satellite (IRAS; Neugebauer et al., 1984) point source catalogue that exceed 0.3 Jy in flux density at 12 that are also (a) brighter at 60 and 100 than at 12 , and (b) located at declinations 25°. Brightman & Nandra (2008) investigated a subset of Seyfert 2 galaxies from this sample that appeared to be unabsorbed in the X-rays, finding two strong ‘true’ Seyfert 2 candidates, NGC 3147 and NGC 3660. The X-ray spectral properties of the full galaxy sample with XMM-Newton data were presented in Brightman & Nandra (2011a) and Brightman & Nandra (2011b). Of the Seyfert 2 galaxies in this sample, 10 showed anomalously low observed (i.e., not absorption-corrected) 2-10 keV X-ray luminosities compared to their nuclear [O III] luminosities. That is, these galaxies had observed 2-10 keV X-ray luminosities significantly less than expected for their observed [O III] luminosities based on our fit to the to relation for the 39 Seyfert 1 galaxies in the IRAS 12 sample with X-ray observations:
| (1) |
where the luminosities are in units of . The X-ray luminosities were derived directly from the observed 2-10 keV fluxes listed in Panessa et al. (2008), Brightman & Nandra (2011a), and Brightman & Nandra (2011b), while the [O III] luminosities were derived from fluxes listed in Malkan et al. (2017).
The 10 anomalously X-ray faint Seyfert 2 galaxies were an order of magnitude below this relation. This made them candidate Compton-thick AGN, but also potentially turned-off Seyfert 2 AGN if the central engines were inactive. High-energy X-ray observations, as possible with NuSTAR, can distinguish between these two scenarios. Of the 10 outlier galaxies, all but NGC 5953 had NuSTAR observations (Table 1) at the time of writing through a combination of archival data and dedicated observations from our Cycle 3 observing program (PID 3321). Three of the galaxies have already been reported as Compton-thick AGN in the literature based on these NuSTAR observations: NGC 1386 (Brightman et al., 2015), NGC 4922 (Ricci et al., 2017), and IC 3639 (Boorman et al., 2016). However, since those publications, Baloković et al. (2018) has released the BORUS X-ray spectral model which is designed for analyzing high-energy observations of heavily obscured AGN, allowing us to more accurately constrain the parameters of the obscuring torus. Therefore, we analyze all 9 outlier galaxies with NuSTAR data, including those that have already appeared in the literature.
The 9 galaxies of the sample are plotted as the blue squares in Figure 1 alongside the solid red line of Equation 1. The dashed red line represents an order of magnitude below Equation 1. We use updated values from the literature instead of the original values from Malkan et al. (2017) from this point on, though we did use the original Malkan et al. (2017) values in the sample selection. For consistency’s sake we use the reddening-corrected Brightman & Nandra (2011b) values for the [O III] luminosities when available. With the revised [O III] luminosities, NGC 5005 no longer lies more than an order of magnitude below the mean relation from Equation 1, though it did when using the Malkan et al. (2017) values for the original sample selection. Since the revised value is still very close to the selection line (see Figure 1), we keep this galaxy in the sample. NGC 5953 is plotted as an open blue square because it did not have NuSTAR observations at the time of writing and so did not end up in the final sample. The source of its [O III] luminosity is LaMassa et al. (2010). In addition to Equation 1 which is plotted in red, we also plot the intrinsic vs intrinsic relation for Seyfert galaxies from Berney et al. (2015) in dark cyan. This relation is derived from 340 Seyfert 1 and Seyfert 2 galaxies in the BAT AGN Spectroscopic Survey Data Release 1 (Koss et al., 2017), and its RMS scatter is 0.59 dex, shown as the light blue shaded region.
For calculating the distance scales on our images, we adopt the concordance cosmology, , and . For computing luminosities in XSPEC (Arnaud, 1996), we use the default cosmology, which is , and . The 9 galaxies in this sample are very low redshift so the differences between the two cosmologies are negligible.
2 X-Ray Observations and Analysis
The X-ray observations used in this paper are listed in Table 1. We include all available NuSTAR data for the 9 X-ray faint galaxies. NuSTAR observes at 3-79 keV, though most sources are not detected out to the highest energies where the sensitivity of NuSTAR declines. Lower energy X-ray data are important for the spectral analysis, and several telescopes provide focused soft X-ray observations (0.5-10 keV). Where available, we preferentially use archival Chandra observations, due to their sensitivity and high spatial resolution. With its 1′ beam (half-power diameter), NuSTAR suffers confusion of off-nuclear point sources with the central AGN, which is particularly problematic for faint nuclei, as is the case for several of the galaxies analyzed here. When Chandra data were not available or were insufficient for understanding the true nature of some spectral features, we use archival Swift and/or XMM-Newton data.
All X-ray spectra were grouped with a minimum of one count per bin. We fit the data in XSPEC (version 12.11.1). Due to the low number of counts for all sources, the C-statistic was used for fitting. We subtracted the background instead of modeling it separately, in which case XSPEC uses the modified W-statistic. We next describe the X-ray observations by each satellite in more detail.
2.1 NuSTAR
By design, the entire sample presented here has NuSTAR observations obtained from the HEASARC archive111https://heasarc.gsfc.nasa.gov/docs/archive.html. The NuSTAR data were reduced, filtered, and extracted using HEASOFT222 https://heasarc.gsfc.nasa.gov/ftools/ (Nasa High Energy Astrophysics Science Archive Research Center (2014), Heasarc) version 6.28, the NuSTAR Data Analysis Software333 https://heasarc.gsfc.nasa.gov/docs/nustar/analysis/ (NUSTARDAS; version 2.0.0), and the NuSTAR calibration database444 https://heasarc.gsfc.nasa.gov/docs/heasarc/caldb/nustar/ (CALDB; version 20200826). For the extractions, we used circular source regions 40″ in radius centered on the galaxy nucleus positions and circular background regions 100″ in radius. In the spectral fitting, we fixed the NuSTAR normalization constant to unity for FPMA and 1.04 for FPMB, where the latter is based on calibration observations of the bright source 3C 273 reported in Madsen et al. (2015). When multiple FPMA and FPMB observations were available, the normalization constants in the later observations were left as free parameters to account for variability. We used energies from 3 keV to 30 keV from the NuSTAR data for the spectral fitting. Above 30 keV background dominates over AGN emission for our sample.
2.2 Chandra
Chandra ACIS observations were available for 8 of the 9 galaxies from the Chandra Data Archive555 https://cxc.harvard.edu/cda/, with the exception being NGC 6890. For most of this sample of X-ray faint, nearby galaxies, the sensitive, higher angular resolution Chandra observations identify multiple sources within the NuSTAR beam, primarily due to X-ray binaries within the target galaxies. Using CIAO (Fruscione et al., 2006) version 4.12 and the Chandra CALDB666 https://cxc.cfa.harvard.edu/caldb/ version 4.9.1, we extracted Chandra spectra of all sources within a 40″ radius circular aperture around the core of each galaxy, matching the NuSTAR beam. As discussed in the following discussion of individual sources, the Chandra aperture sizes varied depending on whether the source was unresolved and/or if the target was at a larger off-axis angle, for which the Chandra point spread function degrades. Sources in the Chandra images were identified by eye. A circular background region 10″ in radius was used for all Chandra data. We used energies from 0.5 keV to 8.0 keV from the Chandra data for the spectral fitting, and ignored off-nuclear sources with less than 10% the net count rate of the central AGN. We used all archival Chandra data available for these sources, with the exception of NGC 3627, which had a 1.3 ks observation (ObsID: 394) that was ultimately discarded in favor of a much deeper observation (50.3 ks; ObsID: 9548).
2.3 Swift
Because NGC 6890 lacked Chandra observations, we analyzed data from the X-Ray Telescope (XRT) on Swift for this galaxy. The data were obtained from the HEASARC archive. We extracted the data using HEASOFT version 6.28, the Swift XRT Data Analysis Software777 https://swift.gsfc.nasa.gov/analysis/ (SWXRTDAS; version 3.6.0), and the Swift CALDB888 https://heasarc.gsfc.nasa.gov/docs/heasarc/caldb/swift/ version 20200724. We used circular source regions of 25″ radius and background regions of 50″ radius for the spectral extraction. We used energies from 0.3 keV to 10.0 keV from the Swift data for the spectral fitting.
2.4 XMM-Newton
We used XMM-Newton data from the XMM-Newton Science Archive999 http://nxsa.esac.esa.int/nxsa-web for NGC 5005 and NGC 6890, the former to further investigate unusual spectral features found in the NuSTAR data, and the latter because no Chandra observations exist for the source. We used all three of the European Photon Imaging Camera (EPIC) CCDs — i.e., pn, MOS1, and MOS2 — in the spectral fitting. We extracted the data using the XMM-Newton Scientific Analysis System (SAS, version 18.0.0; Gabriel et al., 2004). Details on the XMM-Newton spectral extractions are in the individual notes on each galaxy (§3). We used energies from 0.2 keV to 10.0 keV from the XMM-Newton data for the spectral fitting.
2.5 X-ray Spectral Models
For each galaxy spectrum we began fitting with a simple CONSTANT*TBABS*POWERLAW model in XSPEC. The constant is to account for source variability and cross-normalization differences between the different telescopes; in the text, we refer to this constant as either the cross-calibration coefficient or the normalization constant. The TBABS (Wilms et al., 2000) component models absorption of X-rays due to the interstellar medium of our own Milky Way galaxy, which we determined using the Galactic hydrogen column densities along the line of sight to each galaxy from HI4PI Collaboration et al. (2016). The POWERLAW101010 https://heasarc.gsfc.nasa.gov/xanadu/xspec/manual/node216.html component fits a simple powerlaw to the data with two parameters: the spectral index, , and the normalization, defined as the number of at 1 keV in the source reference frame. In luminous, unobscured AGN, Compton upscattering of thermal photons from the accretion disk by the SMBH corona generates a powerlaw X-ray spectrum across our observed range, and this component dominates the X-ray spectrum. In obscured AGN, this component is absorbed by gas, making the observed X-ray spectrum harder (i.e., a lower value of ). For heavily absorbed, Compton-thick AGN, few photons from the intrinsic spectrum escape below 10 keV. However, a small fraction of the intrinsic powerlaw generally always escapes (e.g., Gupta et al., 2021). This scattered, unabsorbed powerlaw component is typically just a few percent of the intrinsic spectrum.
In addition to this simple initial model, AGN, especially those with heavy absorption, may exhibit a soft excess in the 0.5-2 keV range that is thought due to thermal emission from hot gas along the line of sight. We account for this by adding an APEC (Smith et al., 2001) model, which simulates X-ray emission from a collisionally ionized plasma. Its parameters are the plasma temperature, elemental abundances, and normalization. The APEC normalization is defined as , where is the angular diameter distance to the source, and and are the electron and hydrogen number densities, respectively. For this analysis, we set the elemental abundances to solar.
Obscured AGN also typically show a prominent neutral Fe K-alpha line at 6.4 keV and a Compton hump at keV. These features arise from reflected emission and scattering off gas around the central engine. The gas is believed to be toroidal in geometry and is presumed related to the cooler, more extended dusty torus that is responsible for AGN obscuration at visible wavelengths and AGN thermal emission at MIR wavelengths. We fit the iron line and Compton hump by adding a BORUS model to the overall spectral model, which allows us to constrain the geometry of the torus. BORUS models torus reprocessing of an intrinsic SMBH corona powerlaw spectrum. Its free parameters are the spectral index of the intrinsic powerlaw (), the high-energy cutoff, the torus hydrogen column density (), the torus covering factor (defined as the cosine of the opening angle of the torus), the inclination angle of the torus (), the relative abundance of iron compared to the solar abundance, and the normalization (which is defined the same as it is for the POWERLAW model). We consistently set the high energy cutoff to 500 keV and the iron abundance to solar. We also set the spectral indices of the BORUS model and the POWERLAW model to be the same in all cases except NGC 6890. In the case of an AGN with a BORUS component, the POWERLAW component represents the fraction of the intrinsic powerlaw that is scattered and transmitted through the torus, and so it should have the same spectral index as the BORUS component.
We also tried including a ZTBABS (Wilms et al., 2000) model in our fits. ZTBABS is similar to TBABS but represents absorption from hydrogen at the source, rather than from our Galaxy. However, though we investigated including a ZTBABS component for all of the AGN in this sample, none of the sources ultimately required it. As noted below, a few of the extranuclear X-ray sources did find improved spectral fitting by including a ZTBABS component.
For NGC 5005 we tried a ZGAUSS111111 https://heasarc.gsfc.nasa.gov/xanadu/xspec/manual/node176.html component in addition to a BORUS component. This model represents a Gaussian emission line profile. Its free parameters are the source frame line energy in keV, the source frame line width in keV, the redshift to the source, and the normalization (which is defined as the total photons in the emission line in the source frame). A ZGAUSS model was ultimately preferred over a BORUS model for this source.
Lastly, for NGC 3627 we used a CUTOFFPL121212 https://heasarc.gsfc.nasa.gov/xanadu/xspec/manual/node161.html instead of a POWERLAW component for the extranuclear point sources in the NuSTAR beam. This model component is the same as the POWERLAW component except it includes an exponential rolloff, , where is the normalization, is the energy, is the spectral index, and is the the e-folding energy of the rolloff.
2.6 Measuring X-ray Luminosities
We measured the intrinsic X-ray luminosities from the BORUS normalization and (which was fixed to the POWERLAW for all but NGC 6890). We derived the errorbars on the intrinsic luminosities by turning the upper and lower errors on the BORUS and norm into fractional errors and then added fractional errors on each of the two parameters in quadrature to derive the fractional error on the luminosities.
For NGC 3627 and NGC 5005 (for which BORUS components were not used), we added a CFLUX component to the POWERLAW components of their models. This component calculates the flux of the model component it is added to when the spectrum is fitted. We then converted the fluxes to luminosities using the Local-Group-corrected redshift distances listed in NED. The errors on intrinsic luminosity for these galaxies were derived from the 90% confidence intervals reported by the CFLUX component.
| Target | R.A., Dec. | Observatory | ObsID | Date | Net Exposure Time | Net Count Rate |
|---|---|---|---|---|---|---|
| (J2000) | (ks) | (cts ) | ||||
| NGC 1386 | 03:36:46.18, 35:59:57.87 | Chandra | 4076 | 2003-11-19 | 19.6 | 52.5 |
| - | 12289 | 2011-4-13 | 17.3 | 48.7 | ||
| - | 13185 | 2011-4-13 | 29.7 | 45.4 | ||
| - | 13257 | 2011-4-14 | 33.8 | 47.0 | ||
| NuSTAR | 60001063002 | 2013-7-9 | 18.8/18.4 | 9.2/10.2 | ||
| - | 60201024002 | 2016-5-11 | 25.4/25.8 | 9.9/9.2 | ||
| NGC 3627 | 11:20:14.96, +12:59:29.54 | Chandra | 9548 | 2008-3-31 | 49.6 | 6.1 |
| NuSTAR | 60371003002 | 2017-12-23 | 49.1/48.9 | 3.3/2.3 | ||
| NGC 3982 | 11:56:28.13, +55:07:30.86 | Chandra | 4845 | 2004-1-3 | 9.2 | 6.6 |
| NuSTAR | 60375001002 | 2017-12-5 | 30.7/31.0 | 5.8/4.7 | ||
| NGC 4501 | 12:31:59.161, +14:25:13.39 | Chandra | 2922 | 2002-12-9 | 17.1 | 11.7 |
| NuSTAR | 60375002002 | 2018-1-28 | 58.0/59.4 | 4.2/3.4 | ||
| - | 60375002004 | 2018-5-24 | 58.5/58.2 | 3.5/3.7 | ||
| IC 3639 | 12:40:52.85, 36:45:21.11 | Chandra | 4844 | 2004-3-7 | 8.7 | 31.5 |
| NuSTAR | 60001164002 | 2015-1-9 | 56.1/55.7 | 8.3/8.1 | ||
| NGC 4922 | 13:01:24.90, +29:18:40.0 | Chandra | 4775 | 2004-11-2 | 3.8 | 11.8 |
| - | 15065 | 2013-11-2 | 14.9 | 9.3 | ||
| - | 18201 | 2016-3-6 | 5.8 | 10.7 | ||
| NuSTAR | 60101074002 | 2015-11-9 | 20.2/20.1 | 4.2/2.8 | ||
| NGC 5005 | 13:10:56.23, +37:03:33.14 | Chandra | 4021 | 2003-8-19 | 4.92 | 54.3 |
| XMM-Newton | 0110930501 | 2002-12-12 | 8.7/13.1/13.1 | 297.5/69.1/70.9 | ||
| NuSTAR | 60001162002 | 2014-12-16 | 48.9/48.3 | 5.8/5.4 | ||
| Mrk 463 | 13:56:02.87, +18:22:19.48 | Chandra | 4913 | 2004-6-11 | 49.3 | 24.3aaFor the brighter, eastern component of this merger system (see § 3.8). |
| - | 18194 | 2016-3-10 | 9.8 | 16.1aaFor the brighter, eastern component of this merger system (see § 3.8). | ||
| NuSTAR | 60061249002 | 2014-1-1 | 23.9/23.8 | 2.3/2.2 | ||
| NGC 6890 | 20:18:18.10, 44:48:24.21 | XMM-Newton | 0301151001 | 2005-9-29 | 0.9/7.5/7.8 | 131.1/26.3/28.3 |
| Swift | 00088188001 | 2018-3-6 | 1.7 | 11.13 | ||
| - | 00088188002 | 2018-5-25 | 2.0 | 20.1 | ||
| NuSTAR | 60375003002 | 2018-5-25 | 34.6/34.5 | 59.5/56.2 |
Note. — Net count rates for Chandra data are for the AGN core only. Exposure times and net count rates for NuSTAR observations are FPMA/FPMB. Exposure times and net count rates for XMM-Newton observations are pn/MOS1/MOS2.
3 The Individual Galaxies
We now discuss each of the nine galaxies in our sample individually, providing notes about each one and then details of the X-ray observations and analysis.
3.1 NGC 1386
NGC 1386 is a barred spiral galaxy in the Fornax Cluster (Ferguson, 1989) with prominent dust lanes, a ring of H II regions, and AGN-ionized gas plumes visible in Hubble imagery of its central regions (Ferruit et al., 2000). It is optically classified as a Seyfert 2 galaxy (e.g., Phillips & Frogel, 1980; Brightman & Nandra, 2011b) but it has also been classified as a S1i by Véron-Cetty & Véron (2006) on the basis of a broad Paschen-beta (Pa) component evident in its near-infrared (NIR) spectrum. Ruschel-Dutra et al. (2014) did not find polycyclic aromatic hydrocarbon (PAH) features in its Spitzer nuclear spectrum, likely attributable to ionization by the AGN. The AGN is a water megamaser source (Braatz et al., 1997); such sources typically show higher levels of obscuration (e.g., Zhang et al., 2006; Masini et al., 2016).
Lena et al. (2015) reports that NGC 1386 has a mass outflow rate of and shows complex gas kinematics at its center, likely caused by an ionization cone intersecting the galactic disk at an angle. Rodríguez-Ardila et al. (2017) found even stronger outflows, comparable to that of a strong AGN, with a mass loss rate of . The outflow takes the form of two expanding shells of gas that are coincident with the axis of the radio emission, implying they are likely powered by a radio jet rather than simply by the AGN radiation. Between the broad Pa emission line and the radio maser activity, the broadband properties of NGC 1386 suggest a currently active, obscured Seyfert 2 galaxy.
In the X-rays, Guainazzi et al. (2005a) concluded the XMM-Newton spectrum was best fit by either scattering and transmission components, or by thermal and reflection components. Bianchi et al. (2006) confirmed a reflection-dominated model was the best fit based on Chandra data, but concluded spectral lines visible in the soft X-ray EPIC observations were more likely due to scattering off of photoionized plasma rather than thermal emission. LaMassa et al. (2012) presented a joint analysis of Chandra and XMM-Newton data in the 0.5-2.0 keV range and found that it was best fit with a two-temperature APEC model, indicating the presence of two thermal gas components, one with 0.13 keV and one with 0.67 keV. They noted this was similar to X-ray observations of starburst galaxies (e.g., Dahlem et al., 1998; Strickland et al., 2004). In addition to two APEC components, their model also contained two powerlaw components with spectral indices tied together, each subject to both Galactic absorption and absorption at the source. The latter was found to be , and LaMassa et al. (2012) measured the AGN contribution to the 0.5-2.0 keV X-ray luminosity to be . Recently, Jones et al. (2021) reported Chandra detection of extended hard X-ray emission across the ionization cones of NGC 1386.
Brightman & Nandra (2011a) identified NGC 1386 as Compton-thick on the basis of its XMM-Newton data, which shows a strong Fe K-alpha line ( eV in their model). They confirmed it was reflection-dominated, and measured a hydrogen column density of . Adding data taken by NuSTAR to the existing XMM-Newton spectra, Brightman et al. (2015) found a slightly higher column density, . Masini et al. (2016) found similar results using a combination of a MyTORUS model (Murphy & Yaqoob, 2009) and an emission line component at 6.5 keV.
3.1.1 X-ray Observations and Data Extraction
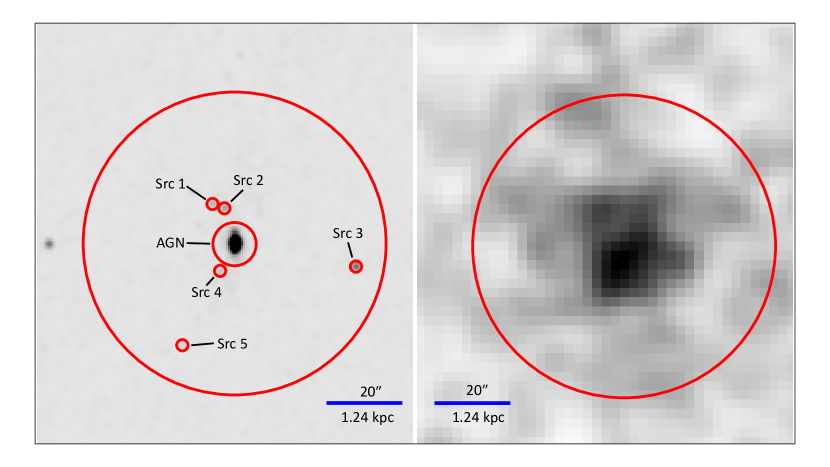
NGC 1386 was observed twice by NuSTAR and four times by Chandra; details, including observation dates and exposure times, are in Table 1. Figure 2 presents the third Chandra observation and the second NuSTAR FPMA observation with the extraction regions overlaid.
The AGN Chandra spectrum was extracted with a circular source region 5.7″ in radius. In addition to the AGN core, five extranuclear point sources in the NuSTAR beam were present in all four Chandra images. They were extracted using circular source regions 1.5″ in radius. Since the count rates for all these sources were less than 10% that of the core, they were ignored in the X-ray spectral fitting.
3.1.2 X-ray Spectral Fitting
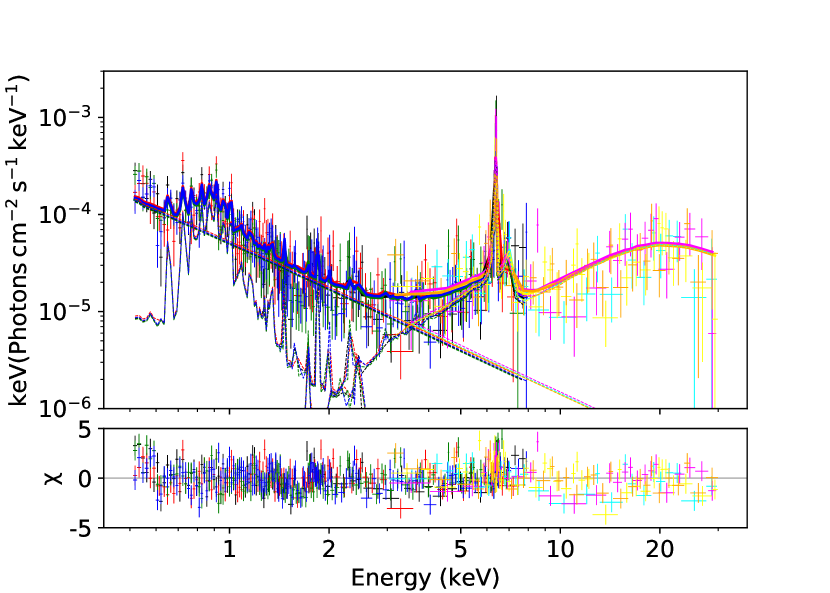
We first modeled the spectrum with TBABS*POWERLAW, which yielded a C-stat/d.o.f. of 2980.46/1698. A strong Fe K-alpha emission line is evident in the unfolded spectrum (Figure 3), as well as a prominent Compton hump at 10-20 keV. We added a BORUS component to the original TBABS*POWERLAW fit to account for these reflection features, fixing the spectral index of the BORUS component to that of the POWERLAW component. This improved C-stat/d.o.f. to 2067.40/1694. Strong residuals above the power law component were present at energies 0.5-2.0 keV so an APEC component was added, resulting in C-stat/d.o.f. = 1679.64/1692. While this is a statistically good fit, remains unconstrained. We therefore opted to freeze at its model value of 0.45 before refitting. The final fit had C-stat/d.o.f. = 1681.69/1693 and the parameters of the best-fit model are presented in Table 2. The 90% confidence interval for the BORUS parameter was unconstrained at the upper end, so it is listed as . The powerlaw spectral index hit the upper bound of 2.6 in the model, so it is listed as . The best-fit model is plotted over the unfolded spectrum in Figure 3. The logarithm of the 2-10 keV luminosity (in units of ) measured from the model is .
| APEC | BORUS | POWERLAW | |||||
|---|---|---|---|---|---|---|---|
| Norm | )aa in units of . | bbCovering factor of torus, equivalent to cosine of torus opening angle. | ccCosine of torus inclination angle. | Norm | Norm | ||
| (keV) | ( cts ) | (cts ) | ( cts ) | ||||
| ddFrozen at this value. | |||||||
Note. — Error bars represent 90% confidence intervals. The Chandra normalization constant values were (ObsID: 4076), (ObsID: 12289), (ObsID: 13185), and (ObsID:13527). The second NuSTAR FPMA and FPMB normalization constants were and (ObsID: 60201024002).
3.2 NGC 3627
NGC 3627 (also known as Messier 66) is a barred spiral galaxy in the Leo triplet of galaxies, along with NGC 3623 and NGC 3628, and is undergoing tidal interactions with them (Schmelz et al., 1987; Hughes et al., 1991; Zhang et al., 1993; Reuter et al., 1996). It exhibits low-luminosity nuclear activity, though its status as a true SMBH-powered AGN (as opposed to simply having a nuclear starburst) has been the subject of debate in the literature. Its optical activity type has been variously characterized as a transition object (e.g. Dudik et al., 2005), Seyfert 2 (e.g. Brightman & Nandra, 2011b), incapable of being distinguished between the transition object and Seyfert 2 classes (Ho et al., 1997), or simply a LINER (Véron-Cetty & Véron, 2006).
NGC 3627 presents a complex profile in the MIR, with diffuse emission across the entire galaxy (Asmus et al., 2014) from which a compact nuclear source cannot be clearly separated.
In the X-rays, NGC 3627 was first detected by ASCA and ROSAT. Roberts et al. (2001) examined these observations and found that the spectrum was described well by a soft thermal component (0.5-1 keV) and a powerlaw component (2-5 keV). They measured the flux ratio between these components to be 0.56, and argued that this indicated the two spectral components likely had a common, non-AGN origin. They noted this flux ratio was very similar to the ASCA flux ratio in the same energies for the starburst galaxy NGC 253. Therefore, they argued that NGC 3627 was unlikely to be a true AGN.
The first Chandra observation of NGC 3627, a 1.3 ks snapshot exposure, was initially published by Ho et al. (2001), who did not detect a dominant unresolved point source in the galaxy’s core, only a group of sources. They therefore concluded that NGC 3627 was not a true AGN. Some later papers also suspected NGC 3627 not to be a true AGN, partially on this basis (e.g. Panessa et al., 2006; González-Martín et al., 2009b); Panessa et al. (2006) put an upper limit of on the nuclear 2-10 keV luminosity. In contrast, and based on the same observations, Zhang et al. (2009) argued the Chandra image does show a dominant central point source within 1″ of the galaxy’s center, and they report a significantly higher 0.3-8 keV X-ray luminosity of .
In NGC 3627’s sole XMM-Newton observation, Panessa et al. (2006) observed a point source at the galaxy nucleus, but noted it was equal in brightness to a second point source 10″ away. Indeed, both Panessa et al. (2006) and Hernández-García et al. (2013) agree the XMM-Newton data is heavily contaminated by emission from sources other than the galaxy core. González-Martín et al. (2009b) failed to find a unresolved point source in the harder bands observed by XMM-Newton (4.5-8.0 keV). Their estimate of the 2-10 keV luminosity is based on the XMM-Newton data, assuming a powerlaw index of and Galactic absorption. They nonetheless identified NGC 3627 as a Compton-thick AGN candidate on the basis of its ratio (González-Martín et al., 2009a). In contrast, Brightman & Nandra (2011a) measured an ionized hydrogen column density of in the XMM-Newton spectrum, which would clearly place it in the Compton-thin regime. Brightman & Nandra (2011a) modeled the XMM-Newton observation of NGC 3627 with a soft thermal emission component and ionized absorber component in addition to Galactic absorption and powerlaw components.
A second, deeper (50.3 ks) Chandra observation of NGC 3627 was taken in 2008 (Grier et al., 2011). In this observation, one can see an unresolved nuclear point source embedded in diffuse emission (Cisternas et al., 2013).
Esparza-Arredondo et al. (2020) fit the NuSTAR data for NGC 3627 with a partial covering absorber that included Galactic absorption. They measured an absorbing hydrogen column density of , which would put the AGN in the Compton-thick category. After correction for absorption they classified NGC 3627 as an AGN in the early stages of fading based on it being under-luminous in X-rays compared to the MIR. In their interpretation, NGC 3627 is observed at the beginning of the fading arc of the AGN duty cycle.
Brightman & Nandra (2011b) plot NGC 3627 on several Baldwin, Phillips, and Terlevich (BPT) diagrams (Baldwin et al., 1981). The position of NGC 3627 on the BPT diagram is an AGN if using [O III]/H vs. [N II]/H, a LINER if it is using [O III]/H vs. [S II]/H, and a Seyfert 2 if using [O III]/H vs. [O I]/H. We therefore adopt its optical classification as an AGN based on previous work.
3.2.1 X-ray Observations and Data Extraction
NGC 3627 has been observed by Chandra twice, for 1.3 ks on 1999 November 3 (ObsID: 394) and for 50.3 ks on 2008 March 31. Given that the first, significantly shorter exposure does not clearly detect any sources at the galaxy center, we ignore those data in our analysis. Table 1 presents details of the latter Chandra observation, as well as the single NuSTAR observation of this galaxy to date.
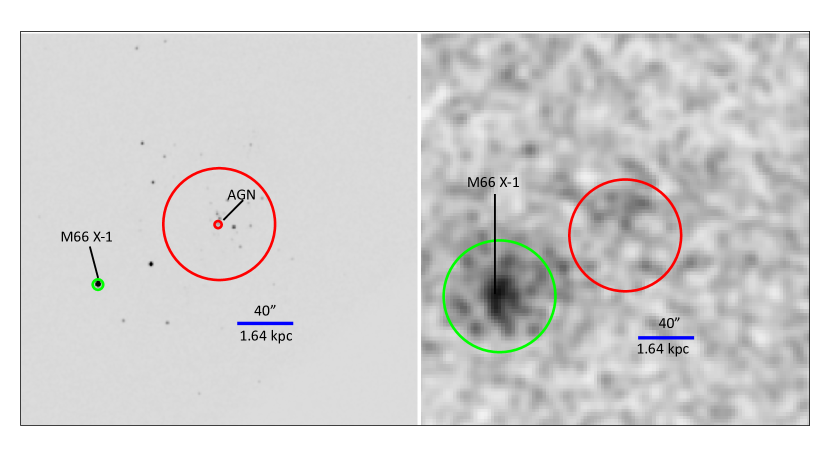
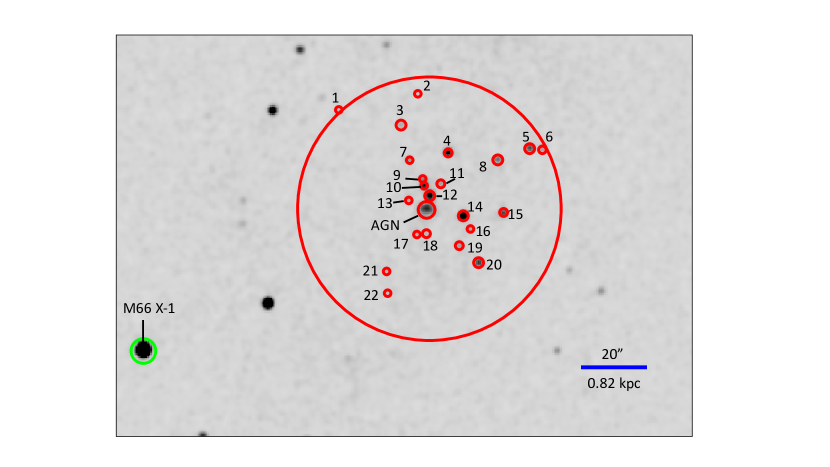
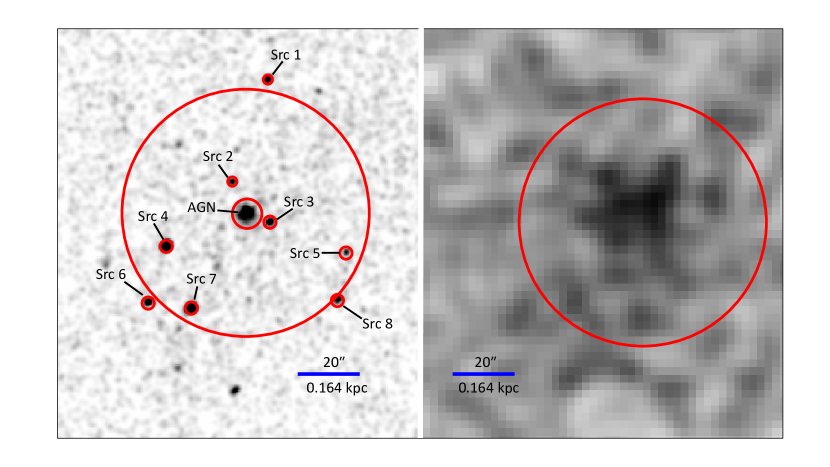
The Chandra and NuSTAR FPMA images of NGC 3627 are shown in Figure 4. There are a large number of sources visible in the Chandra image, with one diffuse, irregularly shaped source associated with the nucleus. In addition, there is a bright point source approximately 1.5′ to the southeast whose brightness dwarfs that of the nucleus as well as the numerous point sources within the NuSTAR beam (Figure 5). This source, associated with the ultraluminous X-ray source (ULX) M66 X-1 (Walton et al., 2011), dominates in the NuSTAR image, while the AGN, in contrast, is not clearly visible. Indeed, we used the Chandra-derived astrometric offset between the ULX and the AGN to place the AGN extraction aperture in the NuSTAR image.
Figure 5 presents a zoomed-in version of the Chandra image, highlighting the 22 off-nuclear point sources visible within the NuSTAR beam. The Chandra AGN spectrum was extracted using a circular source region 2.55″ in diameter. The off-nuclear point sources were extracted using circular source regions 1.5″ in diameter for sources 3, 5, 8, 12, 14, and 20; 1.2″ in diameter for sources 4, 11, 15, 18, and 19; and 1″ in diameter for the remaining sources. Because the nucleus is so faint, 15 Chandra point sources within the NuSTAR beam are brighter than 10% of its count rate. For all other galaxies in our sample, we do joint fitting of the AGN and all off-nuclear point sources within the NuSTAR beam above that threshold. However, fitting this many sources jointly would be prohibitive and most of the Chandra flux within the NuSTAR beam comes from the brightest of these off-nuclear sources. Therefore, only the ten brightest point sources are included in the spectral fitting (i.e., sources 4, 5, 7, 8, 9, 10, 12, 14, 15, and 20).
3.2.2 X-ray Spectral Fitting
Due to the large number of point sources present in the NuSTAR beam, we first fit the off-nuclear point sources with their Chandra data alone. We then initially fit this galaxy with all parameters for the off-nuclear sources frozen based on their Chandra data, thereby avoiding having too many free parameters which can lead to parameter values being implausibly high or low.
We started with a simple model consisting of a CONSTANT, a TBABS component frozen to the Galactic hydrogen column density, and 11 POWERLAW components, one for the AGN and one for each of the 10 brightest point sources, where the latter were frozen to the best-fit values from Chandra. This yielded a C-stat/d.o.f. of 1422.72/1347. However, this fit substantially overestimated the brightness of the NuSTAR data, likely because several of the off-nuclear point sources had hard spectra over the Chandra range that overestimated their brightness at the higher energies of NuSTAR.
We therefore decided to change the POWERLAW component in the extra point sources to a CUTOFFPL model. We started with the high-energy cutoffs frozen at 500 keV for all the sources, and tested whether thawing each one would decrease C-stat or not. Out of all the sources, only thawing the cutoffs on Sources 5, 8, 12, and 14 improved the fit. This fit had a C-stat/d.o.f. of 1182.16/1318.
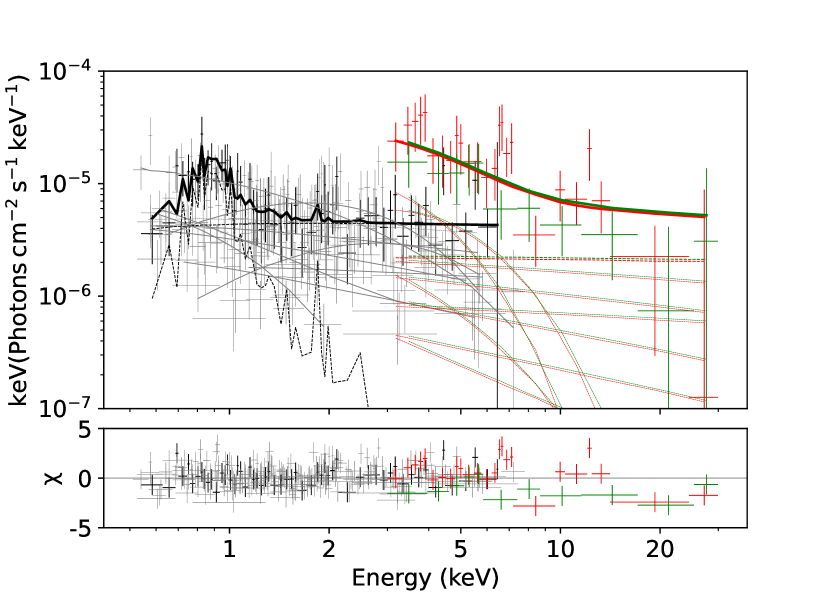
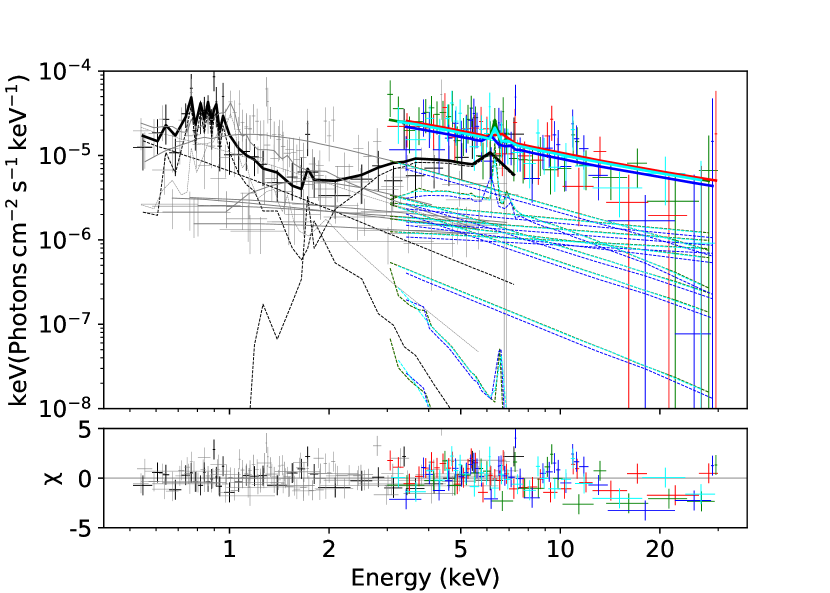
We fit the initial model with Sources 5, 8, 12 and 14’s high-energy cutoffs thawed, then froze the high-energy cutoffs before refitting. We then added an APEC component to the model, as there is an excess between 0.5 and 2 keV. This led to a C-stat/d.o.f. of 1154.65/1320. The final parameter values are tabulated in Table 3. The spectrum and best fit final model are plotted in Figure 6. The logarithm of the 2-10 keV luminosity (in units of ) measured from the model is .
| APEC | CUTOFFPL | ||||
|---|---|---|---|---|---|
| Source | Norm | Cutoff | Norm | ||
| (keV) | ( cts ) | (keV) | ( cts ) | ||
| AGN | – | ||||
| Src 4 | 500aaFrozen at this value. | ||||
| Src 5 | 1.40aaFrozen at this value. | ||||
| Src 7 | 500aaFrozen at this value. | ||||
| Src 8 | 0.51aaFrozen at this value. | ||||
| Src 9 | 500aaFrozen at this value. | ||||
| Src 10 | 500aaFrozen at this value. | ||||
| Src 12 | 1.07aaFrozen at this value. | ||||
| Src 14 | 2.76aaFrozen at this value. | ||||
| Src 15 | 500aaFrozen at this value. | ||||
| Src 20 | 500aaFrozen at this value. | ||||
Note. — The AGN was fit using a POWERLAW model (i.e., not a CUTOFFPL model). The CUTOFFPL normalizations for sources 4, 7, 9, 10, and 20 were estimated with the STEPPAR command. The Chandra instrumental normalization constants on each of the sources could not be constrained.
3.3 NGC 3982
NGC 3982 is a barred spiral galaxy, classified as a Seyfert 1.9 since it possesses broad H but lacks broad H in its optical spectrum (e.g. Ho et al., 1997; Véron-Cetty & Véron, 2006). Seyfert 1.9 galaxies are believed to be highly obscured, and are often lumped together with Seyfert 2 AGN in population studies (e.g. Tran, 2001). The nucleus of NGC 3982 is surrounded by a partial ring of star formation, at a radius of approximately 500 pc (Brum et al., 2017). At MIR wavelengths, NGC 3982 is a compact source with extended emission of unclear origin (Asmus et al., 2014). Tommasin et al. (2010) concluded that 81% of the 19 emission originates from the AGN. Esparza-Arredondo et al. (2020) identify NGC 3982 as a candidate fading AGN.
In the X-rays, NGC 3982 was first observed with ASCA (Moran et al., 2001) and was later serendipitously observed with Chandra as part of the Chandra Deep Field North survey (Alexander et al., 2003). The Chandra spectrum was first analyzed by Guainazzi et al. (2005b), where the low number of counts hampered attempts to fit the spectrum to a Compton-thick model, though they did report a hydrogen column density and a very high Fe K-alpha equivalent width (8 keV based on their “local” fit). These values suggest, though do not confirm, a Compton-thick nature for NGC 3982. Its Chandra spectrum was later re-analyzed by Ghosh et al. (2007) in an attempt to determine whether it was a ‘true’ Seyfert 2, but the low number of counts prevented them from making a robust fit to the spectrum. However, because they did find evidence of photoelectric absorption, they concluded the ‘true’ Seyfert 2 explanation for its 2-10 keV faintness seemed unlikely.
Shu et al. (2007) presented a joint fit of Chandra and XMM-Newton spectra of NGC 3982, where they measured and the Fe K-alpha equivalent width to be 6.31 keV. They therefore classified the AGN as Compton-thick. Akylas & Georgantopoulos (2009) also analyzed these XMM-Newton data and measured somewhat less extreme values, finding and an Fe K-alpha equivalent width of 0.8 keV. LaMassa et al. (2011) attempted to update the NGC 3982 Fe K-alpha properties using archival Chandra data and a ZGAUSS model, but they were unable to constrain the parameters. LaMassa et al. (2012) fit the 0.5-2 keV spectrum with a single APEC and two powerlaw components with the goal of measuring the relative contributions of star formation (APEC) and the AGN (powerlaw) to the soft X-ray luminosity. The two powerlaws had their spectral indices tied together but separate absorption column densities, representing a partial covering geometry where some of the transmitted X-ray emission is absorbed and the rest is scattered along the line of sight. Adopting a absorption column density of for the second powerlaw component, they estimated that 15% of the soft X-ray emission was from the AGN.
Most recently, Kammoun et al. (2020) fit NGC 3982’s XMM-Newton and NuSTAR spectra using a PEXMON model and three variants of a MyTORUS model modified according to the procedures in Yaqoob (2012). The first variant was the standard MyTORUS model, while the other two were decoupled versions where the torus viewing angle was fixed to 90 degrees and the two sides of the torus were modeled separately. One model treated the torus as uniform and the other modeled it as patchy. While the PEXMON model resulted in a Compton-thin column density of , the decoupled MyTORUS models implied significantly higher, Compton-thick values of for a uniform torus and for a patchy torus.
3.3.1 X-ray Observations & Data Extraction
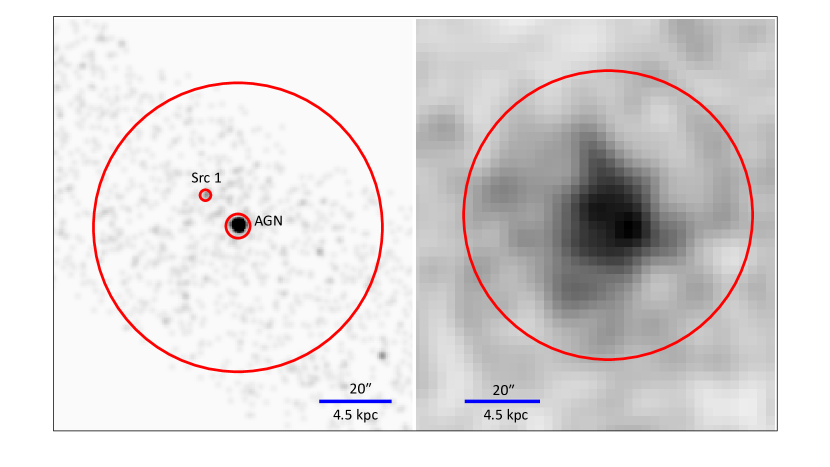
NGC 3982 was observed once by Chandra, on 2004 January 1 (ObsID: 4845), and once by NuSTAR, on 2017 December 5 (ObsID: 60375001002). The net exposure times were 9.20 ks and 61.67 ks, respectively. In addition to the AGN, Figure 7, which presents these images, shows a bright, off-nuclear Chandra point source (Source 1) within the NuSTAR beam. For the Chandra data, we used a 2.5″ radius circular aperture to extract the AGN, and a 1.5″ radius circular aperture to extract Source 1. Since the Source 1 net count rate was more than 10% that of the AGN, we included it in the X-ray spectral analysis.
3.3.2 X-ray Spectral Fitting
We started by fitting Source 1’s Chandra spectrum alone with a simple POWERLAW model, finding best-fit values for its POWERLAW spectral index of and normalization of . We then fit the AGN and Source 1 jointly, freezing the spectral parameters of Source 1 to the best-fit values from Chandra. We started with TBABS*(POWERLAW+POWERLAW) and found C-stat/d.o.f. = 479.68/463. We then added BORUS (C-stat/d.of. = 398.96/459) and APEC (C-stat/d.o.f. = 382.89/457) components to the AGN. was unconstrained in this fit, but was constrained. We froze to its best-fit value of 0.86 before refitting, which allowed us to place a lower limit on . The final C-stat/d.o.f. is 396.15/458. The parameters of this final fit are tabulated in Table 4 and the model is plotted over the X-ray data in Figure 8. The resulting logarithm of the 2-10 keV luminosity (in units of ) measured from this model is .
| APEC | BORUS | POWERLAW | ||||||
|---|---|---|---|---|---|---|---|---|
| Source | Norm | log() | Norm | Norm | ||||
| (keV) | ( cts ) | (cts ) | ( cts ) | |||||
| AGN | aaFrozen at this value. | |||||||
| Src 1 | 1.18aaFrozen at this value. | 5.36aaFrozen at this value. | ||||||
Note. — The instrumental normalization constant for the Chandra AGN data . The normalization constant for the Chandra data of Src 1 was .
3.4 NGC 4501
NGC 4501 (also known as Messier 88) is a spiral galaxy in the Virgo Cluster (Kraan-Korteweg, 1982). In the optical, it has been classified as a Seyfert 2 (e.g., Rush et al., 1993; Véron-Cetty & Véron, 2006) but has occasionally been labeled a LINER (e.g., Carrillo et al., 1999; Brum et al., 2017). The galaxy has a concurrent starburst based on its MIR spectra (Hernán-Caballero & Hatziminaoglou, 2011), though the central regions of the galaxy seem to consist only of evolved stars (Repetto et al., 2017; Brum et al., 2017). The galaxy is approaching the center of the Virgo cluster and has already become depleted of neutral hydrogen due to ram-pressure stripping (e.g., Vollmer et al., 2008; Vollmer, 2009; Nehlig et al., 2016).
NGC 4501 is radio-loud (Videla et al., 2013) and its powerlaw SED across the 1-10 range of its Spitzer spectrum could include a contribution from synchrotron emission from a jet (Lira et al., 2013). Tommasin et al. (2010) report that 70% of its 19 emission comes from the AGN. While these results seem to indicate a strong AGN MIR component, the AGN was barely detectable in subarcsecond MIR images from Asmus et al. (2014), and it was not detected in the M-band () by the Very Large Telescope (VLT) Infrared Spectrometer and Array Camera (ISAAC; Isbell et al., 2021).
In the X-ray, NGC 4501 was first detected by ASCA (Terashima et al., 2000), where its spectrum showed no evidence of heavy absorption or Fe K-alpha emission. Satyapal et al. (2005) analyzed the Chandra observation of NGC 4501 and found it contained multiple X-ray components of equal brightness instead of a dominant hard X-ray component. On this basis they classified NGC 4501 as a non-AGN LINER, though they did note a lack of a dominant hard X-ray component could be caused by absorbing column densities of . LaMassa et al. (2012) estimated that approximately 15% of the soft (0.5-2 keV) X-ray emission in NGC 4501 was from the AGN. The XMM-Newton observations of NGC 4501 were first analyzed in detail by Cappi et al. (2006), who found its 0.5-10 keV spectrum could be fit well with a soft thermal component and a powerlaw component. They concurred with Terashima et al. (2000) that there was no evidence of heavy absorption.
In contrast to these researchers’ conclusions, Brightman & Nandra (2008) argued that NGC 4501’s Chandra observation does indeed show a hard X-ray component coincident with the galaxy’s optical nucleus. They fit this hard component using a PEXMON model. Using the hard X-ray component to estimate the bolometric luminosity of the AGN, they concluded that the AGN was more likely heavily obscured than intrinsically faint. They also noted that previous studies using XMM-Newton data had been hampered by contamination from extranuclear point sources.
3.4.1 X-ray Observations and Data Extraction
NGC 4501 was observed twice by NuSTAR and once by Chandra; details, including observation dates and exposure times, are in Table 1. The Chandra and NuSTAR images of NGC 4501 are presented in Figure 9, with extraction regions overlaid. The Chandra AGN spectrum was extracted with a circular source region 4.78″ in radius. In addition to the AGN core, 8 extra-nuclear sources in the NuSTAR beam are visible in the Chandra image. These were extracted with circular source regions 2″ in radius from the Chandra data, other than the second and eighth sources which were extracted with circular source regions 1.5″ in radius. Of these eight point sources, all but the fifth source (Source 5 in the labeled image) had greater than 10% the count rate of the AGN core, and so they were included in the X-ray spectral fitting.
3.4.2 X-ray Spectral Fitting
Because the large number of extra point sources would create too many free parameters for XSPEC to fit, we repeated the procedure we initially attempted in NGC 3627 for the off-nuclear point sources. That is, we fit each off-nuclear source Chandra spectrum individually to find the best-fit parameters for its model components. Then, in the joint-fitting step with the NuSTAR data, model parameters were frozen to their best-fit values from Chandra. The only free parameter present for each off-nuclear source in the final fitting was its normalization constant.
In the preliminary Chandra fitting, most of the off-nuclear sources were best fit by a simple TBABS*POWERLAW model. The exceptions were Source 1 and Source 4, which both required an additional ZTBABS component, and Source 7, which required an additional APEC component.
We began the joint-fitting with a simple fit consisting of a normalization constant, TBABS, and eight powerlaws, one for the AGN and the rest for the off-nuclear sources. The resulting C-stat/d.o.f. was 1409.95/1489. We then added the other point-source model components and refit each time: the ZTBABS component on Source 4 (C-stat/d.o.f. = 1377.45/1489), the APEC component on Source 7 (C-stat/d.o.f. = 1360.06/1489), and the ZTBABS component on Source 1 (C-stat/d.o.f. = 1345.19/1489).
There is a prominent hard component that rises towards 5 keV in the unfolded Chandra spectrum of the AGN (Figure 10), as would be expected for an Fe K-alpha line created by an obscuring torus along the line of sight. However this hard component is not seen in the NuSTAR data taken 12 years later. This raises two intriguing possibilities. It is possible the AGN has become less luminous in the intervening decade. Modeling all the sources as simple powerlaws, the total Chandra 3-8 keV flux within the NuSTAR beam was with the AGN included, and without the AGN. The 3-8 keV flux for the NuSTAR observations ranged from to . As the 3-8 keV Chandra flux without the AGN was always closer to the NuSTAR fluxes than with it included, this raised the potential for luminosity variation in NGC 4501. It is is also possible that the obscuration of NGC 4501 has changed in the intervening time; if it became very heavily obscured, then even the hard X-ray component could be blocked. Neither possibility is out of the question, as AGN are known to sometimes vary in both luminosity (e.g. LaMassa et al., 2015; Gezari et al., 2017) and obscuration (e.g. Walton et al., 2014; Rivers et al., 2015) over the timescales in question. However, given that 8 point sources other than the AGN are visible in the NuSTAR beam it is also possible that the NuSTAR spectrum is simply contaminated by them, washing out the AGN’s hard X-ray component.
To test the first possibility (that the AGN varied in luminosity) we allowed the normalization of the AGN to freely vary. The AGN spectrum shows a clear soft excess around 1 keV, so we first added an APEC model. We then added a BORUS model to account for the hard component. This rendered implausibly large, however, so we set a lower limit of 0.1 keV and an upper limit of 2.0 keV on . Because the NuSTAR data do not show a reflection/torus component, the inclination angle and covering factor of the AGN torus cannot be measured with much accuracy. For this reason we froze the BORUS parameter to 0.5, and the BORUS parameter to 0.17 (corresponding to an inclination angle of 80 deg). The final fit had a C-stat/d.o.f. of 1296.11/1485. The parameters of this fit are tabulated in Table 5. The cross-calibration coefficient of the AGN in this fit was , which includes 1.71 within its 90% confidence interval. This is not an extreme value for this coefficient to take. As such the claim that the AGN decreased in luminosity cannot be made with confidence. However, this still leaves open the possibility of the obscuration varying between the time of the Chandra observation and the time of the NuSTAR observations.
To test this second possibility (that the AGN varied in obscuration), we untied the Chandra and NuSTAR values of the BORUS parameter from each other, but did not allow the AGN to vary in luminosity between the Chandra and NuSTAR data. After refitting with these changes, the C-stat/d.o.f. was 1296.11/1485. The value of log() in this model changed from in the Chandra observation to in the NuSTAR observations, too similar to explain the lack of appearance of a hard component in the NuSTAR data. Considering this and the negligible improvement in C-stat/d.o.f. if we let the obscuration vary instead of the luminosity, we conclude that there is no evidence in our data of NGC 4501 obscuration variability.
Given that we have no strong evidence of either luminosity or obscuration variability in this AGN, the most parsimonious explanation for the lack of a hard component in the NuSTAR data is contamination from the eight extra point sources. It should be noted, however, that the possibility of variability cannot be ruled out with this data. The best fit with the cross normalization constant on the AGN left to freely vary is plotted in Figure 10. The logarithm of the resulting 2-10 keV luminosity (in units of ) measured from the model is .
| ZTBABS | APEC | BORUS | POWERLAW | ||||||
|---|---|---|---|---|---|---|---|---|---|
| Source | Norm | log() | Norm | Norm | |||||
| () | (keV) | ||||||||
| AGN | 0.5aaFrozen at this value. | 0.17aaFrozen at this value. | |||||||
| Src 1 | 0.72aaFrozen at this value. | 2.25aaFrozen at this value. | 15.2aaFrozen at this value. | ||||||
| Src 2 | 1.21aaFrozen at this value. | 1.59aaFrozen at this value. | |||||||
| Src 3 | 1.48aaFrozen at this value. | 3.05aaFrozen at this value. | |||||||
| Src 4 | 0.21aaFrozen at this value. | 2.12aaFrozen at this value. | 31.4aaFrozen at this value. | ||||||
| Src 6 | 1.37aaFrozen at this value. | 4.17aaFrozen at this value. | |||||||
| Src 7 | 1.09aaFrozen at this value. | 7.25aaFrozen at this value. | 2.33aaFrozen at this value. | 11.7aaFrozen at this value. | |||||
| Src 8 | 1.30aaFrozen at this value. | 2.68aaFrozen at this value. | |||||||
Note. — The instrumental normalization constants for the Chandra data, in the order of sources from the table, are , , , , , , , and . The NuSTAR normalization constants for ObsID 60375002004A are for FPMA and for FPMB. The normalizations for the model components are in units of cts for APEC, cts for BORUS, and cts for POWERLAW.
3.5 IC 3639
IC 3639 is a barred spiral galaxy containing a Seyfert 2 nucleus, as well as a nuclear starburst within the central 80 pc of the galaxy (González Delgado et al., 1998; Fernández-Ontiveros et al., 2018). It is part of a compact group of galaxies, though it lacks features indicative of recent mergers or interactions (Barnes & Webster, 2001). IC 3639 has polarized broad H emission, though the nature of that emission is uncertain: some researchers considerate it as indicative of a hidden broad-line region (Heisler et al., 1997; Lumsden et al., 2001; Temporin et al., 2003), while others claim it is a kinematic feature of the narrow-line region (Ghosh et al., 2007). MIR interferometry reveals a compact, sub-arcsecond, unresolved nuclear point source (Asmus et al., 2014, 2016) surrounded by a halo of MIR emission associated with the compact nuclear starburst (Fernández-Ontiveros et al., 2018). The starburst contributes 70% of the observed MIR flux.
The first published X-ray observations of IC 3639 suggested that it possessed a very high hydrogen column density and a strong Fe K line (Risaliti et al., 1999b). A more detailed analysis of Chandra, Suzaku, and NuSTAR data by Boorman et al. (2016) confirmed it has a hydrogen column density of and an extreme Fe K equivalent width of 2.29 keV. They also found it has a 2-10 keV luminosity well below the expected value based on the luminosity of its [O III] line, assuming the relations of Panessa et al. (2006) and Berney et al. (2015). Overall, Boorman et al. (2016) conclude that IC 3639 is a Compton-thick AGN possessing an active central engine generating a strong reflection component in its X-ray spectrum.
3.5.1 X-Ray Observations & Data Extraction
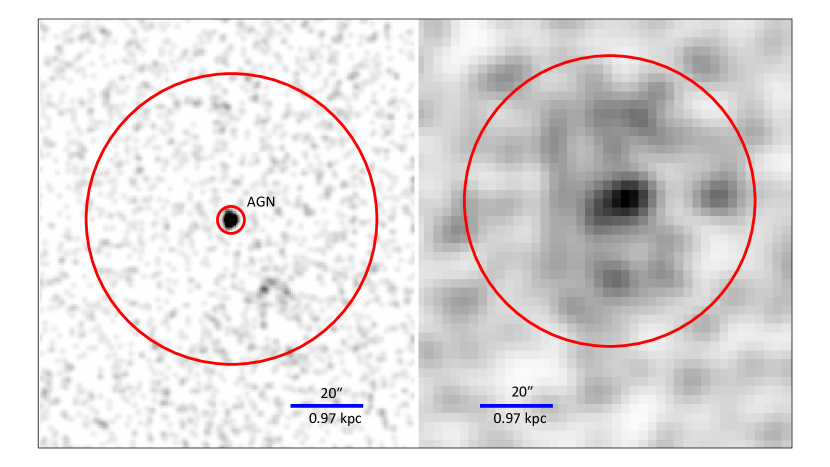
IC 3639 was observed once by both NuSTAR and Chandra. The observation dates and exposure times are in Table 1 and Figure 11 presents the images. The higher resolution Chandra data reveal a faint, off-nuclear point source (labeled “Src 1” in Figure 11) as well as the AGN in the 40″ radius NuSTAR beam. The Chandra AGN spectrum was extracted with a circular region of 3.35″ radius, while Source 1 was extracted with a 1.5″ radius region. Since Source 1 has 10% the net count rate of the AGN, its spectrum is not used in the spectral fitting.
3.5.2 X-Ray Spectral Fitting
We first fit the Chandra and NuSTAR data jointly with a simple absorbed powerlaw (TBABS*POWERLAW) model. The resulting C-stat/d.o.f. was 1062.90/830, indicating a poor fit.
Looking at the unfolded spectrum for IC 3639 (Figure 12), an extremely strong Fe K line can be seen around 6.4 keV. The unfolded spectrum also shows a substantial rise from 10-20 keV, with a pronounced Compton hump at 20 keV. We therefore added a BORUS component to the initial TBABS*POWERLAW model.
Prominent residuals remained at 0.5-2.0 keV, so we also added an APEC component. The resulting best fit model has C-stat/d.o.f. = 606.54/824. The parameter values for the best fit model are tabulated in Table 6. Since the upper error bar for , the lower error bar for , and the lower error bar for the BORUS normalization were less than 0.005 in value, we have rounded them up to 0.01. The best fit model is plotted over the unfolded spectrum in Figure 12. The logarithm of the 2-10 keV luminosity (in units of ) measured from the model is .
| APEC | BORUS | Powerlaw | |||||
|---|---|---|---|---|---|---|---|
| Norm | Norm | Norm | |||||
| (keV) | ( cts ) | (cts ) | ( cts ) | ||||
Note. — Error bars shown are for 90% confidence intervals. The Chandra instrumental normalization constant value was .

3.6 NGC 4922
NGC 4922 is a pair of galaxies in the late stages of a merger (Ricci et al., 2017). The northern galaxy has been classified as a luminous infrared galaxy (Díaz-Santos et al., 2010) and a Seyfert 2 (Yuan et al., 2010). It is also a water megamaser (Braatz et al., 2004). The southern galaxy is an elliptical galaxy with no obvious signs of activity (Alonso-Herrero et al., 1999).
In the X-rays, NGC 4922 was first studied in detail with ROSAT, which detected extended soft X-ray emission across the entire merging pair (Alonso-Herrero et al., 1999). Further observations by Ricci et al. (2017) revealed the northern galaxy is brighter in X-rays, with the southern galaxy’s nucleus only detectable in the 0.3-2 keV band by Chandra, and it was not detected byNuSTAR. Based on joint analysis of Chandra and NuSTAR observations, Ricci et al. (2017) reported the northern galaxy to be Compton-thick, with .
3.6.1 X-Ray Observations and Data Extraction
NGC 4922 was observed once by NuSTAR and three times by Chandra; the observation dates and exposure times are in Table 1. The Chandra spectra were extracted using circular source regions 3.7″ in radius. Figure 13 shows the second Chandra observation and the NuSTAR FPMA observation with the extraction regions overlaid.
3.6.2 X-Ray Spectral Fitting
We first fit the Chandra and NuSTAR data jointly with a simple TBABS*POWERLAW fit, using a Galactic hydrogen column density of . The resulting C-stat/d.o.f. was 407.61/423.
The unfolded spectrum (Figure 14) shows a less prominent Compton rise than some of the other galaxies in the sample (e.g., NGC 1386), but it is present. A presumed Fe K line is also present at 6.4 keV. While the signal-to-noise is lower than in the aforementioned galaxies, NGC 4922 nonetheless shows the features typical of Compton-thick AGN. We therefore added a BORUS component to the initial TBABS*POWERLAW fit, fixing the BORUS spectral index to the POWERLAW spectral index. This resulted in a C-stat/d.o.f. of 338.44/414. An excess of soft X-ray emission was present from 0.5-2.0 keV, so an APEC component was added, resulting in C-stat/d.o.f. = 324.51/412. Because was completely unconstrained with these model components, its value was frozen at 0.17 (or ), representing a near edge-on line of sight. We then refit the model. The final C-stat/d.o.f. was 321.07/412. The resulting values for each of the model parameters are shown in Table 7. The model is plotted over the Chandra and NuSTAR data as the solid lines in Figure 14. The logarithm of the 2-10 keV luminosity (in units of ) measured from the model is .
| APEC | BORUS | POWERLAW | |||||
|---|---|---|---|---|---|---|---|
| Norm | ) | Norm | Norm | ||||
| (keV) | ( cts ) | ( cts ) | ( cts ) | ||||
| aaFrozen at this value. | |||||||
Note. — The Chandra instrumntal normalization constant values were (ObsID: 4775), (ObsID: 15065), and (ObsID: 18201).
3.7 NGC 5005
NGC 5005 is a weakly barred spiral galaxy with a nucleus that is heavily shrouded in dust (Pogge et al., 2000). Its AGN is known to be variable over timescales of months (Younes et al., 2012). NGC 5005’s optical classification has been ambiguous. Shuder & Osterbrock (1981) were able to identify H, [S II], [O II], and [O III] emission lines in its nuclear spectrum, but no others. They did not specify a classification for it but regarded it as unlikely to be a Seyfert 2. Later papers in the literature have classified it as a LINER (e.g., Huchra & Burg, 1992; Ho et al., 1997; Véron-Cetty & Véron, 2006), a Seyfert 2 (e.g., Audibert et al., 2017), or both a LINER and a Seyfert 2 at the same time (e.g., Spinelli et al., 2006; Malkan et al., 2017). Palomar spectra for NGC 5005 show a broad H component blended with narrow H and [N II] emission (Rush et al., 1996; Ho et al., 1997), suggesting NGC 5005 is an unobscured AGN. However, Balmaverde & Capetti (2014) were unable to find a broad H component in later Hubble spectroscopy when using the [O I] line as a template for deblending, and therefore concluded that either the broad H detection in the Palomar data was spurious, or NGC 5005 is a changing-look AGN. Constantin et al. (2015) did, in contrast, identify a broad H line in the Hubble spectra when using the [S II] line as a template for deblending, measuring a broad H component with FWHM of . A detailed analysis of new ground-based spectra as well as the archival Hubble spectra for NGC 5005 was published by Cazzoli et al. (2018), who found a broad H-alpha component in the Hubble spectra, blended with [S II] and [N II]. The broad H component had a FWHM of , was very weak, and was not visible in their ground-based spectra.
NGC 5005’s core is embedded in extended MIR emission that appears to trace out its spiral structure (Asmus et al., 2014). Based on Spitzer data, Tommasin et al. (2010) estimated that only 44% of its 19 emission is from an AGN. Based on the NIR [Fe II] and [P II] forbidden line flux ratios, Terao et al. (2016) found that, unusually, NGC 5005’s narrow line region seems to be predominantly shock-ionized rather than UV-ionized.
In the X-rays, NGC 5005 was first detected by ASCA, where its spectrum was analyzed by Risaliti et al. (1999a). They reported a hydrogen column density of , implying a Compton-thick AGN. Further evidence of NGC 5005’s Compton-thick nature comes from the unusually low ratio between its observed 2-10 keV X-ray and [O III] luminosities. Risaliti et al. (1999a) note, however, that NGC 5005 showed no evidence of a reflection component in its ASCA spectrum, with an upper limit of 0.9 keV on the equivalent width of the Fe K line. They concluded that the hydrogen column density was so thick that the soft X-ray emission from the AGN was completely absorbed, leaving only extended emission from a concurrent starburst to create the ASCA spectrum.
Observations by Chandra and XMM-Newton revealed new features of NGC 5005’s X-ray emission. The AGN core was found to be embedded in a background of extended X-ray emission that follows the contours of the galaxy (Guainazzi et al., 2005a), and that might be responsible for a large soft excess observed in its 0.6-1 keV X-ray spectrum (Gallo et al., 2006). Guainazzi et al. (2005a) concluded the X-ray spectrum was unlikely to be dominated by an inverse Compton component, and placed an upper limit on the equivalent width of an Fe K line of keV. In contrast to Risaliti et al. (1999a), they measured . Furthermore, their search of the available literature at the time (e.g., Shuder & Osterbrock, 1981; Dahari & De Robertis, 1988; Ho et al., 1997) revealed a wide range of reported [O III] fluxes for NGC 5005, some of which were not overluminous compared to the X-ray flux. They therefore claimed NGC 5005 was misidentified as a Compton-thick AGN. These conclusions were further reinforced by later analyses of the Chandra and XMM-Newton observations, with values of closer to (Brightman & Nandra, 2011b) or (Younes et al., 2012) than to Compton-thick column densities. In summary, the latest analyses of optical and X-ray observations of NGC 5005 suggest that it might be intrinsically underluminous rather than heavily obscured.
3.7.1 X-ray Observations and Data Extraction
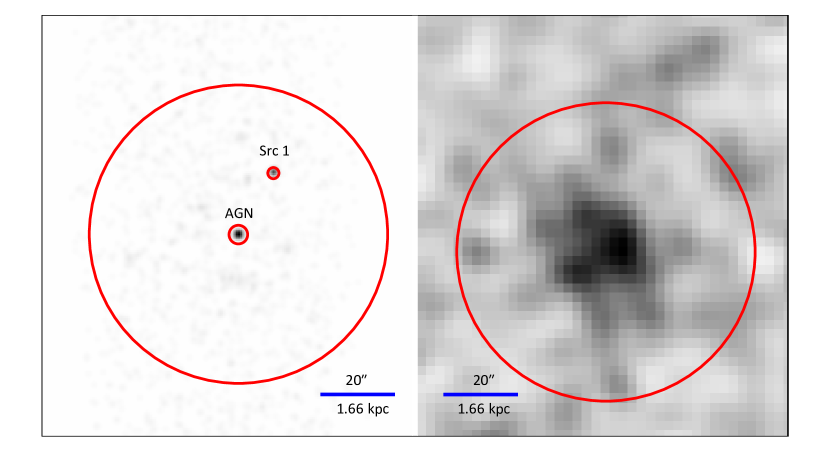
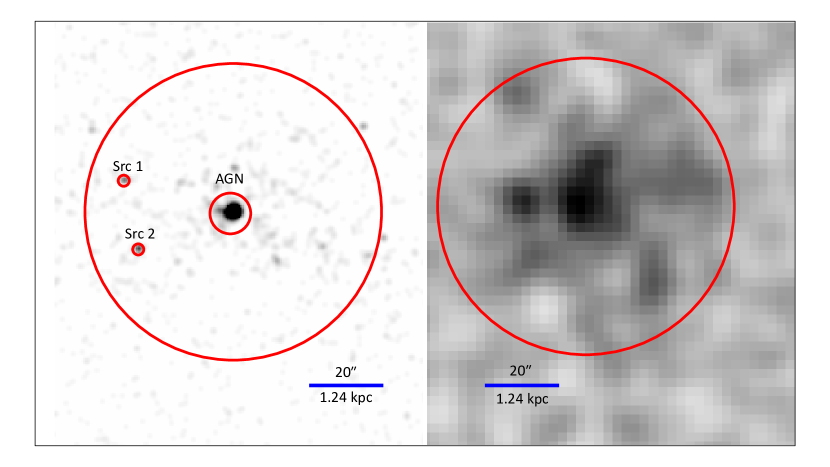
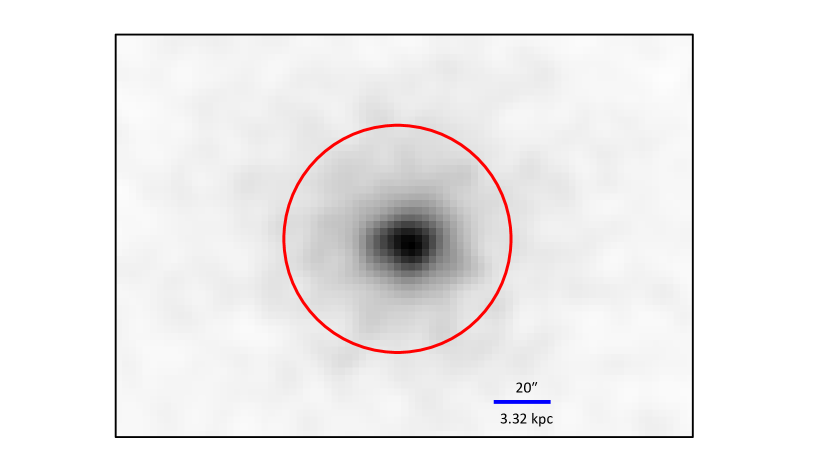
NGC 5005 has been observed once each by NuSTAR, Chandra, and XMM-Newton; details of the observations, including the observation dates and exposure times are in Table 1. Chandra and NuSTAR images of the galaxy are presented in Figure 15. The Chandra AGN spectrum was extracted from a 5.5″ radius circular source region. Two extranuclear Chandra point sources (labeled “Src 1” and “Src 2”) are visible within the NuSTAR beam, which we extracted with 1.5″ radius circular source regions. Since their count rates were less than 10% the count rate of the AGN, they were ignored in the X-ray spectral fitting.
Since no background flares were evident in the XMM-Newton 10-12 keV lightcurve of NGC 5005, the EPIC pn spectrum was extracted from the full dataset. We used 30″ circular source regions with 60″ radius background regions. For the MOS data, we filtered out times with high background, defined as times when the 10-12 keV count rate was . Using patterns 0-12, we extracted the MOS source spectra with 30″ radius circular regions and 50-80″ annular background regions.
3.7.2 X-ray Spectral Fitting
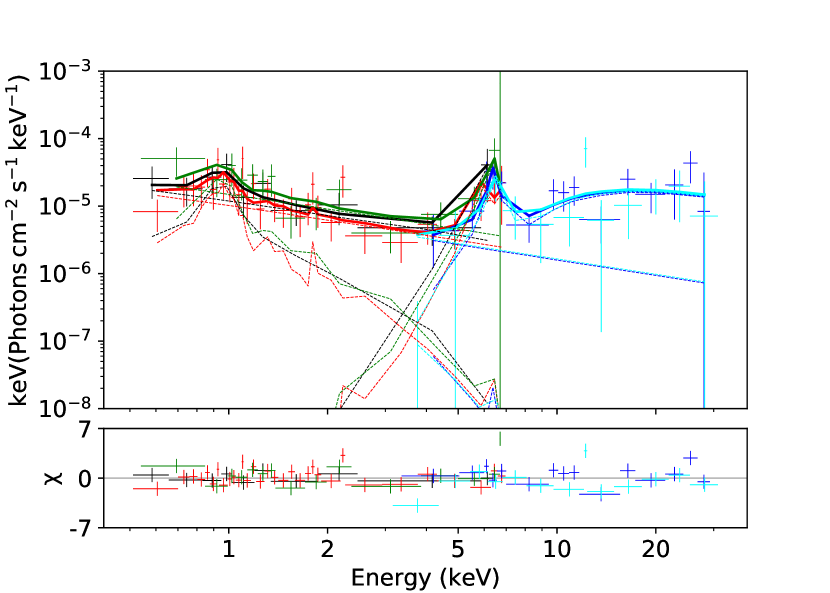
We initially began our analysis with the Chandra and NuSTAR data only. We started with a simple TBABS*POWERLAW fit, with the Galactic hydrogen column density set to . The C-stat/d.o.f. for this fit was 550.23/584, indicating that a powerlaw model captures most of this AGN’s spectrum. Next we added an APEC component to account for the soft excess visible from 0.5-2.0 keV. This reduced C-stat/d.o.f. to 515.15/582, so the APEC component was kept. We then added a BORUS component, as would be appropriate for a Compton-thick AGN, which brought C-stat/d.o.f. down to 504.28/578. However, looking at the unfolded spectrum of NGC 5005 (Figure 16), it is unclear whether a BORUS component is truly justified. The hard X-ray emission does not possess the Compton hump characteristic of a reflection-dominated spectrum, but instead appears to be flat or even declining. It may possess a broad line component in the NuSTAR spectrum, visible as a bump of emission from 4-8 keV. Together, these facts suggest the AGN spectrum might be better fit with just a ZGAUSS component rather than an entire BORUS component.
We added a ZGAUSS component to the TBABS*(APEC+POWERLAW) model, fixing the line energy at 6.4 keV and fixing the line width at keV. This did not significantly change C-stat/d.o.f., though freeing the line width to vary in the fitting brought C-stat/d.o.f. down to 497.25/580.
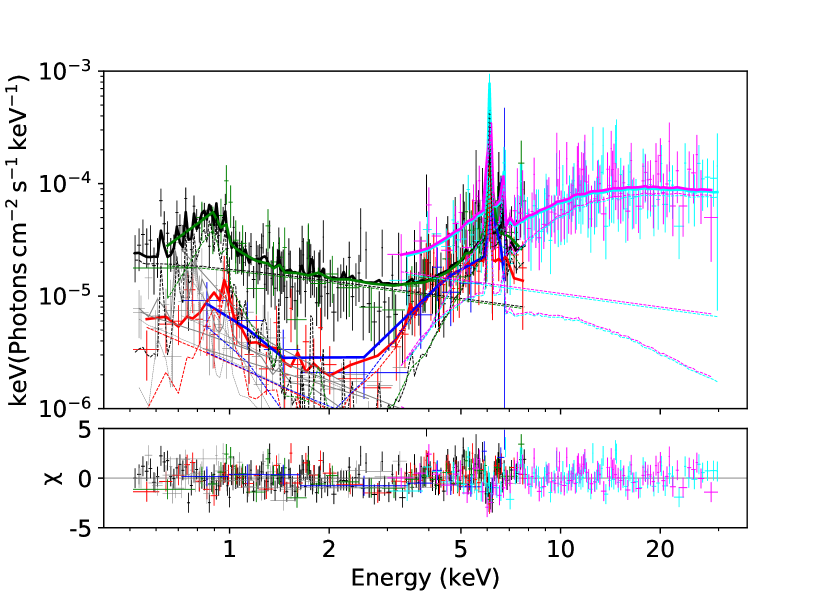
To further ascertain the nature of the unusual bump at 4-8 keV we extracted the XMM-Newton observation of NGC 5005. The bump from 4-8 keV seen in the NuSTAR spectrum is not clearly seen in its XMM-Newton spectra; however the XMM-Newton data were taken a decade earlier, so the lack of the line may simply be due to variability. To determine whether the line was truly absent from the XMM-Newton and Chandra data, we first fit the NuSTAR data alone to a TBABS*(ZGAUSS+POWERLAW) model to find the best fit parameters for the line. The C-stat/d.o.f. of this fit was 391.98/468; for comparison, the C-stat/d.o.f. for a TBABS*(BORUS+POWERLAW) fit to the NuSTAR data was 394.76/467. The resulting line parameters were an energy of 5.91 keV, a line with of 0.76 keV, and a normalization of . We then fit the XMM-Newton and Chandra data alone with a TBABS*(APEC+ZGAUSS+POWERLAW) model, with the ZGAUSS energy and width set to the values measured from the NuSTAR data alone. The normalizations were left to vary freely. The resulting normalizations were consistent with the NuSTAR data for both the XMM-Newton and Chandra data.
We ran 10,000 Monte Carlo simulations to estimate the false alarm probability for the putative line. We simulated fake NuSTAR observations in XSPEC with the parameters of the best fit to the NuSTAR data using only a POWERLAW component, then tried fitting the data with both a POWERLAW model and a POWERLAW+ZGAUSS model. The normalization of the ZGAUSS component was left to freely vary, while the line width was fixed at the value measured from NuSTAR. We then stepped through the values in line energy and saved the best fit. The resulting decrease in C-stat was greater than the decrease for the real data only in 4 out of 10,000 runs. The same was true if we instead fit it with a POWERLAW+ZGAUSS model where the line was unresolved (width fixed at keV). We therefore estimate the false positivity rate as 0.04%. This is a 3.3 sigma detection, and we treat the line as real.
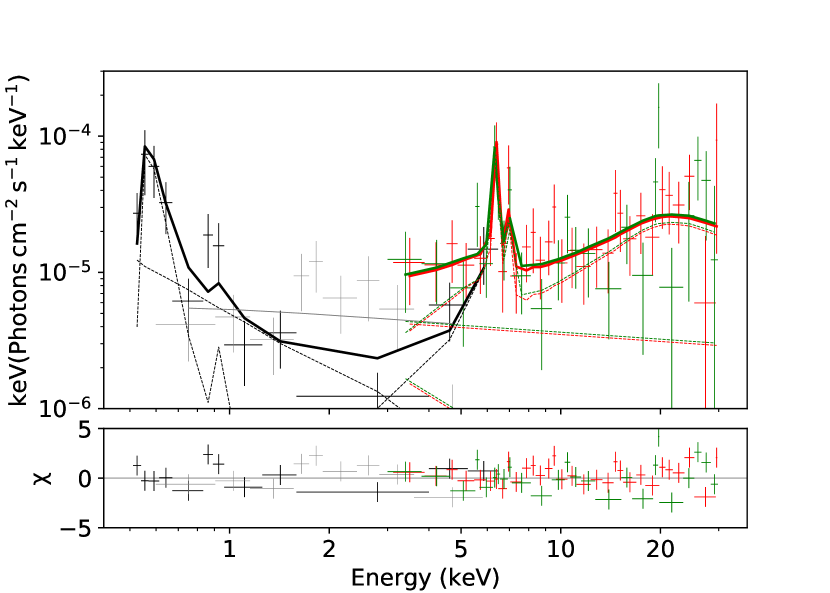
For the final fit, we froze the ZGAUSS parameters to the best-fit values from the NuSTAR data alone. The resulting C-stat/d.o.f. was 1872.72/2130. The parameters for this model are listed in Table 8. It is plotted over the XMM-Newton, Chandra and NuSTAR data in Figure 16. The logarithm of the 2-10 keV luminosity (in units of ) measured from the model is .
| APEC | ZGAUSS | POWERLAW | ||||
|---|---|---|---|---|---|---|
| Norm | Line Energy | Norm | Norm | |||
| (keV) | ( cts ) | (keV) | (keV) | ( cts ) | ( cts ) | |
| aaMeasured from fit to NuSTAR data alone | aaMeasured from fit to NuSTAR data alone | aaMeasured from fit to NuSTAR data alone | ||||
Note. — The XMM-Newton pn, MOS1, and MOS2 instrumental normalization constant values were , , and (ObsID: 0110930501). The Chandra normalization constant value was (ObsID: 4021). All parameters for APEC and POWERLAW components were measured using a fit with the ZGAUSS components fixed to the values from the NuSTAR data alone.
3.8 Mrk 463
Mrk 463 is a complex ongoing merger with two galactic nuclei and prominent tidal tails visible in optical light (Hutchings & Neff, 1989). It has long been known to be an ultraluminous infrared galaxy and possess a Seyfert 2 AGN (Sanders et al., 1988). In fact, Mrk 463 possesses dual AGN (Bianchi et al., 2008a), with the eastern AGN more luminous than the western AGN. The eastern AGN possesses a hidden BLR in polarized light (Tran, 2001). Two-sided conical [O III] outflows extend from the eastern nucleus (Chatzichristou & Vanderriest, 1995), creating an extended emission line region to the south of the galaxy, similar to a voorwerp (Treister et al., 2018). The eastern nucleus and its ionization cones generate radio fluxes comparable to a radio-loud quasar or radio galaxy (Mazzarella et al., 1991), which is highly unusual for a Seyfert AGN. Based on the amount of energy required to create the observed ionization and emission line features, Treister et al. (2018) argued the eastern AGN was 3-20 times more luminous 40,000 years ago. They argue that it might become a bona fide quasar in the future as the galaxy merger progresses.
Mrk 463 displays prominent photoionized metal lines in its XMM-Newton spectra, including from almost fully stripped Fe XXVI (Imanishi & Terashima, 2004) and the O VII radiation recombination continuum (Bianchi et al., 2008a). It also has a neutral Fe K line in its XMM-Newton spectra (Imanishi & Terashima, 2004). Both Imanishi & Terashima (2004) and Bianchi et al. (2008a) concluded that Mrk 463 is overall Compton thin. Using the Chandra data, Bianchi et al. (2008a) detected a strong Fe K line in the eastern nucleus (EW 250 eV), while only an upper limit could be placed on the Fe K line from the western nucleus. The eastern nucleus was also more heavily absorbed. They therefore concluded the eastern nucleus is more obscured than the western nucleus, a claim that is also supported by NIR data.
3.8.1 X-Ray Observations & Data Extraction
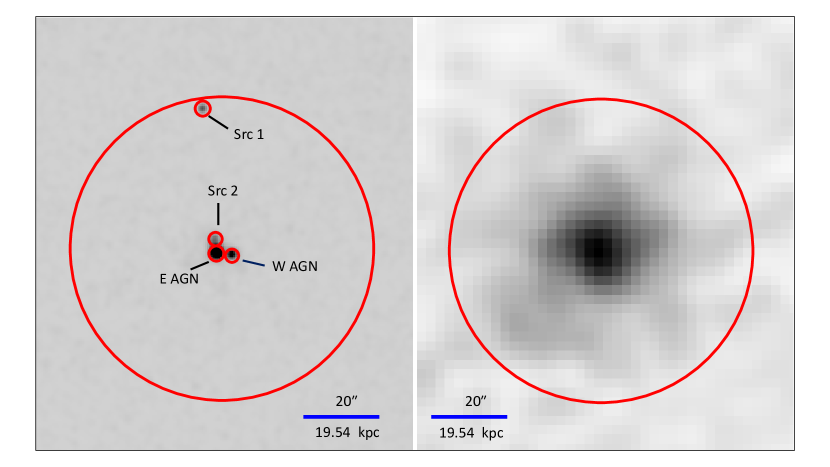
Mrk 463 has been observed once by NuSTAR and twice by Chandra; details of the observations, including the observation dates and exposure times are in Table 1. The image from the first Chandra observation (ObsID: 4913) and the FPMA image from the NuSTAR observation are shown side by side in Figure 17. The higher resolution Chandra image clearly resolves the brighter eastern AGN and the fainter western AGN. An extra-nuclear point source (Source 1) is present in the NuSTAR beam. While at first glance the eastern AGN appears to be an elongated ellipse (and indeed was extracted as such by Bianchi et al., 2008a), closer inspection reveals the northern lobe of the ellipse is not part of the AGN, but rather an area of fainter, extended emission that is not detected above 2 keV in energy. It was therefore extracted as a separate source, labeled Source 2. Both extra-nuclear sources have more than 10% the count rate of the fainter, western AGN in the 0.5-8.0 keV band, so they were ultimately used in the fitting.
The eastern and western AGNs were extracted with circular source regions of radius 2″ and 1.76″, respectively, while Source 1 and Source 2 were extracted with circular source regions of radius 2″ and 1.77″, respectively.
3.8.2 X-ray Spectral Fitting
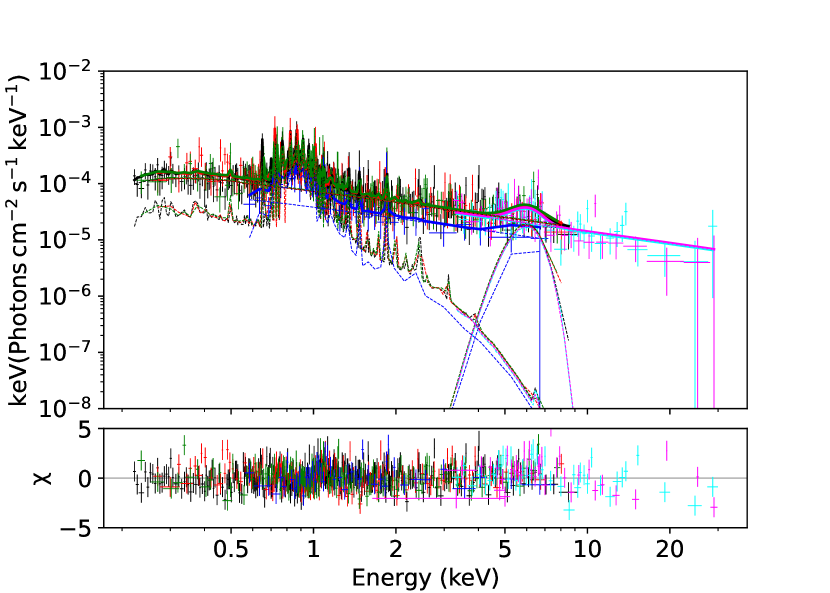
Similarly to NGC 3627 and NGC 4501, we jointly fit the data freezing Source 1’s and Source 2’s parameters to the best-fit values from Chandra alone. We began with a fit that was simply four POWERLAW components. The soft X-ray spectra of the two AGN and Source 2 (see Figure 18) suggest the need for an APEC component, though this is not necessarily true for Source 1. We therefore added APEC components to all the sources but Source 1. The resulting C-stat/d.o.f. was 1673.97/1669.
The NuSTAR spectra (see Figure 18) show a prominent Fe K line and Compton hump, while the Chandra spectra for both AGN show a pronounced rise towards the Fe K line from 4-6 keV. We therefore added a BORUS component to both AGN. Adding it to the east AGN brought C-stat/d.o.f. down to 1517.85/1610, while adding it to the west AGN brought C-stat/d.o.f. down to 1504.83/1610. However, this caused the APEC on the east AGN to become implausibly small ( keV), APEC on the west AGN to be implausibly large ( keV), and the constant on the west AGN to be implausibly large (). To resolve these issues we fixed the normalization constants of the west AGN to have an upper limit of 2 and a lower limit of 0.5. C-stat/d.o.f. was brought down to 1469.63/1606. Most of the BORUS parameters remained unconstrained, however, so we froze to 0.17 (i.e., = 80°). This provided some improvement in C-stat/d.o.f., but some of the BORUS parameters were still not converging. We therefore froze the APEC and normalization of both AGN. The final estimates for each parameter are tabulated in Table 9. The best fit model is plotted over the data as the solid lines in Figure 18. The logarithm of the 2-10 keV luminosity (in units of ) measured from the model is for the eastern AGN and for the western AGN.
| APEC | BORUSaaParameters for this component recovered by freezing APEC component and refitting. | POWERLAW | ||||||
|---|---|---|---|---|---|---|---|---|
| Source | Norm | log() | Norm | Norm | ||||
| (keV) | ||||||||
| E AGN | bbFrozen at this value | |||||||
| W AGN | 0.17bbFrozen at this value | |||||||
| Src 1 | 2.17bbFrozen at this value | 4.03bbFrozen at this value | ||||||
| Src 2 | 0.55bbFrozen at this value | 2.6bbFrozen at this value | 2.49bbFrozen at this value | 2.76bbFrozen at this value | ||||
Note. — The instrumental normalization constants for Chandra observations 4913 and 18194 were and for the East AGN, and for Source 1, and and for Source 2. No errors on the normalization constants for the West AGN could be calculated because a hard lower limit of 0.5 and a hard upper limit of 2.0 were placed on them. The normalizations of the model components are in units of cts for APEC, cts for BORUS, and cts for POWERLAW.
3.9 NGC 6890
NGC 6890 is a spiral galaxy. Its optical activity has traditionally been classified as Seyfert 2 (e.g., Rush et al., 1996), but it has also been more specifically classified as a S1.9 (Véron-Cetty & Véron, 2006).
NGC 6890’s MIR spectrum is dominated by a red continuum suggestive of cool dust and polycyclic aromatic hydrocarbon features (Buchanan et al., 2006), where the latter is indicative of star formation (Deo et al., 2009). Based on its Spitzer IRS spectrum, Tommasin et al. (2010) argued roughly 90% of the 19 emission is due to the AGN. Its MIR morphology is circular and centered on the nucleus (Asmus et al., 2014) but might be somewhat extended (Asmus et al., 2016).
The XMM-Newton observations of NGC 6890 were first analyzed by Shu et al. (2007), who fitted it with an unabsorbed powerlaw. However, since its 2-10 keV X-ray flux was significantly depressed compared to its [O III] flux, they still regarded it as a Compton-thick AGN. In contrast, LaMassa et al. (2011) found that the spectrum was best fit with two absorbed powerlaws. They also detected an Fe K line at the 93% confidence level. The equivalent width was 1.21 keV if they used a global fit, and 0.93 keV if they used a local fit.
Brightman & Nandra (2011a) presented a more detailed analysis of the XMM-Newton data, including fits with PEXMON and TORUS models to account for a reflection component. They measured a hydrogen column density of for this reflection component, which would put it outside the Compton-thick regime.
3.9.1 X-Ray Observations & Data Extraction
NGC 6890 has not been observed by Chandra, but has been observed by XMM-Newton once, by Swift twice, and by NuSTAR once. The NuSTAR observation was concurrent with the second Swift observation. Details of these observations, including their observation dates and exposure times, are in Table 1.
For the XMM-Newton data, we filtered out times with high background, defined as when the count rate in the 10–12 keV range was 0.4 cts for the pn and 0.35 cts for the MOS cameras. We extracted the source spectra with 30″ radius circular regions, and background spectra from an annulus of 50–80″ with pattern 0–4 for the pn and pattern 0–12 for the MOS cameras.
3.9.2 X-ray Spectral Fitting
We began with a simple CONSTANT*TBABS*POWERLAW model. The C-stat/d.o.f. for this fit was 1951.31/1580, implying room for improvement. A BORUS component improved C-stat/d.o.f. to 1736.27/1576. We then added an APEC component, which improved C-stat/d.o.f. to 1724.84/1574. Looking at the unfolded spectrum (Figure 20), the BORUS component seems to have a higher intensity in the Swift and NuSTAR data than in the XMM-Newton data. The APEC component of the XMM-Newton data is of similar flux density to the NuSTAR data, but energies in the XMM-Newton data above 1 keV do not match up with the NuSTAR data.
To test the possibility that the BORUS component was varying, we created fits where and the BORUS normalization varied between each observation. When these parameters were left free to vary, their values for the XMM-Newton MOS1 and MOS2 data were tied to the EPIC pn value, and their NuSTAR FPMB and FPMA values were tied together. The values for the Swift observations were left to freely vary independently. We set the cross-normalization constants all to 1. For the case of varying, C-stat/d.o.f. was 1886.20/1576. For the case of the BORUS normalization varying, C-stat/d.o.f. was 1828.16/1576. And for the case of both and the BORUS normalization varying, C-stat/d.o.f. was 1836.111/1573.
The best fit seemed to be the one where only the BORUS normalization varied. However, adding variability should not have made the fit worse than the fit with the normalization varying alone. We therefore freed . We then reset log() to be 25.5 for XMM-Newton and 23 for Swift and NuSTAR and refit. This led to a C-stat/d.o.f. = 1810.31/1573. However, the POWERLAW component was underestimating the XMM-Newton data. We therefore untied the POWERLAW spectral index from the BORUS spectral index. This allowed the scattered powerlaw to differ from the intrinsic powerlaw input to the BORUS model. This fit had a C-stat/d.o.f. of 1711.07/1572.
We next tied the values of and the BORUS normalization for the second Swift observation and NuSTAR together, since these observations were contemporaneous. Lastly we thawed the cross-normalization constants, setting limits of 0.5-2.0 on all of them. The final C-stat/d.o.f. was 1699.97/1569, the parameters of the final fit are in Table 10, and the fit is plotted over the data in Figure 20. The logarithms of the 2-10 keV luminosities (in units of ) measured from the model from each epoch are for September 2009, for March 2018, and for May 2018.
| Observation | APEC | BORUS | POWERLAW | ||||||
|---|---|---|---|---|---|---|---|---|---|
| Norm | log() | Norm | Norm | ||||||
| (keV) | |||||||||
| XMM-Newton | |||||||||
| 1st Swift | |||||||||
| 2nd Swift/NuSTAR | |||||||||
Note. — The instrumental normalization constant for XMM-Newton MOS2 was . The rest were pegged at the upper limit of 2. The BORUS and constraints were derived by freezing the BORUS log() and Normalization at their best fit values in all observations. The normalizations are in units of cts for APEC, cts for BORUS, and cts for POWERLAW.
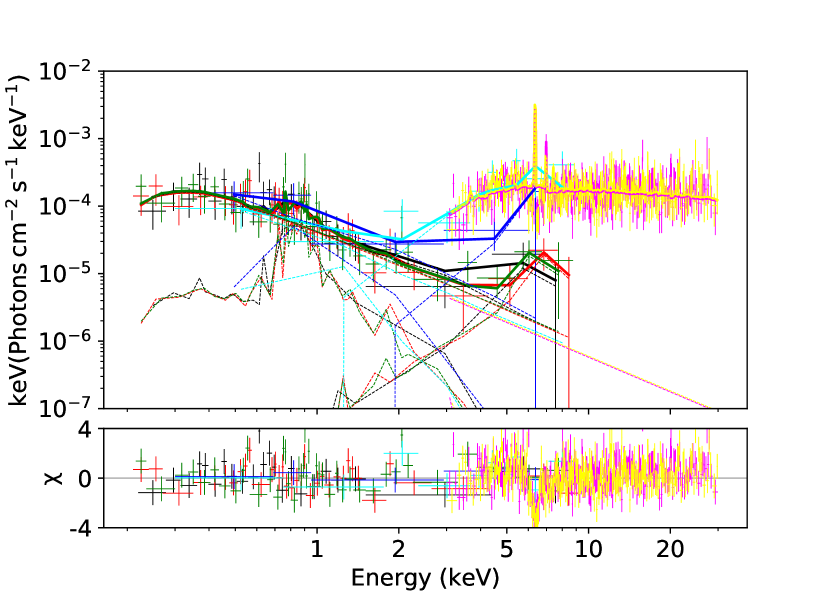
4 Discussion
In this section we discuss the implications of our results. § 4.1 discusses how the intrinsic luminosities of the AGN were derived. § 4.2 compares these luminosities to those expected from scaling relations. § 4.3 discusses the obscuration levels measured from the X-ray spectral fits. § 4.4 describes how Eddington ratios were computed and whether there are any correlations observed with Eddington ratio. Lastly § 4.5 explains in further detail special features observed in the individual galaxies.
| Object | Type | ) | Refs | |||||
|---|---|---|---|---|---|---|---|---|
| () | () | |||||||
| NGC 1386 | S1i | 7.24 | 40.16 | 1,2,6,10 | ||||
| NGC 3627 | S3 | 6.93 | - | 39.40 | 1,3,6,10 | |||
| NGC 3982 | S1.9 | 6.95 | 39.87 | 1,4,6,10 | ||||
| NGC 4501 | S2 | 7.30 | 39.86 | 1,3,6,10 | ||||
| IC 3639 | S1h | 7.01 | 42.0 | 0.146 | 1,4,7,10 | |||
| NGC 4922 | S2 | 42.3 | 1,8 | |||||
| NGC 5005 | S3baaBroad component detected in H, no others. | 8.27 | - | 39.03 | 1,4,6,10 | |||
| Mrk 463 | E: S1h | 42.62bbCombined for E and W components of Mrk 463, not corrected for intrinsic dust extinction. | 44.83 | 1,9,11 | ||||
| W: S2 | ||||||||
| NGC 6890ccfootnotemark: | S1.9 | 7.07 | 42.02 | 1,5,6,10 | ||||
| — 2009 Sep | ||||||||
| — 2018 Mar | ||||||||
| — 2018 May | 0.530 |
In temporal order: 2009 Sep = XMM-Newton observation; 2018 Mar = first Swift observation; 2018 May = second Swift observation + NuSTAR observation.
Note. — S1i indicates a Seyfert 2 with broad lines detected in the infrared, S1h indicates a Seyfert 2 with a hidden BLR detected in polarized light, S1.9 denotes a Seyfert with broad H but no broad H, and S3 indicates a LINER. is the intrinsic absorption-corrected X-ray luminosity. MIR luminosities are at 12 m. Bolometric luminosities were computed using from Table 1 of Duras et al. (2020). Error bars on luminosities are given if available. Ref is references for optical classification, , , and .
References. — (1) Véron-Cetty & Véron (2010), (2) Woo & Urry (2002), (3) Saglia et al. (2016), (4) van den Bosch (2016) & references therein, (5) Meléndez et al. (2010), (6) Brightman & Nandra (2011b) and references therein, (7) Boorman et al. (2016), (8) Luo et al. (2021) and references therein, (9)Heckman et al. (2005) and references therein, (10) Asmus et al. (2015), (11) Alonso-Herrero et al. (2016).
4.1 Intrinsic Luminosities
The 9 AGN in the sample have low observed XMM-Newton 2-10 keV luminosities. Recall this can mean one of two things: that the AGN is heavily obscured, or that the AGN is recently deactivated. Observations in the hard X-ray band from NuSTAR are essential for distinguishing between the two scenarios. With hard X-ray data, we can model the spectrum more accurately, and from that model we can estimate the true intrinsic 2-10 keV luminosity. In the case of an obscured AGN, we would expect to see additional flux at higher energies, where the photons have enough energy to penetrate the obscuring torus. This would lead to a modeled intrinsic X-ray luminosity that is higher than that originally derived from observed 2-10 keV fluxes. If an AGN has recently deactivated, we will not observe additional X-rays from the AGN at higher energies. This means the 2-10 keV band will capture most of the AGN’s X-rays, and so the intrinsic luminosity inferred from the model will be similar to that inferred with the 2-10 keV observed fluxes alone.
For most of the AGN in the sample, there was a jump by several orders of magnitude between the observed and intrinsic X-ray luminosities. This indicates that they are obscured AGN, as the hard X-ray data indicate their modeled spectra have to be more luminous in the 2-10 keV band than directly observed. For NGC 3627 and NGC 5005 however, the change in X-ray luminosity between observed and intrinsic was within an order of magnitude. This indicates that they are not as heavily obscured as the other AGN in the sample.
4.2 Scaling Relations
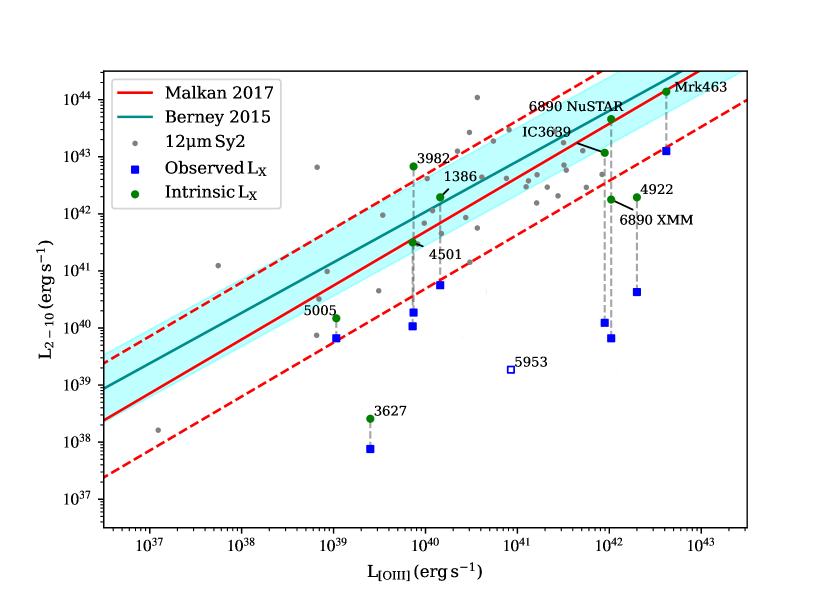
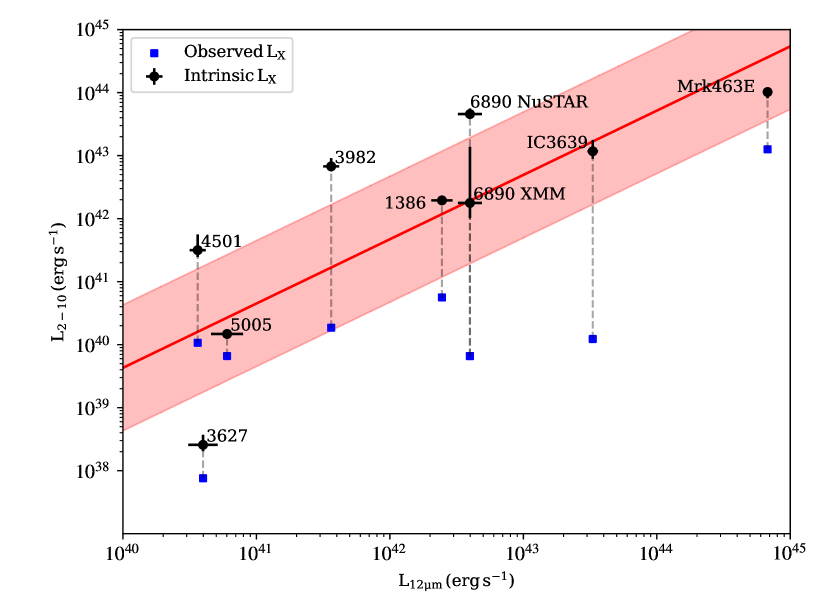
The hard X-ray continuum from an AGN is believed to originate from the corona, located very close to the central black hole ( 0.1pc Ichikawa & Tazaki, 2017), which translates to a light-crossing time of the corona of less than 3 months, and it is known from observations that the corona can vary in timescales of days (e.g., Wilkins et al., 2014; Keck et al., 2015; Ricci et al., 2020). In contrast, the MIR emission from the torus and the [O III] emission from the NLR originate from much further out could only vary much more slowly. Therefore, when an AGN deactivates, the corona will fade out well before the torus and NLR do, on timescales far shorter than theirs (i.e. days vs. decades and centuries). We therefore expect a recently deactivated AGN to have an intrinsic X-ray luminosity well below that which is expected based on its [O III] and MIR luminosities. If, in contrast, the AGN is merely heavily obscured, we would expect to find an intrinsic X-ray luminosity consistent with its [O III] and MIR luminosities.
In Figure 21 we plot the intrinsic 2-10 keV luminosities of our sample on 1. The red line is the mean vs relation for Seyfert 1 galaxies in the 12 sample, and the dashed red lines represent one dex above and below it. It is derived from the observed luminosities in Malkan et al. (2017). Most of the galaxies lie within 1 dex of the mean relation when the intrinsic 2-10 keV luminosity is considered. NGC 3982 does lie more than one dex above it. However, it is still placed within the scatter of the other Seyfert 2 galaxies in the 12 sample. NGC 4922 is more than 1 dex below the mean relation. But by far the furthest outlying galaxy is NGC 3627, located more than 2 dex below from the mean correlation. This makes it the strongest candidate for its corona having faded relative to the luminosity inferred from the NLR.
In Figure 22, we plot the observed and intrinsic 2-10 keV luminosities of our sample versus their luminosities. The luminosities are derived mostly from Asmus et al. (2015), which had the subarcsecond resolution necessary to resolve the nuclear MIR emission and separate it from the overall host galaxy emission. The exceptions to this are NGC 4922, for which no luminosities could be found in the literature, and Mrk 463, for which the luminosity was taken from Alonso-Herrero et al. (2016).
The red line is from Asmus et al. (2015) and represents their estimate of the vs correlation using their entire reliable sample. This relation has an intrinsic scatter of 0.33 dex, which is shown as the light red shaded region. With the original observed estimates of the 2-10 keV luminosity, all the AGN except for NGC 4501 are located more than 0.33 dex below the mean relation. With the absorption-corrected intrinsic 2-10 keV luminosity, NGC 3982, NGC 4501, and NGC 6890 lie more than 1 dex above it. For NGC 6890 this is clearly due to the increase in luminosity observed in the X-ray data. Because the torus is located further out than the corona, this could imply the corona has gotten brighter in recent years for the other two X-ray overluminous AGN as well, while the torus has yet to respond to the increase in luminosity.
Once again, NGC 3627 is the furthest below the mean relation, more than 1 dex below it. This can be taken to represent deactivation of the corona while the torus continues to be emitting. According to Ichikawa & Tazaki (2017) the torus fading timescale is dominated by the light crossing time. This leads to a fading timescale of around 10-100 years based on typical sizes of the torus. This would imply that NGC 3627 deactivated no more than 10-100 years ago, since this galaxy still preserves torus emission. Indeed, the conclusion of Esparza-Arredondo et al. (2020) was that NGC 3627 has faded on timescales of decades. However, NGC 3627’s emissions are distributed throughout the galaxy, so it is unclear how much of the nuclear contribution is from an AGN torus as opposed to star formation.
4.3 Obscuration
Of the galaxies in our sample, all but two have the X-ray spectra typical of obscured AGN, displaying the soft thermal emission from 0.5-2 keV, a hard reflection component and narrow Fe K line, and the Compton hump at keV (for examples, see NGC 1386 or IC 3639). The hydrogen column densities of the AGN are summarized in Table 4. We replicate the result that NGC 1386 and IC 3639 are Compton-thick. NGC 3982 is also Compton-thick. NGC 4501, NGC 4922, and both AGNs in Mrk 463 are obscured, but not quite at the Compton-thick level. NGC 6890 was nearly Compton-thick during the time of its XMM-Newton observations, but became definitively Compton-thin during later observations. This makes it a new X-ray changing-look AGN (e.g. Matt et al., 2003). NGC 3627 and NGC 5005 are unobscured.
It is noteworthy that our selection method (searching for AGN that are underluminous in soft X-rays relative to their [O III] luminosity), which is a common method of selecting Compton thick AGN candidates, resulted in a sample where only 33% of the objects were actually Compton thick at the time of their NuSTAR observations. Most (77%) of the AGN are indeed heavily obscured ().
4.4 Eddington Ratios
We computed the bolometric luminosities from the intrinsic 2-10 keV luminosities using the general expression for from Table 1 of Duras et al. (2020). We then converted these to Eddington ratios using the most recent black hole masses available in the literature.
We find that the obscured AGN are accreting at a higher rate (i.e. ) than the two AGN that do not show evidence of obscuration (NGC 3627 and NGC5005; ). Of note is that the most heavily obscured AGN, IC 3639, has an Eddington ratio of 0.146, more typical of quasars than Seyfert galaxies, and that NGC 6890’s Eddington ratio increased by an order of magnitude between its XMM-Newton and NuSTAR observations, for a final ratio of 0.530.
There is no clear correlation between Eddington ratio and the position of the AGN on the vs relation for the sample as a whole, as the high Eddington ratio AGN IC 3639 and NGC 6890 are near the mean relation (as are low Eddington ratio AGN NGC 1386, NGC 4501, and Mrk 463) while low Eddington ratio NGC 3982 lies more than 1 dex above it. The very lowest Eddington ratio AGN (NGC 3627 and NGC 5005) are located at two very different positions in the graph, with NGC 5005 being only 1 dex away from the mean relation, while NGC 3627 lies more than 2 dex away.
The same is true for the vs relation, as low Eddington ratio NGC 3982 and NGC 4501 lie more than 1 dex above the mean relation like high Eddington ratio NGC 6890. NGC 5005 is within the intrinsic scatter of the relation, but NGC 3627 is not.
4.5 Notes about Individual Galaxies
4.5.1 NGC 3627
The NuSTAR data for NGC 3627 were recently analyzed and concluded to show evidence of a Compton-thick nature for this AGN (Esparza-Arredondo et al., 2020). However, this is clearly not the case for our analysis of the data (§ 3.2), which shows no evidence for a reflection component, and thus no evidence for obscuration. This would seem to favor the fading AGN scenario for this galaxy, since it is well below the X-ray luminosity expected for its MIR luminosity. However, it is still possible that a stronger AGN could be hidden behind extremely high levels of obscuration (such that not even the hard X-rays are able to escape). This scenario can not be completely ruled out by NuSTAR; a more sensitive hard X-ray telescope could potentially do so. In the case of a strong, extremely obscured AGN, we would still expect strong MIR emission, as the dusty torus would still be heated. Given the AGN in NGC 3627 does not dominate above the MIR background of its host galaxy, it seems likely this AGN is intrinsically low-luminosity. If we accept the measured 2-10 keV luminosity of as the true intrinsic luminosity, NGC 3627’s luminosity is below the Eddington luminosity of a stellar black hole ( for a 10 black hole). It therefore might not even be a currently active AGN by some definitions, even though it does present as one on the BPT diagram.
Many correlations between AGN [O III] luminosity and NLR size have been published. Following the prescription of Ichikawa & Tazaki (2017), we use the correlation from Bae et al. (2017) which spatially separated AGN [O III] emission from larger, star formation driven [O III] emission based on integral-field unit spectroscopy of nearby type 1 and type 2 AGN. That prescription is:
| (2) |
where the NLR radius is in units of parsec and the luminosity is in units of . Plugging in the non-reddening corrected [O III] luminosity for NGC 3627, we get a NLR radius of 27.2 pc.
The overall size of the [OIII] emitting region can be estimated as well. We use the relation for Seyfert galaxies from Schmitt et al. (2003):
| (3) |
where the radius is in units of parsec and the luminosity is in units of and is intrinsic (i.e. reddening-corrected). Plugging in our reddening-corrected [O III] luminosity, this relation gives = 67.3 pc. The resulting timescale for fading based on light-crossing times implies that the central AGN in NGC 3627 deactivated no earlier than 87 - 220 years ago.
4.5.2 NGC 5005
Lacking a prominent hard X-ray reflection component, NGC 5005 does not present a typical obscured AGN X-ray spectrum (§ 3.7). This could indicate that the AGN is currently inactive, and we are only seeing softer X-ray emission from star formation. However, since its optical spectrum exhibits a broad H component, the simplest conclusion is that this AGN is actually unobscured. This is in contrast to many of its classifications in the literature, which refer to it as a Seyfert 2. It is hypothetically conceivable that the central black hole in this source has faded relative to the BLR, but the extreme rapidity of the timescale of which this would occur given the 10s-100s of light days size of the BLR makes this very unlikely.
As noted previously, NuSTAR data on NGC 5005 show a broad emission line centered on 5.91 keV, but this is not seen in the XMM-Newton and Chandra data. Based on our MC simulations, this line is a real feature. In being broad it resembles the relativistic iron lines that have been observed in other AGN (e.g., Brenneman & Reynolds, 2006; Risaliti et al., 2013; Walton et al., 2020), and the centroid energy lower than the rest-frame energy transition at 6.4 keV of the line suggests it is gravitationally redshifted, like some of the relativistically broadened lines observed in Seyfert galaxies (e.g., Nandra et al., 2007).
We fit the NuSTAR spectra of NGC 5005 with the relativistic reflection model RELXILL (version 1.4.3; García et al., 2014; Dauser et al., 2014, 2016). We first used all the default parameter values for the model except for the iron abundance and redshift, which we froze to solar and the redshift of the galaxy. The fit was better than both a BORUS+POWERLAW model fit just to the NuSTAR data, and the ZGAUSS*POWERLAW fit used in Section 3. However, the black hole spin parameter, , could not be well constrained, and the reflection fraction was too high to be physical (i.e. reflection fraction for spin ). The reflection fraction is defined as the ratio of the amount of observed radiation reflected off of the accretion disk to the amount of radiation directly transmitted to the observer from the corona. For a given spin value of the black hole there is a maximum possible value of this fraction (see Figure 3 in Dauser et al., 2014). We therefore fit the spectrum with the black hole spin fixed to a variety of values, and set the upper limit on the reflection fraction set to the upper limits from Dauser et al. (2014). The C-stat declined continuously as the spin increased, and the best fit was obtained with a near-maximum spin value (). Given the strength of the broad line in NGC 5005, a high spin is clearly favored, as this allows a higher reflection fraction (in this case, ). We have plotted that fit in Figure 23. The C-stat/d.o.f. for this fit was comparable to that of the ZGAUSS+POWERLAW fit, but not lower.
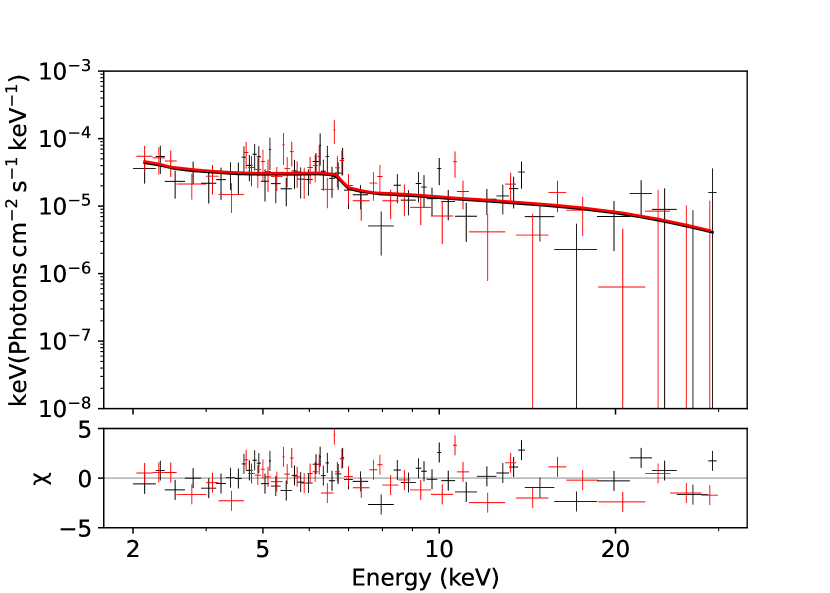
4.5.3 NGC 6890
NGC 6890 varied in both obscuration and luminosity between the time of its XMM-Newton and NuSTAR observations (§ 3.9). The observed change in luminosity makes NGC 6890 different from many other X-ray changing-look Seyfert galaxies, which have been traditionally interpreted as varying in obscuration alone (e.g. Risaliti et al., 2002), the most famous of which is NGC 1365, which shows rapid variability in absorption levels (Risaliti et al., 2002; Walton et al., 2014; Rivers et al., 2015). However, other types of changing-look AGN, such as changing-look quasars (which vary between optical classifications; e.g. Graham et al., 2020), are thought to indeed be due to physical changes in the accretion disk (e.g. Stern et al., 2018; Ross et al., 2018; Ai et al., 2020) and/or accretion rate (e.g. LaMassa et al., 2015; Runnoe et al., 2016; MacLeod et al., 2016; Gezari et al., 2017; Wang et al., 2018). NGC 6890’s increase in luminosity by an order of magnitude implies a change in the central engine. This might make it more similar to optical-changing look AGN than to NGC 1365, and/or lend credence to the hypothesis that a decrease in the magnitude of an X-ray reflection component could also be caused by AGN brightening in addition to reduced obscuration (Matt et al., 2003).
4.6 Implications for AGN Variability and Duty Cycle
Previous attempts to search for fading AGN have often relied on finding extended emission line regions, such as the Voorwerpen (e.g., Lintott et al., 2009; Keel et al., 2012a, b; Sartori et al., 2018) and green beans (e.g., Schirmer et al., 2013; Davies et al., 2015). These have probed fading timescales of years. Because our sample, which is a subset of the IRAS m Seyfert sample, identified AGN with strong MIR torus emission but apparently lacking coronal X-ray emission, we have probed much shorter fading timescales (decades and centuries). While our sample does include one Voorwerp in Mrk 463E, it is distinctly different from the green beans sample, probing a lower [O III] luminosity than that sample (i.e., for the green beans).
The Malkan et al. (2017) X-ray and [O III] data that was used as the initial starting point for our sample included 39 Seyfert 1 AGN and 47 Seyfert 2 AGN. We can presume the Seyfert 1 AGN are currently active, and of the 47 Seyfert 2 AGN, we found one candidate recently deactivated AGN. This is a rate of approximately 1%. That we were able to find one recently deactivated AGN in a sample of 86 AGN suggests that recently deactivated AGN may be more common than previously thought.
A majority of our sources are mergers in progress (Mrk 463, NGC 4922) or located close to other galaxies and thereby potentially interacting (NGC 1386, NGC 3627, IC 3639). These results together could be understood in a context of merger/interaction-induced AGN activity (e.g., Hopkins et al., 2008).
The timescale of NGC 3627’s fading is shorter than the year viscous timescale for AGN but it is also longer than the 10 year thermal timescales used to explain changing-look AGN (Stern et al., 2018). This could imply that AGN can vary on timescales intermediate between these two timescales, but it could also simply be we are observing the beginning of a viscous-timescale-related fading.
5 Conclusions
In this paper, we presented NuSTAR observations of 9 AGN underluminous in the 2-10 keV X-rays from the 12 galaxy sample. We combined these NuSTAR data with Chandra, Swift, and XMM-Newton data as necessary to perform broad-band X-ray spectral fitting and determine whether these AGN were truly intrinsically underluminous and potentially deactivated, or simply heavily obscured. We find that all but NGC 5005 and NGC 3627 are obscured AGN, whereas NGC 5005 and NGC 3627 are intrinsically low luminosity. Of the two low-luminosity AGN, NGC 3627 appears to not be active. Since this galaxy preserves NLR [O III] emission and nuclear MIR emission, we conclude that it is a candidate recently deactivated AGN, having turned off no more than 87-220 years ago.
The scientific results reported in this article are based on data obtained from the Chandra Data Archive. This work is based on on observations obtained with XMM-Newton, an ESA science mission with instruments and contributions directly funded by ESA Member States and NASA. We acknowledge the use of public data from the Swift data archive. This research has made use of data and/or software provided by the High Energy Astrophysics Science Archive Research Center (HEASARC), which is a service of the Astrophysics Science Division at NASA/GSFC and the High Energy Astrophysics Division of the Smithsonian Astrophysical Observatory. This work has made use of data obtained from the NuSTAR mission, a project led by Caltech, funded by NASA and managed by NASA/JPL. MLS wants to thank Lisbeth D. Jensen for her help in digging through the data used in Malkan et al. (2017), and Donaji Esparza-Arredondo for showing her the fitting results for NGC 3627 from Esparza-Arredondo et al. (2020). J.A.G. acknowledges support from NASA grant 80NSSC21K1567 and from the Alexander von Humboldt Foundation.
We present the spectrum of the ultraluminous X-ray source M66 X-1, the first reported spectrum for this source that uses NuSTAR data. The spectrum was best fit by a TBABS*CUTOFFPL model. The C-stat/d.o.f. was 885.78/912. The spectrum is plotted with the unfolded model in Figure 24. The parameters of the best fit model are given in Table 12.
Appendix A M66 X-1 Spectrum
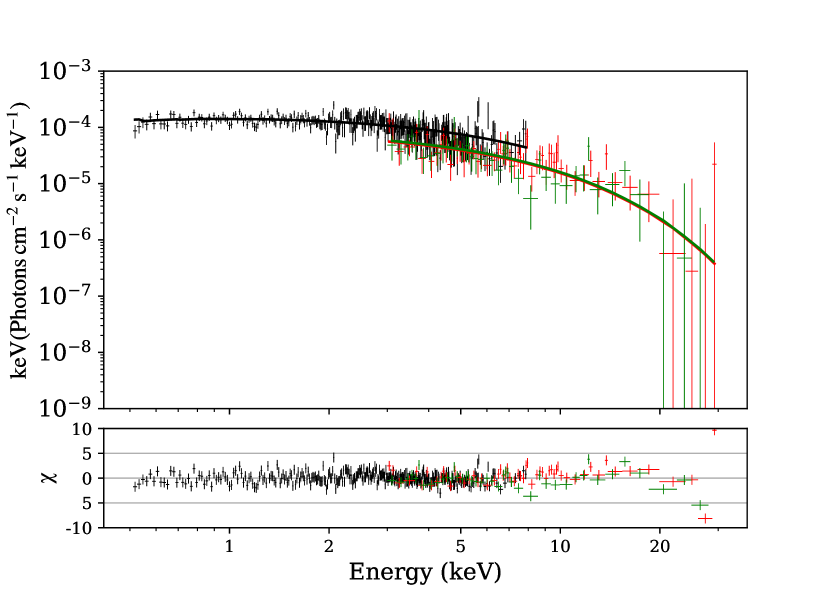
| CUTOFFPL | ||
|---|---|---|
| Cutoff | Norm | |
| (keV) | ( cts ) | |
Note. — The Chandra normalization constant value was .
References
- Ai et al. (2020) Ai, Y., Dou, L., Yang, C., et al. 2020, ApJ, 890, L29, doi: 10.3847/2041-8213/ab7306
- Akylas & Georgantopoulos (2009) Akylas, A., & Georgantopoulos, I. 2009, A&A, 500, 999, doi: 10.1051/0004-6361/200811371
- Alexander et al. (2003) Alexander, D. M., Bauer, F. E., Brandt, W. N., et al. 2003, AJ, 126, 539, doi: 10.1086/376473
- Alonso-Herrero et al. (1999) Alonso-Herrero, A., Ward, M. J., Aragon-Salamanca, A., & Zamorano, J. 1999, MNRAS, 302, 561, doi: 10.1046/j.1365-8711.1999.02171.x
- Alonso-Herrero et al. (2016) Alonso-Herrero, A., Poulton, R., Roche, P. F., et al. 2016, MNRAS, 463, 2405, doi: 10.1093/mnras/stw2031
- Annuar et al. (2015) Annuar, A., Gandhi, P., Alexander, D. M., et al. 2015, ApJ, 815, 36, doi: 10.1088/0004-637X/815/1/36
- Arnaud (1996) Arnaud, K. A. 1996, in Astronomical Society of the Pacific Conference Series, Vol. 101, Astronomical Data Analysis Software and Systems V, ed. G. H. Jacoby & J. Barnes, 17
- Asmus et al. (2015) Asmus, D., Gandhi, P., Hönig, S. F., Smette, A., & Duschl, W. J. 2015, MNRAS, 454, 766, doi: 10.1093/mnras/stv1950
- Asmus et al. (2016) Asmus, D., Hönig, S. F., & Gandhi, P. 2016, ApJ, 822, 109, doi: 10.3847/0004-637X/822/2/109
- Asmus et al. (2014) Asmus, D., Hönig, S. F., Gandhi, P., Smette, A., & Duschl, W. J. 2014, MNRAS, 439, 1648, doi: 10.1093/mnras/stu041
- Audibert et al. (2017) Audibert, A., Riffel, R., Sales, D. A., Pastoriza, M. G., & Ruschel-Dutra, D. 2017, MNRAS, 464, 2139, doi: 10.1093/mnras/stw2477
- Babyk et al. (2018) Babyk, I. V., McNamara, B. R., Nulsen, P. E. J., et al. 2018, ApJ, 857, 32, doi: 10.3847/1538-4357/aab3c9
- Bae et al. (2017) Bae, H.-J., Woo, J.-H., Karouzos, M., et al. 2017, ApJ, 837, 91, doi: 10.3847/1538-4357/aa5f5c
- Baldwin et al. (1981) Baldwin, J. A., Phillips, M. M., & Terlevich, R. 1981, PASP, 93, 5, doi: 10.1086/130766
- Balmaverde & Capetti (2014) Balmaverde, B., & Capetti, A. 2014, A&A, 563, A119, doi: 10.1051/0004-6361/201321989
- Baloković et al. (2018) Baloković, M., Brightman, M., Harrison, F. A., et al. 2018, ApJ, 854, 42, doi: 10.3847/1538-4357/aaa7eb
- Barnes & Webster (2001) Barnes, D. G., & Webster, R. L. 2001, MNRAS, 324, 859, doi: 10.1046/j.1365-8711.2001.04273.x
- Bennert et al. (2002) Bennert, N., Falcke, H., Schulz, H., Wilson, A. S., & Wills, B. J. 2002, ApJ, 574, L105, doi: 10.1086/342420
- Bennert et al. (2006) Bennert, N., Jungwiert, B., Komossa, S., Haas, M., & Chini, R. 2006, A&A, 456, 953, doi: 10.1051/0004-6361:20065319
- Berney et al. (2015) Berney, S., Koss, M., Trakhtenbrot, B., et al. 2015, MNRAS, 454, 3622, doi: 10.1093/mnras/stv2181
- Bianchi et al. (2008a) Bianchi, S., Chiaberge, M., Piconcelli, E., Guainazzi, M., & Matt, G. 2008a, MNRAS, 386, 105, doi: 10.1111/j.1365-2966.2008.13078.x
- Bianchi et al. (2008b) Bianchi, S., Corral, A., Panessa, F., et al. 2008b, MNRAS, 385, 195, doi: 10.1111/j.1365-2966.2007.12625.x
- Bianchi et al. (2006) Bianchi, S., Guainazzi, M., & Chiaberge, M. 2006, A&A, 448, 499, doi: 10.1051/0004-6361:20054091
- Bonatto & Pastoriza (1997) Bonatto, C. J., & Pastoriza, M. G. 1997, ApJ, 486, 132, doi: 10.1086/304511
- Boorman et al. (2016) Boorman, P. G., Gandhi, P., Alexander, D. M., et al. 2016, ApJ, 833, 245, doi: 10.3847/1538-4357/833/2/245
- Braatz et al. (1997) Braatz, J., Greenhill, L., Moran, J., Wilson, A., & Herrnstein, J. 1997, in American Astronomical Society Meeting Abstracts, Vol. 191, American Astronomical Society Meeting Abstracts, 104.02
- Braatz et al. (2004) Braatz, J. A., Henkel, C., Greenhill, L. J., Moran, J. M., & Wilson, A. S. 2004, ApJ, 617, L29, doi: 10.1086/427185
- Brenneman & Reynolds (2006) Brenneman, L. W., & Reynolds, C. S. 2006, ApJ, 652, 1028, doi: 10.1086/508146
- Brightman & Nandra (2008) Brightman, M., & Nandra, K. 2008, MNRAS, 390, 1241, doi: 10.1111/j.1365-2966.2008.13841.x
- Brightman & Nandra (2011a) —. 2011a, MNRAS, 413, 1206, doi: 10.1111/j.1365-2966.2011.18207.x
- Brightman & Nandra (2011b) —. 2011b, MNRAS, 414, 3084, doi: 10.1111/j.1365-2966.2011.18612.x
- Brightman et al. (2015) Brightman, M., Baloković, M., Stern, D., et al. 2015, ApJ, 805, 41, doi: 10.1088/0004-637X/805/1/41
- Brum et al. (2017) Brum, C., Riffel, R. A., Storchi-Bergmann, T., et al. 2017, MNRAS, 469, 3405, doi: 10.1093/mnras/stx964
- Buchanan et al. (2006) Buchanan, C. L., Gallimore, J. F., O’Dea, C. P., et al. 2006, AJ, 132, 401, doi: 10.1086/505022
- Burlon et al. (2011) Burlon, D., Ajello, M., Greiner, J., et al. 2011, ApJ, 728, 58, doi: 10.1088/0004-637X/728/1/58
- Burtscher et al. (2013) Burtscher, L., Meisenheimer, K., Tristram, K. R. W., et al. 2013, A&A, 558, A149, doi: 10.1051/0004-6361/201321890
- Cappi et al. (2006) Cappi, M., Panessa, F., Bassani, L., et al. 2006, A&A, 446, 459, doi: 10.1051/0004-6361:20053893
- Cardamone et al. (2007) Cardamone, C. N., Moran, E. C., & Kay, L. E. 2007, AJ, 134, 1263, doi: 10.1086/520801
- Carrillo et al. (1999) Carrillo, R., Masegosa, J., Dultzin-Hacyan, D., & Ordoñez, R. 1999, Rev. Mexicana Astron. Astrofis., 35, 187
- Cazzoli et al. (2018) Cazzoli, S., Márquez, I., Masegosa, J., et al. 2018, MNRAS, 480, 1106, doi: 10.1093/mnras/sty1811
- Chatzichristou & Vanderriest (1995) Chatzichristou, E. T., & Vanderriest, C. 1995, A&A, 298, 343
- Cisternas et al. (2013) Cisternas, M., Gadotti, D. A., Knapen, J. H., et al. 2013, ApJ, 776, 50, doi: 10.1088/0004-637X/776/1/50
- Constantin et al. (2015) Constantin, A., Shields, J. C., Ho, L. C., et al. 2015, ApJ, 814, 149, doi: 10.1088/0004-637X/814/2/149
- Dahari & De Robertis (1988) Dahari, O., & De Robertis, M. M. 1988, ApJS, 67, 249, doi: 10.1086/191273
- Dahlem et al. (1998) Dahlem, M., Weaver, K. A., & Heckman, T. M. 1998, ApJS, 118, 401, doi: 10.1086/313137
- Dauser et al. (2014) Dauser, T., Garcia, J., Parker, M. L., Fabian, A. C., & Wilms, J. 2014, MNRAS, 444, L100, doi: 10.1093/mnrasl/slu125
- Dauser et al. (2016) Dauser, T., García, J., Walton, D. J., et al. 2016, A&A, 590, A76, doi: 10.1051/0004-6361/201628135
- Davies et al. (2015) Davies, R. L., Schirmer, M., & Turner, J. E. H. 2015, MNRAS, 449, 1731, doi: 10.1093/mnras/stv343
- Deo et al. (2009) Deo, R. P., Richards, G. T., Crenshaw, D. M., & Kraemer, S. B. 2009, ApJ, 705, 14, doi: 10.1088/0004-637X/705/1/14
- Díaz-Santos et al. (2010) Díaz-Santos, T., Charmandaris, V., Armus, L., et al. 2010, ApJ, 723, 993, doi: 10.1088/0004-637X/723/2/993
- Dudik et al. (2005) Dudik, R. P., Satyapal, S., Gliozzi, M., & Sambruna, R. M. 2005, ApJ, 620, 113, doi: 10.1086/426856
- Duras et al. (2020) Duras, F., Bongiorno, A., Ricci, F., et al. 2020, A&A, 636, A73, doi: 10.1051/0004-6361/201936817
- Esparza-Arredondo et al. (2020) Esparza-Arredondo, D., Osorio-Clavijo, N., González-Martín, O., et al. 2020, ApJ, 905, 29, doi: 10.3847/1538-4357/abc425
- Fabian (2012) Fabian, A. C. 2012, ARA&A, 50, 455, doi: 10.1146/annurev-astro-081811-125521
- Ferguson (1989) Ferguson, H. C. 1989, AJ, 98, 367, doi: 10.1086/115152
- Fernández-Ontiveros et al. (2018) Fernández-Ontiveros, J. A., Tristram, K. R. W., Hönig, S., Gandhi, P., & Weigelt, G. 2018, A&A, 611, A46, doi: 10.1051/0004-6361/201731906
- Ferruit et al. (2000) Ferruit, P., Wilson, A. S., & Mulchaey, J. 2000, ApJS, 128, 139, doi: 10.1086/313379
- Filippenko & Sargent (1985) Filippenko, A. V., & Sargent, W. L. W. 1985, ApJS, 57, 503, doi: 10.1086/191012
- Fruscione et al. (2006) Fruscione, A., McDowell, J. C., Allen, G. E., et al. 2006, in Society of Photo-Optical Instrumentation Engineers (SPIE) Conference Series, Vol. 6270, Society of Photo-Optical Instrumentation Engineers (SPIE) Conference Series, ed. D. R. Silva & R. E. Doxsey, 62701V, doi: 10.1117/12.671760
- Gabriel et al. (2004) Gabriel, C., Denby, M., Fyfe, D. J., et al. 2004, in Astronomical Society of the Pacific Conference Series, Vol. 314, Astronomical Data Analysis Software and Systems (ADASS) XIII, ed. F. Ochsenbein, M. G. Allen, & D. Egret, 759
- Gallimore et al. (2016) Gallimore, J. F., Elitzur, M., Maiolino, R., et al. 2016, ApJ, 829, L7, doi: 10.3847/2041-8205/829/1/L7
- Gallo et al. (2006) Gallo, L. C., Lehmann, I., Pietsch, W., et al. 2006, MNRAS, 365, 688, doi: 10.1111/j.1365-2966.2005.09755.x
- García et al. (2014) García, J., Dauser, T., Lohfink, A., et al. 2014, ApJ, 782, 76, doi: 10.1088/0004-637X/782/2/76
- García-Burillo et al. (2016) García-Burillo, S., Combes, F., Ramos Almeida, C., et al. 2016, ApJ, 823, L12, doi: 10.3847/2041-8205/823/1/L12
- Gezari et al. (2017) Gezari, S., Hung, T., Cenko, S. B., et al. 2017, ApJ, 835, 144, doi: 10.3847/1538-4357/835/2/144
- Ghosh et al. (2007) Ghosh, H., Pogge, R. W., Mathur, S., Martini, P., & Shields, J. C. 2007, ApJ, 656, 105, doi: 10.1086/510421
- Gómez-Guijarro et al. (2017) Gómez-Guijarro, C., González-Martín, O., Ramos Almeida, C., Rodríguez-Espinosa, J. M., & Gallego, J. 2017, MNRAS, 469, 2720, doi: 10.1093/mnras/stx1037
- González Delgado et al. (1998) González Delgado, R. M., Heckman, T., Leitherer, C., et al. 1998, ApJ, 505, 174, doi: 10.1086/306154
- González-Martín et al. (2009a) González-Martín, O., Masegosa, J., Márquez, I., & Guainazzi, M. 2009a, ApJ, 704, 1570, doi: 10.1088/0004-637X/704/2/1570
- González-Martín et al. (2009b) González-Martín, O., Masegosa, J., Márquez, I., Guainazzi, M., & Jiménez-Bailón, E. 2009b, A&A, 506, 1107, doi: 10.1051/0004-6361/200912288
- Graham et al. (2020) Graham, M. J., Ross, N. P., Stern, D., et al. 2020, MNRAS, 491, 4925, doi: 10.1093/mnras/stz3244
- Grier et al. (2011) Grier, C. J., Mathur, S., Ghosh, H., & Ferrarese, L. 2011, ApJ, 731, 60, doi: 10.1088/0004-637X/731/1/60
- Guainazzi et al. (2005a) Guainazzi, M., Fabian, A. C., Iwasawa, K., Matt, G., & Fiore, F. 2005a, MNRAS, 356, 295, doi: 10.1111/j.1365-2966.2004.08448.x
- Guainazzi et al. (2005b) Guainazzi, M., Matt, G., & Perola, G. C. 2005b, A&A, 444, 119, doi: 10.1051/0004-6361:20053643
- Gupta et al. (2021) Gupta, K. K., Ricci, C., Tortosa, A., et al. 2021, MNRAS, 504, 428, doi: 10.1093/mnras/stab839
- Harrison et al. (2013) Harrison, F. A., Craig, W. W., Christensen, F. E., et al. 2013, ApJ, 770, 103, doi: 10.1088/0004-637X/770/2/103
- Heckman et al. (2005) Heckman, T. M., Ptak, A., Hornschemeier, A., & Kauffmann, G. 2005, ApJ, 634, 161, doi: 10.1086/491665
- Heisler et al. (1997) Heisler, C. A., Lumsden, S. L., & Bailey, J. A. 1997, Nature, 385, 700, doi: 10.1038/385700a0
- Hernán-Caballero & Hatziminaoglou (2011) Hernán-Caballero, A., & Hatziminaoglou, E. 2011, MNRAS, 414, 500, doi: 10.1111/j.1365-2966.2011.18413.x
- Hernández-García et al. (2013) Hernández-García, L., González-Martín, O., Márquez, I., & Masegosa, J. 2013, A&A, 556, A47, doi: 10.1051/0004-6361/201321563
- HI4PI Collaboration et al. (2016) HI4PI Collaboration, Ben Bekhti, N., Flöer, L., et al. 2016, A&A, 594, A116, doi: 10.1051/0004-6361/201629178
- Ho et al. (1997) Ho, L. C., Filippenko, A. V., & Sargent, W. L. W. 1997, ApJS, 112, 315, doi: 10.1086/313041
- Ho et al. (2001) Ho, L. C., Feigelson, E. D., Townsley, L. K., et al. 2001, ApJ, 549, L51, doi: 10.1086/319138
- Hopkins et al. (2008) Hopkins, P. F., Hernquist, L., Cox, T. J., & Kereš, D. 2008, ApJS, 175, 356, doi: 10.1086/524362
- Huchra & Burg (1992) Huchra, J., & Burg, R. 1992, ApJ, 393, 90, doi: 10.1086/171488
- Hughes et al. (1991) Hughes, D. H., Appleton, P. N., & Schombert, J. M. 1991, ApJ, 370, 176, doi: 10.1086/169802
- Hutchings & Neff (1989) Hutchings, J. B., & Neff, S. G. 1989, AJ, 97, 1306, doi: 10.1086/115073
- Ichikawa & Tazaki (2017) Ichikawa, K., & Tazaki, R. 2017, ApJ, 844, 21, doi: 10.3847/1538-4357/aa7891
- Ichikawa et al. (2019) Ichikawa, K., Ueda, J., Bae, H.-J., et al. 2019, ApJ, 870, 65, doi: 10.3847/1538-4357/aaf233
- Imanishi et al. (2016) Imanishi, M., Nakanishi, K., & Izumi, T. 2016, ApJ, 822, L10, doi: 10.3847/2041-8205/822/1/L10
- Imanishi & Terashima (2004) Imanishi, M., & Terashima, Y. 2004, AJ, 127, 758, doi: 10.1086/381069
- Isbell et al. (2021) Isbell, J. W., Burtscher, L., Asmus, D., et al. 2021, ApJ, 910, 104, doi: 10.3847/1538-4357/abdfd3
- Jones et al. (2021) Jones, M. L., Parker, K., Fabbiano, G., et al. 2021, ApJ, 910, 19, doi: 10.3847/1538-4357/abe128
- Kammoun et al. (2020) Kammoun, E. S., Miller, J. M., Koss, M., et al. 2020, ApJ, 901, 161, doi: 10.3847/1538-4357/abb29f
- Kaspi et al. (2005) Kaspi, S., Maoz, D., Netzer, H., et al. 2005, ApJ, 629, 61, doi: 10.1086/431275
- Kaspi et al. (2000) Kaspi, S., Smith, P. S., Netzer, H., et al. 2000, ApJ, 533, 631, doi: 10.1086/308704
- Keck et al. (2015) Keck, M. L., Brenneman, L. W., Ballantyne, D. R., et al. 2015, ApJ, 806, 149, doi: 10.1088/0004-637X/806/2/149
- Keel et al. (2012a) Keel, W. C., Lintott, C. J., Schawinski, K., et al. 2012a, AJ, 144, 66, doi: 10.1088/0004-6256/144/2/66
- Keel et al. (2012b) Keel, W. C., Chojnowski, S. D., Bennert, V. N., et al. 2012b, MNRAS, 420, 878, doi: 10.1111/j.1365-2966.2011.20101.x
- Kormendy & Ho (2013) Kormendy, J., & Ho, L. C. 2013, ARA&A, 51, 511, doi: 10.1146/annurev-astro-082708-101811
- Koss et al. (2013) Koss, M., Mushotzky, R., Baumgartner, W., et al. 2013, ApJ, 765, L26, doi: 10.1088/2041-8205/765/2/L26
- Koss et al. (2017) Koss, M., Trakhtenbrot, B., Ricci, C., et al. 2017, ApJ, 850, 74, doi: 10.3847/1538-4357/aa8ec9
- Koss et al. (2016) Koss, M. J., Assef, R., Baloković, M., et al. 2016, ApJ, 825, 85, doi: 10.3847/0004-637X/825/2/85
- Kraan-Korteweg (1982) Kraan-Korteweg, R. C. 1982, A&AS, 47, 505
- LaMassa et al. (2012) LaMassa, S. M., Heckman, T. M., & Ptak, A. 2012, ApJ, 758, 82, doi: 10.1088/0004-637X/758/2/82
- LaMassa et al. (2010) LaMassa, S. M., Heckman, T. M., Ptak, A., et al. 2010, ApJ, 720, 786, doi: 10.1088/0004-637X/720/1/786
- LaMassa et al. (2011) —. 2011, ApJ, 729, 52, doi: 10.1088/0004-637X/729/1/52
- LaMassa et al. (2015) LaMassa, S. M., Cales, S., Moran, E. C., et al. 2015, ApJ, 800, 144, doi: 10.1088/0004-637X/800/2/144
- Lehnert & Heckman (1996) Lehnert, M. D., & Heckman, T. M. 1996, ApJ, 472, 546, doi: 10.1086/178086
- Lena et al. (2015) Lena, D., Robinson, A., Storchi-Bergman, T., et al. 2015, ApJ, 806, 84, doi: 10.1088/0004-637X/806/1/84
- Lintott et al. (2009) Lintott, C. J., Schawinski, K., Keel, W., et al. 2009, MNRAS, 399, 129, doi: 10.1111/j.1365-2966.2009.15299.x
- Lira et al. (2013) Lira, P., Videla, L., Wu, Y., et al. 2013, ApJ, 764, 159, doi: 10.1088/0004-637X/764/2/159
- Lumsden et al. (2001) Lumsden, S. L., Heisler, C. A., Bailey, J. A., Hough, J. H., & Young, S. 2001, MNRAS, 327, 459, doi: 10.1046/j.1365-8711.2001.04741.x
- Luo et al. (2021) Luo, R., Woo, J.-H., Karouzos, M., et al. 2021, ApJ, 908, 221, doi: 10.3847/1538-4357/abd5ac
- MacLeod et al. (2016) MacLeod, C. L., Ross, N. P., Lawrence, A., et al. 2016, MNRAS, 457, 389, doi: 10.1093/mnras/stv2997
- Madsen et al. (2015) Madsen, K. K., Harrison, F. A., Markwardt, C. B., et al. 2015, ApJS, 220, 8, doi: 10.1088/0067-0049/220/1/8
- Malkan et al. (2017) Malkan, M. A., Jensen, L. D., Rodriguez, D. R., Spinoglio, L., & Rush, B. 2017, ApJ, 846, 102, doi: 10.3847/1538-4357/aa8302
- Marconi et al. (2004) Marconi, A., Risaliti, G., Gilli, R., et al. 2004, MNRAS, 351, 169, doi: 10.1111/j.1365-2966.2004.07765.x
- Martini & Weinberg (2001) Martini, P., & Weinberg, D. H. 2001, ApJ, 547, 12, doi: 10.1086/318331
- Masini et al. (2016) Masini, A., Comastri, A., Baloković, M., et al. 2016, A&A, 589, A59, doi: 10.1051/0004-6361/201527689
- Matt et al. (2003) Matt, G., Guainazzi, M., & Maiolino, R. 2003, MNRAS, 342, 422, doi: 10.1046/j.1365-8711.2003.06539.x
- Mazzarella et al. (1991) Mazzarella, J. M., Gaume, R. A., Soifer, B. T., et al. 1991, AJ, 102, 1241, doi: 10.1086/115950
- Meléndez et al. (2010) Meléndez, M., Kraemer, S. B., & Schmitt, H. R. 2010, MNRAS, 406, 493, doi: 10.1111/j.1365-2966.2010.16679.x
- Moran et al. (2001) Moran, E. C., Kay, L. E., Davis, M., Filippenko, A. V., & Barth, A. J. 2001, ApJ, 556, L75, doi: 10.1086/322991
- Mulchaey et al. (1994) Mulchaey, J. S., Koratkar, A., Ward, M. J., et al. 1994, ApJ, 436, 586, doi: 10.1086/174933
- Müller-Sánchez et al. (2011) Müller-Sánchez, F., Prieto, M. A., Hicks, E. K. S., et al. 2011, ApJ, 739, 69, doi: 10.1088/0004-637X/739/2/69
- Murphy & Yaqoob (2009) Murphy, K. D., & Yaqoob, T. 2009, MNRAS, 397, 1549, doi: 10.1111/j.1365-2966.2009.15025.x
- Nandra et al. (2007) Nandra, K., O’Neill, P. M., George, I. M., & Reeves, J. N. 2007, MNRAS, 382, 194, doi: 10.1111/j.1365-2966.2007.12331.x
- Nasa High Energy Astrophysics Science Archive Research Center (2014) (Heasarc) Nasa High Energy Astrophysics Science Archive Research Center (Heasarc). 2014, HEAsoft: Unified Release of FTOOLS and XANADU, Astrophysics Source Code Library, record ascl:1408.004. http://ascl.net/1408.004
- Nehlig et al. (2016) Nehlig, F., Vollmer, B., & Braine, J. 2016, A&A, 587, A108, doi: 10.1051/0004-6361/201527021
- Netzer & Laor (1993) Netzer, H., & Laor, A. 1993, ApJ, 404, L51, doi: 10.1086/186741
- Neugebauer et al. (1984) Neugebauer, G., Habing, H. J., van Duinen, R., et al. 1984, ApJ, 278, L1, doi: 10.1086/184209
- Packham et al. (2005) Packham, C., Radomski, J. T., Roche, P. F., et al. 2005, ApJ, 618, L17, doi: 10.1086/427691
- Panessa et al. (2006) Panessa, F., Bassani, L., Cappi, M., et al. 2006, A&A, 455, 173, doi: 10.1051/0004-6361:20064894
- Panessa et al. (2008) Panessa, F., Bassani, L., de Rosa, A., et al. 2008, A&A, 483, 151, doi: 10.1051/0004-6361:20078657
- Pfeifle et al. (2019) Pfeifle, R. W., Satyapal, S., Secrest, N. J., et al. 2019, ApJ, 875, 117, doi: 10.3847/1538-4357/ab07bc
- Phillips & Frogel (1980) Phillips, M. M., & Frogel, J. A. 1980, ApJ, 235, 761, doi: 10.1086/157679
- Pogge et al. (2000) Pogge, R. W., Maoz, D., Ho, L. C., & Eracleous, M. 2000, ApJ, 532, 323, doi: 10.1086/308567
- Pott et al. (2010) Pott, J.-U., Malkan, M. A., Elitzur, M., et al. 2010, ApJ, 715, 736, doi: 10.1088/0004-637X/715/2/736
- Radomski et al. (2008) Radomski, J. T., Packham, C., Levenson, N. A., et al. 2008, ApJ, 681, 141, doi: 10.1086/587771
- Ramos Almeida & Ricci (2017) Ramos Almeida, C., & Ricci, C. 2017, Nature Astronomy, 1, 679, doi: 10.1038/s41550-017-0232-z
- Repetto et al. (2017) Repetto, P., Faúndez-Abans, M., Freitas-Lemes, P., Rodrigues, I., & de Oliveira-Abans, M. 2017, MNRAS, 464, 293, doi: 10.1093/mnras/stw2275
- Reuter et al. (1996) Reuter, H. P., Sievers, A. W., Pohl, M., Lesch, H., & Wielebinski, R. 1996, A&A, 306, 721
- Ricci et al. (2015) Ricci, C., Ueda, Y., Koss, M. J., et al. 2015, ApJ, 815, L13, doi: 10.1088/2041-8205/815/1/L13
- Ricci et al. (2016) Ricci, C., Bauer, F. E., Treister, E., et al. 2016, ApJ, 819, 4, doi: 10.3847/0004-637X/819/1/4
- Ricci et al. (2017) —. 2017, MNRAS, 468, 1273, doi: 10.1093/mnras/stx173
- Ricci et al. (2020) Ricci, C., Kara, E., Loewenstein, M., et al. 2020, ApJ, 898, L1, doi: 10.3847/2041-8213/ab91a1
- Risaliti et al. (2002) Risaliti, G., Elvis, M., & Nicastro, F. 2002, ApJ, 571, 234, doi: 10.1086/324146
- Risaliti et al. (1999a) Risaliti, G., Maiolino, R., & Salvati, M. 1999a, ApJ, 522, 157, doi: 10.1086/307623
- Risaliti et al. (1999b) Risaliti, G., Bassani, L., Comastri, A., et al. 1999b, Mem. Soc. Astron. Italiana, 70, 73
- Risaliti et al. (2013) Risaliti, G., Harrison, F. A., Madsen, K. K., et al. 2013, Nature, 494, 449, doi: 10.1038/nature11938
- Rivers et al. (2015) Rivers, E., Risaliti, G., Walton, D. J., et al. 2015, ApJ, 804, 107, doi: 10.1088/0004-637X/804/2/107
- Roberts et al. (2001) Roberts, T. P., Schurch, N. J., & Warwick, R. S. 2001, MNRAS, 324, 737, doi: 10.1046/j.1365-8711.2001.04365.x
- Rodríguez-Ardila et al. (2017) Rodríguez-Ardila, A., Prieto, M. A., Mazzalay, X., et al. 2017, MNRAS, 470, 2845, doi: 10.1093/mnras/stx1401
- Ross et al. (2018) Ross, N. P., Ford, K. E. S., Graham, M., et al. 2018, MNRAS, 480, 4468, doi: 10.1093/mnras/sty2002
- Ruan et al. (2016) Ruan, J. J., Anderson, S. F., Cales, S. L., et al. 2016, ApJ, 826, 188, doi: 10.3847/0004-637X/826/2/188
- Runnoe et al. (2016) Runnoe, J. C., Cales, S., Ruan, J. J., et al. 2016, MNRAS, 455, 1691, doi: 10.1093/mnras/stv2385
- Ruschel-Dutra et al. (2014) Ruschel-Dutra, D., Pastoriza, M., Riffel, R., Sales, D. A., & Winge, C. 2014, MNRAS, 438, 3434, doi: 10.1093/mnras/stt2448
- Rush et al. (1996) Rush, B., Malkan, M. A., Fink, H. H., & Voges, W. 1996, ApJ, 471, 190, doi: 10.1086/177962
- Rush et al. (1993) Rush, B., Malkan, M. A., & Spinoglio, L. 1993, ApJS, 89, 1, doi: 10.1086/191837
- Saglia et al. (2016) Saglia, R. P., Opitsch, M., Erwin, P., et al. 2016, ApJ, 818, 47, doi: 10.3847/0004-637X/818/1/47
- Sanders et al. (1988) Sanders, D. B., Soifer, B. T., Elias, J. H., Neugebauer, G., & Matthews, K. 1988, ApJ, 328, L35, doi: 10.1086/185155
- Sartori et al. (2018) Sartori, L. F., Schawinski, K., Koss, M. J., et al. 2018, MNRAS, 474, 2444, doi: 10.1093/mnras/stx2952
- Satyapal et al. (2005) Satyapal, S., Dudik, R. P., O’Halloran, B., & Gliozzi, M. 2005, ApJ, 633, 86, doi: 10.1086/449304
- Schawinski et al. (2015) Schawinski, K., Koss, M., Berney, S., & Sartori, L. F. 2015, MNRAS, 451, 2517, doi: 10.1093/mnras/stv1136
- Schirmer et al. (2013) Schirmer, M., Diaz, R., Holhjem, K., Levenson, N. A., & Winge, C. 2013, ApJ, 763, 60, doi: 10.1088/0004-637X/763/1/60
- Schmelz et al. (1987) Schmelz, J. T., Baan, W. A., & Haschick, A. D. 1987, ApJ, 320, 145, doi: 10.1086/165530
- Schmitt et al. (2003) Schmitt, H. R., Donley, J. L., Antonucci, R. R. J., et al. 2003, ApJ, 597, 768, doi: 10.1086/381224
- She et al. (2017) She, R., Ho, L. C., & Feng, H. 2017, ApJ, 835, 223, doi: 10.3847/1538-4357/835/2/223
- Shu et al. (2007) Shu, X. W., Wang, J. X., Jiang, P., Fan, L. L., & Wang, T. G. 2007, ApJ, 657, 167, doi: 10.1086/510579
- Shuder & Osterbrock (1981) Shuder, J. M., & Osterbrock, D. E. 1981, ApJ, 250, 55, doi: 10.1086/159347
- Smith et al. (2001) Smith, R. K., Brickhouse, N. S., Liedahl, D. A., & Raymond, J. C. 2001, ApJ, 556, L91, doi: 10.1086/322992
- Soltan (1982) Soltan, A. 1982, MNRAS, 200, 115, doi: 10.1093/mnras/200.1.115
- Spinelli et al. (2006) Spinelli, P. F., Storchi-Bergmann, T., Brandt, C. H., & Calzetti, D. 2006, ApJS, 166, 498, doi: 10.1086/505910
- Spinoglio & Malkan (1989) Spinoglio, L., & Malkan, M. A. 1989, ApJ, 342, 83, doi: 10.1086/167577
- Stern et al. (2018) Stern, D., McKernan, B., Graham, M. J., et al. 2018, ApJ, 864, 27, doi: 10.3847/1538-4357/aac726
- Strickland et al. (2004) Strickland, D. K., Heckman, T. M., Colbert, E. J. M., Hoopes, C. G., & Weaver, K. A. 2004, ApJS, 151, 193, doi: 10.1086/382214
- Temporin et al. (2003) Temporin, S., Ciroi, S., Rafanelli, P., et al. 2003, ApJS, 148, 353, doi: 10.1086/376779
- Terao et al. (2016) Terao, K., Nagao, T., Hashimoto, T., et al. 2016, ApJ, 833, 190, doi: 10.3847/1538-4357/833/2/190
- Terashima et al. (2000) Terashima, Y., Ho, L. C., & Ptak, A. F. 2000, ApJ, 539, 161, doi: 10.1086/309234
- Tommasin et al. (2010) Tommasin, S., Spinoglio, L., Malkan, M. A., & Fazio, G. 2010, ApJ, 709, 1257, doi: 10.1088/0004-637X/709/2/1257
- Torres-Albà et al. (2018) Torres-Albà, N., Iwasawa, K., Díaz-Santos, T., et al. 2018, A&A, 620, A140, doi: 10.1051/0004-6361/201834105
- Tran (2001) Tran, H. D. 2001, ApJ, 554, L19, doi: 10.1086/320926
- Treister et al. (2018) Treister, E., Privon, G. C., Sartori, L. F., et al. 2018, ApJ, 854, 83, doi: 10.3847/1538-4357/aaa963
- Trichas et al. (2013) Trichas, M., Green, P. J., Constantin, A., et al. 2013, ApJ, 778, 188, doi: 10.1088/0004-637X/778/2/188
- Vaceli et al. (1997) Vaceli, M. S., Viegas, S. M., Gruenwald, R., & de Souza, R. E. 1997, AJ, 114, 1345, doi: 10.1086/118568
- van den Bosch (2016) van den Bosch, R. C. E. 2016, ApJ, 831, 134, doi: 10.3847/0004-637X/831/2/134
- Veron-Cetty & Veron (1986) Veron-Cetty, M. P., & Veron, P. 1986, A&AS, 66, 335
- Véron-Cetty & Véron (2006) Véron-Cetty, M. P., & Véron, P. 2006, A&A, 455, 773, doi: 10.1051/0004-6361:20065177
- Véron-Cetty & Véron (2010) —. 2010, A&A, 518, A10, doi: 10.1051/0004-6361/201014188
- Videla et al. (2013) Videla, L., Lira, P., Andrews, H., et al. 2013, ApJS, 204, 23, doi: 10.1088/0067-0049/204/2/23
- Vollmer (2009) Vollmer, B. 2009, A&A, 502, 427, doi: 10.1051/0004-6361/200911892
- Vollmer et al. (2008) Vollmer, B., Soida, M., Chung, A., et al. 2008, A&A, 483, 89, doi: 10.1051/0004-6361:20078139
- Walton et al. (2011) Walton, D. J., Roberts, T. P., Mateos, S., & Heard, V. 2011, MNRAS, 416, 1844, doi: 10.1111/j.1365-2966.2011.19154.x
- Walton et al. (2014) Walton, D. J., Risaliti, G., Harrison, F. A., et al. 2014, ApJ, 788, 76, doi: 10.1088/0004-637X/788/1/76
- Walton et al. (2020) Walton, D. J., Alston, W. N., Kosec, P., et al. 2020, MNRAS, 499, 1480, doi: 10.1093/mnras/staa2961
- Wang et al. (2018) Wang, J., Xu, D. W., & Wei, J. Y. 2018, ApJ, 858, 49, doi: 10.3847/1538-4357/aab88b
- Wilkins et al. (2014) Wilkins, D. R., Kara, E., Fabian, A. C., & Gallo, L. C. 2014, MNRAS, 443, 2746, doi: 10.1093/mnras/stu1273
- Wilms et al. (2000) Wilms, J., Allen, A., & McCray, R. 2000, ApJ, 542, 914, doi: 10.1086/317016
- Woo & Urry (2002) Woo, J.-H., & Urry, C. M. 2002, ApJ, 579, 530, doi: 10.1086/342878
- Yaqoob (2012) Yaqoob, T. 2012, MNRAS, 423, 3360, doi: 10.1111/j.1365-2966.2012.21129.x
- Younes et al. (2012) Younes, G., Porquet, D., Sabra, B., Reeves, J. N., & Grosso, N. 2012, A&A, 539, A104, doi: 10.1051/0004-6361/201118299
- Yuan et al. (2010) Yuan, T. T., Kewley, L. J., & Sanders, D. B. 2010, ApJ, 709, 884, doi: 10.1088/0004-637X/709/2/884
- Zhang et al. (2006) Zhang, J. S., Henkel, C., Kadler, M., et al. 2006, A&A, 450, 933, doi: 10.1051/0004-6361:20054138
- Zhang et al. (2009) Zhang, W. M., Soria, R., Zhang, S. N., Swartz, D. A., & Liu, J. F. 2009, ApJ, 699, 281, doi: 10.1088/0004-637X/699/1/281
- Zhang et al. (1993) Zhang, X., Wright, M., & Alexander, P. 1993, ApJ, 418, 100, doi: 10.1086/173374
- Zoghbi et al. (2012) Zoghbi, A., Fabian, A. C., Reynolds, C. S., & Cackett, E. M. 2012, MNRAS, 422, 129, doi: 10.1111/j.1365-2966.2012.20587.x