Likely optical counterpart of the cool middle-aged pulsar J1957+5033
Abstract
The 840 kyr old pulsar PSR J1957+5033, detected so far only in - and X-rays, is a nearby and rather cool neutron star with a temperature of 0.2–0.3 MK, a distance of kpc, and a small colour reddening excess . These properties make it an ideal candidate to detect in the optical to get additional constraints on its parameters. We thus performed the first deep optical observations of the pulsar with the 10.4-meter Gran Telescopio Canarias in the band and found its possible counterpart with . The counterpart candidate position is consistent with the X-ray coordinates of the pulsar within the 0.5 arcsec accuracy. Assuming that this is the real counterpart, we analysed the pulsar X-ray spectrum together with the derived optical flux density. As a result, we found that the thermal emission from the bulk surface of the cooling neutron star can significantly contribute to its optical flux. Our multi-wavelength spectral analysis favours the pulsar nature of the detected optical source, since it provides physically adequate parameters of the pulsar emission. We show that the optical data can provide new constraints on the pulsar temperature and distance.
keywords:
stars: neutron – pulsars: general – pulsars: individual: PSR J1957+50331 Introduction
The radio-quiet -ray pulsar PSR J1957+5033 (hereafter J1957) belongs to the family of the so-called middle-aged neutron stars (NSs) with characteristic ages between and yr. Their spectra in soft X-rays and ultraviolet (UV) are typically dominated by thermal emission components from bulk surfaces of cooling NSs.
J1957 was discovered with the Fermi Gamma-ray Space Telescope (Saz Parkinson et al., 2010). It has a spin period111The spin period and the period derivative are taken from the J1957 timing solution which can be found at https://confluence.slac.stanford.edu/display/GLAMCOG/LAT+Gamma-ray+Pulsar+Timing+Models. See also Kerr et al. (2015) for details. ms, a period derivative s s-1, a characteristic age kyr, a spin-down luminosity erg s-1, and a spin-down magnetic field G. Based on the 25-ks Chandra data set of the pulsar field, Marelli et al. (2015) proposed the pulsar X-ray counterpart and showed that its spectrum in the 0.3 – 10 keV band can be described by an absorbed power law (PL) model with a photon index . Zyuzin et al. (2021) performed 87-ks XMM-Newton observations of the X-ray source and confirmed its pulsar nature by detection of X-ray pulsations with the spin period of the NS. They also found a faint trail-like spatial feature which extends from the pulsar towards North-West for 8 arcmin. It is likely associated with the pulsar wind nebula (PWN) or a misaligned outflow of relativistic particles generated by the pulsar. Furthermore, the data analysis revealed that an additional soft thermal component is required to describe the pulsar spectrum in the 0.15–0.5 keV range. It can originate from the entire surface of the NS with the dipole magnetic field and respective non-uniform temperature distribution covered by a hydrogen atmosphere. Using the atmosphere model in the spectral fit, the derived effective temperature of J1957 is MK, making this pulsar the coldest among middle-aged NSs with measured surface temperatures (Potekhin et al., 2020). Alternatively, the blackbody (BB) model with a larger temperature of MK can also fit the thermal spectral component well, implying that it originates from some part of the NS surface (Zyuzin et al., 2021). This may be reminiscent of the emission from a solid state surface of the NS.
The distance to the pulsar estimated using the interstellar extinction–distance relation in X-ray spectral fits as a prior remains rather uncertain, 0.1–1 kpc (Zyuzin et al., 2021). The small distance and the long wavelength extrapolation of the thermal emission X-ray spectral component of J1957 assuming the atmosphere model fit show that it can be sufficiently bright to be visible in the optical and UV. This is also supported by the low X-ray absorption column density towards the pulsar of about 31020 cm-2 implying the colour excess in accord to the relation by Foight et al. (2016). Optical-UV observations could potentially test the models of the thermal emission of J1957. They could be also important to better constrain the temperature, parameters of the PL emission component, the distance and luminosity of J1957. Such work was done only for a very limited number of NSs showing that the optical-UV data can be indeed very useful in this respect (e.g. Ho et al., 2007; Zharikov et al., 2021). The deepest available optical data on the J1957 field were obtained by Pan-STARRS (Chambers et al., 2016) and Beronya et al. (2015). They do not reveal any pulsar counterpart down to the 23 magnitude upper limit.
Therefore, we performed a deeper optical search of the pulsar counterpart using the 10.4-meter Gran Telescopio Canarias (GTC). In this paper we present results of these observations. The data and their reduction are described in Section 2 and results – in Section 3. The multi-wavelength spectral analysis is presented in Section 4. The results are discussed and summarised in Section 5.
2 Observations, data reduction, and calibration
The J1957 field was observed222Programme GTC13-20BMEX, PI S. Zharikov on 13 September 2020 during h under clear and dark sky using the Sloan filter of the Optical System for Imaging and low-intermediate Resolution Integrated Spectroscopy (OSIRIS333http://www.gtc.iac.es/instruments/osiris/) instrument at the GTC. OSIRIS consists of two CCDs with a field of view (FoV) of 7.8 arcmin 7.8 arcmin and a pixel scale of 0.254 arcsec (with binning 2x2). The pulsar was exposed on CCD2 with a mean airmass of 1.17. To avoid being affected by bad pixels, we used five arc-second dithering between 200 s individual exposures. In addition, three short 15–20 s exposures of the pulsar field in the band were obtained to avoid saturation of bright stars that were further used for precise astrometry. During the observations, the seeing varied between 0.96 and 1.36 arcsec.
We performed standard data reduction, including bias subtraction and flat-fielding, using the Image Reduction and Analysis Facility (iraf) package (Tody, 1986). The cosmic rays were removed from the images with the L.A.Cosmic algorithm (Van Dokkum, 2001). Inspection of the target vicinity in each individual exposure revealed the presence of ghosts caused by nearby bright stars that fall onto the target position in four images. These images were excluded from the analysis. The rest of the 33 exposures were then aligned and combined resulting in a final image with the total exposure time of 6600 s and seeing of 1.1 arcsec.
The photometric calibration was obtained using several stars in the CCD2 FoV from the Pan-STARRS catalogue (Chambers et al., 2016). To determine the magnitude zero-point, we used their measured and catalogue magnitudes and the mean OSIRIS atmosphere extinction coefficient = 0.15(2)444http://www.gtc.iac.es/instruments/osiris/media/CUPS_BBpaper.pdf. The resulting zero-point is . The average difference between the Pan-STARRS and Sloan magnitudes is only 0.014(12) (Tonry et al., 2012), which is within the zero-point error budget.
The astrometric calibration was computed using the image combined from the short exposures and a set of 15 relatively bright non-saturated stars with negligible proper motions from the Gaia DR2 catalogue (Gaia Collaboration et al., 2016, 2018) located in the pulsar vicinity in the GTC image. Their position uncertainties on the image and in the catalogue were mas and mas, respectively. For the astrometric referencing, we used the ccmap routine of iraf, which takes into account the frameshift, rotation, and scale factor. Formal uncertainties of the resulting astrometric fit were 40 mas for both coordinates. The resulting solution was applied to the final image. Allowing for the fit and reference star position uncertainties, the resulting astrometric accuracy of the final image was estimated to be 60 mas.
3 Results
In Figure 1 we present a fragment of the -band image of the J1957 field. A magnification of the pulsar vicinity is shown in the right panel where the Chandra X-ray position of the pulsar, R.A. = 19h57m38390 and Dec. = +50∘33′2102 (Zyuzin et al., 2021), is shown by the circle with a radius of 0.81 arcsec. The latter includes the 90% Chandra nominal astrometric accuracy555https://cxc.harvard.edu/cal/ASPECT/celmon/ of 0.8 arcsec and the optical referencing uncertainty. There is a faint optical source within the circle. It is detected with a signal to noise ratio of about four (see below). Its coordinates are R.A. = 19h57m3835(1), Dec. = +50∘33′2096(12), where numbers in brackets correspond to 1 uncertainties. We carefully inspected individual images and found that this is a real source and not an artifact caused by cosmic rays or CCD defects. There are no CCD defects or cosmic ray tracks found. Moreover, the object is always detected even if any individual image is excluded. Therefore, by the position coincidence, we further consider it as a likely optical counterpart of the pulsar. Another nearest optical source is located at 2.2 arcsec South-West of the pulsar. This one and other more distant objects can hardly be potential counterparts as they are outside of the 99 percent uncertainty circle of the Chandra pulsar position with the radius of 1.4 arcsec.
The background around the counterpart candidate is non-uniform due to contamination from nearby bright stars. Using standard aperture photometry with a circular annulus region for background estimates is problematic in this case. Point spread function photometry is also unreliable due to the saturation of these stars. To measure the source magnitude, we, therefore, applied the method described in Zharikov & Mignani (2013). To measure the sourcebackground flux in counts, we used a square aperture of 1 arcsec 1 arcsec centred at the brightest pixel of the source. For the mean background and its standard deviation estimates, we used the same aperture centred at four different random positions in the nearby vicinity of the source less affected by neighbour stars (south of the pulsar position). The aperture correction derived using several bright unsaturated stars in the image was then applied to the source count rate, which was finally transformed to the magnitude using the photometric zero-point and atmosphere extinction coefficient. As a result, we measured the likely counterpart magnitude to be , corresponding to a flux density of nJy and showing that the source is detected at the 4 level.
If this source is an unrelated background object or some extreme fluctuation of background, we can set a 3 upper limit on the pulsar brightness in the optical based on the background level and its variation near the pulsar position, , resulting in the flux density nJy. We see that the derived counterpart candidate brightness is close to the detection limit of the observations.
Finally, we do not detect in the optical any signature of the pulsar trail-like feature seen by Zyuzin et al. (2021) in X-rays.
4 Multi-wavelength spectral analysis
It is instructive to compare the flux density of the likely optical counterpart and its upper limit with available X-ray data on the pulsar.
4.1 X-ray data
We used the same data as in Zyuzin et al. (2021), i.e. the Chandra Advanced CCD Imaging Spectrometer (ACIS)666ObsID 14828, PI M. Marelli, observation date 2014-02-01, 25 ks exposure and XMM-Newton European Photon Imaging Camera (EPIC)777ObsID 0844930101, PI D. Zyuzin, observation date 2019-10-05 data sets. To analyse the data, we utilised the XMM-Newton Science Analysis Software (xmm-sas) v. 17.0.0 (SAS Development Team, 2014) and Chandra Interactive Analysis of Observations (ciao) v. 4.12 (Fruscione et al., 2006) packages. The XMM-Newton data suffer from background flaring, and after cleaning the effective exposures are 79.8, 79.8 and 48.7 ks for EPIC-MOS1, -MOS2 and -pn detectors, respectively. The pulsar spectrum was extracted from XMM-Newton and Chandra data using evselect and specextract tools, respectively. The resulting number of source counts after background subtraction is 232(MOS1) + 254(MOS2) + 902(pn) + 88(ACIS). The full description of data reduction and extraction of the spectra can be found in Zyuzin et al. (2021).
4.2 Spectral analysis
For the spectral analysis we used the X-Ray Spectral Fitting Package (xspec) v.12.10.1 (Arnaud, 1996). To consider the optical data-point together with the X-ray spectra, the measured optical flux density was used to generate respective count rate and response files by applying the ftools888http://heasarc.gsfc.nasa.gov/ftools; (Blackburn et al., 1999) task ftflx2xsp. The extracted X-ray spectra were fitted in 0.3–10 keV, 0.2–10 keV and 0.15–10 keV ranges for the Chandra, MOS and pn data, respectively.
To take into account the absorption in the interstellar medium (ISM), we used the Tuebingen-Boulder model tbabs with the wilm abundances (Wilms, Allen & McCray, 2000) for the X-ray spectra while for the optical point the redden model was applied. The latter uses the extinctions from Cardelli, Clayton & Mathis (1989). The ISM optical colour reddening excess was linked with the equivalent hydrogen absorbing column density in X-rays by the empirical relation cm-2 (Foight et al., 2016)999There are only few data points for low /, which can lead to potentially unaccounted uncertainties of this relation..
As noted above, the J1957 X-ray spectrum alone is best described by the absorbed model consisting of the non-thermal (PL) and thermal components originating from the pulsar magnetosphere and the NS surface, respectively. To describe the latter, we used the NS magnetic hydrogen atmosphere models with the dipole magnetic field, nsmdip, which were calculated for NSs with low effective surface temperatures (see Zyuzin et al. 2021 for detailed model description). The models were constructed for several NS masses, radii and magnetic field strengths. Free parameters are the redshifted effective temperature , the distance to the pulsar, the angle between the rotation and magnetic axes and the angle between the rotation axis and the line of sight.
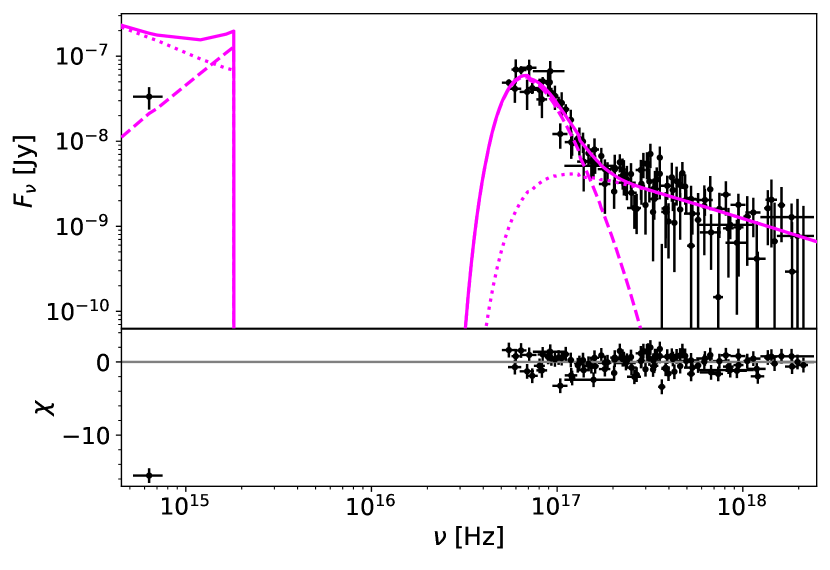
To consider where the optical point is located in respect to the X-ray spectral fit alone, we extrapolated the best-fitting models of the X-ray spectra obtained by Zyuzin et al. (2021) to the optical. An example of such extrapolation for the model nsmdip1+PL is presented in the top panel of Figure 2. The atmosphere model nsmdip1 was produced for the fixed NS mass of 1.4M⊙ , NS radius of 12.6 km and magnetic field at the pole of 31012 G. One can see that the model strongly overshoots the observed optical flux density and thus cannot describe the multi-wavelength data. For other nsmdip+PL models from Zyuzin et al. (2021), which equally well describe the X-ray spectrum, the situation is similar. Therefore, below we focus on the results including only nsmdip1 model.
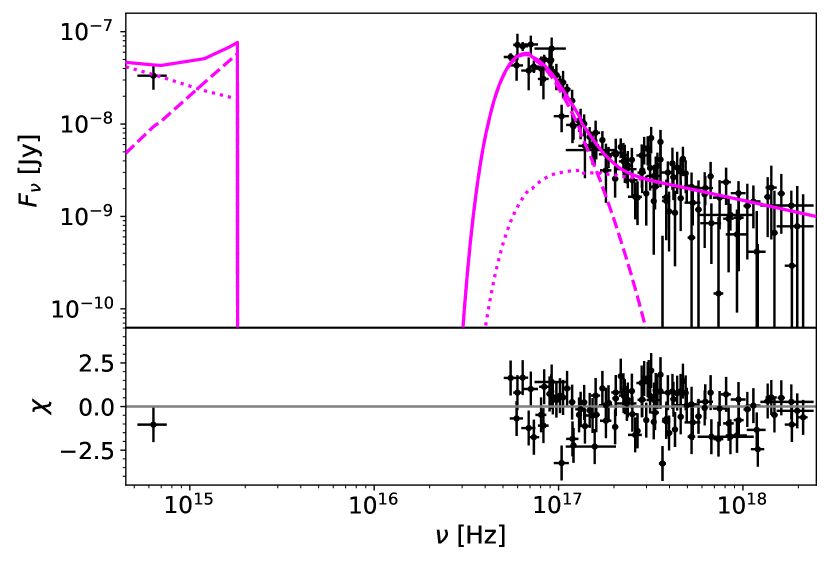
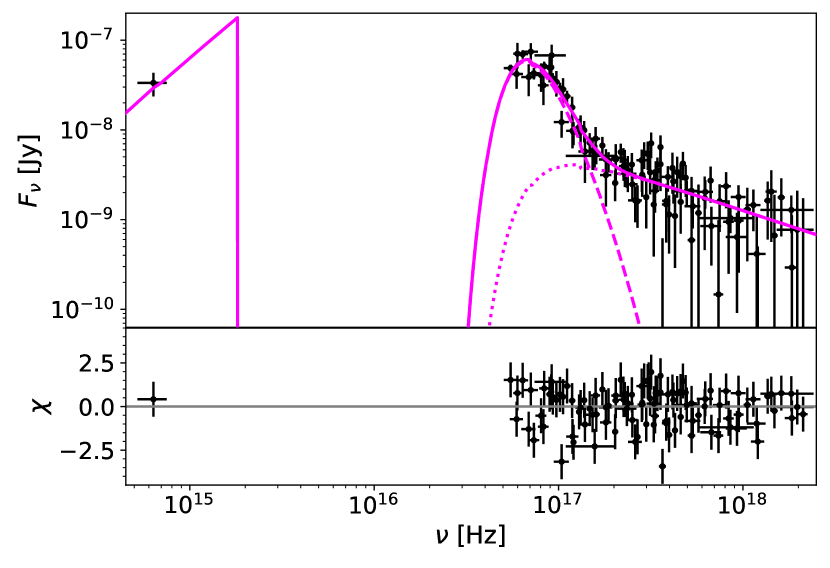
Then we fitted the X-ray spectra and the optical data point simultaneously. We considered the two simplest cases to estimate the properties of the NS thermal emission. In case 1, we assume that the pulsar X-ray and optical non-thermal emission can be described by a single PL component. In case 2, we assume that the PL component has a negligible contribution in the optical band. Thus, we set the PL normalization to zero in the optical band, and this allows us to get upper bounds on the pulsar thermal emission. To estimate fit qualities for cases 1 and 2, we grouped the X-ray data to ensure 25 counts per energy bin and used the fit statistic101010Here we did not use the Chandra data due to the very low count statistic.. As a result, we got almost equally acceptable fits with reduced = 1.28 and 1.15 at 53 degrees of freedom (dof) for the cases 1 and 2, respectively.
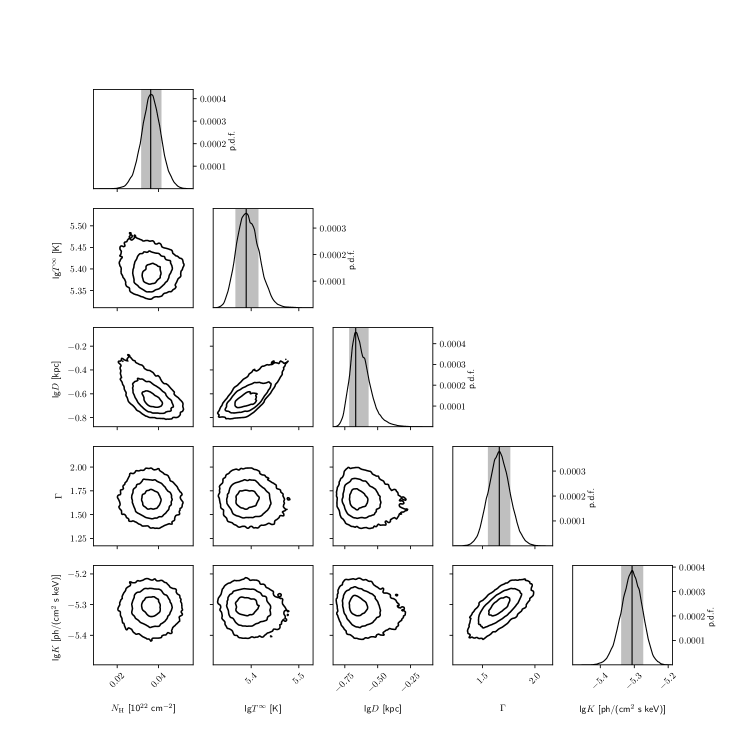
Since the number of X-ray source counts is not large, in order to get the most robust estimates of the model parameters and their uncertainties from spectral fits, we regrouped all X-ray spectra to ensure at least 1 count per energy bin and used the -statistics111111The -statistics is the -statistics (Cash, 1979) appropriate for Poisson data with Poisson background; see https://heasarc.gsfc.nasa.gov/xanadu/xspec/manual/XSappendixStatistics.html. For the optical spectral bin, containing source counts, the -statistics was applied. We then utilised the Bayesian parameter estimation procedure using pyxspec interface and a python package emcee (Foreman-Mackey et al., 2013). The fitting procedure is the same as described in Zyuzin et al. (2021). It includes the relation between the interstellar extinction and distance in the J1957 direction as a prior, allowing one to get a better estimation on the distance to the pulsar, and the constraint ∘ following from the X-ray pulse profile analysis. We derived the best-fitting parameters, which are the maximal-probability density values, and credible intervals from the sampled posterior distributions. The resulting parameters are presented in Table 1 and the best-fitting models are shown in the middle and bottom panels of Figure 2. Obtained likelihoods are similar to those for the X-ray data fitting alone (see Table 1) demonstrating the similar fit qualities. The angles and cannot be constrained from the spectral analysis. 1D and 2D marginal posterior distributions for parameters in case 2 are presented in Figure 3.
Since we cannot exclude the possibility that the detected optical source is a background object, we performed the spectral analysis using the 3 detection limit. To include the latter, we created a fictitious point with error bars, . The fit quality and derived parameters are similar to those obtained above since the upper limit is comparable to the presumed counterpart flux density.
Zyuzin et al. (2021) showed that the BB model can also fit the J1957 thermal spectral component in X-rays implying the presence of a hot part of the NS surface with the temperature of eV. Fitting the optical–X-ray spectrum (binned to ensure at least 25 counts per energy bin) with the BB+PL model results in of 1.35 (dof = 55) that is worse than the respective fit with the atmosphere model nsmdip1+PL (see above). The fit becomes significantly better, =1.15 (dof = 53), if we use the BB+broken PL model. It suggests a PL spectral break located somewhere in the UV. However, the break position and the PL slope in the optical remain highly uncertain. At the same time, the rest of the spectral parameters obtained in this fit are the same as for the BB+PL model applied to the X-ray spectrum alone (Zyuzin et al., 2021). A rough upper bound of the photon index at frequencies below the break in this model is about 1.
We also note, that an additional BB component related with colder parts of the J1957 surface may contribute in the optical–UV band of J1957 but not in X-rays, as observed for other NSs, e.g. the ‘Magnificent Seven’ group (Burwitz et al., 2003; Kaplan et al., 2011). However, the parameters of such possible component currently cannot be robustly constrained for J1957 having only the single optical point.
| Case | , | , | lg, | , | , | |||
| 1020 cm-2 | eV | erg s-1 | ph cm-2 s-1 keV-1 | pc | ||||
| X-ray data alone (results from table 1 in Zyuzin et al. 2021) | ||||||||
| 195.3 | 373 | |||||||
| X-ray data the optical data point from presumed pulsar | ||||||||
| 1 | 1.43 | 4.13 10-6 | 198.6 | 374 | ||||
| 2 | 1.66 | 4.94 10-6 | 195.5 | 374 | ||||
-
•
† is the bolometric thermal luminosity as measured by a distant observer, is the photon index, is the PL normalization, is the log-likelihood and is the number of spectral bins. All errors are at 68 per cent credible intervals. See text for descriptions of cases 1 and 2.
5 Discussion
A faint source was detected within the 1 positional error radius of J1957 with at the 4 significance. We consider it as a likely pulsar counterpart. Since the source can be a background object, we also calculated the optical upper limit of 27.94 on the pulsar brightness in the band. We performed spectral fits using these values together with the pulsar X-ray data.
The J1957 X-ray spectrum alone can be described by the NS atmosphere model with the addition of a non-thermal PL component dominating at high energies (Zyuzin et al., 2021). As seen from the upper panel of Figure 2, simple extrapolation of the X-ray spectral fit possibly implies the existence of a spectral break of the PL component between X-rays and the optical.
To check this, we first performed the multi-wavelength spectral fit without the break and obtained an acceptable result (see the middle panel of Figure 2). The addition of the optical point to the X-ray data leads to a marginal change of the NS surface temperature, a flatter PL slope and about two times larger distance (see Table 1). The optical emission is mainly dominated by the PL component in this case, the contribution of the thermal component is 20 per cent. We estimated the non-thermal luminosity of J1957 in the band, 1.6 1027 erg s-1, resulting in the efficiency of transformation of its spin-down energy losses ( erg s-1) to the optical photons of . These values are comparable with the respective estimates for other 1 Myr old pulsars (Zharikov & Mignani, 2013).
However, non-thermal spectral components of pulsars typically become significantly flatter in the optical than in X-rays (e.g. Kirichenko et al., 2014; Mignani et al., 2016; Abramkin et al., 2021; Zharikov et al., 2021). It is impossible to obtain the spectral slope of J1957 in the optical having only a single data point. Therefore, we considered an extreme case where the non-thermal component has a sufficiently strong spectral break making it negligible in the optical. If so, the optical emission mainly originates from the surface of the cooling NS, which appears to be reasonable for a cold and nearby pulsar. This is supported by the fact that the extrapolation of its thermal component from X-rays to the optical is consistent with the optical flux density (see the upper panel of Figure 2). As a result (the bottom panel of Figure 2 and the last line in Table 1), the parameters of the non-thermal component remain almost the same as for the best-fitting model of the X-ray data alone, but the distance has smaller uncertainties.
The two considered cases shown in the middle and bottom panels of Figure 2 resulted in close fit statistics (Table 1), thus we cannot exclude or confirm the PL spectral break between the optical and X-rays. However, the existence of a spectral break is more preferable due to the higher likelihood (lower ) in case 2. We argue that for all reasonable expected breaks the pulsar parameters presented in Table 1 should be in the ranges between the values provided by these two limiting cases. If the detected source is an unrelated background object, we obtained similar fit results for the optical counterpart upper limit, as it is comparable to the flux density of the likely counterpart.
Finally, Zyuzin et al. (2021) also used the BB model to fit the J1957 thermal spectral component in X-rays, which may be reminiscent of the emission from the solid state star surface. The results imply the emission from a hot part of the NS surface with the temperature eV. In this case, the broken PL is certainly required to describe the multi-wavelength spectrum suggesting the break somewhere in the UV range.
Our multi-wavelength spectral analysis favours the pulsar nature of the detected optical source, since it provides physically adequate parameters of J1957 and its emission. To confirm this, deep UV observations would be particularly important. Based on the middle and bottom panels of Figure 2, the pulsar flux density is expected to be higher in the UV than in the band due to the increase of the contribution of the pulsar thermal emission component. Even if the contribution of the nonthermal emission component is significant, the counterpart optical-UV colour should be considerably different from a stellar one. Additional data point(s) will allow one to select the best spectral model among the considered ones and thus to get new convincing constraints on the pulsar parameters.
Acknowledgements
We are grateful to anonymous referee for useful comments. The work is based on observations made with the Gran Telescopio Canarias, installed at the Spanish Observatorio del Roque de los Muchachos of the Instituto de Astrofísica de Canarias, in the island of La Palma. iraf is distributed by the National Optical Astronomy Observatory, whinomy (AURA) under a cooperative agreement with the National Science Foundation. This work has made use of data from the European Space Agency (ESA) mission Gaia (https://www.cosmos.esa.int/gaia), processed by the Gaia Data Processing and Analysis Consortium (DPAC; https://www.cosmos.esa.int/web/gaia/dpac/consortium). Funding for the DPAC has been provided by national institutions, in particular the institutions participating in the Gaia Multilateral Agreement. DAZ thanks Pirinem School of Theoretical Physics for hospitality. The work of DAZ, AVK, YAS and AYP was partially supported by the Russian Foundation for Basic Research, project 19-52-12013 NNIO_a. SVZ acknowledges PAPIIT grant IN102120. The work of VFS was supported by Deutsche Forschungsgemeinschaft (DFG) (grant WE 1312/53-1) and was partially supported by the subsidy (project no. 0671-2020-0052) allocated to the Kazan Federal University for the State assignment in the sphere of scientific activities.
Data Availability
The X-ray and optical data are available through their respective data archives: https://www.cosmos.esa.int/web/xmm-newton/xsa for XMM-Newton data, https://cxc.harvard.edu/cda/ for Chandra data and https://gtc.sdc.cab.inta-csic.es/gtc/ for GTC.
References
- Abramkin et al. (2021) Abramkin V., Shibanov Y., Mignani R. P., Pavlov G. G., 2021, ApJ, 911, 1
- Arnaud (1996) Arnaud K. A., 1996, in Jacoby G. H., Barnes J., eds, Astronomical Society of the Pacific Conference Series Vol. 101, Astronomical Data Analysis Software and Systems V. p. 17
- Beronya et al. (2015) Beronya D. M., Shibanov Y. A., Zyuzin D. A., Komarova V. N., 2015, in Journal of Physics Conference Series. p. 012001, doi:10.1088/1742-6596/661/1/012001
- Blackburn et al. (1999) Blackburn J. K., Shaw R. A., Payne H. E., Hayes J. J. E., Heasarc 1999, FTOOLS: A general package of software to manipulate FITS files (ascl:9912.002)
- Burwitz et al. (2003) Burwitz V., Haberl F., Neuhäuser R., Predehl P., Trümper J., Zavlin V. E., 2003, A&A, 399, 1109
- Cardelli et al. (1989) Cardelli J. A., Clayton G. C., Mathis J. S., 1989, ApJ, 345, 245
- Cash (1979) Cash W., 1979, ApJ, 228, 939
- Chambers et al. (2016) Chambers K. C., et al., 2016, arXiv e-prints, p. arXiv:1612.05560
- Foight et al. (2016) Foight D. R., Güver T., Özel F., Slane P. O., 2016, ApJ, 826, 66
- Foreman-Mackey et al. (2013) Foreman-Mackey D., Hogg D. W., Lang D., Goodman J., 2013, PASP, 125, 306
- Fruscione et al. (2006) Fruscione A., et al., 2006, in Silva D. R., Doxsey R. E., eds, Society of Photo-Optical Instrumentation Engineers (SPIE) Conference Series Vol. 6270, Society of Photo-Optical Instrumentation Engineers (SPIE) Conference Series. p. 62701V, doi:10.1117/12.671760
- Gaia Collaboration et al. (2016) Gaia Collaboration et al., 2016, A&A, 595, A1
- Gaia Collaboration et al. (2018) Gaia Collaboration et al., 2018, A&A, 616, A1
- Ho et al. (2007) Ho W. C. G., Kaplan D. L., Chang P., van Adelsberg M., Potekhin A. Y., 2007, MNRAS, 375, 821
- Kaplan et al. (2011) Kaplan D. L., Kamble A., van Kerkwijk M. H., Ho W. C. G., 2011, ApJ, 736, 117
- Kerr et al. (2015) Kerr M., Ray P. S., Johnston S., Shannon R. M., Camilo F., 2015, ApJ, 814, 128
- Kirichenko et al. (2014) Kirichenko A., Danilenko A., Shibanov Y., Shternin P., Zharikov S., Zyuzin D., 2014, A&A, 564, A81
- Marelli et al. (2015) Marelli M., Mignani R. P., De Luca A., Saz Parkinson P. M., Salvetti D., Den Hartog P. R., Wolff M. T., 2015, ApJ, 802, 78
- Mignani et al. (2016) Mignani R. P., et al., 2016, ApJ, 825, 151
- Potekhin et al. (2020) Potekhin A. Y., Zyuzin D. A., Yakovlev D. G., Beznogov M. V., Shibanov Y. A., 2020, MNRAS, 496, 5052
- SAS Development Team (2014) SAS Development Team 2014, SAS: Science Analysis System for XMM-Newton observatory, Astrophysics Source Code Library, record ascl:1404.004 (ascl:1404.004)
- Saz Parkinson et al. (2010) Saz Parkinson P. M., et al., 2010, ApJ, 725, 571
- Tody (1986) Tody D., 1986, in Crawford D. L., ed., Society of Photo-Optical Instrumentation Engineers (SPIE) Conference Series Vol. 627, Instrumentation in astronomy VI. p. 733, doi:10.1117/12.968154
- Tonry et al. (2012) Tonry J. L., et al., 2012, ApJ, 750, 99
- Van Dokkum (2001) Van Dokkum P. G., 2001, PASP, 113, 1420
- Wilms et al. (2000) Wilms J., Allen A., McCray R., 2000, ApJ, 542, 914
- Zharikov & Mignani (2013) Zharikov S., Mignani R. P., 2013, MNRAS, 435, 2227
- Zharikov et al. (2021) Zharikov S., Zyuzin D., Shibanov Y., Kirichenko A., Mennickent R. E., Geier S., Cabrera-Lavers A., 2021, MNRAS, 502, 2005
- Zyuzin et al. (2021) Zyuzin D. A., Karpova A. V., Shibanov Y. A., Potekhin A. Y., Suleimanov V. F., 2021, MNRAS, 501, 4998