Bias in Machine Learning Models Can Be Significantly Mitigated by Careful Training: Evidence from Neuroimaging Studies
Abstract
Despite the great promise that machine learning has offered in many fields of medicine, it has also raised concerns about potential biases and poor generalization across genders, age distributions, races and ethnicities, hospitals, and data acquisition equipment and protocols. In the current study, and in the context of three brain diseases, we provide evidence which suggests that when properly trained, machine learning models can generalize well across diverse conditions and do not necessarily suffer from bias. Specifically, by using multi-study magnetic resonance imaging consortia for diagnosing Alzheimer’s disease, schizophrenia, and autism spectrum disorder, we find that well-trained models have a high area-under-the-curve (AUC) on subjects across different subgroups pertaining to attributes such as gender, age, racial groups, and different clinical studies and are unbiased under multiple fairness metrics such as demographic parity difference, equalized odds difference, equal opportunity difference etc. We find that models that incorporate multi-source data from demographic, clinical, genetic factors and cognitive scores are also unbiased. These models have better predictive AUC across subgroups than those trained only with imaging features but there are also situations when these additional features do not help.
Keywords: heterogeneity, bias, neurological disorder, MRI, distribution shift
1 Introduction
Machine learning models have shown great promise for precision diagnosis, treatment prediction, and a number of other clinical applications [4]. There is increasing interest in building systems where such models can aid human experts in clinical settings. However, there are some key challenges to achieving this goal [5]. Clinical data is highly heterogeneous. For neurological disorders such as Alzheimer’s disease, it stems not only from diverse anatomies, overlapping clinical phenotypes, or genomic traits of different subjects, but also from operational, demographic and social aspects such as data acquisition protocols [6] and paucity of data for minorities. As a consequence, machine learning models often have poor reproducibility across different subgroups in the population.
We focus on one particular aspect of this issue, namely that models make biased predictions, i.e., they have different AUCs for different genders, age and racial groups, and cohorts from different clinical studies. This has received wide attention [7, 8, 9, 10, 11, 12, 13]. For example, a model trained on X-ray images consistently made inaccurate predictions on underrepresented genders when the training data was imbalanced [7]. Similarly, for classification of chest X-ray pathologies, minority groups such as female African-Americans and patients with low socioeconomic status are prone to be incorrectly diagnosed as healthy [9]. Such results have raised concerns on whether machine learning models can provide unbiased predictions, and whether they can be deployed in clinical settings eventually.
We provide results from relatively large and diverse datasets pertaining to three neurological disorders, namely Alzheimer’s disease (AD), schizophrenia (SZ), and autism spectrum disorder (ASD), which partly alleviate these concerns. We build models using magnetic resonance (MR) imaging features along with demographic, clinical, genetic factors, and cognitive scores, from large-scale consortia—iSTAGING [1] for AD, PHENOM [2] for SZ, and ABIDE [14] for ASD; see details in Appendix A. There are large imbalances in this dataset, e.g., 13% and 37.4% female subjects respectively in ABIDE and PHENOM, and 70.6% European Americans, 8.8% African Americans, and 1.5% Asian Americans in iSTAGING. A large body of literature has studied confounders such as gender, age, race, image acquisition protocol for these data [15, 16]. We show that, when trained with appropriate data pre-processing techniques and hyper-parameter tuning, machine learning models do not have biased predictions across different subgroups. In contrast, a baseline deep neural network provides accurate predictions on-average across the population but suffers from bias.
2 Results
2.1 We demonstrate bias in baseline models in spite of their high accuracy
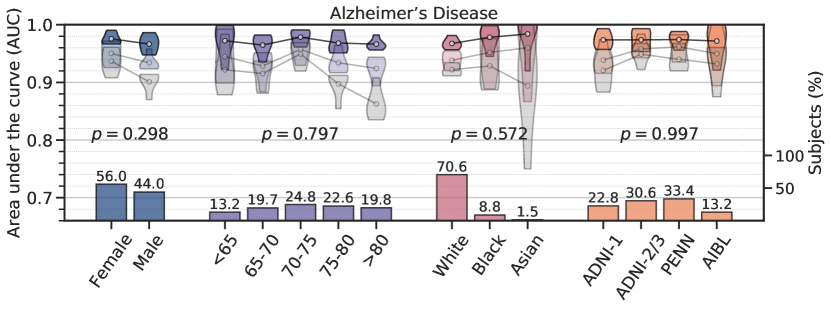
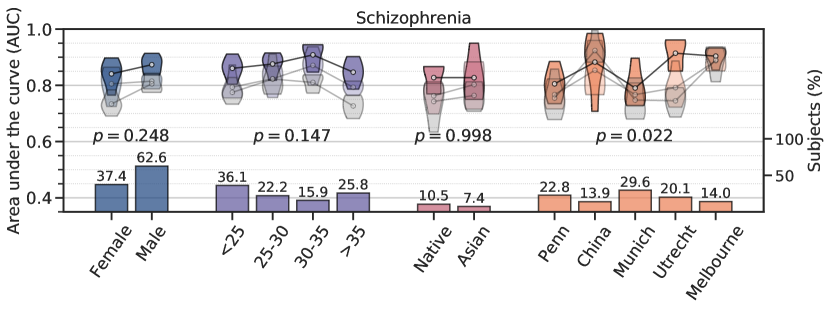
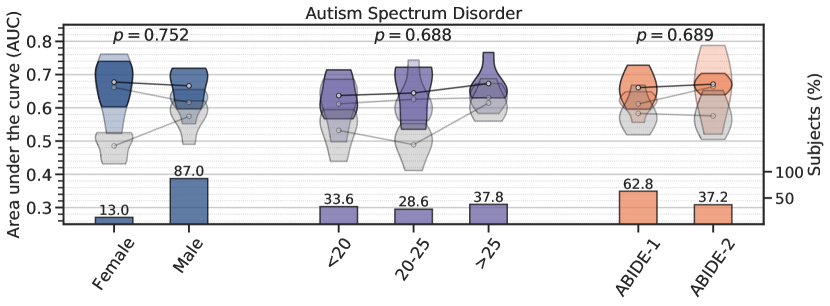
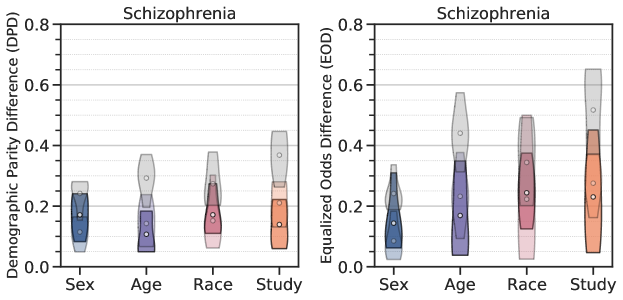
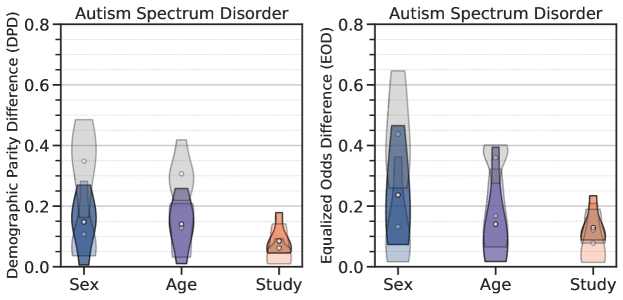
The AUC of a deep network on held-out data (imaging features) is 0.924 ± 0.008 for AD, 0.806 ± 0.036 for SZ, and 0.572 ± 0.031 for ASD. These numbers are comparable to published results [17, 18, 19]. As Fig. 1 shows, for all three disorders, we find large discrepancies in the AUC on different subgroups for all attributes. For example, for AD the model has a higher AUC on females than males ( and Cohen’s -value 2.10, 1.13); for SZ the model predicts more accurately for males than females ( and -value 7.47, 1.26). One may be inclined to hypothesize that this bias in AUC comes from one subgroup having a larger sample size than the other. This hypothesis does not hold when predictions are stratified by age. AD subjects older than 80 years, SZ subjects older than 35 years, and ASD subjects younger than 20 years, have a lower AUC (-values are 1.93, 6.31 and 1.07, and -values are 1.12, 1.06, and 1.02 respectively) even if these subgroups are not the ones with the smallest sample size. The baseline deep network is biased (-value < 0.01) for all three disorders except in four cases: race and clinical studies in AD, race in SZ, and clinical studies in ASD.
2.2 We demonstrate how this bias is significantly reduced when the models are carefully trained
AUC of the ensemble (see Supplementary Information) on held-out data (imaging features) is 0.935 ± 0.014 for AD, 0.811 ± 0.026 for SZ and 0.631 ± 0.028 for ASD; all three are slightly better than that of the baseline deep network. As Fig. 1 shows visually, the AUC of the ensemble is more consistent. For all three neurological disorders, for all attributes, we cannot reject the hypothesis that AUCs for different subgroups have the same mean (at significance level < 0.01). In other words, the ensemble does not exhibit a bias, up to statistically indistinguishable levels. It is remarkable that this holds even with extreme imbalance in the data, e.g., 87% males and 13% females in ASD.
Using the same preprocessing and hyper-parameter tuning methodology as that of the ensemble, the bias of the baseline deep network can be improved. We obtained an AUC of 0.924 ± 0.013 on AD, 0.762 ± 0.023 on SZ and 0.565 ± 0.063 on ASD. These numbers, except for SZ, are about the same as that of the baseline deep network. The -values (and Cohen’s -values in parentheses) for there being bias across subgroups now are 0.086 (sex, 0.69), 0.379 (age, 0.47), 0.976 (race, 0.06) and 0.578 (study, 0.36) for AD; 0.710 (sex, 0.14), 0.173 (age, 0.59), 0.776 (race, 0.10) and 4.77 (study, 1.27) for SZ; 0.321 (sex 0.37), 0.254 (age, 0.51) and 0.818 (study, 0.08) for ASD. The deep network trained with better data preprocessing achieves a similar average AUC as that of the baseline network but its predictions are not biased (significance level < 0.01); except across clinical studies in SZ, which could be due to differences in clinical characteristics across patient cohorts.
2.3 We also demonstrate how this bias is significantly reduced when models are trained on multi-source data
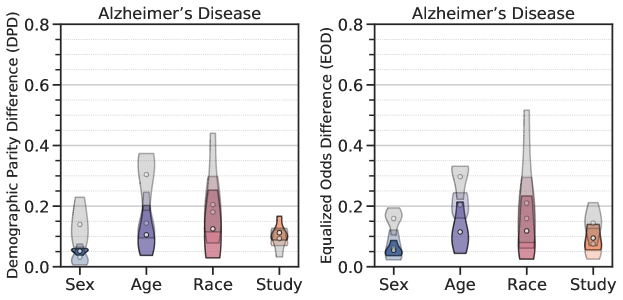
We next trained the ensemble using demographic features, clinical variables, genetic factors and cognitive scores in addition to MR imaging features. The AUC of this multi-source ensemble on held-out data is 0.968 ± 0.009 for AD, 0.866 ± 0.024 for SZ and 0.663 ± 0.034 for ASD. All three values are better than corresponding ones for the ensemble trained only on structural MR imaging features (-value < 3.61 for all three). Therefore, using multi-source data improves the average AUC of models for these three disorders. This ensemble also makes unbiased predictions across different subgroups; the -values (and -values in parentheses) are 0.298 (sex, 0.39), 0.797 (age, 0.29), 0.572 (race, 0.31), and 0.997 (study, 0.05) for AD; 0.248 (sex, 0.44), 0.147 (age, 0.62), 0.998 (race, 0.00), and 0.022 (study, 0.86) for SZ; 0.752 (sex, 0.12), 0.688 (age, 0.25), and 0.689 (study, 0.15) for ASD.
A two-way ANOVA as to whether the improved average AUC translates to improved AUC for subgroups pertaining to each attribute has -values 9.26 (sex), 1.90 (age), 0.465 (race), and 0.636 (study) for AD; 0.250 (sex), 3.31 (age), 0.713 (race), and 7.86 (study) for SZ; 4.24 (sex), 0.237 (age), and 0.681 (study) for ASD. At a significance level of 0.01, we find that using multi-source data improves AUC of the ensemble as compared to using features from only imaging features for subgroups pertaining to sex in AD and clinical studies in SZ, but this does not hold for other cases.
3 Discussion
As machine learning is being applied to problems in the clinical sciences, there is an increasing amount of discussion on bias in particular, and ethical issues in general [10]. There is also a large amount of recent work on identifying biases [7, 9, 11], and developing techniques to mitigate them [8, 21]. We showed that when models are trained using appropriate data preprocessing and hyper-parameter optimization techniques, their predictions need not be biased for neuroimaging data. Baseline models, e.g., deep networks, that do not use this preprocessing and hyper-parameter optimization predict accurately on average but can be biased. We have also checked that training with sufficient data preprocessing but without adequate hyper-parameter tuning produces unbiased models but with lower AUCs (see Appendix F). Our results do not diminish the value of the existing work on bias. Instead, they provide evidence that we might be able to develop unbiased machine learning-based diagnostic models, and deploy them in practice in the future. However, in some situations, bias cannot be removed by preprocessing and model selection because the source of the bias may be somewhere else, e.g., different rates of misdiagnosis [22].
The machine learning literature has well-established safeguards against poor generalization. Disregarding these procedures can lead to biased predictions. Our results indicate that a rigorous preprocessing, training and evaluation methodology can give models that do not suffer from biased predictions in neuroimaging applications. This has also been noticed recently [12], but we have demonstrated this phenomenon more exhaustively and across three different neurological disorders. Our work can therefore provide a benchmark for automated neuroimaging-based diagnostic systems.
Balanced datasets are desirable for building unbiased models [23]. But it is extremely difficult to obtain balanced data. There are long-standing problems in recruiting volunteers across gender, age, and race. For example, female, minority ethnicity groups, and older subjects are less likely to participate in clinical trials [24]. Even for balanced datasets, trained models may still be biased due to unobserved confounders, e.g., severity of the disease or genetic factors. Recent studies have therefore argued for training models on extensive multi-source neuroimaging datasets [25]. Our results agree with such motivations—large-scale cohorts of multi-source data can enable training robust and unbiased models and also enable thorough evaluation.
4 Materials and Methods
We use 3D magnetic resonance images along with demographic (gender, age, race, education level, marital status, employment status, handedness, smoker), clinical (diabetes, hypertension, hyperlipidemia, systolic/diastolic blood pressure and body mass index), and genetic factors (apolipoprotein E (APOE) alleles 2, 3 and 4) and cognitive scores from three large consortia—iSTAGING for AD, PHENOM for SZ, and ABIDE for ASD; see details in Appendix A. We use a standard processing pipeline (see Appendix B) to compute imaging features from T1-weighted MR images. All accuracies are calculated using 5 independent held-out test sets.
Feature pre-processing pipeline. Some features, predominantly clinical and genetic factors and cognitive scores, are sparsely populated; see details in Appendix A. Continuous-valued features are normalized to have zero mean and unit variance after median imputation; quantile normalization is used for features with skewed distributions. For categorical features, we introduce an “unknown” category for missing values and for each feature with missing values we introduce an additional Boolean feature which indicates whether the value was missing. No harmonization tools [6] are used.
We use AutoGluon [26] for training all models, for building ensembles using bagging, boosting and stacking, and for performing hyper-parameter search. The baseline deep network has three fully-connected layers and is trained using data that is normalized to zero mean and unit variance after dropping missing values, without feature pre-processing.
Acknowledgments
This work was supported by the National Institute on Aging (RF1AG054409 and U01AG068057), the National Institute of Mental Health (R01MH112070), the National Institutes of Health (75N95019C00022), the National Science Foundation (2145164) and cloud computing credits from Amazon Web Services.
References
- [1] Mohamad Habes, Raymond Pomponio, Haochang Shou, Jimit Doshi, Elizabeth Mamourian, Guray Erus, Ilya Nasrallah, Lenore J Launer, Tanweer Rashid and Murat Bilgel “The Brain Chart of Aging: Machine-learning analytics reveals links between brain aging, white matter disease, amyloid burden, and cognition in the iSTAGING consortium of 10,216 harmonized MR scans” In Alzheimer’s & Dementia 17.1 Wiley Online Library, 2021, pp. 89–102
- [2] Ganesh B Chand, Dominic B Dwyer, Guray Erus, Aristeidis Sotiras, Erdem Varol, Dhivya Srinivasan, Jimit Doshi, Raymond Pomponio, Alessandro Pigoni and Paola Dazzan “Two distinct neuroanatomical subtypes of schizophrenia revealed using machine learning” In Brain 143.3 Oxford Academic, 2020, pp. 1027–1038
- [3] Clifford R Jack Jr, Matt A Bernstein, Nick C Fox, Paul Thompson, Gene Alexander, Danielle Harvey, Bret Borowski, Paula J Britson, Jennifer L. Whitwell and Chadwick Ward “The Alzheimer’s disease neuroimaging initiative (ADNI): MRI methods” In Journal of Magnetic Resonance Imaging 27.4 Wiley Online Library, 2008, pp. 685–691
- [4] Monika A Myszczynska, Poojitha N Ojamies, Alix Lacoste, Daniel Neil, Amir Saffari, Richard Mead, Guillaume M Hautbergue, Joanna D Holbrook and Laura Ferraiuolo “Applications of machine learning to diagnosis and treatment of neurodegenerative diseases” In Nature Reviews Neurology 16.8 Nature Publishing Group, 2020, pp. 440–456
- [5] Pranav Rajpurkar, Emma Chen, Oishi Banerjee, Oishi Banerjee, Oishi Banerjee, Oishi Banerjee and Eric J Topol “AI in health and medicine” In Nature Medicine Nature Publishing Group, 2022, pp. 1–8
- [6] Raymond Pomponio, Guray Erus, Mohamad Habes, Jimit Doshi, Dhivya Srinivasan, Elizabeth Mamourian, Vishnu Bashyam, Ilya M Nasrallah, Theodore D Satterthwaite and Yong Fan “Harmonization of large MRI datasets for the analysis of brain imaging patterns throughout the lifespan” In NeuroImage 208 Elsevier, 2020, pp. 116450
- [7] Agostina J Larrazabal, Nicolás Nieto, Victoria Peterson, Diego H Milone, Diego H Milone and Enzo Ferrante “Gender imbalance in medical imaging datasets produces biased classifiers for computer-aided diagnosis” In Proceedings of the National Academy of Sciences 117.23 National Acad Sciences, 2020, pp. 12592–12594
- [8] Yan Gao and Yan Cui “Deep transfer learning for reducing health care disparities arising from biomedical data inequality” In Nature Communications 11.1 Nature Publishing Group, 2020, pp. 1–8
- [9] Laleh Seyyed-Kalantari, Haoran Zhang, Matthew McDermott, Irene Y Chen, Irene Y Chen and Marzyeh Ghassemi “Underdiagnosis bias of artificial intelligence algorithms applied to chest radiographs in under-served patient populations” In Nature Medicine 27.12 Nature Publishing Group, 2021, pp. 2176–2182
- [10] Samuel G Finlayson, Adarsh Subbaswamy, Karandeep Singh, John Bowers, Annabel Kupke, Jonathan Zittrain, Isaac S Kohane and Suchi Saria “The clinician and dataset shift in artificial intelligence” In The New England Journal of Medicine 385.3 NIH Public Access, 2021, pp. 283
- [11] Jingwei Li, Danilo Bzdok, Jianzhong Chen, Angela Tam, Leon Qi Rong Ooi, Avram J Holmes, Tian Ge, Kaustubh R Patil, Mbemba Jabbi and Simon B Eickhoff “Cross-ethnicity/race generalization failure of behavioral prediction from resting-state functional connectivity” In Science Advances 8.11 American Association for the Advancement of Science, 2022, pp. eabj1812
- [12] Eike Petersen, Aasa Feragen, Luise da Costa Zemsch, Anders Henriksen, Oskar Eiler Wiese Christensen and Melanie Ganz “Feature robustness and sex differences in medical imaging: a case study in MRI-based Alzheimer’s disease detection” In arXiv preprint arXiv:2204.01737, 2022
- [13] Emma AM Stanley, Matthias Wilms, Pauline Mouches and Nils D Forkert “Fairness-related performance and explainability effects in deep learning models for brain image analysis” In Journal of Medical Imaging 9.6 SPIE, 2022, pp. 061102
- [14] Adriana Di Martino, Chao-Gan Yan, Qingyang Li, Erin Denio, Francisco X Castellanos, Kaat Alaerts, Jeffrey S Anderson, Michal Assaf, Susan Y Bookheimer and Mirella Dapretto “The autism brain imaging data exchange: towards a large-scale evaluation of the intrinsic brain architecture in autism” In Molecular psychiatry 19.6 Nature Publishing Group, 2014, pp. 659–667
- [15] Darya Chyzhyk, Gaël Varoquaux, Michael Milham and Bertrand Thirion “How to remove or control confounds in predictive models, with applications to brain biomarkers” In GigaScience 11 Oxford Academic, 2022
- [16] Oualid Benkarim, Casey Paquola, Bo-yong Park, Valeria Kebets, Seok-Jun Hong, Reinder Wael, Shaoshi Zhang, BT Thomas Yeo, Michael Eickenberg and Tian Ge “Population heterogeneity in clinical cohorts affects the predictive accuracy of brain imaging” In PLoS biology 20.4 Public Library of Science San Francisco, CA USA, 2022, pp. e3001627
- [17] Junhao Wen, Elina Thibeau-Sutre, Mauricio Diaz-Melo, Jorge Samper-González, Alexandre Routier, Simona Bottani, Didier Dormont, Stanley Durrleman, Ninon Burgos and Olivier Colliot “Convolutional neural networks for classification of Alzheimer’s disease: Overview and reproducible evaluation” In Medical image analysis 63 Elsevier, 2020, pp. 101694
- [18] Martin Rozycki, Theodore D Satterthwaite, Nikolaos Koutsouleris, Guray Erus, Jimit Doshi, Daniel H Wolf, Yong Fan, Raquel E Gur, Ruben C Gur and Eva M Meisenzahl “Multisite machine learning analysis provides a robust structural imaging signature of schizophrenia detectable across diverse patient populations and within individuals” In Schizophrenia bulletin 44.5 Oxford University Press US, 2018, pp. 1035–1044
- [19] Gajendra J Katuwal, Nathan D Cahill, Stefi A Baum and Andrew M Michael “The predictive power of structural MRI in Autism diagnosis” In International Conference of the IEEE Engineering in Medicine and Biology Society, 2015, pp. 4270–4273 IEEE
- [20] Alekh Agarwal, Alina Beygelzimer, Miroslav Dudík, John Langford and Hanna Wallach “A reductions approach to fair classification” In International Conference on Machine Learning, 2018, pp. 60–69 PMLR
- [21] Rongguang Wang, Pratik Chaudhari and Christos Davatzikos “Embracing the disharmony in medical imaging: a simple and effective framework for domain adaptation” In Medical Image Analysis 76 Elsevier, 2022, pp. 102309
- [22] Ziad Obermeyer, Brian Powers, Christine Vogeli and Sendhil Mullainathan “Dissecting racial bias in an algorithm used to manage the health of populations” In Science 366.6464 American Association for the Advancement of Science, 2019, pp. 447–453
- [23] Nitesh V Chawla, Kevin W Bowyer, Lawrence O Hall and W Philip Kegelmeyer “SMOTE: synthetic minority over-sampling technique” In Journal of artificial intelligence research 16, 2002, pp. 321–357
- [24] Daniel B Chastain, Sharmon P Osae, Andrés F Henao-Martínez, Carlos Franco-Paredes, Joeanna S Chastain and Henry N Young “Racial disproportionality in Covid clinical trials” In New England Journal of Medicine 383.9 Mass Medical Soc, 2020, pp. e59
- [25] Tong He, Lijun An, Pansheng Chen, Jianzhong Chen, Jiashi Feng, Danilo Bzdok, Avram J Holmes, Simon B Eickhoff and BT Yeo “Meta-matching as a simple framework to translate phenotypic predictive models from big to small data” In Nature Neuroscience Nature Publishing Group, 2022, pp. 1–10
- [26] Nick Erickson, Jonas Mueller, Alexander Shirkov, Hang Zhang, Pedro Larroy, Mu Li and Alexander Smola “Autogluon-tabular: Robust and accurate automl for structured data” In arXiv preprint arXiv:2003.06505, 2020
- [27] Theodore D Satterthwaite, Daniel H Wolf, James Loughead, Kosha Ruparel, Jeffrey N Valdez, Steven J Siegel, Christian G Kohler, Raquel E Gur and Ruben C Gur “Association of enhanced limbic response to threat with decreased cortical facial recognition memory response in schizophrenia” In American Journal of Psychiatry 167.4 Am Psychiatric Assoc, 2010, pp. 418–426
- [28] Tianhao Zhang, Nikolaos Koutsouleris, Eva Meisenzahl and Christos Davatzikos “Heterogeneity of structural brain changes in subtypes of schizophrenia revealed using magnetic resonance imaging pattern analysis” In Schizophrenia bulletin 41.1 Oxford University Press US, 2015, pp. 74–84
- [29] Kathryn A Ellis, Christopher C Rowe, Victor L Villemagne, Ralph N Martins, Colin L Masters, Olivier Salvado, Cassandra Szoeke, David Ames and AIBL Research Group “Addressing population aging and Alzheimer’s disease through the Australian Imaging Biomarkers and Lifestyle study: Collaboration with the Alzheimer’s Disease Neuroimaging Initiative” In Alzheimer’s & dementia 6.3 Wiley Online Library, 2010, pp. 291–296
- [30] Nicholas J Tustison, Brian B Avants, Philip A Cook, Yuanjie Zheng, Alexander Egan, Paul A Yushkevich and James C Gee “N4ITK: improved N3 bias correction” In IEEE transactions on medical imaging 29.6 IEEE, 2010, pp. 1310–1320
- [31] Jimit Doshi, Guray Erus, Yangming Ou, Bilwaj Gaonkar and Christos Davatzikos “Multi-atlas skull-stripping” In Academic radiology 20.12 Elsevier, 2013, pp. 1566–1576
- [32] Jimit Doshi, Guray Erus, Yangming Ou, Susan Resnick, Ruben Gur, Raquel Gur, Theodore Satterthwaite, Susan Furth, Christos Davatzikos and Alzheimer’s Neuroimaging Initiative “Multi-atlas region segmentation utilizing ensembles of registration algorithms and parameters, and locally optimal atlas selection” In Neuroimage 127 Elsevier, 2016, pp. 186–195
- [33] Jimit Doshi, Guray Erus, Mohamad Habes and Christos Davatzikos “DeepMRSeg: A convolutional deep neural network for anatomy and abnormality segmentation on MR images” In arXiv preprint arXiv:1907.02110, 2019
- [34] Rongguang Wang, Pratik Chaudhari and Christos Davatzikos “Harmonization with flow-based causal inference” In International Conference on Medical Image Computing and Computer-Assisted Intervention Springer, 2021, pp. 181–190
- [35] Liudmila Prokhorenkova, Gleb Gusev, Aleksandr Vorobev, Anna Veronika Dorogush and Andrey Gulin “CatBoost: unbiased boosting with categorical features” In Advances in neural information processing systems 31, 2018
- [36] Guolin Ke, Qi Meng, Thomas Finley, Taifeng Wang, Wei Chen, Weidong Ma, Qiwei Ye and Tie-Yan Liu “LightGBM: A highly efficient gradient boosting decision tree” In Advances in neural information processing systems 30, 2017
- [37] Moritz Hardt, Eric Price and Nati Srebro “Equality of opportunity in supervised learning” In Advances in neural information processing systems 29, 2016
- [38] Pratyush Garg, John Villasenor and Virginia Foggo “Fairness metrics: A comparative analysis” In IEEE International Conference on Big Data, 2020, pp. 3662–3666 IEEE
- [39] Till Speicher, Hoda Heidari, Nina Grgic-Hlaca, Krishna P Gummadi, Adish Singla, Adrian Weller and Muhammad Bilal Zafar “A unified approach to quantifying algorithmic unfairness: Measuring individual &group unfairness via inequality indices” In Proceedings of the 24th ACM SIGKDD international conference on knowledge discovery & data mining, 2018, pp. 2239–2248
- [40] Tianqi Chen, Thierry Moreau, Ziheng Jiang, Haichen Shen, Eddie Q Yan, Leyuan Wang, Yuwei Hu, Luis Ceze, Carlos Guestrin and Arvind Krishnamurthy “TVM: End-to-End Optimization Stack for Deep Learning” In arXiv preprint arXiv:1802.04799 11, 2018, pp. 20 arXiv:1802.04799
- [41] Julián N Acosta, Guido J Falcone, Pranav Rajpurkar and Eric J Topol “Multimodal biomedical AI” In Nature Medicine Nature Publishing Group, 2022, pp. 1–12
Supplementary A Data
We use 3D magnetic resonance (T1-weighted) images along with demographic (gender, age, race, education level, marital status, employment status, handedness, smoker), clinical (diabetes, hypertension, hyperlipidemia, systolic/diastolic blood pressure and body mass index), genetic factors (apolipoprotein E (APOE) alleles 2, 3 and 4), and cognitive scores (mini-mental state exam (MMSE), full-scale intelligence quotient (FIQ), verbal intelligence quotient (VIQ), and performance intelligence quotient (PIQ)) from three large consortia—iSTAGING [1] for AD, PHENOM [27, 28, 2] for SZ, and ABIDE [14] for ASD. The subset of iSTAGING data used here consists of multiple clinical studies: AD Neuroimaging Initiative (ADNI) [3], Penn Memory Center cohort (PENN), and Australian Imaging, Biomarkers and Lifestyle (AIBL) [29]. In PHENOM scans are acquired from five different sites namely Penn (United States), China, Munich, Utrecht, and Melbourne. All tasks in this study are a binary classification problem with two labels (healthy controls and patients). We only use the baseline (first time point) scans from each cohort; all follow-up sessions are excluded. This way there is no data leakage for the same participant between training and test sets. For AD, we select stable cognitive normal (CN) and AD patients based on each participant’s longitudinal diagnosis status. We only include subjects who were diagnosed as CN or AD at the baseline and stayed stable during the follow-up sessions.
iSTAGING. The consortium consists of four datasets including ADNI-1 (22.81%), ADNI-2 (30.58%), PENN (33.40%), and AIBL (13.22%). There are in total 781 controls and 815 patients where 173 (controls)/191 (patients) in ADNI-1, 261/227 in ADNI-2/3, 228/305 in PENN, and 119/92 in AIBL. 56.02% of the participants are female and 43.98% of them are male; 10.90% (female)/11.90% (male) in ADNI-1, 15.66%/14.91% in ADNI-2/3, 21.37%/12.03% in PENN, and 8.08%/5.14% in AIBL. The participants are distributed in age ranges 0–65 (13.16%), 65–70 (19.67%), 70–75 (24.81%), 75–80 (22.56%), and over 80 (19.80%) years old; 1.50% (0–65)/1.94% (65–70)/7.27% (70–75)/6.52% (75–80)/5.58% (> 80) in ADNI-1, 3.51%/8.15%/6.95%/6.89%/5.08% in ADNI-2/3, 6.33%/7.02%/6.83%/6.58%/6.64% in PENN, and 1.82%/2.57%/3.76%/2.57%/2.51% in AIBL. 70.61% of the participants are White, 8.77% of them are Black, and 1.50% of them are Asian; 21.18% (White)/1.19% (Black)/0.31% (Asian) in ADNI-1, 16.98%/0.88%/0.56% in ADNI-2/3, 25.13%/6.70%/0.63% in PENN, and 7.33% (White) in AIBL.
PHENOM. The consortium consists of five datasets including Penn (22.28%), China (13.94%), Munich (29.64%), Utrecht (20.12%), and Melbourne (14.03%). There are in total 563 controls and 456 patients where 131 (controls)/96 (patients) in Penn, 76/66 in China, 157/145 in Munich, 115/90 in Utrecht, and 84/59 in Melbourne. 37.39% of the participants are female and 62.61% of them are male; 11.87% (female)/10.40% (male) in Penn, 6.77%/7.16% in China, 7.75%/21.88% in Munich, 6.97%/13.15% in Utrecht, and 4.02%/10.01% in Melbourne. The participants are distributed in age ranges 0–25 (36.11%), 25–30 (22.18%), 30–35 (15.90%), and over 35 (25.81%) years old; 5.79% (0–25)/6.28% (25–30)/3.53% (30–35)/6.67% (> 35) in Penn, 4.91%/2.36%/2.16%/4.51% in China, 9.42%/7.26%/5.99%/6.97% in Munich, 10.11%/4.12%/2.85%/3.04% in Utrecht, and 5.89%/2.16%/1.37%/4.61% in Melbourne. 10.50% of the participants are Native and 7.36% of them are Asian; 10.50% (Native)/7.36% (Asian) in Penn.
ABIDE. The consortium consists of two phases including ABIDE-1 (62.78%) and ABIDE-2 (37.22%). There are in total 362 controls and 307 patients where 224 (controls)/196 (patients) in ABIDE-1 and 138/111 in ABIDE-2. 13.00% of the participants are female and 87.00% of them are male; 6.73% (female)/56.05% (male) in ABIDE-1 and 6.28%/30.94% in ABIDE-2. The participants are distributed in age ranges 0–20 (33.63%), 20–25 (28.55%), and over 25 (37.82%) years old; 21.97% (0–20)/17.49% (20–25)/23.32% (> 25) in ABIDE-1 and 11.66%/11.06%/14.50% in ABIDE-2.
Available variables. In the iSTAGING consortium, we have MR imaging (region-of-interest volumes and white matter lesion volume), demographics (gender, age, race and smoking status), clinical (diabetes, hypertension, hyperlipidemia, blood pressure (systolic/diastolic) and body mass index), genetic factor (Apolipoprotein E alleles 2, 3 and 4), and cognitive score (mini-mental state exam) variables. In the PHENOM consortium, we have MR imaging (region-of-interest volumes) and demographics (gender, age, race, education level, marital status, employment status and handedness) variables. In the ABIDE consortium, we have MR imaging (region-of-interest volumes), demographics (gender, age and handedness) variables, and cognitive score (full-scale intelligence quotient, verbal intelligence quotient and performance intelligence quotient) variables.
Supplementary B Methodology for creating features from structural measures
We compute features from T1-weighted MR images using a standard pipeline. Scans are bias-field corrected [30], skull-stripped with a multi-atlas algorithm [31], and then a multi-atlas label fusion segmentation method [32] is used to obtain anatomical region-of-interest (ROI) masks for 119 gray matter ROIs, 20 white matter ROIs and 6 ventricle ROIs of the brain (total 145). We further segment white matter hyperintensities (WMH) using a deep learning-based algorithm [33] on fluid-attenuated (FLAIR) and T1-weighted images. White matter lesion (WML) volumes are obtained by summing up the WMH mask voxels.
Feature pre-processing pipeline. Our data contains structural features such as ROI and WML volumes in addition to demographic, clinical and genetic factors, and cognitive scores. Some of these features (predominantly the last three) are sparsely populated. For continuous-valued features, we first impute missing values with the median of each variable and normalize the feature to have zero-mean and unit-variance. We apply quantile normalization to skewed distributions. For discrete-valued features, we introduce a “unknown” category for missing values. Corresponding to each feature with missing values, we introduce an additional Boolean feature which indicates whether the value was missing. This way we preserve the evidence of absence (rather than the absence of evidence) [26]. We did not use any harmonization tools [6, 34].
Supplementary C Evaluation methodology
We report area under the receiver operating characteristic (AUC) curve on held-out test sets as follows. We split data into 5 equal-sized folds (stratified by labels), use four for training and validation (80%) and the fifth for testing (20%). All hyper-parameter tuning is performed using a further 5-fold cross-validation within the 80% data. This way, the 20% data is a completely independent test set which is used only for reporting the final AUC. We report mean and standard deviation of the AUC over 5 independent test sets (one for each outer fold). This is a computationally expensive, but rigorous, evaluation methodology. The three neurological disorders consist of data from multiple clinical studies; we create the training, validation and test sets for each study independently and then concatenate them.
Supplementary D Hyper-parameter tuning methodology
We compare results from an optimized model, in which hyper-parameter optimization and ensemble learning were performed, with a basic network. For the former, we use a framework called AutoGluon [26] which gives an easy way to train a large number of different types of models (deep networks, -nearest neighbor classifiers, random forests, CatBoost [35], and LightGBM [36]) and perform hyper-parameter search. For deep network models we create an input layer that concatenates the embedding of continuous-valued and categorical features; the other models can natively handle both these types of features. Using AutoGluon we can also build ensembles of these models via bagging, boosting and stacking. For each neurological disorder, for each of the 5 outer folds, we train the above different types of models using different hyper-parameters in parallel across multiple CPUs and 4 GPUs for 1 hour and build an ensemble that obtains the best classification log-likelihood on the validation data.
The baseline deep network has three fully-connected layers and is also built within the same software framework. This network is trained using data that is normalized to have zero mean and unit standard deviation after dropping missing values. It does not use the pre-processing pipeline described above.
Supplementary E Evaluation on additional fairness metrics
It has been noticed that different fairness metrics are often incompatible. We therefore also assessed fairness using three other metrics. Equal opportunity difference (EO) [37], predictive parity difference (PPD) [38] and generalized entropy index (GEI) [39] are three other well-known group fairness measures. A predictor satisfies “equal opportunity” if the true positive rate (TPR) is the same across sensitive groups. “Predictive parity” is satisfied when the positive predictive value (PPV) is the same for sensitive groups, where PPV is defined as the probability that individuals predicted to belong to the positive class actually belong to the positive class. “Generalized entropy index” is an unified individual and group fairness measure and it also explains how individual fairness and group fairness are related. A value of zero represents perfect equality and higher values denote increasing levels of inequality. We assess fairness of our learned learning models using EO, PPD and GEI with respect to sensitive groups including sex, age, race, and study for all neurological disorders. Our original findings remain unchanged: appropriately designed machine learning models show lower disparities compared to baseline machine learning models under these metrics (except GEI metric for autism spectrum disorder case).
For all three neurological disorders, we find that the ensemble model has small fairness disparities in terms of EO, PPD and GEI on all sensitive groups. For example, for AD, the EO, PPD and GEI of the baseline deep network on held-out data are 0.159 ± 0.029, 0.159 ± 0.028 and 0.073 ± 0.005 across gender respectively, which are larger than those of an ensemble model, 0.043 ± 0.048, 0.029 ± 0.028 and 0.058 ± 0.005 respectively (-values 3.23, 1.68 and 2.62). For SZ, the ensemble shows lower EO, PPD and GEI disparities (0.039 ± 0.042, 0.112 ± 0.060 and 0.102 ± 0.018) compared to the neural net (0.222 ± 0.022, 0.272 ± 0.098 and 0.142 ± 0.024) across age groups with -values 9.02, 2.37 and 3.04 respectively. Under EO and PPD metrics, compared to the baseline deep network, the ensemble model has better fairness (-value < 0.01) for all three disorders except in four cases: race and clinical studies in AD, race in SZ, and clinical studies in ASD. Under GEI metric, the ensemble model has better fairness (-value < 0.01) across all sensitive attributes for AD and SZ. There’s no statistically significant difference in GEI between neural net and ensemble for ASD. We also found that the differences between between ensembles trained only on structural measures and ones trained on multi-source data in terms of these fairness metrics are not statistically significant.
Supplementary F Some practical recommendations for training unbiased machine learning models
We conducted the following experiment for Alzheimer’s disease diagnosis using a deep neural net to understand the influence of data pre-processing and hyper-parameter tuning techniques on bias. We performed experiment under the following three settings.
-
(a)
Training without sufficient data pre-processing but with adequate hyper-parameter tuning. This is the case we have shown in the first experiment (baseline deep network). We find that both gender and age sub-groups show biased predictions in this case.
-
(b)
Training with sufficient data pre-processing but without adequate hyper-parameter tuning. We run hyper-parameter tuning for 10 less computer time compared to case (a). We observe that prediction disparity does not appear, and this holds for all sub-groups. However, this inadequate hyper-parameter tuning leads to relatively poor prediction performance (0.896 in AUC) compared to case (a) (0.924 in AUC).
-
(c)
Training with both adequate data pre-processing and hyper-parameter tuning. This is the setting that we have used for the experiments with the ensemble. As we discussed in the main text, machine learning models do not exhibit biased predictions in this case. This setting also leads to improved AUC, which matches that of case (a).
These ablation experiments suggest that adequate data pre-processing leads to unbiased models which obtain a high AUC. On the other hand, adequate hyper-parameter tuning ensures an accurate model, but it may not provide unbiased predictions. One may therefore ascribe importance to the various factors:data pre-processing, hyper-parameter tuning, ensembling, and multi-source data. Our suggestions for building unbiased and accurate predictive models are as follows.