Catching the Butterfly and the Homunculus of Carinae with ALMA
Abstract
The nature and origin of the molecular gas component located in the circumstellar vicinity of Carinae are still far from being completely understood. Here, we present Atacama Large Millimeter/Submillimeter Array (ALMA) CO(32) observations with a high angular resolution (0.15′′), and a great sensitivity that are employed to reveal the origin of this component in Carinae. These observations reveal much higher velocity (300 to 270 km s-1) blue and redshifted molecular thermal emission than previously reported, which we associate with the lobes of the Homunculus Nebula, and that delineates very well the innermost contours of the red- and blue-shifted lobes likely due by limb brightening. The inner contour of the redshifted emission was proposed to be a disrupted torus, but here we revealed that it is at least part of the molecular emission originated from the lobes and/or the expanding equatorial skirt. On the other hand, closer to systemic velocities (100 km s-1), the CO molecular gas traces an inner butterfly-shaped structure that is also revealed at NIR and MIR wavelengths as the region in which the shielded dust resides. The location and kinematics of the molecular component indicate that this material has formed after the different eruptions of Carinae.
1 introduction
Carinae is one of the most studied evolved and massive stars in the entire sky. Classified as a Luminous Blue Variable (LBV), Carinae is an eccentric (e = 0.9) massive binary system composed of a hypergiant blue star ( Carinae A) of 90 M⊙ and a hotter, less massive companion ( Carinae B, which is likely in a Wolf-Rayet phase) of about 3040 M⊙ (Damineli et al., 2019; Groh et al., 2012; Pittard & Corcoran, 2002; Teodoro et al., 2016). During the 1840s, Carinae experienced a dramatic outburst that is nicknamed The Great Eruption which ejected at least 40 M⊙ into the ISM (Morris et al., 2017), forming the well-known Homunculus Nebula (Gaviola, 1950).
The Homunculus Nebula is characterized by its expanding bipolar southeast-northwest morphology (with radial velocities reaching 650 km s-1 at the pole zones, and with an angular projected size of about 20′′ 10′′, see Figure 1 of González et al., 2010), and a high content of warm dust, which absorbs much of the optical light that is re-emitted at NIR (near-IR) wavelengths. The Homunculus nebula has been proposed to be the result of an extremely enhanced stellar wind prior to the merger of a massive close binary that produced the 90 M⊙ component (Portegies Zwart, & van den Heuvel, 2016; Smith et al., 2018; Hirai et al., 2021). This merger was stimulated by the gravitational interaction of what was then the third star in the system and now is the 30 M⊙ companion (Portegies Zwart, & van den Heuvel, 2016).
At (sub)millimeter wavelengths, several molecules have been reported to be associated with the circumstellar vicinities of Carinae (e.g., Gull et al., 2020). Loinard et al. (2012) reported the thermally excited CO, CN, HCO+, HCN, HNC, and N2H+, as well as several of their 13C isotopologues observed with the Atacama Pathfinder Experiment (APEX) 12 m single dish submillimeter telescope. In that study, the relative intensities of the multiple CO lines suggested that the molecular emission was more compact than the APEX beam (– Full Width Half Maximum i.e. FWHM), and probably was concentrated very close to the Homunculus Nebula. Subsequent interferometric observations of the HCN (10) line with the Australia Telescope Compact Array (ATCA) confirmed that the thermal molecular emission is indeed concentrated in the central few arcseconds around Carinae, and revealed a clear east-west velocity gradient of 150 km s-1(Loinard et al., 2016). Furthermore, more recent ALMA observations are interpreted to trace a disrupted molecular torus around Carinae, with expanding radial velocities of approximately 200 km s-1, and which seems to be aligned well with the equatorial warm dust around Carinae previously observed in the MIR (mid-IR) and NIR images (Smith et al., 2018). Similar molecular structures were later reported by Morris et al. (2020) using again ALMA observations, who advocated the view that the properties of the dust and CO emission may be measurably sensitive to changes in the amount of ultraviolet radiation escaping from the binary during periastron passage. In these ALMA CO(21) images, the disrupted molecular torus did not show its typical northwest aperture as reported in Smith et al. (2018). This was attributed to the sensitivity differences between the synthesized ALMA observations (Morris et al., 2020). Bordiu & Rizzo (2019) reported an asymmetric and more compact ( 1′′) molecular structure (traced by the HCO+) to the northwest of Carinae, and suggested that it likely was expelled in a second eruption. However, Abraham et al. (2020) proposed that this compact emission was instead arising from ionized gas traced by the recombination line H, not from the molecular line HCO+.
In the 1890s, Car underwent a second eruptive event (the minor eruption) from which an internal nebula was produced (see, for instance, Ishibashi et al., 2003; Smith et al., 2004). The so-called little Homunculus extends 2′′ along the symmetry axis, and expands currently at a speed of 250 km s-1. It is worth mentioning that the polar caps of the little Homunculus are not similar in any way to the external lobes of the large Homunculus. The polar caps in both structures are very different in position and excitation. The total mass expelled from the primary star during the minor event of about 0.1 M⊙, and a total kinetic energy of 1046.5 erg was released, which is a factor of 103 smaller than the corresponding value of the major eruption (1049.7 erg).
In this study, we present ALMA CO(32) observations with high angular resolution, and a superb sensitivity that reveal the innermost morphology, and kinematics of the multiple molecular structures associated with Carinae, and its real angular size.
2 observations
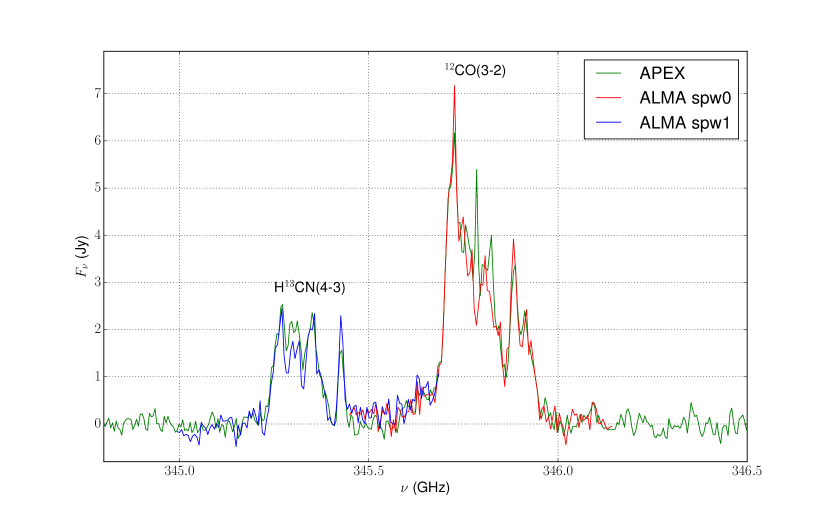
The observations were carried out with 41 antennas of ALMA in 2016 October during the Cycle 4 science data programme 2016.1.00585.S (P.I. Gerardo Pech-Castillo). These observations only included 12 m diameter antennas, which yielded projected baselines from 18.6 to 1800 m (14.3 1384 k). The FWHM of the primary beam is 16.5′′ at this frequency (Band 7), so that the bulk of the molecular and dusty material associated with Carinae is well-covered (e.g. Loinard et al., 2016; Mehner et al., 2019). We are aware that maybe some faint molecular structures far from the central region of Carinae could be lost; however, a comparison between the APEX (Loinard et al., 2016), and ALMA CO(32) spectra does not reveal an extended component for this source, see the Appendix, Figure 6.
The phase center was located in the sky position = , and = with a total integration time on source of 11 min. The maximum recoverable scale for these observations is 1.5′′ although the minimum baseline corresponds to an angular scale of 14′′.
With an average system temperature of about 140 K and with precipitable water vapor column around 0.57 mm, the observations were made in optimal conditions. In order to reduce the atmospheric phase fluctuations during the observations, the 183 GHz water line was monitored with water vapor radiometers (WVR). The quasars J05384405, J11074449, J10476217, and J10325917 were used as the amplitude, atmosphere, bandpass, pointing, gain fluctuations, and WVR calibrators. Some of the quasar scans were repeated for different calibrations.
The ALMA digital correlator was configured in four spectral windows of width 937.5 MHz and 3840/1920 channels each. This provides a channel spacing of 244.141 kHz (0.21 km s-1) and 488.281 kHz (0.42 km s-1), respectively. However, given the broad range of the CO velocities ( 300 to 270 km s-1), we smoothed the channel spacing to 5 km s-1. The four spectral windows were centered at rest frequencies of 345.817 GHz, 345.362 GHz, 354.859 GHz, and 356.757 GHz intended to detect four rotational lines, CO (32), H13CN (43), HCN (43), and HCO+ (43). All these spectral molecular lines have been already reported to be present in the vicinities of Carina (Loinard et al., 2012, 2016; Bordiu & Rizzo, 2019). In this paper, we concentrated only on the CO(32) emission, the remaining molecules have already been studied by Bordiu & Rizzo (2019) or will be presented in a more dedicated future study. We have revised very carefully the spectra of the CO(32) to avoid a possible contamination of the H13CN (43), especially at high positive velocities ( 270 km s-1). However, we do not find such contamination. But, there could be some faint H13CN (43) line contamination in the spectral channels in the range between 210 and 270 km s-1, and in a very low level.
We used the Common Astronomy Software Applications (CASA) package, Version 4.7, to calibrate, image, and analyze the ALMA data. We also used some routines in Python to image the data (Astropy Collaboration et al., 2013). The task TCLEAN in CASA was used for imaging the data. We set the Robust parameter of TCLEAN equal to 0.5.
The line image rms-noise is 2.5 mJy beam-1 km s-1 at an angular resolution of 0.17′′ 0.13′′ with a PA of 59∘. The ALMA theoretical rms noise for this configuration, integration time, bandwidth (channel spacing), and frequency is about 2.2 mJy beam-1 km s-1, which is also very close to the value we obtain in the line images. Phase self-calibration was done using the continuum emission as a model, and then we applied the solutions to the line emission. We obtained about a factor of ten of improvement in the continuum rms-noise, and a factor of seven of improvement in the channel line rms-noise. These noises levels allow us to reveal new CO features associated with Carinae as compared to the ALMA CO (32) maps presented in Bordiu & Rizzo (2019) with a channel cube rms-noise of 15 mJy beam-1 km s-1 or in Morris et al. (2020) with a channel CO(21) cube rms-noise of 32 mJy beam-1 km s-1.
3 Results and Discussion
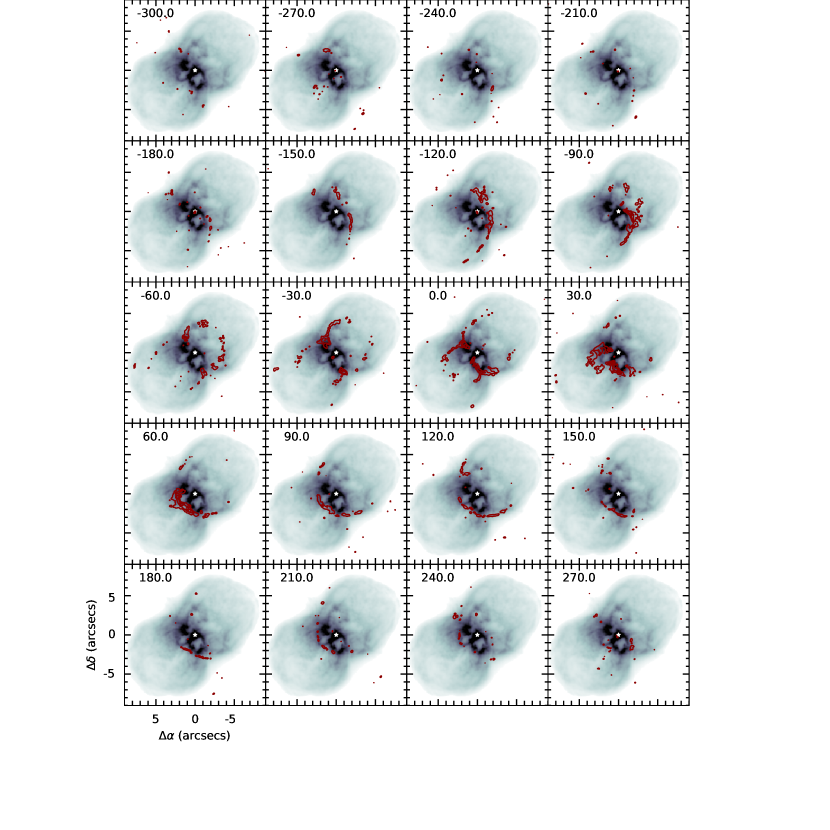
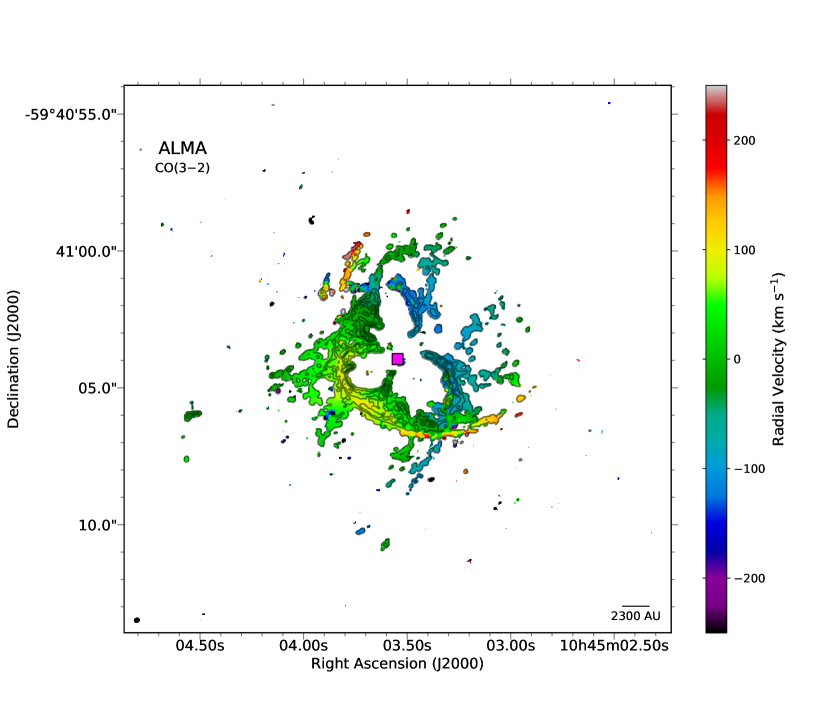
In Figure 1, we present the moment zero and one maps of the CO(32) emission detected with ALMA in the surroundings of Carinae. This map was computed using only radial velocities from 300 to 270 km s-1. Some compact molecular features are seen beyond these velocities, and are localized far from Carinae, possibly originating from faint molecular lines far from the CO rest frequency. In particular, some of these compact features with not so high-velocity (300 km s-1 Vel. 270 km s-1) are mostly associated with the Homunculus Nebula as we will demonstrate with the next set of images. These high-velocity structures are not seen in the recent ALMA maps, as for example in Smith et al. (2018), who detected strong CO emission only in a reduced velocity window from 100 to 150 km s-1. Their channel cube rms-noise is about a factor 10 higher (21.6 mJy beam-1 km s-1). Moreover, Morris et al. (2017) also detected hotter CO velocity emission with Herschel/HIFI only over the window of 150 to 150 km s-1 at main beam rms noise of 0.06 K. Our maps reveal a mix of radial velocities with blue- and red-shifted CO emission in both sides of the nebula, and with an elongated structure in the direction of the Homunculus Nebula and with an angular size of about 15′′ 10′′. This is a bit different from what is reported in Smith et al. (2018) or Morris et al. (2020), who find lower-velocity redshifted components to be mostly localized at the southeast side, and the blueshifted velocities are in the northwest side of the molecular disrupted roundish torus or shell. This is likely due to our better sensitivity, and high angular resolution, which allow us to trace and resolve fainter structures. Three main features are revealed from this figure, we describe them as follows:
-
•
A thin redshifted well-defined open arc-like structure in the southeast of Carinae, and that extends to its northwest. It is open toward the NW. This structure has the largest redshifted velocities found in this study (270 km s-1). The thin width of the open arc-like structure is about one synthesized beam, that in spatial scales corresponds to about 350 au. This structure has a very good correspondence with the redshifted expanding horseshoe or disrupted torus reported in Smith et al. (2018). On the other hand, given the extent of this thin arc, the redshifted structure could be tracing the innermost NE lobe of the Homunculus by limb brightening. Another possibility for enhanced emission along this geometry is the intersection of the skirt with the Homunculus so that higher emission is observed along our line of sight. In Figure 7, in the Appendix, we illustrate the three different structures possibly associated with the CO emission
-
•
The Butterfly structure with four wings well delineated. While the northern wings are blueshifted with respect to the velocities close to eta-Carina’s systemic LSR velocity, = 19.7 km s-1 (Artigau et al., 2011), the southern wings are preferentially redshifted. Each of these CO wings have more complex internal velocity variations, possibly indicating an intricate 3D structure. The radial velocities associated with this structure are closer to systemic in a range of 100 to 100 km s-1. The edges of the butterfly wings point toward the position of the central star of Carinae. The Butterfly is present in all previous ALMA maps Smith et al. (2018); Morris et al. (2020); Bordiu & Rizzo (2019).
-
•
Faint filaments with velocities that are blueshifted relative to and close to Carinae’s systemic velocity are located in the southeast side of the star. The filaments extend over roughly a few arseconds, and are far from the Butterfly nebula. The filaments are present at both southern edges of the nebula.
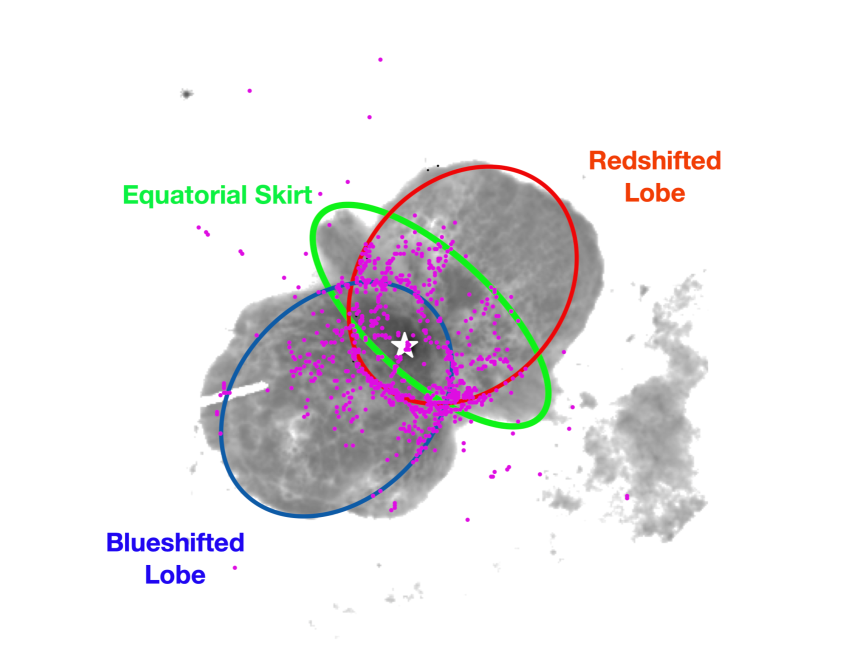
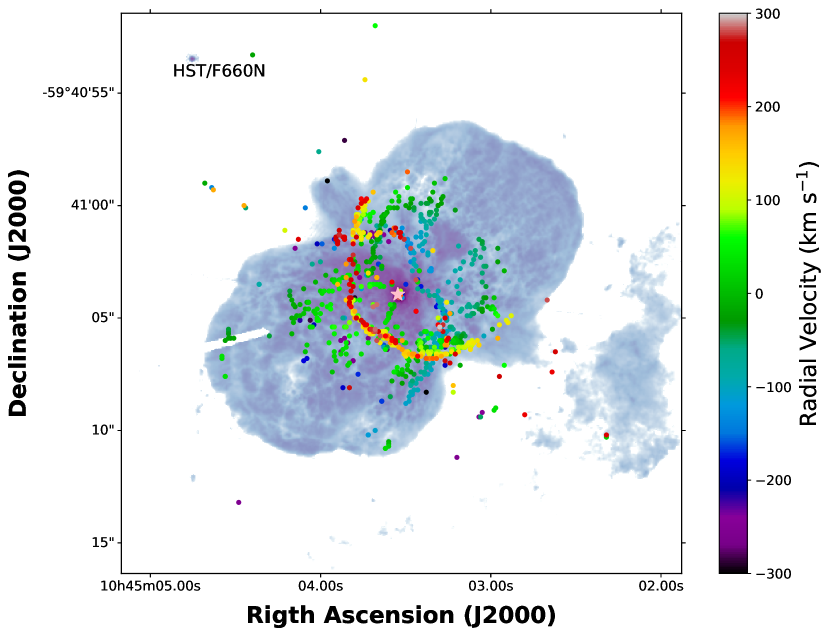
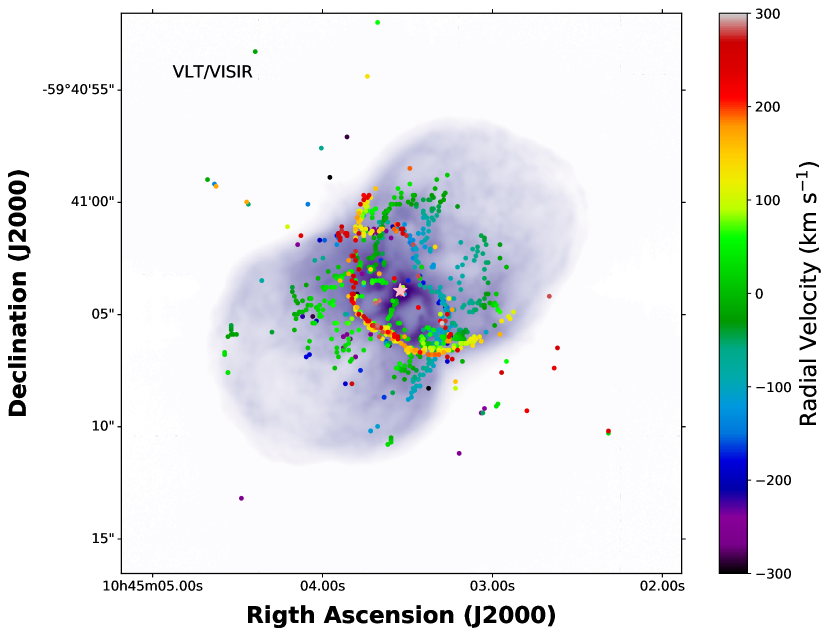
In Figure 2, we have overlaid the CO emission on the optical and infrared images. The optical image was retrieved from the archive of the Hubble Space Telescope using the Advanced Camera for Surveys (ACS) instrument with filter 660N. For the infrared image, we used one obtained at 7.9 m with the Very Large Telescope using the Imager and Spectrometer for mid-InfraRed (VISIR), this infrared image was obtained from Mehner et al. (2019). The CO data (in form of colored dots) were extracted from the channel spectral cube using a Gaussian fitting to every compact condensation employing the MIRIAD task IMSAD, then plotted in both figures. We regarded a compact CO condensation as a real entity when its flux density was higher than 8 with equal to 2.5 mJy beam-1 km s-1. The resulting CO structure agrees very well with that revealed in the moment zero and one (Figure 1). The low intensity sources have sizes around one synthesized beam. The three molecular structures described in Figure 1, the disrupted torus, the Butterfly, and the filaments are all clearly discernible in these figures. For the case of the disrupted torus, this configuration is clearly tracing the edge of the northwest lobe of the Homunculus Nebula. At optical wavelengths, the northwest lobe shows similar redshifted emission but with larger radial velocities that reaches 700 km s-1 at the poles (Smith et al., 2018; Artigau et al., 2011). These structures are tracing the edges of the lobes and are very likely produced due to limb-brightening effects. On the other hand, the blueshifted lobe does not show a similarly coherent structure. It rather has some partially detected parts of the blueshifted filaments to the southwest of the Homunculus nebula. In the channel map of Figure 5 (e.g., at 120 km s-1) the southwest part of the filament is clearly identified. These limb-brightened edges likely trace regions in which the line-of-sight runs tangentially along a large column of material lying on the walls of the Homunculus Nebula, which, as is well known, presents an overall hour-glass morphology. The blueshifted lobe shows a similar structure in the southwest part of the Homunculus (see channels with velocities 90 to 180 km s-1 in Figure 5). However, the northeast limb-brightened edge is not so clear in CO (e.g., velocity channels from 0 to 60 km s-1). Instead, there are some shreds of emission or CO etchings in the northeast surface of the Nebula, which may be tracing the limb-brightened structures at velocities closer to the LSR.
From the optical image it is clear that the CO emission associated with the Butterfly is located in the dark areas of the expanding equatorial structure. This is confirmed in the lower panel of Figure 2, where we show the MIR emission from Carinae. In this panel, one sees an excellent correlation between the CO emission in the wings of the Butterfly and the MIR emission. However, the MIR emission is located in the inner parts of the wing of the Butterfly, likely due to dust shielding.
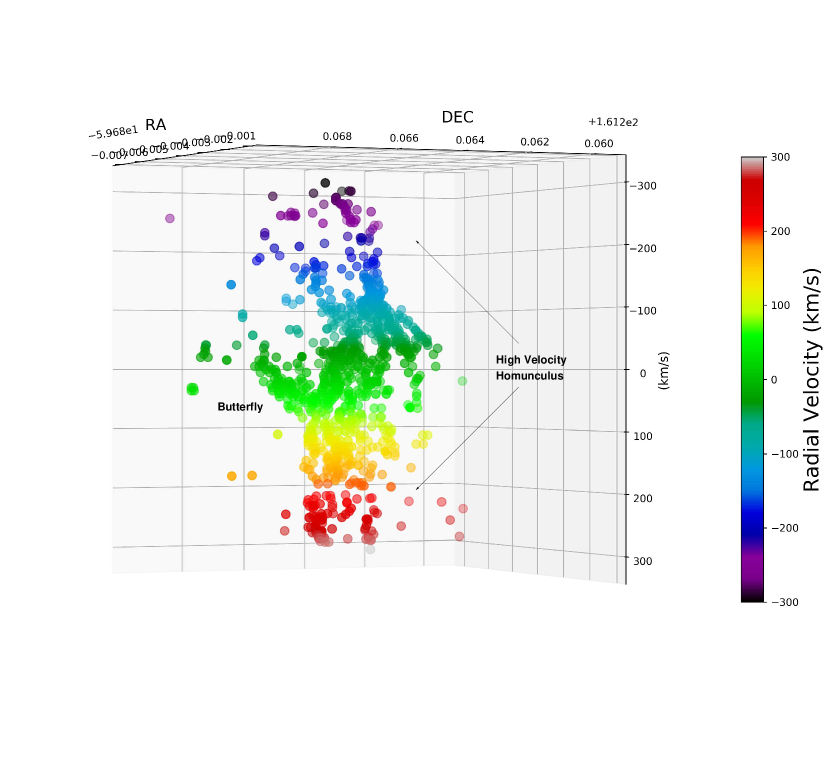
In Figure 3, a three-dimensional view of the CO emission in Carinae is presented. Here, we recall that we assume that the radial velocity is proportional to the distance, so the third dimension is considered a space-dimension. This illustration has three axis, the Right Ascension (R.A.), the Declination (DEC.), and the radial velocity (in km s-1) of the thermal emission. This illustration reveals the gas kinematics of the three molecular structures traced by these observations: The Butterfly, The Homunculus Nebula, and the filaments. This illustration shows that some regions of the bipolar structure of the Homunculus Nebula are associated to the CO emission. The Butterfly is a chain of filaments aligned with the central position of Carinae. The kinematics found in the wings of the Butterfly (lower absolute radial velocities than the CO belonging with the Homunculus) suggest that these structures may lie closer to the equatorial plane of the Homunculus, that is, inclined 41∘ (Smith, 2006) with respect to the plane of the sky. In this scenario, the blueshifted wings seem to lie on the northwest part of the equatorial plane (channels from 60 to 150 km s-1), while the redshifted wings would be on the opposite southeast side of that same plane (channels from 0 to 150 km s-1). To illustrate this situation, we show in the Appendix slices of the channel velocity cube (see, Figure 5).
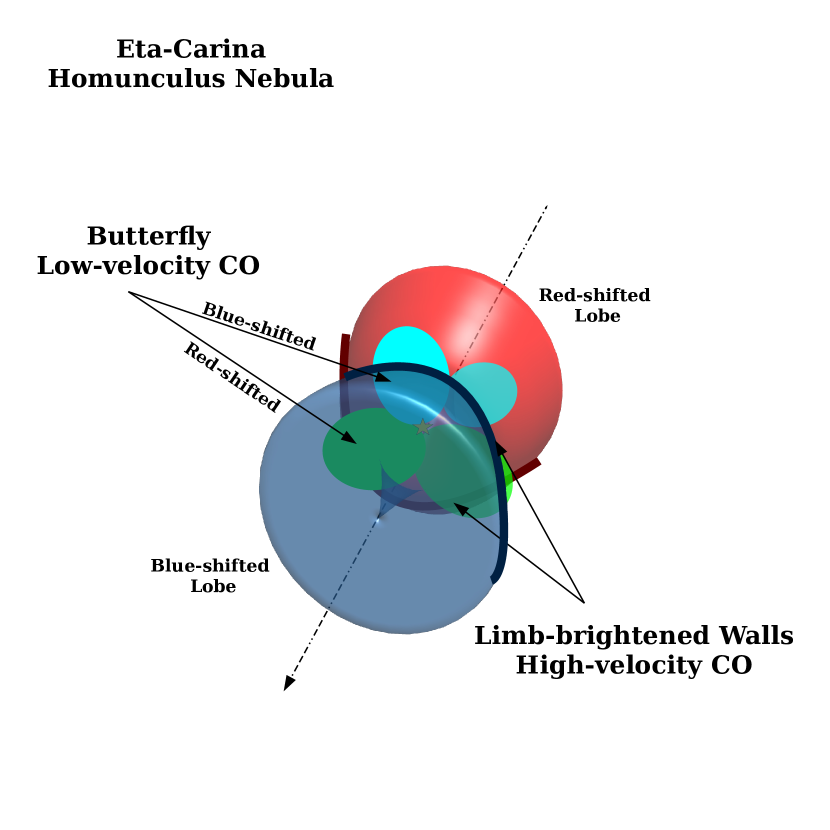
A cartoon of the different parts and orientations of the Carinae Nebula is presented in Figure 4. In this image, we draw the different molecular structures traced by this work and revealed by the ALMA observations.
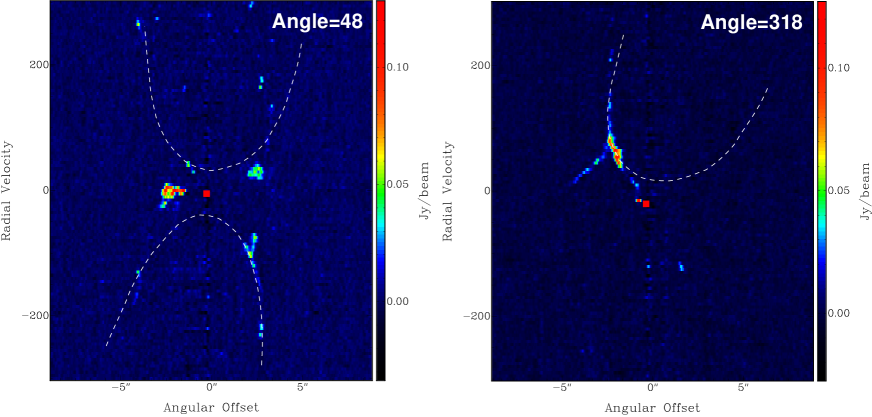
In Figure 8, we have computed two Position-Velocity diagrams across and along the Homunculus Nebula and passing over the position of Eta Carinae. These Figures reveal bipolar structures associated with the molecular emission arising from the Homunculus Nebula. These structures are also observed in the 3D animation. Similar structures are also observed in H2 tracing the Homunculus (Smith et al., 2004).
Finally, assuming that the CO(32) line emission is optically thin and in local thermodynamic equilibrium, we estimate the outflow mass using the following equation (see, Cortes-Rangel et al., 2020), adapted for the J=32 transition:
where we used 2.8 as mean molecular weight, and the abundance ratio between the molecular hydrogen and the carbon monoxide (104, e.g. Scoville et al., 1986), is in units of K and assumed to be 200 K (a value close the dust temperature in the Carinae Nebula), is the average intensity integrated over velocity with a value of 0.1 for the contour of redshifted side of the Homunculus, and are the projected major and minor axes of the outflow lobe, and is the distance to the source, 2.3 kpc (Smith & Brooks, 2008). We estimate a mass for the redshifted contour of the Homunculus 0.001 M⊙. This mass value is highly uncertain, as is discussed in Smith et al. (2018), mainly due to the standard CO/H2 number ratio of 10-4 used here. Moreover, H2 mass in the nebula seems to be a changing quantity over time, probably related to changes in the UV field. For example, Nota et al. (2002) estimated a value for this number ratio (CO/H2) of 1.6 10-4 in the circumstellar environment of the LBV star AG Carinae. Therefore, we would like to stress the uncertainty of this estimate of the molecular gas mass in Carina. In any case, this mass reported here is however negligible compared the total mass of the Homunculus Nebula, see Morris et al. (2017).
Finally, we do not find evidence for a molecular counterpart of the little Homunculus reported in Ishibashi et al. (2003).
4 Summary
In conclusion, the sensitive and high spatial resolution of the ALMA observations of Carinae have revealed, for the first time, higher velocity CO emission than previously reported. We interpret the arc of emission exhibiting velocities over the range of 300 to 300 km s-1 to be associated with the bipolar lobes observed in the optical. The CO emission is found to delineate very well the innermost contour of the redshifted lobe likely due by limb brightening or possibly arising in the intersection of the skirt with the Homunculus in our line of sight so that we see higher emission measure. At systemic velocities the thermal emission from the CO is found close to Carinae and in the expanding equatorial structure revealed also at optical wavelengths. The wings of the Butterfly are correlated with the dark dusty patches observed at optical wavelengths and that are bright in the MIR maps. There is a shift between the wings of the Butterfly mapped in the MIR and CO, likely because the molecules are shielded from UV radiation. Additionally, filamentary blueshifted CO emission is also found associated with the Homunculus Nebula. A map of the 3D molecular emission in the vicinities of Carinae is presented and reveals a structured morphology associated with the Homunculus and the Butterfly. We would like also to thank the referee
References
- Artigau et al. (2011) Artigau, É., Martin, J. C., Humphreys, R. M., et al. 2011, AJ, 141, 202. doi:10.1088/0004-6256/141/6/202
- Abraham et al. (2020) Abraham, Z., Beaklini, P. P. B., Cox, P., et al. 2020, MNRAS, 499, 2493. doi:10.1093/mnras/staa2907
- Astropy Collaboration et al. (2013) Astropy Collaboration, Robitaille, T. P., Tollerud, E. J., et al. 2013, A&A, 558, A33.
- Bordiu & Rizzo (2019) Bordiu, C. & Rizzo, J. R. 2019, MNRAS, 490, 1570. doi:10.1093/mnras/stz2621
- Cortes-Rangel et al. (2020) Cortes-Rangel, G., Zapata, L. A., Toalá, J. A., et al. 2020, AJ, 159, 62. doi:10.3847/1538-3881/ab6295
- Damineli et al. (2019) Damineli, A., Fernández-Lajús, E., Almeida, L. A., et al. 2019, MNRAS, 484, 1325. doi:10.1093/mnras/stz067
- Hirai et al. (2021) Hirai, R., Podsiadlowski, P., Owocki, S. P., et al. 2021, MNRAS, 503, 4276. doi:10.1093/mnras/stab571
- Høg et al. (2000) Høg, E., Fabricius, C., Makarov, V. V., et al. 2000, A&A, 355, L27
- Gaviola (1950) Gaviola, E. 1950, ApJ, 111, 408. doi:10.1086/145274
- Gull et al. (2020) Gull, T. R., Morris, P. W., Black, J. H., et al. 2020, MNRAS, 499, 5269. doi:10.1093/mnras/staa3113
- Gooch (1996) Gooch, R. 1996, Astronomical Data Analysis Software and Systems V, 101, 80
- González et al. (2010) González, R. F., Villa, A. M., Gómez, G. C., et al. 2010, MNRAS, 402, 1141. doi:10.1111/j.1365-2966.2009.15950.x
- Groh et al. (2012) Groh, J. H., Hillier, D. J., Madura, T. I., et al. 2012, MNRAS, 423, 1623. doi:10.1111/j.1365-2966.2012.20984.x
- Ishibashi et al. (2003) Ishibashi, K., Gull, T. R., Davidson, K., et al. 2003, AJ, 125, 3222. doi:10.1086/375306
- Loinard et al. (2016) Loinard, L., Kamiński, T., Serra, P., et al. 2016, ApJ, 833, 48. doi:10.3847/1538-4357/833/1/48
- Loinard et al. (2012) Loinard, L., Menten, K. M., Güsten, R., et al. 2012, ApJ, 749, L4. doi:10.1088/2041-8205/749/1/L4
- McMullin et al. (2007) McMullin, J. P., Waters, B., Schiebel, D., Young, W., & Golap, K. 2007, Astronomical Data Analysis Software and Systems XVI, 376, 127
- Mehner et al. (2019) Mehner, A., de Wit, W.-J., Asmus, D., et al. 2019, A&A, 630, L6. doi:10.1051/0004-6361/201936277
- Morris et al. (2017) Morris, P. W., Gull, T. R., Hillier, D. J., et al. 2017, ApJ, 842, 79. doi:10.3847/1538-4357/aa71b3
- Morris et al. (2020) Morris, P. W., Charnley, S. B., Corcoran, M., et al. 2020, ApJ, 892, L23. doi:10.3847/2041-8213/ab784a
- Nota et al. (2002) Nota, A., Pasquali, A., Marston, A. P., et al. 2002, AJ, 124, 2920. doi:10.1086/343770
- Pittard & Corcoran (2002) Pittard, J. M. & Corcoran, M. F. 2002, A&A, 383, 636. doi:10.1051/0004-6361:20020025
- Portegies Zwart, & van den Heuvel (2016) Portegies Zwart, S. F., & van den Heuvel, E. P. J. 2016, MNRAS, 456, 3401.
- Scoville et al. (1986) Scoville, N. Z., Sargent, A. I., Sanders, D. B., et al. 1986, ApJ, 303, 416
- Smith et al. (2003) Smith, N., Gehrz, R. D., Hinz, P. M., et al. 2003, AJ, 125, 1458. doi:10.1086/346278
- Smith et al. (2004) Smith, N., Morse, J. A., Gull, T. R., et al. 2004, ApJ, 605, 405. doi:10.1086/382185
- Smith (2006) Smith, N. 2006, ApJ, 644, 1151. doi:10.1086/503766
- Smith & Brooks (2008) Smith, N. & Brooks, K. J. 2008, Handbook of Star Forming Regions, Volume II, 138
- Smith et al. (2018) Smith, N., Ginsburg, A., & Bally, J. 2018, MNRAS, 474, 4988. doi:10.1093/mnras/stx3050
- Teodoro et al. (2016) Teodoro, M., Damineli, A., Heathcote, B., et al. 2016, ApJ, 819, 131. doi:10.3847/0004-637X/819/2/131
In this Appendix we include the complete velocity channel map of the CO emission toward Carina and a comparison of the CO (32) spectra taken with APEX and ALMA, which shows a small lost of emission by the interferometer.