Unsupervised Sign Language Phoneme Clustering
using HamNoSys Notation
Abstract
Traditionally, sign language resources have been collected in controlled settings for specific tasks involving supervised sign classification or linguistic studies accompanied by specific annotation type. To date, very few who explored signing videos found online on social media platforms as well as the use of unsupervised methods applied to such resources. Due to the fact that the field is striving to achieve acceptable model performance on the data that differs from that seen during training calls for more diversity in sign language data, stepping away from the data obtained in controlled laboratory settings. Moreover, since the sign language data collection and annotation carries large overheads, it is desirable to accelerate the annotation process. Considering the aforementioned tendencies, this paper takes the side of harvesting online data in a pursuit for automatically generating and annotating sign language corpora through phoneme clustering.
1 Introduction
Research in sign language has focused mainly on supervised learning with the aims of classifying phonological parameters [Liaw et al., 2002, Cooper and Bowden, 2007, Buehler et al., 2009, Buehler et al., 2010, Cooper et al., 2012, Koller et al., 2016], providing glosses for isolated signs [Gaolin Fang et al., 2004, Ong et al., 2014, Fagiani et al., 2015, Yin et al., 2015, Mocialov et al., 2017a, Bantupalli and Xie, 2018, Tornay et al., 2019], or translation of signed utterances that consist of multiple signs to written languages [Neidle and Vogler, 2012, S Kumar et al., 2018, Cihan Camgoz et al., 2018, Ko et al., 2019].
Despite the field being mainly approached with supervised methods, few attempts have been made to model sign language using unsupervised methods [Papapetrou et al., 2009, Östling et al., 2018] and these are mainly for data mining.
The aim of this work is to exploit sign language resources available on social media and cluster segmented phonemes without access to transcriptions during clustering. Two clustering methods are compared, one is the general DBSCAN clustering method [Witten and Frank, 2002] and another one is iterative grouping clustering method. Experiments show that it is possible to find similar phonemes in continuous signing data using clustering approach with linguistically liable distance metric based on phonological parameters.
2 Related Work
Deldjoo et al. [Deldjoo et al., 2016] build a recommendation system based on the extracted visual features from the videos, such as lighting, colour, and motion. Snoek et al. [Snoek et al., 2009] and Hu et al. [Hu et al., 2011] identify colour, texture, shape, objects, and movements as features to serve as a basis for video indexing and retrieval. Furthermore, the extracted features can be grouped across the temporal dimension and used for querying similar groups during data mining. Other methods create specialised groups, such as human actions and can vary depending on the application. Unknown patterns within the groups are usually found through clustering.
Karypis et al. [Karypis and Kumar, 2000] identify bottom-up and top-down approaches to clustering. In the bottom-up approach, every element is assigned to an individual cluster and then clusters are merged in the iterative process. In the top-down approach, every element is in the same cluster and then the cluster is split into different clusters. The merging and splitting are done using a similarity metric with bottom-up approach being more common. Cluster quality can be assessed by measuring the inter-cluster entropy or relationship between the precision and recall. When no external information about the clusters is available, the inter- and intra-cluster cohesion can be used to evaluate the quality of the clusters [Corral et al., 2006].
Ertöz et al. [Ertöz et al., 2003] describe a range of clustering methods, outlining their advantages and disadvantages and pointing out to the fact that it is difficult to design a clustering algorithm that would be able to identify non-globular clusters of different sizes in the presence of outliers without having a bias towards one or another type of clusters. Moreover, by increasing the dimensionality of the data that needs to be clustered, the similarity metric becomes more uniform, which leads to poor clustering.
Recently, Dwibedi et al. [Dwibedi et al., 2020] used pre-trained ResNet [He et al., 2016] for image recognition in an end-to-end model that generates embeddings for each frame of a video, which are then used in generating affinity matrix for the whole video. Finally, the model uses Transformer architecture [Vaswani et al., 2017] for predicting whether each frame belongs to a repetition or not. This process is more general and can be applied to any video in order to find repetitions in that video.
Despite the necessity for general purpose video clustering methods, this work extracts linguistic information from the signing videos during the pre-processing, reducing the data complexity and clustering linguistic features specific to sign languages.
3 Data
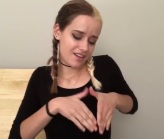
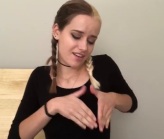
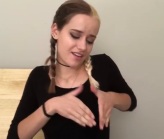
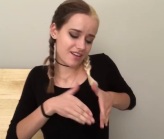
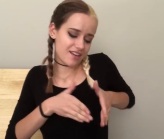
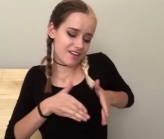
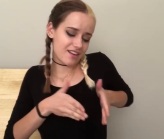
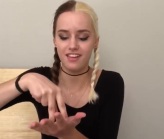
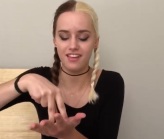
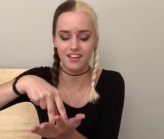
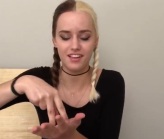
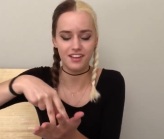
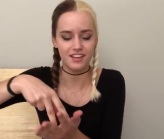
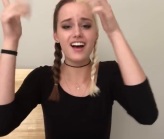
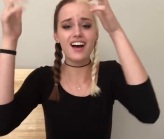
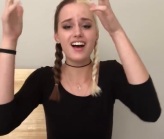
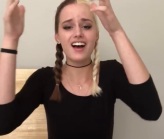
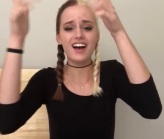
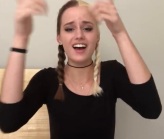
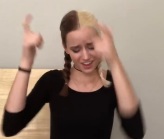
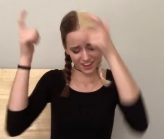
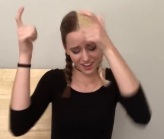
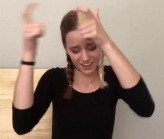
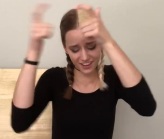
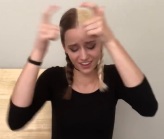
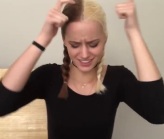
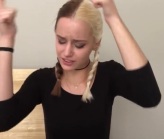
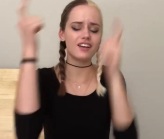
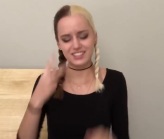
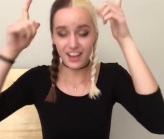
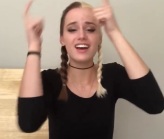
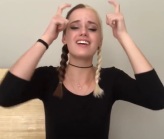
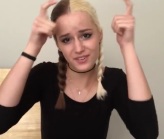
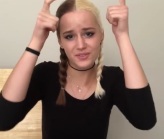
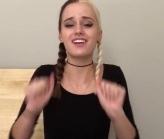
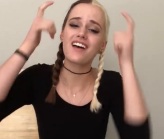
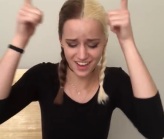
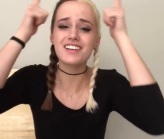
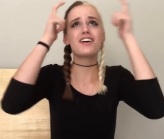
Four videos of different signers interpreting the song ‘Halo’ by Beyoncé in the American Sign Language (ASL) were collected from YouTube with average time length of 4 minutes 22 seconds. The audio of the song plays in the background, the lyrics of which were used as ground truth when referring to the translation of what is being signed in the videos due to no knowledge of ASL.
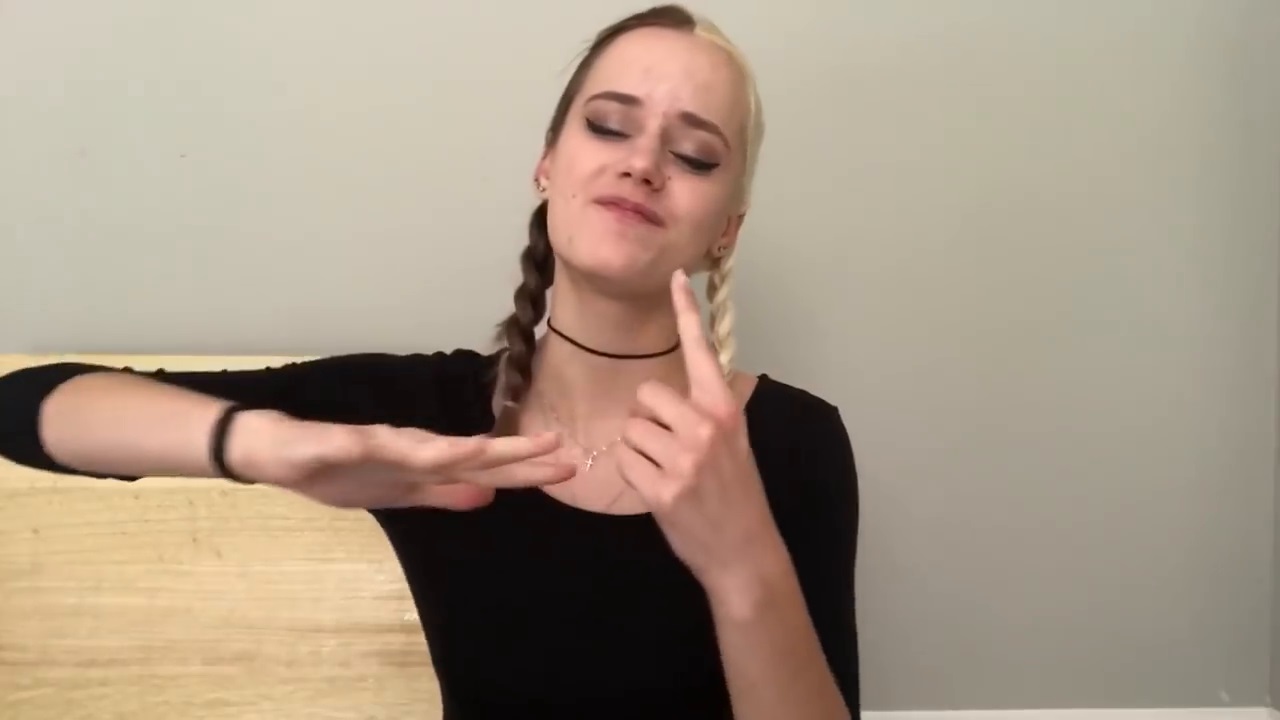
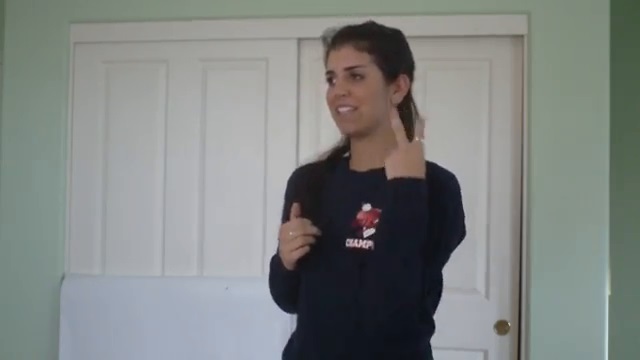
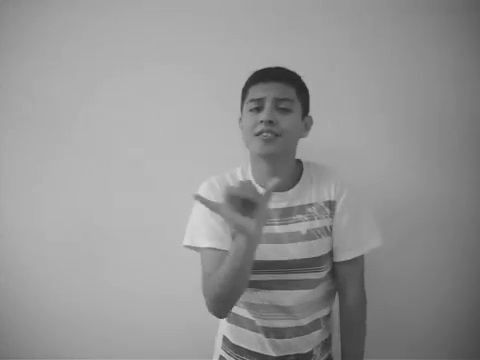
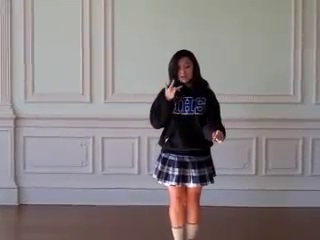
Figure 1 shows screenshots from the four collected videos. Due to the fact that the data is collected from online resources, it is more unpredictable than the corpora as described in [Schembri et al., 2013, Troelsgård and
Kristoffersen, 2018, Crasborn et al., 2017] that was collected in controlled environments. After a short qualitative analysis of the collected videos, the following factors were noted to vary across videos:
•
Video aspect ratio
•
Video quality
•
Camera proximity
•
Background
•
Body orientations
•
Dialects
•
Signing fluency
This work takes advantage of the nature of the data since music usually has verses, which repeat themselves over a course of a song. This is useful when performing clustering since it can be assumed that every verse could belong to the same cluster.
4 Methodology
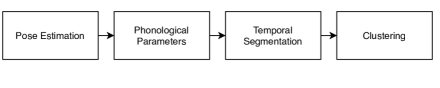
4.1 Pose Estimation
We process raw signing video and estimate the pose and the hand of a signer by using the OpenPose pose estimation library [Wei et al., 2016, Simon et al., 2017, Cao et al., 2017, Cao et al., 2018]. The library detects 2D anatomical key-points, associated with the human body and hands in every frame. The library provides (x,y) key-points for every part of the hand and key-points for the whole body skeleton.
Due to the fact that there are variations in videos listed in Section 3, normalisation similar to Fragkiadakis et al. [Fragkiadakis et al., 2020] is applied to extracted key-points to force fixed shoulder distance in all videos by resizing all positions of the inferred key-points and bring the signer to the centre of the screen by adding the difference between desired and current positions , where and are the resize ratio and translation pixels. Such normalisation counteracts the fact that the signers appear at different distances away from the camera.
4.2 Phonological Parameters
Stokoe identified phonological parameters such as hand movement, hand location relative to the body, hand and extended finger orientation, and non-manual gestures such as facial expressions, all used simultaneously during signing [Stokoe et al., 1976]. HamNoSys [Hanke, 2004] is one of the notation systems for sign language that has been proposed over the time to record the use of phonological parameters during signing. The notation aims to enumerate hand shape observations from all sign languages and presents combinations of palm curvature, extent of the thumb, and finger configuration to describe a handshape. As for the orientation and location phonological parameters, the orientation is split into extended finger direction and palm orientations, which can point to either of the four cardinal directions. Location, on the other hand, defines specific body parts (e.g. shoulder, head, etc.) and uses those relative body locations to identify the hand location. Movement categorises hand movement types and movement speeds. Using the key-points from the first stage, the extended finger orientation and the hand location relative to the body for both right and left hands are estimated for every frame, following the HamNoSys notation system as was reported in [Mocialov et al., 2020]. The orientation phonological parameter is divided into eight categories using trigonometry where and are the coordinates of the radius and middle finger metacarpal bones. Relative hand location is estimated using Euclidean distance between identified key-points and distance matrix is generated
where are the Euclidean distances between body parts key-points and is hands centroid of all hand key-points provided by the OpenPose library.
4.3 Temporal Segmentation
Using the key-points from the first stage, phonemes are segmented in a continuous signing as described in [Mocialov et al., 2017b]. The method splits continuous signing by tracking speed and making a split at time when the hand movement either slows down or accelerates as it has been observed that the signing speed is different from that of the epentheses.
4.4 Clustering
The similarity of two phonemes () is then evaluated by comparing their phonological parameters using a threshold value . Both phonemes should have similar phonological parameters ( ) for the phonemes to be considered similar.
To realise the comparison of the phonemes, the weighted Levenshtein distance [Rajalingam and Ranjini, 2011] is used to measure the difference between two phonemes, which finds the minimum number of edits where an edit can be a substitution or deletion of phonological parameter and the weights determine the cost of such edits. Since the majority of clustering algorithms operate on the affinity matrices, where every item corresponds to a distance between the two items, a distance metric is needed for the orientation and location phonological parameters. The orientation phonological parameter is divided into eight equal ranges, as described in Section 4.2, while the location phonological parameter is divided into three ranges (eye, shoulder, abdomen levels). Therefore, the orientation distance range is between 0 and 4 while the location distance range is between 0 and 2, as shown in Figure 3. Distances between the two items also become the weights for weighted Levenshtein distance matrix.
Since there is no way of knowing how many similar phonemes there are in a video prior to watching the video, the clustering approach selected should not assume the number of clusters. Two clustering methods will be compared. The first clustering method is an iterative grouping clustering, which iterates a list of phonemes, compares them and puts the two similar phonemes into the same cluster and repeats until all the phonemes are have been iterated. The second clustering method is the general clustering method DBSCAN. This density-based clustering method searches its neighbourhood for the members of the same cluster and can detect arbitrary-shaped cluster shapes. For the DBSCAN, the number of samples in the neighbourhood was modified for an item to be considered a core item using fixed since the largest distance between the two phonemes is in range. The complexity of both algorithms is [Schubert et al., 2017].
4.5 Matching Consecutive Sequences of Phonemes
Phonemes carry little to no linguistic meaning when viewed separately as they are very short (majority of 3 frames length as shown in Figure 4). Therefore, the same phoneme similarity measure, as described in Section 4.4 is applied to a chain of consecutive phonemes in an attempt to find similar signs or even phrases in continuous signing videos. This approach works in an iterative manner. The list of phonemes is iterated and each combination of consecutive phonemes is compared to another combination of consecutive phonemes elsewhere in the video, combining consecutive phonemes if they are similar. The process is repeated until no new combinations are found.
5 Results
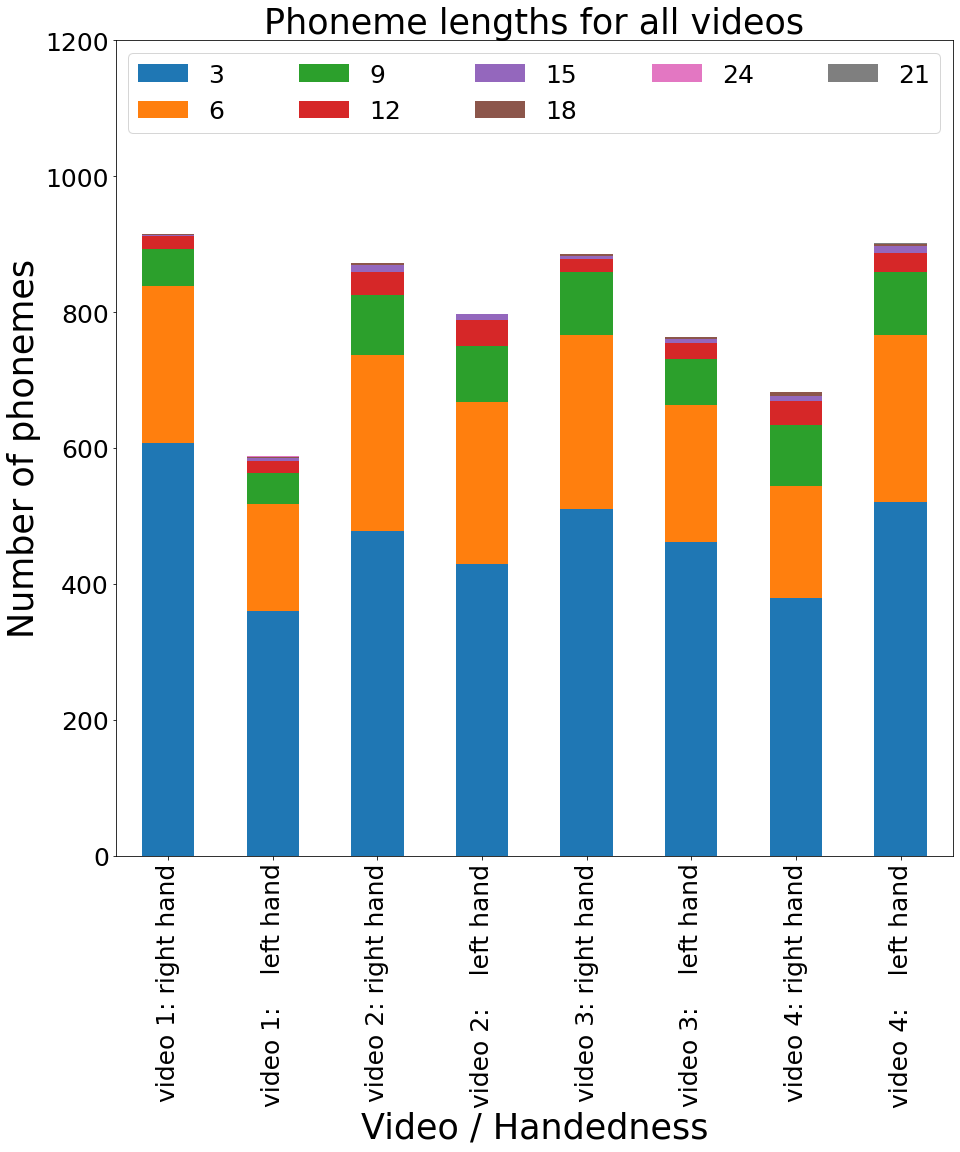
Figure 4 shows the total number of phonemes for each video, as well as, the number of phonemes of particular lengths measured in the number of frames for each video. The figure shows that using the same phoneme segmentation method on different videos produces slightly different results. For example, video 4 has fewer phonemes identified for the right hand as compared to other 3 videos. Similarly, video 1 has fewer phonemes identified for the left hand than other 3 videos. Moreover, the largest share of the overall number of phonemes belongs to the short phonemes consisting of three and six frames, while the average sign length has been reported to be of 3 seconds, or 75 frames in [Lichtenauer et al., 2008].
5.1 Phoneme Clustering Analysis
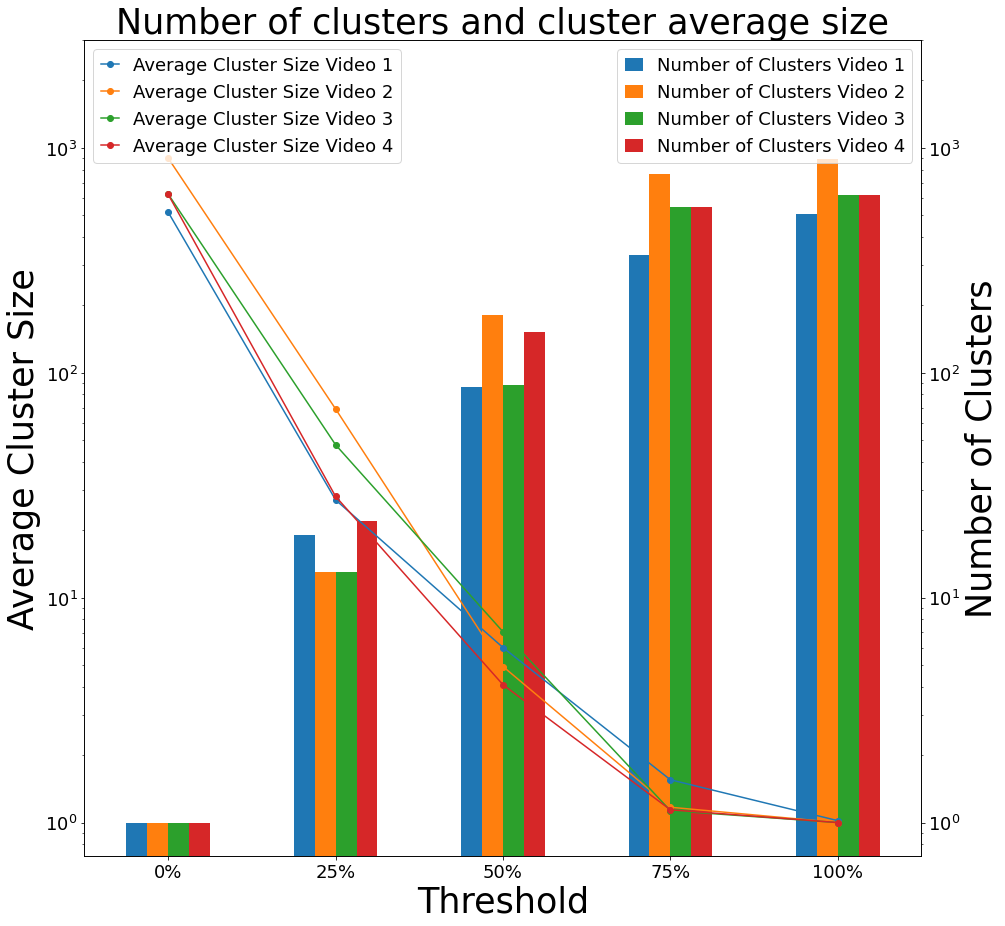
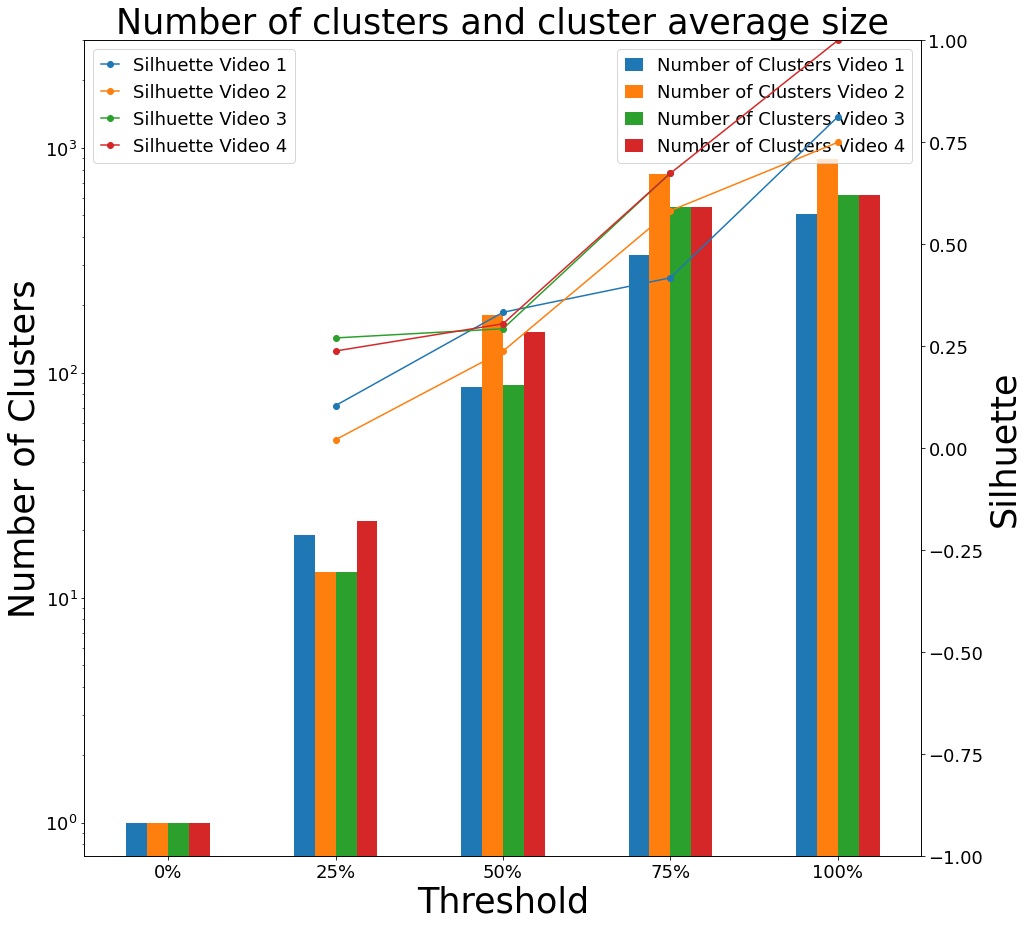
This section shows how relaxing the phoneme similarity metric defined in Section 4.4, affects the number of clusters and the cluster sizes with both the DBSCAN and the proposed grouping methods.
Figure 5 (a) shows identified clusters and their average sizes with varying phoneme similarity threshold. Setting the threshold to 0%, puts all the phonemes in one cluster, whereas setting the threshold to 100% results in almost every phoneme being assigned to an individual cluster. This means that throughout each video, there are very few similar phonemes using proposed distance metric. This supports the fact that sign languages are fluid and the same sign can have inter-signer [Lucas et al., 2002] as well as intra-signer [Bhuyan et al., 2006] variations.
(a) (b)
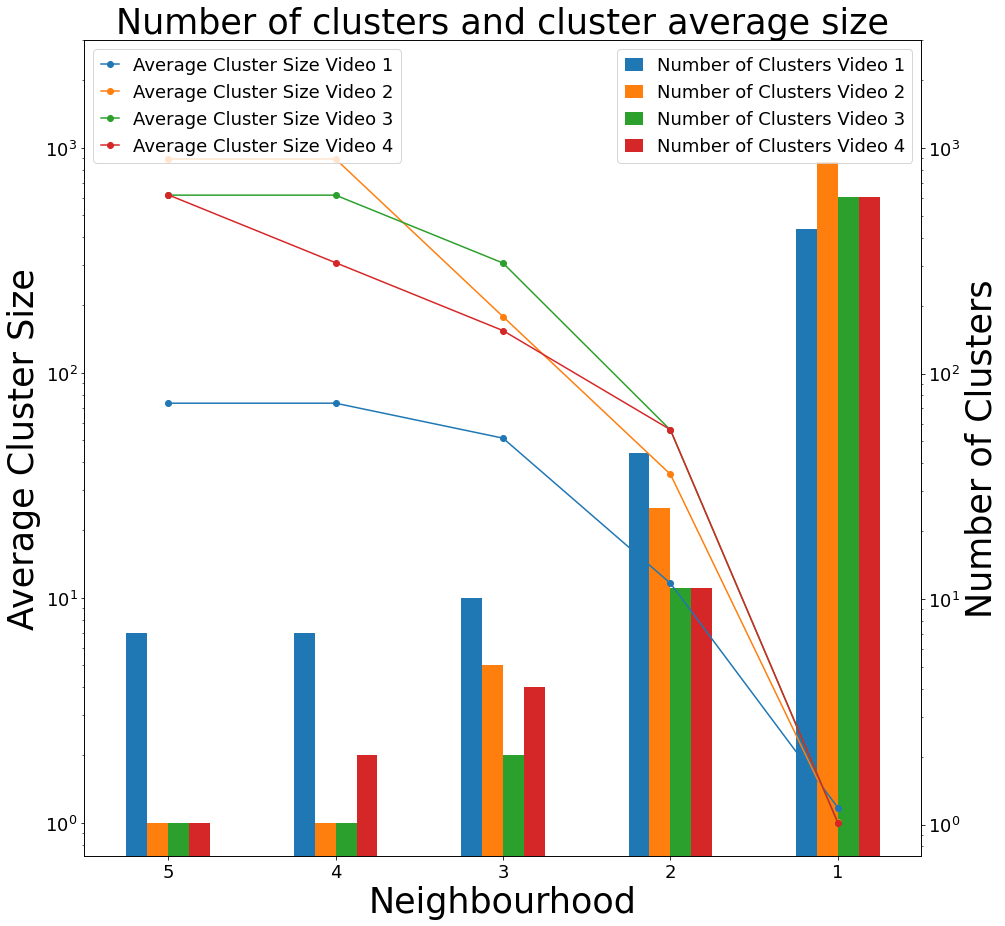
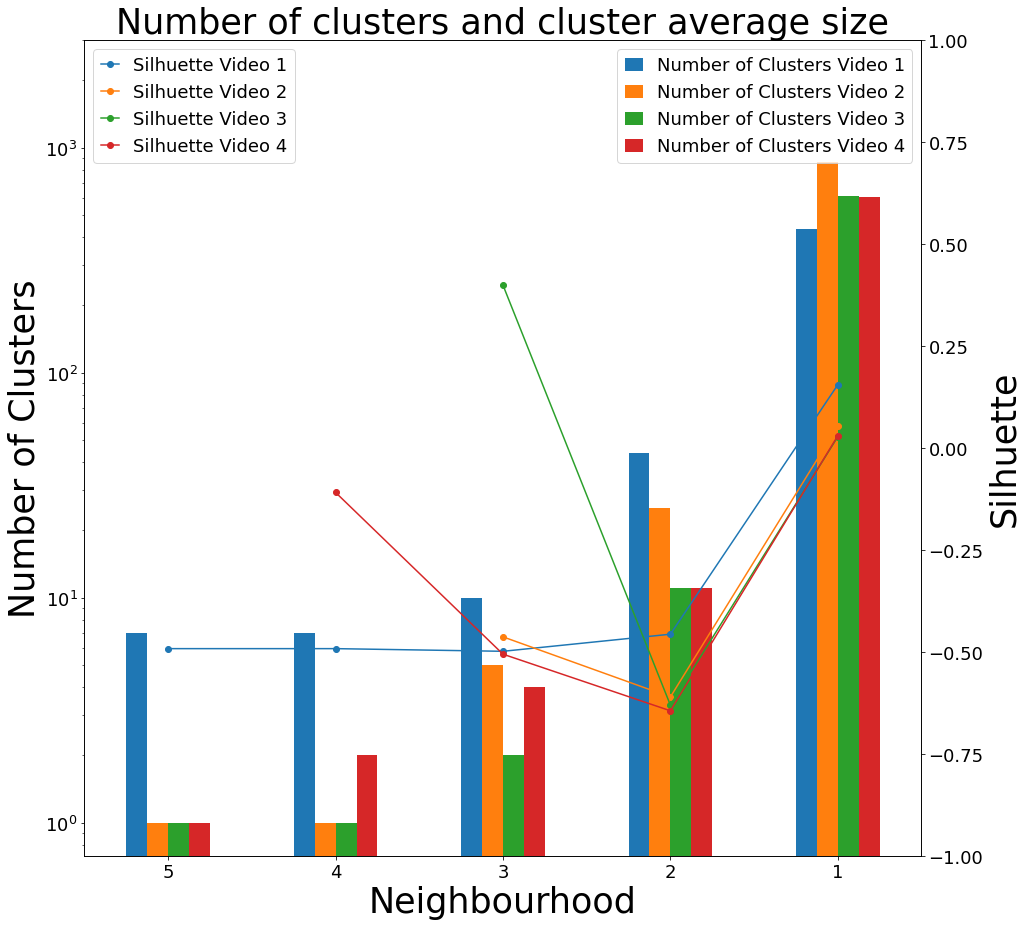
Similar behaviour is observed when clustering using the DBSCAN method, as can be seen in Figure 5 (b). As the neighbourhood size decreases, the number of clusters increase. However, it is important to notice the rate of change in the average cluster size as the similarity thresholds change (convex vs concave curve shape). Similarly, the rate of change in number of clusters is not as steep when clustered using the DBSCAN method (25%-75% vs 4-2 neighbours). This shows that the DBSCAN produces clusters where the number of phonemes are more uniformly distributed than with the grouping clustering method.
5.2 Quantitative Clustering Evaluation
Both DBSCAN and the proposed grouping clustering methods are compared using the Silhouette metric [Rousseeuw, 1987]. The Silhouette metric has been deemed to resemble human judgement [Lewis et al., 2012]. The metric is bound in range with signifying a good clustering results and indicating that the items in a cluster are assigned to the wrong cluster. represents many overlapping clusters in the data, which makes clustering challenging.
Figure 6 (a) shows how the Silhouette metrics changes with respect to the phoneme similarity threshold when using the proposed grouping clustering method. As the threshold is becoming more restrictive, identified clusters become clustered better at the expense of increasing number of clusters (Figure 5). Figure 6 (b) shows DBSCAN’s clustering performance with respect to the number of neighbours while having . The Silhouette coefficient is more volatile to the neighbourhood size and the number of identified clusters increases as the neighbourhood becomes smaller.
What is worth noting is that for every video, the proposed grouping clustering method has relatively similar Silhouette value while DBSCAN at and has very different Silhouette values for each video, which makes it unpredictable to use in the general case. On the other hand, having more uniformly distributed cluster sizes at different thresholds and relatively good Silhouette metric makes it an attractive clustering option for sign language data.
(a) (b)
5.3 Qualitative Clustering Evaluation
This section shows example phonemes from different clusters when clustered using the grouping method with the similarity threshold set to 50%.
Figure 7 shows visualisation of all the clusters for a single video when plotting two principal components on (x,y) axes. Clusters are identified using the iterative grouping method with 50% threshold. Figures below show two examples for each region of interest (red and violet).
From the Figures 8 and 9 it can be seen that the phonemes are visually similar where every phoneme is described with the location and orientation phonological parameters. It is worth noting that the meaning can or cannot be the same, but the phonological parameters are similar having at least 50% phoneme similarity.


5.4 Matching Consecutive Sequences of Phonemes
Single video is chosen to search for similar consecutive phonemes in different parts of the video. The lyrics in the background music in the video are used as the ground truth for verifying the results. Phoneme similarity threshold is chosen to be 50%.
| “I can feel your Halo, Halo, Halo. I can see your Halo, Halo, Halo |
| I can feel your Halo, Halo, Halo. I can see your Halo, Halo, Halo” |
As a result it can be seen that the same phoneme similarity approach described in Section 4.4 can be used to find similar consecutive phonemes in the same video as shown in Figure 10, where consecutive phonemes in (a) and consecutive phonemes in (b) correspond to the same lyrics from the song.
6 Conclusion
This work explored phoneme clustering for continuous signing videos obtained online using only location and orientation phonological parameters for phoneme comparison. An iterative grouping method and the DBSCAN methods were compared, showing that the DBSCAN is more unpredictable for the same signed content when the phoneme similarity conditions (neighbourhood) are relaxed. Nevertheless, DBSCAN has a more even distribution of identified clusters and the average cluster size when similarity conditions are relaxed as compared to the iterative grouping method. This work has shown that it is possible to use a linguistically viable distance metric for general purpose clustering algorithms to work on sign language data. To improve the clustering approach, it would be beneficial to include other phonological parameters, such as handshape and even non-manual features. In the future all the obtained interpretation videos for the same song will be clustered in order to compare phonemes from the same clusters across the different signers.
The benefit of using clustering on music videos is that it is possible to identify repeating patterns in videos, which correspond to verses in music. This knowledge can be used to generate datasets for the computational sign language models as more and more song interpretations in sign languages performed by different signers become available online. Moreover, such phoneme clustering approaches could be used during the resource annotation for linguistic purposes. Similar phonemes, signs, and even phrases could be identified in continuous signing videos prior to watching such videos.
References
- [Bantupalli and Xie, 2018] K. Bantupalli and Y. Xie. 2018. American Sign Language recognition using deep learning and computer vision. In Proceedings of the International Conference on Big Data (BigData), pages 4896–4899, Dec.
- [Bhuyan et al., 2006] MK Bhuyan, D Ghosh, and PK Bora. 2006. Continuous hand gesture segmentation and co-articulation detection. In Computer Vision, Graphics and Image Processing (CVGIP), pages 564–575. Springer.
- [Buehler et al., 2009] Patrick Buehler, Andrew Zisserman, and Mark Everingham. 2009. Learning sign language by watching TV (using weakly aligned subtitles). In Proceedings of the Conference on Computer Vision and Pattern Recognition (CVPR), pages 2961–2968.
- [Buehler et al., 2010] Patrick Buehler, Mark Everingham, and Andrew Zisserman. 2010. Employing signed TV broadcasts for automated learning of British Sign Language. In Proceedings of the Workshop on the Representation and Processing of Sign Languages.
- [Cao et al., 2017] Zhe Cao, Tomas Simon, Shih-En Wei, and Yaser Sheikh. 2017. Realtime multi-person 2d pose estimation using part affinity fields. In CVPR.
- [Cao et al., 2018] Zhe Cao, Gines Hidalgo, Tomas Simon, Shih-En Wei, and Yaser Sheikh. 2018. OpenPose: realtime multi-person 2D pose estimation using Part Affinity Fields. In arXiv preprint arXiv:1812.08008.
- [Cihan Camgoz et al., 2018] Necati Cihan Camgoz, Simon Hadfield, Oscar Koller, Hermann Ney, and Richard Bowden. 2018. Neural sign language translation. In Proceedings of the Conference on Computer Vision and Pattern Recognition (CVPR), pages 7784–7793.
- [Cooper and Bowden, 2007] Helen Cooper and Richard Bowden. 2007. Large lexicon detection of sign language. In Proceedings of the International Workshop on Human-Computer Interaction (HCI), pages 88–97.
- [Cooper et al., 2012] Helen Cooper, Eng-Jon Ong, Nicolas Pugeault, and Richard Bowden. 2012. Sign language recognition using sub-units. Machine Learning Research, 13(Jul):2205–2231.
- [Corral et al., 2006] Guiomar Corral, Albert Fornells, Elisabet Golobardes, and Jaume Abella. 2006. Cohesion factors: improving the clustering capabilities of consensus. In International Conference on Intelligent Data Engineering and Automated Learning, pages 488–495.
- [Crasborn et al., 2017] Onno Crasborn, Inge Zwitserlood, Els van der Kooij, and Richard Bank. 2017. A corpus-based lexical database for Sign Language of the Netherlands. Radboud University, Centre for Language Studies.
- [Deldjoo et al., 2016] Yashar Deldjoo, Mehdi Elahi, Paolo Cremonesi, Franca Garzotto, Pietro Piazzolla, and Massimo Quadrana. 2016. Content-based video recommendation system based on stylistic visual features. Journal on Data Semantics, 5(2):99–113.
- [Dwibedi et al., 2020] Debidatta Dwibedi, Yusuf Aytar, Jonathan Tompson, Pierre Sermanet, and Andrew Zisserman. 2020. Counting out time: Class agnostic video repetition counting in the wild. In Proceedings of the Conference on Computer Vision and Pattern Recognition (CVPR), June.
- [Ertöz et al., 2003] Levent Ertöz, Michael Steinbach, and Vipin Kumar. 2003. Finding clusters of different sizes, shapes, and densities in noisy, high dimensional data. In Proceedings of the 2003 SIAM international conference on data mining, pages 47–58. SIAM.
- [Fagiani et al., 2015] Marco Fagiani, Emanuele Principi, Stefano Squartini, and Francesco Piazza. 2015. Signer independent isolated Italian sign recognition based on Hidden Markov Models. Pattern Analysis and Applications, 18(2):385–402.
- [Fragkiadakis et al., 2020] Manolis Fragkiadakis, Victoria Nyst, and Peter van der Putten. 2020. Signing as input for a dictionary query: Matching signs based on joint positions of the dominant hand. In Proceedings of the LREC2020 9th Workshop on the Representation and Processing of Sign Languages: Sign Language Resources in the Service of the Language Community, Technological Challenges and Application Perspectives, pages 69–74, Marseille, France, May. European Language Resources Association (ELRA).
- [Gaolin Fang et al., 2004] Gaolin Fang, Wen Gao, and Debin Zhao. 2004. Large vocabulary sign language recognition based on fuzzy decision trees. IEEE Transactions on Systems, Man, and Cybernetics – Part A: Systems and Humans, 34(3):305–314, May.
- [Hanke, 2004] Thomas Hanke. 2004. Hamnosys-representing sign language data in language resources and language processing contexts. In Workshop proceedings of Representation and processing of sign languages (LREC 2004).
- [He et al., 2016] Kaiming He, Xiangyu Zhang, Shaoqing Ren, and Jian Sun. 2016. Deep residual learning for image recognition. In Proceedings of the IEEE conference on computer vision and pattern recognition, pages 770–778.
- [Hu et al., 2011] Weiming Hu, Nianhua Xie, Li Li, Xianglin Zeng, and Stephen Maybank. 2011. A survey on visual content-based video indexing and retrieval. IEEE Transactions on Systems, Man, and Cybernetics, Part C (Applications and Reviews), 41(6):797–819.
- [Karypis and Kumar, 2000] Michael Steinbach George Karypis and Vipin Kumar. 2000. A comparison of document clustering techniques. In TextMining Workshop at KDD2000.
- [Ko et al., 2019] Sang-Ki Ko, Chang Jo Kim, Hyedong Jung, and Choongsang Cho. 2019. Neural sign language translation based on human keypoint estimation. Applied Sciences, 9(13):2683.
- [Koller et al., 2016] O. Koller, H. Ney, and R. Bowden. 2016. Deep hand: How to train a CNN on 1 million hand images when your data is continuous and weakly labelled. In Proceedings of the Conference on Computer Vision and Pattern Recognition (CVPR), pages 3793–3802, June.
- [Lewis et al., 2012] Joshua Lewis, Margareta Ackerman, and Virginia de Sa. 2012. Human cluster evaluation and formal quality measures: A comparative study. In Proceedings of the Annual Meeting of the Cognitive Science Society (CogSci).
- [Liaw et al., 2002] Andy Liaw, Matthew Wiener, et al. 2002. Classification and regression by random forest. R News.
- [Lichtenauer et al., 2008] Jeroen F Lichtenauer, Emile A Hendriks, and Marcel JT Reinders. 2008. Sign language recognition by combining statistical dtw and independent classification. IEEE transactions on pattern analysis and machine intelligence, 30(11):2040–2046.
- [Lucas et al., 2002] Ceil Lucas, Robert Bayley, Mary Rose, and Alyssa Wulf. 2002. Location variation in american sign language. Sign Language Studies, pages 407–440.
- [Mocialov et al., 2017a] Boris Mocialov, Graham Turner, Katrin Lohan, and Helen Hastie. 2017a. Towards continuous sign language recognition with deep learning. In Proceedings of the Workshop on the Creating Meaning With Robot Assistants: The Gap Left by Smart Devices.
- [Mocialov et al., 2017b] Boris Mocialov, Graham Turner, Katrin S. Lohan, and Helen Hastie. 2017b. Towards continuous sign language recognition with deep learning. In The workshop of Creating Meaning With Robot Assistants in the IEEE Humanoids.
- [Mocialov et al., 2020] Boris Mocialov, Graham Turner, and Helen Hastie. 2020. Towards large-scale data mining for data-driven analysis of sign languages. In Proceedings of the LREC2020 9th Workshop on the Representation and Processing of Sign Languages: Sign Language Resources in the Service of the Language Community, Technological Challenges and Application Perspectives, pages 145–150.
- [Neidle and Vogler, 2012] Carol Neidle and Christian Vogler. 2012. A new web interface to facilitate access to corpora: Development of the ASLLRP data access interface (DAI). In Proceedings of the Workshop on the Representation and Processing of Sign Languages.
- [Ong et al., 2014] Eng-Jon Ong, Oscar Koller, Nicolas Pugeault, and Richard Bowden. 2014. Sign spotting using hierarchical sequential patterns with temporal intervals. In Proceedings of the Conference on Computer Vision and Pattern Recognition (CVPR), pages 1923–1930.
- [Östling et al., 2018] Robert Östling, Carl Börstell, and Servane Courtaux. 2018. Visual iconicity across sign languages: Large-scale automated video analysis of iconic articulators and locations. Frontiers in Psychology, 9:725.
- [Papapetrou et al., 2009] Panagiotis Papapetrou, George Kollios, Stan Sclaroff, and Dimitrios Gunopulos. 2009. Mining frequent arrangements of temporal intervals. Knowledge and Information Systems (KAIS), 21(2):133.
- [Rajalingam and Ranjini, 2011] N Rajalingam and K Ranjini. 2011. Hierarchical clustering algorithm-a comparative study. International Journal of Computer Applications (IJCA), 19(3):42–46.
- [Rousseeuw, 1987] Peter J Rousseeuw. 1987. Silhouettes: a graphical aid to the interpretation and validation of cluster analysis. Journal of Computational and Applied Mathematics, 20:53–65.
- [S Kumar et al., 2018] S. S Kumar, T. Wangyal, V. Saboo, and R. Srinath. 2018. Time series neural networks for real time sign language translation. In Proceedings of the International Conference on Machine Learning and Applications (ICMLA), pages 243–248.
- [Schembri et al., 2013] Adam C. Schembri, Jordan Fenlon, Ramas Rentelis, Sally Ann Reynolds, and Kearsy Cormier. 2013. Building the British Sign Language corpus. Language Documentation and Conservation (LD&C).
- [Schubert et al., 2017] Erich Schubert, Jörg Sander, Martin Ester, Hans Peter Kriegel, and Xiaowei Xu. 2017. Dbscan revisited, revisited: why and how you should (still) use dbscan. ACM Transactions on Database Systems (TODS), 42(3):1–21.
- [Simon et al., 2017] Tomas Simon, Hanbyul Joo, Iain Matthews, and Yaser Sheikh. 2017. Hand keypoint detection in single images using multiview bootstrapping. In CVPR.
- [Snoek et al., 2009] Cees GM Snoek, Marcel Worring, et al. 2009. Concept-based video retrieval. Foundations and Trends® in Information Retrieval, 2(4):215–322.
- [Stokoe et al., 1976] W.C. Stokoe, D.C. Casterline, and C.G. Croneberg. 1976. A Dictionary of American Sign Language on Linguistic Principles. Linstok Press.
- [Tornay et al., 2019] Sandrine Tornay, Marzieh Razavi, Necati Cihan Camgoz, Richard Bowden, and Mathew Magimai Doss. 2019. HMM-based approaches to model multichannel information in sign language inspired from articulatory features-based speech processing. In Proceedings of the International Conference on Acoustics, Speech and Signal Processing (ICASSP), pages 2817–2821.
- [Troelsgård and Kristoffersen, 2018] Thomas Troelsgård and Jette Hedegaard Kristoffersen. 2018. An electronic dictionary of Danish Sign Language. In Proceedings of the International Conference on Language Resources and Evaluation (LREC), may.
- [Vaswani et al., 2017] Ashish Vaswani, Noam Shazeer, Niki Parmar, Jakob Uszkoreit, Llion Jones, Aidan N Gomez, Łukasz Kaiser, and Illia Polosukhin. 2017. Attention is all you need. In Proceedings of the Advances in Neural Information Processing Systems (NeurIPS), pages 5998–6008.
- [Wei et al., 2016] Shih-En Wei, Varun Ramakrishna, Takeo Kanade, and Yaser Sheikh. 2016. Convolutional pose machines. In CVPR.
- [Witten and Frank, 2002] Ian H Witten and Eibe Frank. 2002. Data mining: practical machine learning tools and techniques with Java implementations. ACM SIGMOD Record, 31(1):76–77.
- [Yin et al., 2015] Fang Yin, Xiujuan Chai, Yu Zhou, and Xilin Chen. 2015. Semantics constrained dictionary learning for signer-independent sign language recognition. In Proceedings of the International Conference on Image Processing (ICIP), pages 3310–3314, 09.