Quasiparticle self-consistent band structures and phase transitions of LiAlO2 in tetrahedrally and octahedrally coordinated structures
Abstract
A first-principles computational study is presented of various phases of LiAlO2. The relative total energies and equations of state of the , and phases are determined after structural relaxation of each phase. The and tetrahedral phases are found to be very close in energy and lattice volume with the phase having the lowest energy. The octahedral phase is a high-pressure phase and the transition pressure from the and phases to is determined to be about 1 GPa. The electronic band structures of each phase at their own equilibrium volume are determined using the quasiparticle self-consistent (QS) method as well as using the approach in which the QS self-energy is reduced by a factor 0.8 to correct for the underscreening of in QS. The effective masses of the band edges and the nature of the band gaps are presented. The lowest energy phase is found to have a pseudodirect gap of 7.69 eV. The gap is direct at but corresponds to a dipole forbidden transition. The imaginary part of the dielectric function and the absorption coefficient are calculated in the long-wavelength limit and the random phase approximation, without local field or electron-hole interaction effects for each phase and their anisotropies are discussed. Si doping on the Al site is investigated as a possible -type dopant in -LiAlO2 using a 128 atom supercell corresponding to 3.125 % Si on the Al sublattice in the generalized gradient approximation and a smaller 16 atom cell with 25 % Si in the QS approximation. The Si is found to significantly perturb the conduction band and lower the gap but a clearly separated deep donor defect level is not found. However, the donor binding energy is still expected to be relatively deep, of order a few 0.1 eV in the hydrogenic effective mass approximation.
I Introduction
LiAlO2 is a ceramic material that is known to occur in at least five crystal structures: rhombohedral -LiAlO2 (space group Rm, ) [1], orthorhombic -LiAlO2 (space group , ) [2], tetragonal -LiAlO2 (space group (#92)) [3], and tetragonal -LiAlO2 (space group , ) [4, 5]. Among these, both and forms are tetrahedrally coordinated while and are octahedrally coordinated. The form is essentially a slightly disordered rocksalt type phase, in which the 4a Wyckoff positions are about 80 % occupied with Al, 20 % Li and with the roles of Al and Li reversed on the 4b positions. A fully disordered cubic phase has also been reported.[5] A 48 atom cell with spacegroup is listed in Materials Project and provides an approximate computational model for these disordered rocksalt type phases.
LiAlO2 has been investigated for applications in tritium breeding in fusion reactors [8, 9], as a matrix in molten carbonate fuel cells [10], and as a substrate for GaN light-emitting diodes (LED) due to the small lattice mismatch between -LiAlO2 and GaN [11]. Moreover, LiAlO2 is closely related to LiGaO2—another ceramic material that is also known to adopt and structures and that has recently become of interest as a possible ultra-wide band gap (UWBG) semiconductor due to suggestions that LiGaO2 could be -type doped by silicon or germanium [12, 13, 14, 15, 16]. Various experimental works have found the band gap of LiGaO2 in the range of - eV [17, 18, 19, 20], and quasiparticle self-consistent (QS) [21] calculations predict a gap of eV [22]. We expect LiAlO2 to have an even larger band gap than LiGaO2.
LiAlO2 has recently also been considered in the context of Li-ion batteries. It was used as a coating to protect LiCoO2 [23] but Li was also found to diffuse in LiAlO2 itself at high temperatures[24, 25] and solid solutions of LiAlO2 with LiMO2, where M is a transition metal, were proposed by Ceder et al. [26]. LiAlO2 has also been used as an additive in composite electrolytes [27]. For a more complete literature overview of these recent applications, see Singh et al. [28]. The phase transitions of LiAlO2 at high temperature are important in this context and were studied by Singh et al. [28]. as well as the pressure induced transitions we consider here.
The electronic structure and phase transitions of LiAlO2 have already been studied to some extent. The structure of -LiAlO2 at ambient pressure and temperature was determined experimentally by Marezio via Cu and Mo radiation photographs [3]. The phase transition has been studied experimentally [4, 5], and Sailuam et al. [29] have carried out a first-principles computational study of the band structures and pressure-induced phase transition [29]. Ma et al. have done a first-principles study of -LiAlO2 [1]. Singh et al. [28] did an extensive computational study of the temperature-pressure phase diagram and also reported electronic band structures of the various phases. However, there still remain open questions, especially on the electronic structure. With the exception of the study by Sailuam[29], prior first-principles works have largely used density functional theory (DFT) methods with local or semilocal exchange correlation functionals, which are well-known to significantly underestimate band gaps. Sailuam et al.[29] obtained a gap of 6.56 eV for -LiAlO2 using the Heyd-Scuseria-Ernzerhof (HSE) hybrid functional, much larger than previous DFT studies. We seek to further improve upon these estimates using the more accurate QS method. Not only the band gap but other details of the band structure, such as the direct or indirect nature of the gap and the effective masses are relevant to the potential semiconductor applications, which have not yet received attention. Thus, our paper is focused on the electronic structure and its properties relevant to potential but not yet explored applications of the material as an active semiconductor. Therefore we will also briefly consider the possibility of doping.
In relation to the band gap and opto-electronic properties, we point that that Huang et al. [30] determined an optical absorption onset from transmission of VIS-UV to occur at 191 nm indicating a gap of 6.5 eV consistent with Zou et al.[31] who also measured a drop in transmission near 190 nm. More recently, Holston et al.[32, 33] measured optical defects in LiAlO2 induced by radiation of doping with Cu. They also do not see any absorption in as-grown crystals above 200 nm wavelength. From these we can deduce that the optical gap appears to be near 6.5 eV at room temperature. Besides optical properties, they also report electron paramagnetic resonance (EPR) spectra of these defects.
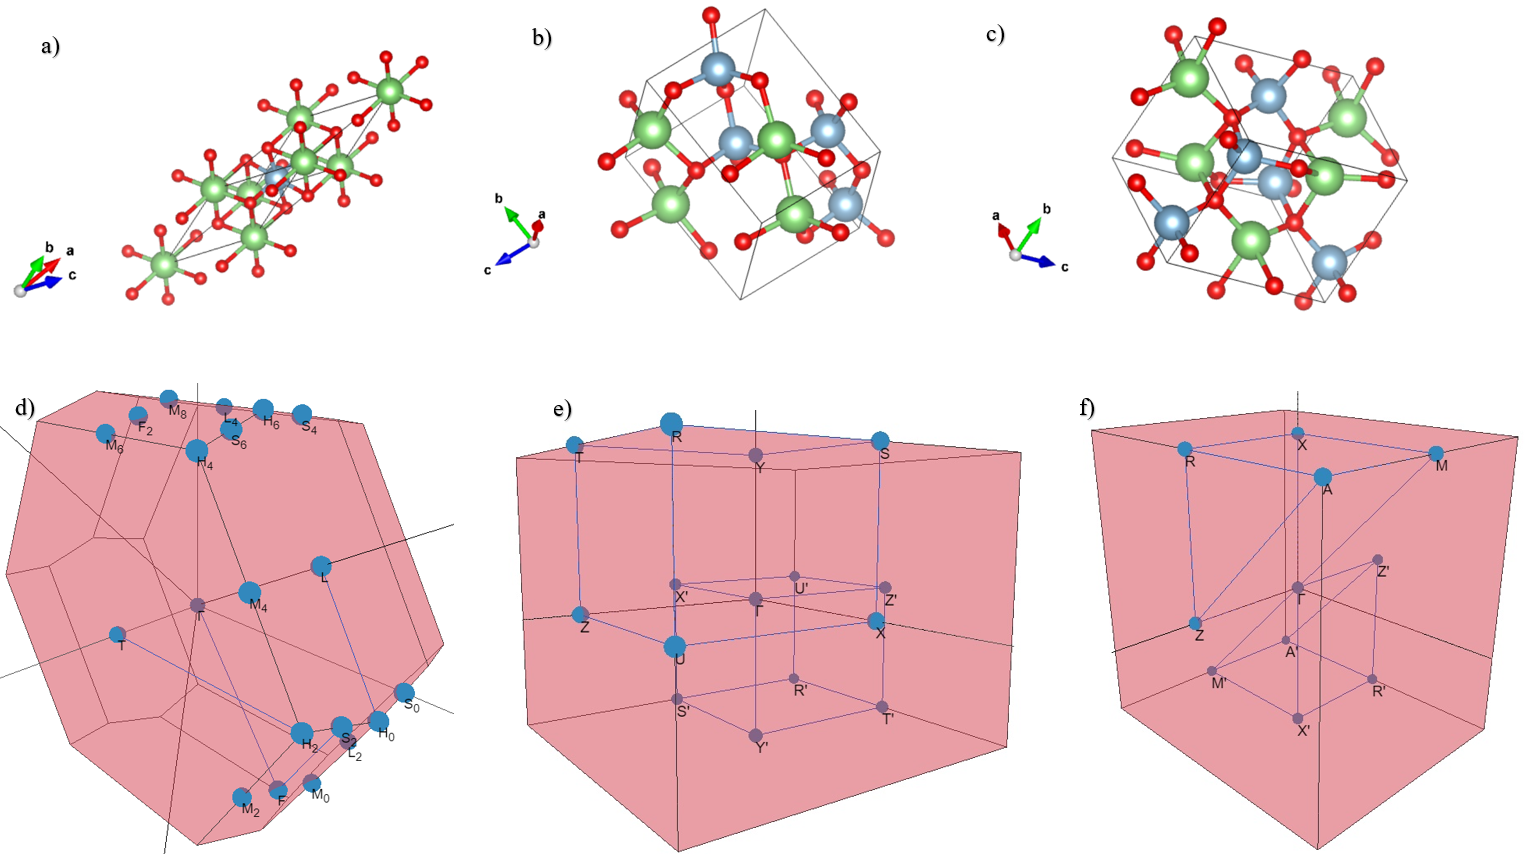
The lowest-energy and most thermally stable form of LiAlO2 is the phase, but coexistence of the and phases is a common result of syntheses performed below K [34], and surface contamination of bulk -LiAlO2 with -LiAlO2 is known to occur as a result of matching between the and axes of the orthorhombic phase with the and axes of the tetragonal phase [2]. Therefore, we consider each of the , , and phases. Additionally, the structure was found to be a high-pressure phase of LiGaO2 [22], so it is also interesting to study -LiAlO2 for the sake of comparing these two closely related materials. We omit here the -phase because it is actually a disordered phase, which requires larger cells to model, and the octahedral coordination is already represented by the -phase. While other work in literature [28] has already studied phase transitions extensively, it is useful to compare our results to their work. The structures studied in this paper and their Brillouin zones are shown in Fig. 1.
II Computational Methods
The structure relaxation calculations in this work are performed using the Quantum Espresso pseudopotential plane-wave implementation of density functional theory (DFT) [35]. We use projector augmented-wave pseudopotentials for all Quantum Espresso calculations [36]. The exchange-correlation energy was treated in the generalized gradient approximation (GGA) using the Perdew-Burke-Ernzerhof (PBE) parametrization[37]. For each of the , , and phases, we start with the lattice parameters provided by Materials Project [38] where available. The unit cell is relaxed at a range of volumes around the equilibrium volume, and the cohesive energy per formula unit is calculated from the total energy at self-consistency and the reference energies of the free atoms (not including spin-polarization corrections of the atom). Bulk moduli and first derivatives of the bulk moduli w.r.t. pressure are then extracted for each phase by fitting the corresponding energy vs. volume points to the energy curve obtained from integrating the Birch-Murnaghan equation of state [39] via nonlinear least squares. Transition pressures between different phases are then extracted from these fits via the common tangent method. The structural relaxation results for the internal coordinates were further checked with the all-electron full-potential linearized muffin-tin orbital method (FP-LMTO) as implemented in the Questaal code[40] while keeping the lattice constant ratios fixed. The obtained energy ordering of the phases was found to be consistent with Quantum Espresso results provided the same muffin-tin radii were kept for all phases.
To overcome the limitations of semilocal DFT for band gaps, we use the many-body-perturbation theoretical method.[41] The band structure calculations performed here use the quasiparticle self-consistent version of the method[21] (QS) as implemented in the Questaal code.[40] The in represents the one-particle Green’s function, and the represents the screened Coulomb interaction. The QS approach is independent of the DFT starting point Hamiltonian , because a non-local exchange-correlation potential is extracted from the self-energy, in the form of its matrix in the basis set of eigenstates where Re indicates taking the hermitian part, and is used to update and iterated to convergence. At each iteration with standing for convolution. At convergence, the quasiparticle energies of become equal to the Kohn-Sham eigenvalues of the updated . This approach is known to give much more accurate band gaps than semilocal DFT but is known to systematically overestimate the band gaps slightly because the screening of is calculated in the random phase approximation and thereby underestimates screening by not including electron-hole interaction effects. This shortcoming can be overcome by including ladder diagrams[42, 43] but this is still a rather expensive approach and it was found that reducing the self-energy correction by a universal factor 0.8, which we call provides an practical alternative [44, 45].
The main factors that determine the accuracy and convergence of the FP-LMTO implementation of the QS method[21] include the basis-set choice and the k-point mesh on which the self-energy is calculated. In the FP-LMTO method we use augmented spherical waves with smoothed Hankel functions as radial functions outside the spheres and typically use a basis set with two sets of Hankel function energies and smoothing radii. Here we use an basis set on each of the atoms, which means one set of smoothed Hankel functions includes orbitals up to and the second up to spherical harmonics. The smoothing radii and energies are chosen in a standard way by fitting these radial wave functions to the tail of the free atom eigenstates. The basis functions are expanded to within each augmentation sphere. To further test the convergence, we added high-energy and local orbitals but found them to affect the band gap negligibly. The two-point quantities, such as the bare and screened Coulomb interaction are represented in a separate basis set of Bloch functions which include products of partial waves inside the spheres and plane waves projected on the interstitial region. This basis set is far more efficient than a plane wave basis set at representing the screening within the Hilbert space of the bands of interest and thereby also reduces the need to include high-lying empty states in calculating the polarization propagator used in with the bare Coulomb interaction and in the calculation of . The mixed product basis set and interstitial plane wave basis functions in the QS scheme are expanded to of 2.7 Ry1/2 and 3.3 Ry1/2, which are standard values.
The final (i.e. after checking convergence) -meshes and energy cutoffs for used in the QS calculations for each phase are given in Table 1. In the QS iterations the is replaced by an average value between and Ry. The atom-centered LMTO basis set provides a natural interpolation scheme for the self-energy matrix to a finer k-point mesh used in the charge-potential self-consistency iterations and for obtaining the bands along the symmetry lines. It thus provides accurate band dispersions and also effective masses. For details about the QS implementation we refer the reader to the method description papers [21, 40].
| Phase | -Mesh | (Ry) |
|---|---|---|
| 6 6 6 | 3.9 | |
| 3 3 3 | 3.5 | |
| 3 3 3 | 3.4 |
III Results
III.1 Equations of state and transition pressures
We begin with an investigation of the structural properties and high-pressure phase transitions of , , and -LiAlO2. For the and phases, we use as initial input the lattice constants and site positions provided by Materials Project [38]. However, at the time of our investigation, Materials Project did not have structural information for -LiAlO2, so we instead use the data for LiGaO2 in the structure and then relax the unit cell substituting aluminum for gallium.
| Phase | (GPa) | (GPa) | |
|---|---|---|---|
| 136 | 3.64 | ||
| 70.5 | 6.01 | 1.4111 | |
| 90.2 | 3.14 | 0.98222, 0.22333 |
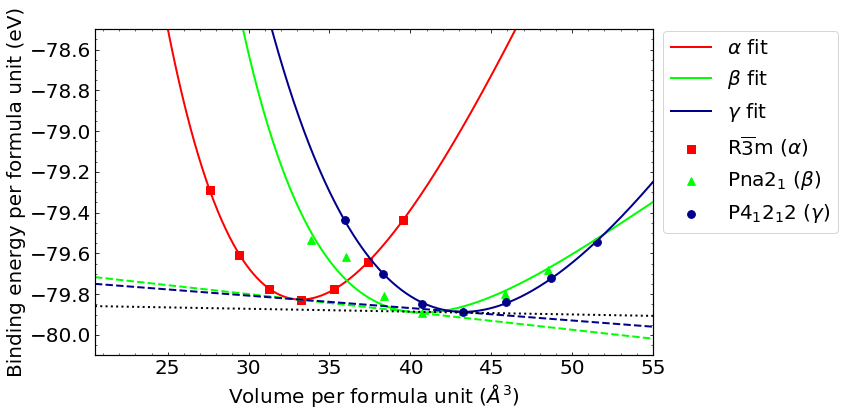
First, we discuss the fitted energy vs. volume curves shown in Fig. 2 and transition pressures between structures. We fit our directly calculated energies as functions of volume to the energy obtained from integrating the Birch-Murnaghan equation of state, which is given by [39]
| (1) | |||||
where is the total energy in the crystalline state, is the total energy of the neutral free atoms at rest, is the volume of the unit cell, is the equilibrium volume of the unit cell, is the bulk modulus, and is the first derivative of the bulk modulus w.r.t. pressure.
We calculate the transition pressures between different structures using the common tangent construction, wherein the negative of the slope of the tangent line is the pressure required to achieve enthalpic equality between two crystal structures. A plot of the directly calculated points and equation of state fits is shown in Fig. 2, and values of the fitting parameters and along with the transition pressures are given in Table 2. From Fig. 2, it is evident that the phase is a high-pressure form of the material. This result is analogous to that obtained by Radha et al. from their analysis of LiGaO2, which found the structure to be a high-pressure phase of that material [22]. Further, the phase is the lowest-energy structure, though the difference between the energy minima in the and phases is only eV, which is consistent with experimental observation of these two phases coexisting. Their lattice volume per formula unit are also close but slightly larger for , indicating that also could be stabilized under pressure. The common tangents shown in Fig. 2 indicate a tetrahedral octahedral transition around 0.98 GPa for and 1.4 GPa for .
These results agree well with those of Singh et al. [28] who also found the and phases to have very close energy minima and establish a transition at 1.3 GPA. They obtain this by calculating the energy and enthalpy directly as function of pressure, by explicitly imposing the pressure as a stress tensor as independent variable in their calculation, whereas we start from the energy-volume curves and use the common tangent construction, but in principle, these procedures should give equivalent results. They also mention that in the range GPa the -structure already has lower enthalpy. We calculate a transition pressure of 0.22 GPa for based on the fitted equations of state.
The study by Singh et al. [28] is more complete than ours in terms of the phase diagrams by their inclusion of temperature and entropy effects and by also considering the higher pressure transitions to the -phase but for low temperatures our results agrees well with theirs. Previously, Sailuam [29] studied the transition and found a transition pressure of about 2-3 GPa depending on which functional was used. This agrees qualitatively with Singh et al. .[28]. They did not consider the -phase but did evaluate energy barriers between the phases as funtion of pressure. We preferred here to focus on the basic tetrahedral to octahedral phase transition by considering the simpler phase. After all, the -phase which is a disordered cubic phase with tetragonal distortion is not as well established structurally or can only approximately be described by a small unit cell because of the fractional occupations of lattice sites.
For reference, we give the equilibrium lattice constants of each phase in Table 3 as obtained from the Quantum Espresso minimization. These are used later for the electronic structure on which we focus. For the -phase, we here use the primitive rhombohedral cell parameters and the opening angle between the three equal size lattice vectors. To compare with the hexagonal conventional cell, used in the work by Singh et al. [28], which is three times larger in volume, note that . This gives Å Å, in good agreement with the values by Singh et al. .[28].
| structure | |||
|---|---|---|---|
| space group | |||
| Å | Å | Å | |
| Å | Å | ||
| Å3 | Å3 | Å3 | |
| Li | |||
| Al | |||
| ( | |||
| O | |||
| OII | |||
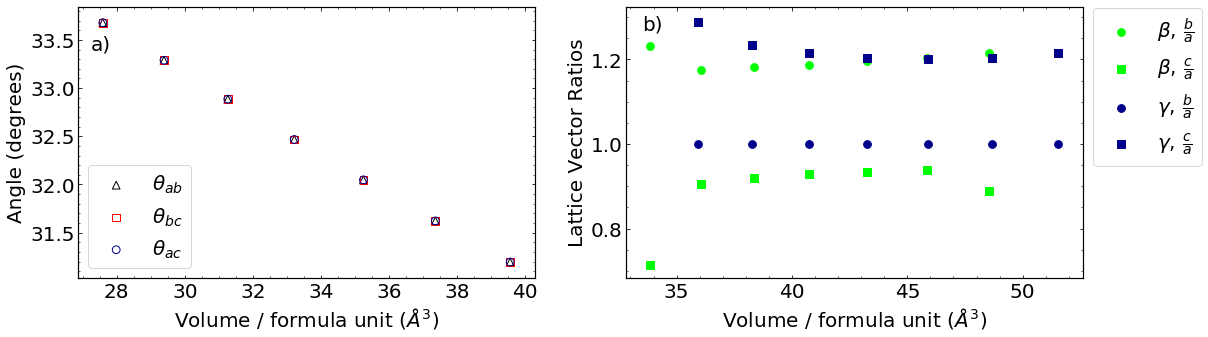
It is also interesting to study how the lattice parameters themselves change as functions of unit cell volume. For the rhombohedral -structure the volume of the unit cell is given by . Part (a) of Fig. 3 shows that the opening angle between each pair of lattice vectors, decreases with increasing volume. For the -structure we can see in panel (b) that and stay more or less constant as the volume is decreased until the volume approaches the region where the phase transition to the -phase occurs. The sudden change in these ratios indicates the incipient instability of the -structure and is possibly related to the transition path between wurtzite and rocksalt suggested in Ref. 46. Likewise in the -structure, the ratio is seen to increase when approaching the transition volume but otherwise stays constant and stays equal to 1 as required by symmetry. We have checked that during the relaxation procedure, the symmetries required by each lattice were maintained.
III.2 Band structures
For our final band structure calculations, we use the lattice parameters corresponding to the lowest-energy point on each of the equation of state fits of Fig. 3, i.e. those given in Table 3.
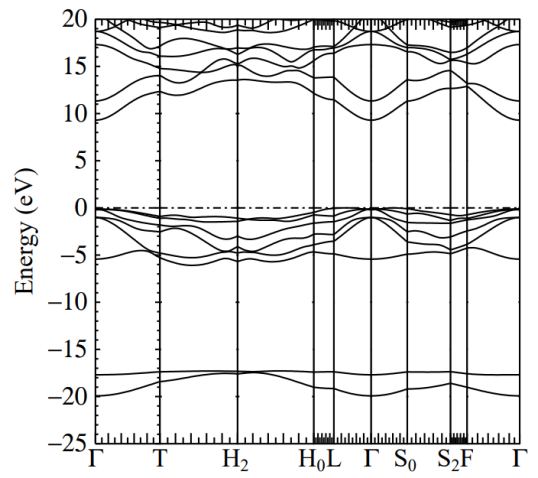
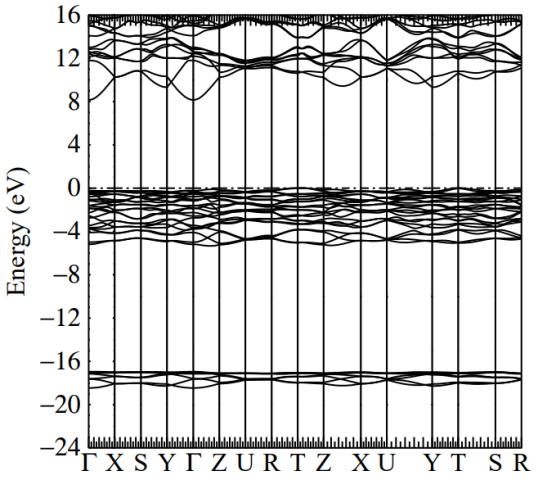
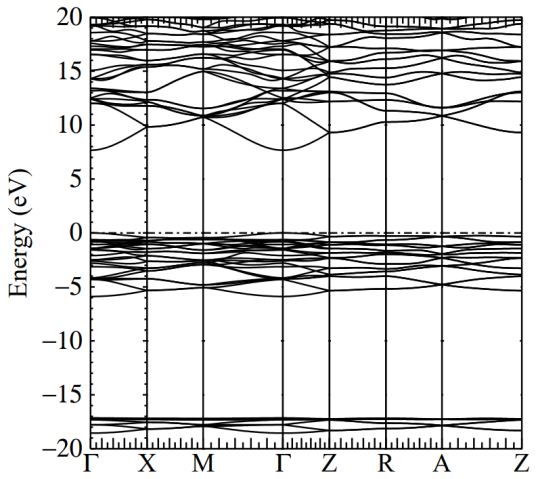
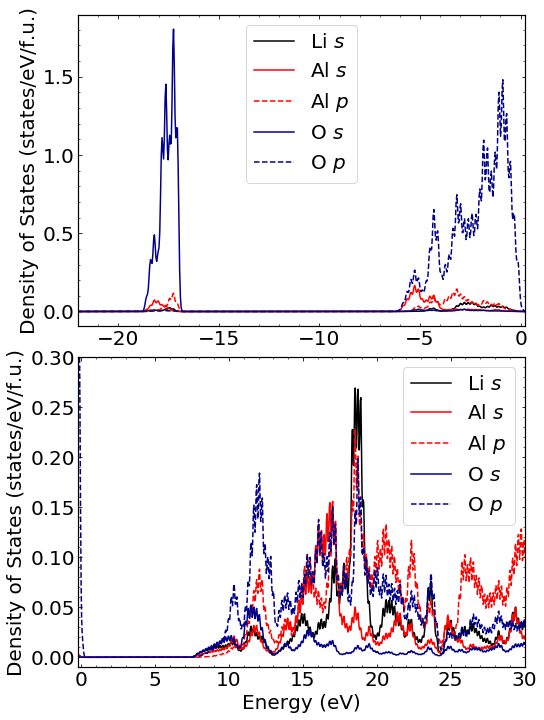
The QS approximation band structure of -LiAlO2 is shown over a wide energy range in Fig. 4, with corresponding plots of the partial densities of states (resolved by ) in both the valence and conduction bands shown in Fig. 5. We find that the phase has an indirect gap of eV, with the conduction band minimum occurring at the -point. The indirect nature is already present also in the GGA-band structure. From the partial densities of states, we can discern that the deep-lying bands spanning to eV are those derived primarily from the oxygen- orbitals. The higher-lying valence states from to eV are primarily due to the oxygen--derived bands, though there are contributions from both aluminum- and as well because these are bonding states with the cation atomic orbitals. The lowest-lying (around eV) conduction states consist of a mixture of lithium-, (antibonding) oxygen- and , and aluminum- orbitals. At higher energy, there are peaks corresponding to significant lithium-, oxygen-, and aluminum- contributions. This confirms the ionic picture in which Li donates its electrons to the oxygen.
We now turn to a magnified view of the valence states near the Fermi level, shown in Fig. 6. This show that two almost equal energy valence band maxima (VBM) occur between and L and and . The nomenclature for the high-symmetry points follows the convention of the Bilbao crystallographic server website (https://www.cryst.ehu.es/) and is also given in Fig. 1. The conduction band minimum (CBM) meanwhile is at and the material thus has an indirect band gap. At the VBM is doubly degenerate and has symmetry of the point group, which is -like while the state below it is non-degenerate with symmetry, which is -like. This indicates that direct vertical transitions from the VBM at to the conduction band which has symmetry (-like) are dipole-allowed for polarization perpendicular to the three-fold symmetry axis, while the transitions from the crystal field split-off state will occur for polarization along the symmetry axis. This is confirmed by the optical absorption calculations discussed below. However, the indirect gap is about 0.1 eV lower than the direct gap. One may notice some avoided band crossings just below the VBM along , and . These were checked by using a fine spacing of the k-points along the lines and indicate that these bands belong to the same irreducible representation of the group of k along these lines and can therefore not cross.
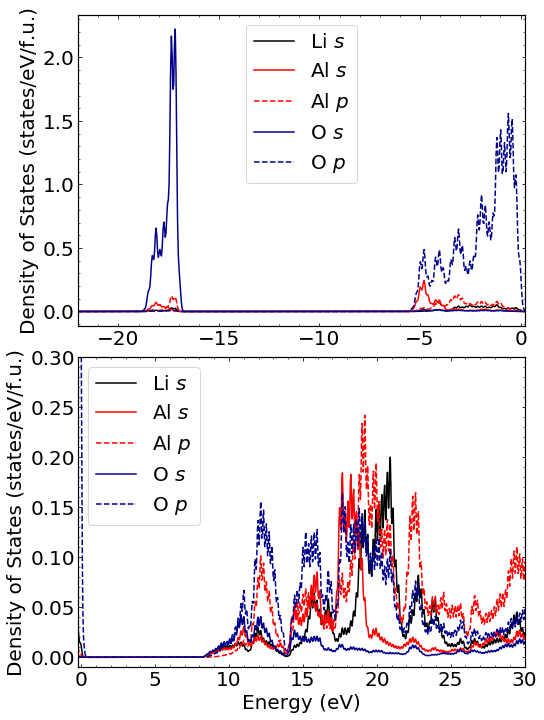
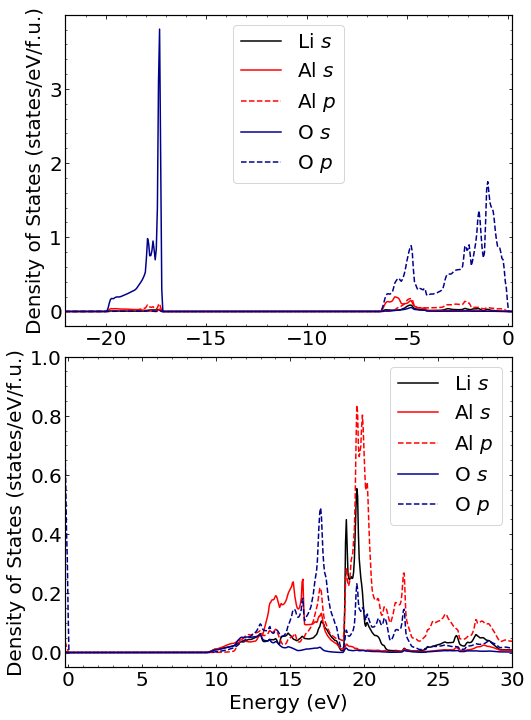
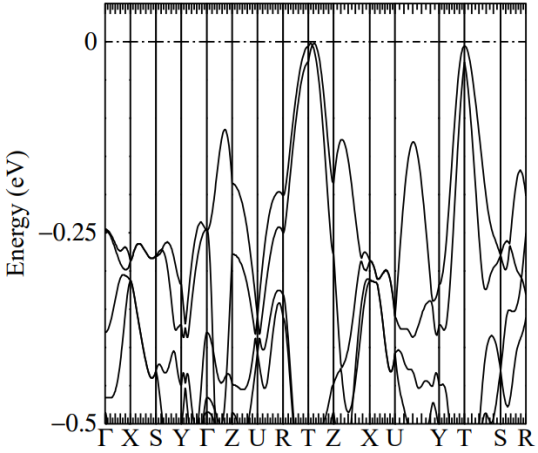
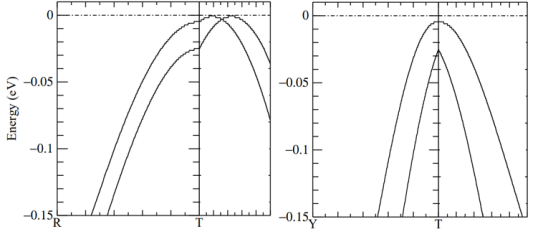
The band structure of the -structure is shown in Figs. 7,9, and 10. The -resolved partial densities of states are shown in Fig. 8. The overall orbital character of the bands is the same as in the -structure. The zoom in near the VBM shows again an indirect band gap, and which is also already present in the GGA. The VBM occurs near the point , which is in units of the reciprocal lattice vectors. An even closer zoom shown in Fig. 10 right near the point in the directions and shows that is a saddle point with a minimum in the direction and a maximum along . The line along contains two maxima close in energy to one another. It also is at a maximum in the direction. Thus, great care is required to determine the effective mass tensor at the actual VBM. The VBM at lies eV below it. The valence bands at from the highest one and down have irreducible symmetries, , , , which are respectively forbidden, allowed for , , polarization for transitions the the symmetry CBM at . These symmetry labels were determined by inspection of the eigenvectors.
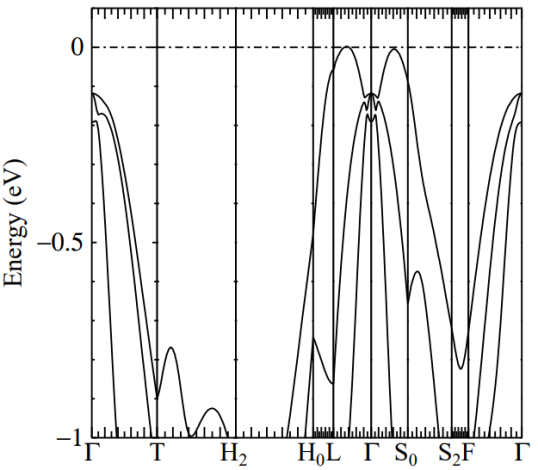
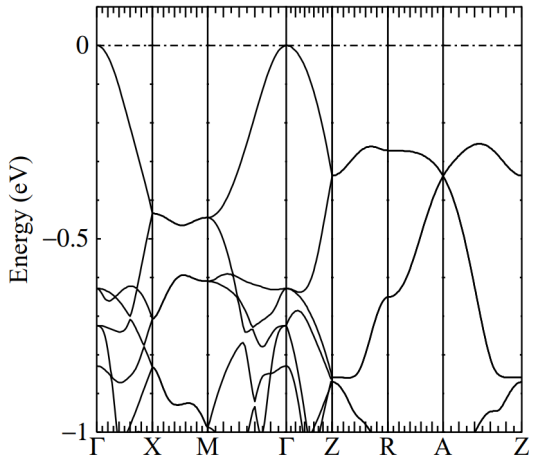
Finally for the structure, the band structure is shown in Figs. 11 and 13, with the -resolved partial densities of states in Fig. 12. The overall orbital character of the bands is similar to the and phases. The zoom up show that this phase has a direct band gap. The CBM has symmetry but the VBM has symmetry in the point group . This implies that the gap is pseudodirect. In other words it is direct but dipole forbidden. The next lower VBM at is double degenerate and therefore has symmetry but lies about 0.63 eV lower. However, along the group of is and contains the symmetry axis under which is even. This means direct vertical transitions for states along the axis become allowed for -polarization because both CBM and VBM at these points and are even or belong to the irreducible representation of . Meanwhile along , the group of is also but contains the axis along the (110) direction, under which is odd. This implies that vertical transitions from the valence band along to the conduction band become allowed for or polarization because the CBM is still even under that -operation. In other words, the VBM has irreducible representation while the CBM has irrep A and transitions are allowed for or because these belong to the irrep. Along the group of is and the top VB belongs to the irreducible representation and thus the transitions are still forbidden. We will see that thus both and polarization should be allowed for energies slightly above the direct gap at but also very close to it transitions for polarization.
The band gaps of all three phases are summarized in Table 4. Our GGA band gaps of 4.48 eV for and 6.18 eV for agree reasonably with Singh et al. ’s[28] 4.7 eV and 6.2 eV respectively. Qualitatively, the differences in gap between the different structures agree well with prior work in the sense that the structure has only slightly higher gap than but the octahedral phases have a significantly larger gap. The QS gaps of course are significantly larger and are more reliable. In terms of details of the band structure, prior work missed the indirect nature of the gap in the and structures. For the -structure, they used the conventional hexagonal cell and hence show the bands in the corresponding hexagonal Brillouin zone. They may thus have missed the points where the actual VBM occurs. Secondly, for all three phases, they only show a band structure on large energy scale, were the top valence bands are very flat and therefore it is difficult to ascertain where the actual VBM occurs.
| Phase | GGA | QS | QS |
|---|---|---|---|
| 6.18 eV | 10.1 eV | 9.30 eV | |
| 4.93 eV | 8.94 eV | 8.16 eV | |
| 4.48 eV | 8.47 eV | 7.69 eV |
III.3 Effective masses
The curvature of the bands near the band edges provide the effective masses, which are important for transport properties. They are summarized in Table 5.
| Phase/Extreme Point | () | () | () |
|---|---|---|---|
| (VBM)444Principal values of the mass tensor. The masses labeled and actually correspond to principal axes 15 ∘ from the crystal axes. | -6.6 | -0.69 | -2.8 |
| (CBM) | 0.47 | 0.47 | 0.58 |
| (VBM) | -1.3 | -0.57 | -0.94 |
| (CBM) | 0.43 | 0.39 | 0.36 |
| (VBM) | -1.7 | -1.7 | -2.9 |
| (CBM) | 0.41 | 0.41 | 0.44 |
As expected from the symmetries of the and phases, the -point CBM of the phase and CBM and VBM of the phase have effectively one transverse and one longitudinal effective mass. The valence band masses are significantly higher than the conduction band masses as is evident from the flat top valence band. For the -phase they were determined by zooming in very closely to the actual VBM along , as shown in Fig. 10. Note that we here give electron masses, so the negative signs for the VBM indicate positive hole-masses.
III.4 Optical absorption
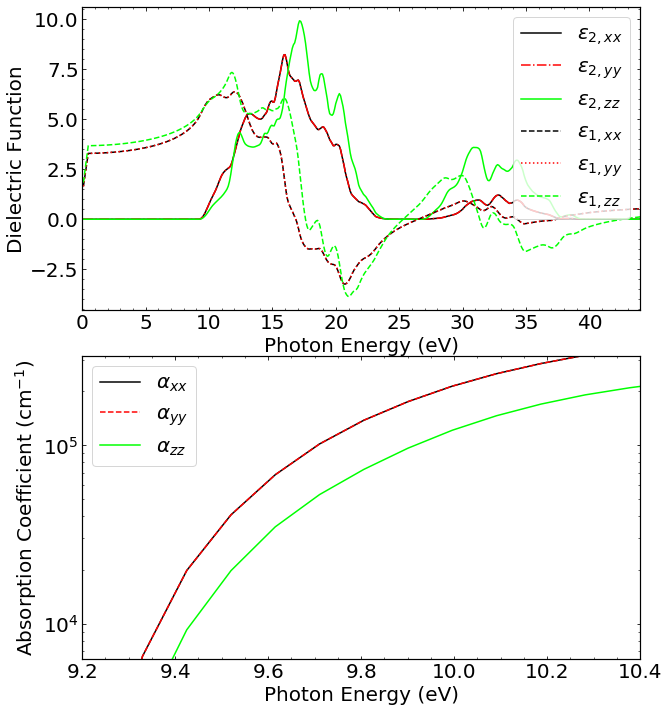
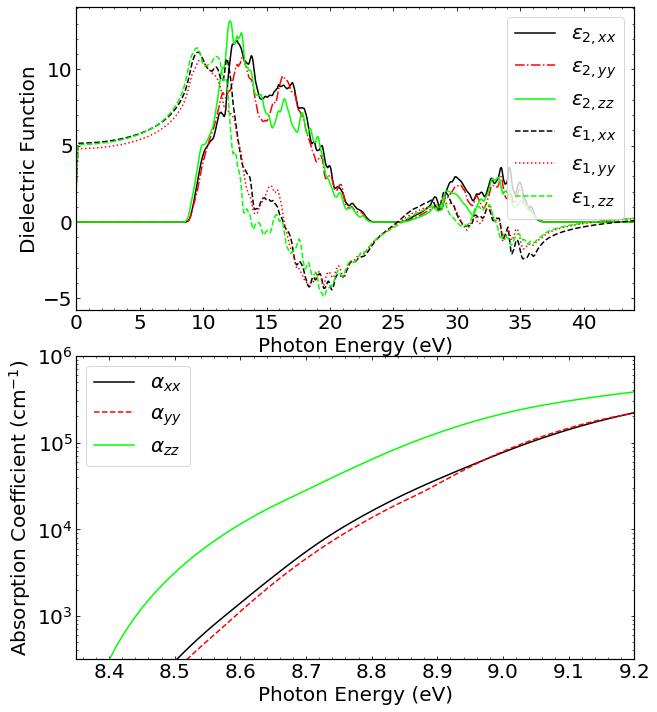
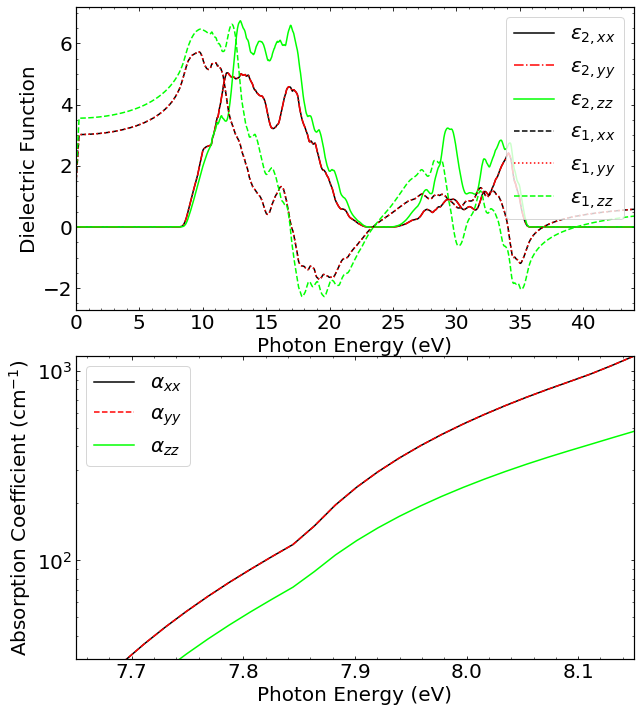
The imaginary part of the dielectric function , which is proportional to the optical absorption coefficient was calculated in the long-wavelength independent particle approximation, ignoring local field and excitonic effects, according to
| (2) | |||||
where the commutator gives the band velocity and includes the contributions from the non-local self-energy, , are the valence and conduction band states at obtained in the QS method. The are the band occupation numbers (Fermi functions at zero temperature) and are for and for . is he volume of the unit cell.
These functions are shown in Figs. 14, 15, and 16 for the , , and phases, respectively, along with the real parts of the dielectric function and the absorption coefficients . The real parts are obtained from the imaginary parts via a Kramers-Kronig transformation, and the optical absorption from the relation , where is the real part of the index of refraction . The onsets of absorption and their respective polarizations are consistent with the symmetry analysis in the previous section. For , the top VBM at is like and hence has allowed transitions for polarizations, while the VBM-1 has symmetry and hence has allowed transitions for -polarization. For the top VBM at is forbidden but very close to the symmetry level allowed for , the next ones have corresponding to and corresponding to symmetries and hence the onset occur in the order . For the -structure the top valence band at transition to the CBM is forbidden but transitions along become allowed for -polarization and along for polarization. This is consistent with the calculated onsets of absorption. Because the matrix elements are expected to gradually increase as moves away from either along or the onset of optical transitions would not follow the usual behavior for direct allowed transitions but rather a behavior, where is the onset of transitions. On the other hand, even for the direct allowed transitions in the case, the expected behavior is only seen very close to the onset. This is because the conduction band at somewhat higher energies above the CBM becomes linear in , in which case, the will turn over to become proportional to . In the -phase we have a combination of linearly increasing matrix elements and a conduction band that turns from parabolic to linear behavior but in any case, it is clear from the figures that the absorption coefficient turns on slower for the than for the case.
At present, no experimental data on the optical absorption or dielectric function over the range we have calculated, are available. This is not surprising giving the difficulty to obtain adequate light sources in this deep UV range, which is only available at synchrotrons. As mentioned already in the introduction, there were two prior experimental studies [30, 31] which showed a decrease in transmission at about 190 nm or 6.5 eV for the -phase. No data are available for the high-pressure phases. These onsets of absorption are significantly lower than the here calculated quasiparticle band gaps. There are two possible reasons for this discrepancy: finite temperarature effects and zero-point motion of the band gap and secondly, excitonic effects. In a very ionic material, as we have here, excitonic effects can be expected to be large and could substantially reduce the optical absorption onset from the band-to-band onset. An initial estimate can be made within the hydrogenic Wannier exciton model. Using a reduced mass of 0.33 and a dielectric constant of about 3.5, the binding energy would be 0.36 eV. On the other hand, electron-phonon coupling band gap renormalization effects could also be substantial leading to a zero point motion correction and even larger reductions at room temperature. A full calculation of these effects is beyond the scope of the present paper. However, comparing to other ionic oxides like MgO suggest the finite temperature effects could well be of order 0.5 eV. Combining this with the estimated exciton binding energy a reduction by about 0.9-1.0 eV would bring the absorption onset down to 6.7 eV in reasonable agreement with experiment. Finally, we should point out that the optical measurements carried out thus far had a cut-off at about 190 nm in the UV and only a start of the reduction of transmission was measured at this wave length. The nature of the absorption onset, which we here predict to be forbidden direct is therefore still unclear but is challenging to measure with standard available light sources in the UV. Furthermore, defect related absorption band tails can often lead to an underestimate of the band gap.
III.5 Silicon Doping of -
With band gaps larger than eV, the utility of LiAlO2 in ultra-wide band gap (UWBG) semiconductor applications will depend heavily on whether it can successfully be doped. Otherwise, it is just another insulator. The electrical conductivity is also of importance in the context of Li-diffusion and the opportunities for LiAlO2 as electrodes in Li batteries. For successful -type doping one must find a dopant which leads to shallow donor levels in the gap and can be readily introduced in the material. For example, Si is used as -type dopant in GaN but in AlxGa1-xN alloys of high Al content leads to a deep donor due to a distortion of the defect structure away from the simple substitutional cation site,[47] which is called a DX type defect. Donor binding energies larger than a few eV are usually considered ineffective for doping. Inspired by prior work on LiGaO2 [16] we were consider Si doping in LiAlO2.
In this section we present the results of a band structure calculation for -LiAlO2 doped with silicon as a candidate -type dopant. First, we simply replaced one Al in the 16 atom unit cell by Si, which corresponds to 25 % doping. While this is an unrealistically high doping level, the advantage is that we can readily perform the calculation at the QS level. Next, we studied a 128 atom supercell, with a single SiAl corresponding to 3.125% of the Al cation sublattice. We first calculate it at the GGA level. Finally, we use a recently developed cut-and-paste approach [48] to obtain approximately the QS band structure in the 128 atom cell with a single Si, from the real-space self-energy of the perfect crystal and the self-energy matrix of the Si atom and its neighbors from the 16 atom QS calculation. In this approach we use a cut-off of the real space self-energy matrices of 6.27 Å.
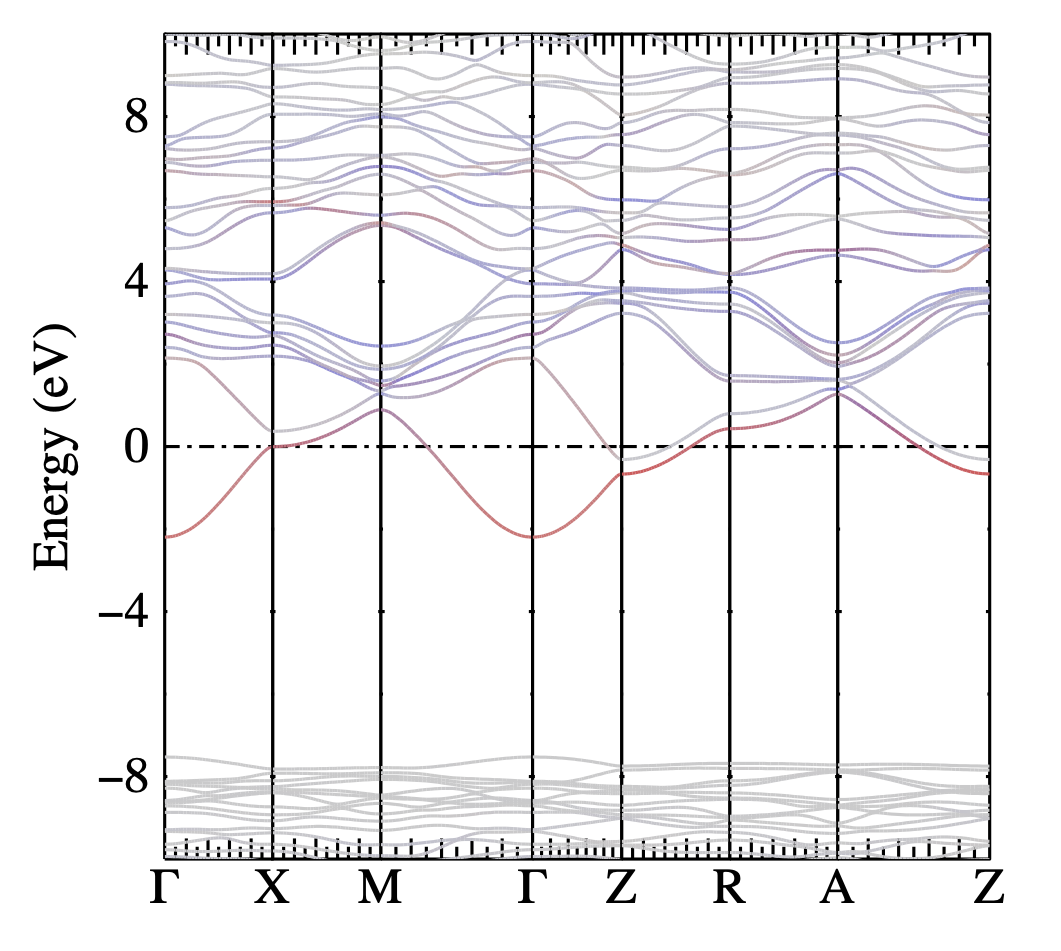
Fig. 17 shows the results of the 16 atom cell. The Fermi level now lies about 2 eV above the CBM indicating that no new levels occur in the gap and the additional electron just starts to fill the conduction band. However, the bottom of the conduction band is clearly strongly Si dominated and the QS gap at 5.33 eV is significantly lower than that of pure -LiAlO2. This might at first sight indicate that the Si may actually introduce a deep donor level, which is here broadened into an impurity band because of the high Si concentration and merging with the conduction band. We need a larger cell to refute this possibility.
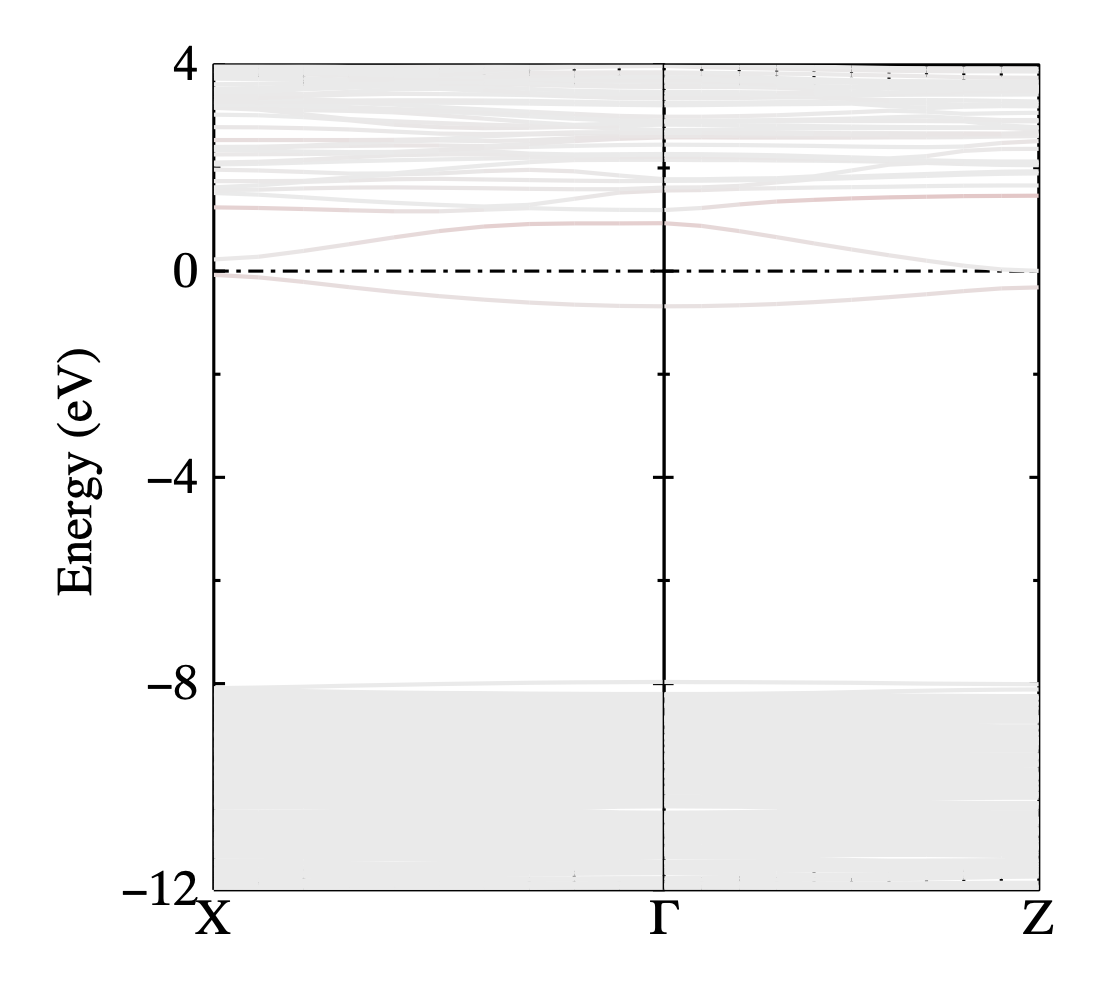
The results for the 128 atom cell are shown in Fig. 18. We here show only two directions of the Brillouin zone. The faint red-color of the lowest three conduction bands indicates their small Si- contribution. The back ground color for the bands without any Si- was chosen a light grey because otherwise it would obscure the red color. The lowest three conduction bands both have some Si- contribution but it is less pronounced because the Si concentration is lower and the Fermi level now lies only 0.67 eV above the CBM. These bands essentially are the folded version of the conduction band of the 16 atom cell in the Brillouin zone of the supercell, which has half the size in each direction, although at the new Brillouin zone edge, a gap opens. The band gap between the O-2p like VBM and the Si-like CBM is about 7.28 eV and is close that of the corresponding perfect crystal gap of 7.43 eV. It is here a little bit lower than the converged value of Table 4 because of the real-space cut-off of the self-energy. Thus the Si still pushes the CBM slightly down but less so than in the 16 atom cell and there is no evidence of a deep donor level. Compared to the corresponding GGA results, the CBM is simply pushed up along with its Si contribution. These results did not include relaxation of the structure. However, relaxation of the nearest neighbor O atoms around the Si, show an inward relaxation of the Si-O bonds by about 6 %. They do not indicate a strong distortion or DX center formation. Indeed, it did not lead to any notable difference in the band structure in the GGA, which still does not show a defect level to emerge in the gap.
These results indicate -type doping should be possible. However, the hydrogenic donor model would predict , which, with the Rydberg unit (13.6057 eV), and , gives eV. This estimate includes only electronic screening. Estimating the phonon contributions to the screening requires the calculation of LO-phonons, which we have not yet done. However, comparison with LiGaO2 indicates a static dielectric constant of about 6.5 is expected. This would reduce the donor binding energy to about 0.1 eV. This shows that even if Si doping does not produce a well separated defect band in the gap in a first-principles calculation in the cell size we can here accommodate, it will likely act as a relatively deep donor with of order 100 meV binding energy. This is similar to LiGaO2 for which experimental confirmation of -type doping also is still to be accomplished but promising enough to warrant experimental attempts to dope these materials with Si. While these estimates indicate efficient -type doping may be challenging for both LiGaO2 and LiAlO2, they would significantly extend the gap range of UWBG semiconductors. Some compromise between efficiency of doping and larger band gaps may be necessary. For comparison, in -Ga2O3, the conduction band effective mass is about 0.3 and the dielectric constant about 10, giving a binding energy of order 40 meV. The expected donor binding energy in LiGaO2 and LiAlO2 are thus relatively high, but on the other hand, still smaller than typical acceptor binding energies related to -type doping in for example GaN.
IV Conclusions
The main conclusions of this paper are as follows. First, in terms of structures, the -phase has the lowest energy but is very close to the -phase, which may already be stabilized at slight pressures of about 0.2 GPA. A phase transition from these tetrahedrally bonded phases to the octahedrally bonded -phase is predicted to occur near 1GPa. The band structures of the three phases were obtained in the QS method and yield band gaps larger than 7 eV with a pseudodirect gap of 7.69 eV in the -phase, indirect gap of 8.16 eV in the -phase, and indirect gap of 9.30 eV in the -phase. The calculated onset of absorption in the -phase, slightly above the pseudodirect gap of 7.7 eV and stemming from direct transitions along and is significantly higher than the until now reported optical absorption onset of about 6.5 eV. We suggested this can be explained by a combination of finite temperature renormalization effects on the gap due to electron-phonon coupling and strong excitonic effects in this ionic material. A fuller investigation of these effects will require additional work in the future. For future use, we have provided details of the band structure near the band edges, including the effective masses. We have also briefly discussed the possibility of silicon as a donor for -LiAlO2, which indicates that -type doping should be possible although efficient doping will be challenging due to the relatively high donor binding energy.
Acknowledgements.
This work made use of the High Performance Computing Resource in the Core Facility for Advanced Research Computing at Case Western Reserve University. This work was supported by the U.S. Department of Energy-Basic Energy Sciences under grant No. DE-SC0008933 and a student travel grant from CWRU SOURCE.References
- Ma et al. [2016] S.-G. Ma, T. Gao, S.-C. Li, X.-J. Ma, Y.-H. Shen, and T.-C. Lu, Theoretical investigations on the alpha-LiAlO2 properties via first-principles calculation, Fusion Engineering and Design 113, 324 (2016).
- Vanfleet et al. [2008] R. R. Vanfleet, J. A. Simmons, D. W. Hill, M. M. C. Chou, and B. H. Chai, Antiphase ordering and surface phases in lithium aluminate, Journal of Applied Physics 104, 093530 (2008).
- Marezio [1965] M. Marezio, The crystal structure and anomalous dispersion of -LiAlO2, Acta Crystallographica 19, 396 (1965).
- Li et al. [2004] X. Li, T. Kobayashi, F. Zhang, and K. Kimoto, A new high-pressure phase of LiAlO2, Journal of Solid State Chemistry - J SOLID STATE CHEM 177, 1939 (2004).
- Lei et al. [2008] L. Lei, D. He, Y. Zou, W. Zhang, Z. Wang, M. Jiang, and M. Du, Phase transitions of LiAlO2 at high pressure and high temperature, Journal of Solid State Chemistry 181, 1810 (2008).
- [6] https://jp-minerals.org/vesta/en/.
- [7] https://www.questaal.org/docs/.
- Charpin et al. [1989] J. Charpin, F. Botter, M. Briec, B. Rasneur, E. Roth, N. Roux, and J. Sannier, Investigation of lithium aluminate as tritium breeding material for a fusion reactor blanket, Fusion Engineering and Design 8, 407 (1989).
- Khomane et al. [2007] R. B. Khomane, A. Agrawal, and B. D. Kulkarni, Synthesis and characterization of lithium aluminate nanoparticles, Materials Letters 61, 4540 (2007).
- Batra et al. [2002] V. Batra, S. Maudgal, S. Bali, and P. Tewari, Development of alpha lithium aluminate matrix for molten carbonate fuel cell, Journal of Power Sources 112, 322 (2002).
- Ke et al. [1998] X. Ke, X. Jun, D. Peizhen, Z. Yongzong, Z. Guoqing, Q. Rongsheng, and F. Zujie, -LiAlO2 single crystal: a novel substrate for GaN epitaxy, Journal of Crystal Growth 193, 127 (1998).
- Boonchun and Lambrecht [2011] A. Boonchun and W. R. L. Lambrecht, Electronic structure, doping, and lattice dynamics of LiGaO2, in Oxide-based Materials and Devices II, Vol. 7940, edited by F. H. Teherani, D. C. Look, and D. J. Rogers, International Society for Optics and Photonics (SPIE, 2011) pp. 129 – 134.
- Boonchun et al. [2019] A. Boonchun, K. Dabsamut, and W. R. L. Lambrecht, First-principles study of point defects in LiGaO2, Journal of Applied Physics 126, 155703 (2019).
- Lenyk et al. [2018] C. A. Lenyk, M. S. Holston, B. E. Kananen, L. E. Halliburton, and N. C. Giles, Lithium and gallium vacancies in LiGaO2 crystals, Journal of Applied Physics 124, 135702 (2018).
- Skachkov et al. [2020] D. Skachkov, W. R. L. Lambrecht, K. Dabsamut, and A. Boonchun, Computational study of electron paramagnetic resonance spectra for li and ga vacancies in LiGaO2, Journal of Physics D: Applied Physics 53, 17LT01 (2020).
- Dabsamut et al. [2020] K. Dabsamut, A. Boonchun, and W. R. L. Lambrecht, First-principles study of n- and p-type doping opportunities in LiGaO2, Journal of Physics D: Applied Physics 53, 274002 (2020).
- Ohkubo et al. [2002] I. Ohkubo, C. Hirose, K. Tamura, J. Nishii, H. Saito, H. Koinuma, P. Ahemt, T. Chikyow, T. Ishii, S. Miyazawa, Y. Segawa, T. Fukumura, and M. Kawasaki, Heteroepitaxial growth of -LiGaO2 thin films on ZnO, Journal of Applied Physics 92, 5587 (2002).
- Wolan and Hoflund [1998] J. T. Wolan and G. B. Hoflund, Chemical alteration of the native oxide layer on LiGaO2(001) by exposure to hyperthermal atomic hydrogen, Journal of Vacuum Science & Technology A 16, 3414 (1998).
- Chen et al. [2014] C. Chen, C.-A. Li, S.-H. Yu, and M. M. Chou, Growth and characterization of -LiGaO2 single crystal, Journal of Crystal Growth 402, 325 (2014).
- Johnson et al. [2011] N. W. Johnson, J. A. McLeod, and A. Moewes, The electronic structure of lithium metagallate, Journal of Physics: Condensed Matter 23, 445501 (2011).
- van Schilfgaarde et al. [2006] M. van Schilfgaarde, T. Kotani, and S. Faleev, Quasiparticle Self-Consistent Theory, Phys. Rev. Lett. 96, 226402 (2006).
- Radha et al. [2021] S. K. Radha, A. Ratnaparkhe, and W. R. L. Lambrecht, Quasiparticle self-consistent band structures and high-pressure phase transitions of and , Phys. Rev. B 103, 045201 (2021).
- Cao et al. [2005] H. Cao, B. Xia, Y. Zhang, and N. Xu, LiAlO2-coated LiCoO2 as cathode material for lithium ion batteries, Solid State Ionics 176, 911 (2005).
- Wiedemann et al. [2016a] D. Wiedemann, S. Nakhal, J. Rahn, E. Witt, M. M. Islam, S. Zander, P. Heitjans, H. Schmidt, T. Bredow, M. Wilkening, and M. Lerch, Unravelling Ultraslow Lithium-Ion Diffusion in -LiAlO2: Experiments with Tracers, Neutrons, and Charge Carriers, Chemistry of Materials 28, 915 (2016a).
- Wiedemann et al. [2016b] D. Wiedemann, S. Indris, M. Meven, B. Pedersen, H. Boysen, R. Uecker, P. Heitjans, and M. Lerch, Single-crystal neutron diffraction on -LiAlO2: structure determination and estimation of lithium diffusion pathway, Zeitschrift für Kristallographie - Crystalline Materials 231, 189 (2016b).
- Ceder et al. [1998] G. Ceder, Y.-M. Chiang, D. R. Sadoway, M. K. Aydinol, Y.-I. Jang, and B. Huang, Identification of cathode materials for lithium batteries guided by first-principles calculations, Nature 392, 694 (1998).
- Lakshman Dissanayake [2004] M. A. K. Lakshman Dissanayake, Nano-composite solid polymer electrolytes for solid state ionic devices, Ionics 10, 221 (2004).
- Singh et al. [2018] B. Singh, M. K. Gupta, R. Mittal, and S. L. Chaplot, Phonons, phase transitions and thermal expansion in LiAlO2: an ab initio density functional study, Phys. Chem. Chem. Phys. 20, 12248 (2018).
- Sailuam et al. [2014] W. Sailuam, K. Sarasamak, and S. Limpijumnong, High Pressure Phase of LiAlO2: A First Principles Study, Integrated Ferroelectrics 156, 15 (2014).
- Huang et al. [2008] T. Huang, S. Zhou, H. Teng, H. Lin, J. Zou, J. Zhou, and J. Wang, Growth and Characterization of High-quality LiAlO2 Single Crystal, J. Mater. Sci. Technol. 24, 145 (2008).
- Zou et al. [2005] J. Zou, S. Zhou, J. Xu, L. Zhang, Z. Xie, P. Han, and R. Zhang, Influence of vapor transport equilibration on the crystal quality and thermal-expansion coefficients of -LiAlO2, Journal of Applied Physics 98, 084909 (2005), https://doi.org/10.1063/1.2099509 .
- Holston et al. [2015a] M. Holston, J. McClory, N. Giles, and L. Halliburton, Radiation-induced defects in LiAlO2 crystals: Holes trapped by lithium vacancies and their role in thermoluminescence, Journal of Luminescence 160, 43 (2015a).
- Holston et al. [2015b] M. Holston, I. Ferguson, N. Giles, J. McClory, and L. Halliburton, Identification of defects responsible for optically stimulated luminescence (OSL) from copper-diffused LiAlO2 crystals, Journal of Luminescence 164, 105 (2015b).
- Jimenez-Becerril and García-Sosa [2011] J. Jimenez-Becerril and I. García-Sosa, Synthesis of lithium aluminate by thermal decomposition of a lithium dawsonite-type precursor, Journal of Ceramic Processing Research 12, 52 (2011).
- Giannozzi et al. [2009] P. Giannozzi, S. Baroni, N. Bonini, M. Calandra, R. Car, C. Cavazzoni, D. Ceresoli, G. L. Chiarotti, M. Cococcioni, I. Dabo, A. D. Corso, S. de Gironcoli, S. Fabris, G. Fratesi, R. Gebauer, U. Gerstmann, C. Gougoussis, A. Kokalj, M. Lazzeri, L. Martin-Samos, N. Marzari, F. Mauri, R. Mazzarello, S. Paolini, A. Pasquarello, L. Paulatto, C. Sbraccia, S. Scandolo, G. Sclauzero, A. P. Seitsonen, A. Smogunov, P. Umari, and R. M. Wentzcovitch, QUANTUM ESPRESSO: a modular and open-source software project for quantum simulations of materials, Journal of Physics: Condensed Matter 21, 395502 (2009).
- Blöchl [1994] P. E. Blöchl, Projector augmented-wave method, Phys. Rev. B 50, 17953 (1994).
- Perdew et al. [1996] J. P. Perdew, K. Burke, and M. Ernzerhof, Generalized gradient approximation made simple, Phys. Rev. Lett. 77, 3865 (1996).
- [38] http://www.materialsproject.org/.
- Birch [1947] F. Birch, Finite Elastic Strain of Cubic Crystals, Phys. Rev. 71, 809 (1947).
- Pashov et al. [2020] D. Pashov, S. Acharya, W. R. Lambrecht, J. Jackson, K. D. Belashchenko, A. Chantis, F. Jamet, and M. van Schilfgaarde, Questaal: A package of electronic structure methods based on the linear muffin-tin orbital technique, Computer Physics Communications 249, 107065 (2020).
- Hedin [1965] L. Hedin, New Method for Calculating the One-Particle Green’s Function with Application to the Electron-Gas Problem, Phys. Rev. 139, A796 (1965).
- Cunningham et al. [2018] B. Cunningham, M. Grüning, P. Azarhoosh, D. Pashov, and M. van Schilfgaarde, Effect of ladder diagrams on optical absorption spectra in a quasiparticle self-consistent framework, Phys. Rev. Materials 2, 034603 (2018).
- Cunningham et al. [2021] B. Cunningham, M. Gruening, D. Pashov, and M. van Schilfgaarde, QS: Quasiparticle Self consistent GW with ladder diagrams in W (2021), arXiv:2106.05759 [cond-mat.mtrl-sci] .
- Deguchi et al. [2016] D. Deguchi, K. Sato, H. Kino, and T. Kotani, Accurate energy bands calculated by the hybrid quasiparticle self-consistent GW method implemented in the ecalj package, Jap. J. Appl. Phys. 55, 051201 (2016).
- Bhandari et al. [2018] C. Bhandari, M. van Schilfgaarde, T. Kotani, and W. R. L. Lambrecht, All-electron quasiparticle self-consistent band structures for including lattice polarization corrections in different phases, Phys. Rev. Materials 2, 013807 (2018).
- Limpijumnong and Lambrecht [2001] S. Limpijumnong and W. R. L. Lambrecht, Homogeneous Strain Deformation Path for the Wurtzite to Rocksalt High-Pressure Phase Transition in GaN, Phys. Rev. Lett. 86, 91 (2001).
- Mehnke et al. [2013] F. Mehnke, T. Wernicke, H. Pingel, C. Kuhn, C. Reich, V. Kueller, A. Knauer, M. Lapeyrade, M. Weyers, and M. Kneissl, Highly conductive n-AlxGa1-xN layers with aluminum mole fractions above 80%, Applied Physics Letters 103, 212109 (2013).
- Dernek et al. [2022] O. Dernek, D. Skachkov, W. R. L. Lambrecht, and M. van Schilfgaarde, Real space representation of the quasiparticle self-consistent self-energy and its application to defect calculations (2022), arXiv:2202.09396.