Interaction induced spatial correlations in a Disordered Glass
Abstract
A consequence of the disorder and Coulomb interaction competition is the electron-glass phase observed in several Anderson-insulators. The disorder in these systems, typically degenerate semiconductors, is stronger than the interaction, more so the higher is the carrier-concentration N of the system. Here we report on a new feature observed in the electron-glass phase of InO with the lowest N yet studied. The feature, resolved as a broad peak in field-effect measurements, has not been recognized in previously studied Anderson-insulators. Several empirical facts associated with the phenomenon are consistent with the conjecture that it reflects a correlated charge-distribution. In particular, the feature may be turned on and off by gate-voltage maneuvering, suggesting the relevance of charge-arrangements. It may also be suppressed by either; temperature, non-ohmic field, or exposure to infrared illumination. After being washed-out, the feature reappears when the system is allowed to relax for sufficiently long time. A puzzling aspect that arises is the apparent absence of the phenomenon when the carrier-concentration increases above a certain value. This is reminiscent of the glass-transition conundrum except that the role of temperature in the latter is played by disorder. Analysis of these findings highlights several issues that challenge our understanding of the disorder-interaction interplay in Anderson insulators.
I Introduction
The interplay between disorder and Coulomb interactions has been the subject of intense research, mostly devoted to degenerate Fermi systems 1 ; 2 ; 3 ; 4 . A common feature observed in disordered-interacting condensed-matter systems is a local depression in their single-particle density-of-states (). This feature, referred to as a zero-bias anomaly (ZBA), is anchored to the chemical potential of the system and appears in both, the diffusive 5 ; 6 , and insulating regimes 7 ; 8 . A zero-bias anomaly may be observed when inserting a particle into the many-body system faster than the time it takes existing particles to relax to its presence. This may be accomplished in a tunneling or photoemission measurement of disordered metals and doped semiconductors. When the system is quantum-coherent, the process is closely related to the Anderson orthogonality catastrophe 9 .
An indirect way to monitor (), becomes possible in systems where the disorder exceeds the critical value for Anderson-localization; the competition between disorder and the unscreened Coulomb interaction slows down the medium relaxation which, in turn, makes the system () observable in field-effect experiments 10 ; 11 ; 12 ; 13 ; 14 ; 15 ; 16 ; 17 ; 18 . In this case a ZBA appears as a modulation of the conductance versus gate-voltage, G(V) 14 . This feature, called a memory-dip (MD), has been observed in several heavily-doped semiconductors where the disorder necessary to render them Anderson-insulators is large enough to reduce electronic relaxation rates many decades below the transition-times associated with their conductivity 19 . Anderson insulators in this group exhibit glassy dynamics and are referred to as ‘electron-glasses’. These should be distinguished from lightly-disordered systems (sometimes called Coulomb-glasses) that do not exhibit MD in field-effect experiments 19 . The relation between the single-particle density-of-states and the MD has been elucidated in 12 ; 14 ; 17 ; 18 .
Theoretical models that incorporate disorder and interactions are usually concerned with the low-energy part of the single-particle density-of-states The energy location of the states were expelled from the ZBA region has received less attention. In particular, the Anderson-localized regime, where () has traditionally been derived via a classical Coulomb-gap approach, the missing states are usually depicted as being evenly spread outside the depleted region 20 ; 21 ; 22 ; 23 . Given that disorder in Anderson insulators is in general significantly stronger than the Coulomb interaction 24 , this picture seems plausible and is consistent with results of tunneling 25 ; 26 , and field-effect experiments on strongly disordered systems 27 .
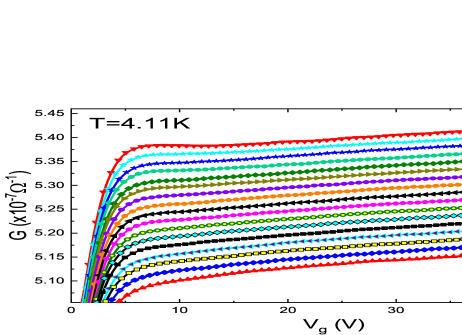
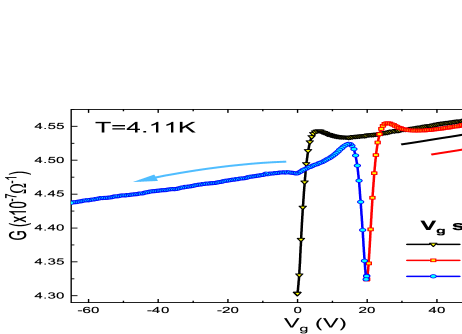
Recently however, a strikingly different behavior was detected in a particular version of amorphous indium-oxide InO films; as shown in figure 1.
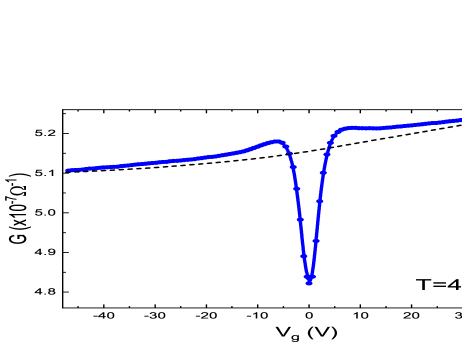
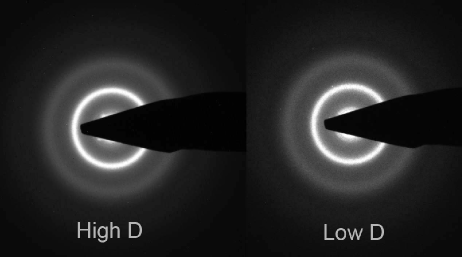
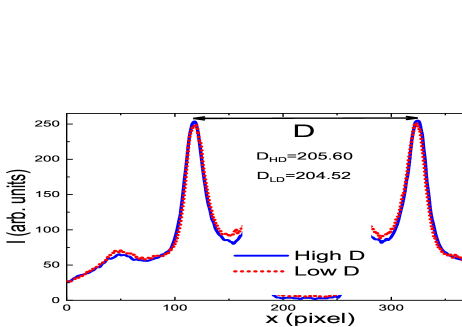
The MD exhibited by specimen of this version reveal structure that resembles that of a superconductor () with its characteristic ‘coherence-peaks’ at the edges of the ZBA. The version of InO used in this work is not superconducting (at least down to 0.28K) even when the system is in the diffusive transport regime 28 . Moreover, the indium-rich version of InO, which is superconducting when its disorder is sufficiently small, does show a memory-dip when strongly-localized but without these side-shoulders 27 . Different versions of InO are distinguished by their In/O composition that determines their carrier-concentration N 28 . In terms of microstructure they are quite similar. Electron-diffraction patterns of the superconducting version of the compound and that of the low carrier-concentration sample used in this study are shown in Fig.2. A scan of the radial intensity distribution of these patterns shown in Fig.3 is required to be able to detect any difference between the two versions. Detailed study of the InO versions including x-ray diffraction and interferometry, and Raman-spectrometry showed that in terms of structural properties, different versions only differ by small quantitative aspects like the position of the boson-peak 29 . However, in terms of disorder perceived by the charge carriers, the difference may be substantial when comparing InO with similar resistivities but different carrier-concentrations. The system with the lower carrier-concentration has a lower disorder (given the same resistivity), and therefore it may also be more homogeneous.
Theoretically, piling-up of states at the edges of the ZBA is consistent with the sum-rule for (). A non-monotonic () above the gap was demonstrated in numerical studies of disordered and interacting quantum-systems, explicitly in strongly-correlated compounds 30 ; 31 ; 32 ; 33 ; 34 and in quantum-dots 35 . A ”shouldered” (), quite similar in shape to the MD exhibited in Fig.1, was obtained in Monte-Carlo simulations based on a random-displacement version of the Coulomb-glass 36 ; 37 ; 38 . The shoulders in this scenario were related to a charge-ordering process in the spirit of formation of a ”disordered Wigner crystal or, perhaps more appropriately, a ”Wigner-glass” 39 ; 40 ; 41 ; 42 . The visibility of shoulders in 36 is exponentially reduced with the disorder-strength W. Consequently, this feature has been resolved in the simulations only for W much smaller than the Coulomb interaction amplitude E 38 ; 43 . By contrast, the ratio W/E in Anderson-insulators with Gaussian disorder is typically larger than unity 24 . In the sample shown in Fig.1 for example, this ratio is estimated to be 6, which, according to numerical simulations 36 ; 38 , seems unfavorable for a charge-ordering mechanism to be effective. To account for a ”shouldered-MD” (SMD), it may perhaps be necessary to take additional factors into account than included in the considerations used for the classical Coulomb-glass.
We present in this work extensive data pertaining to this new phenomenon and offer a heuristic interpretation for the main effects that characterize it. Some puzzling issues that need further experimental and theoretical elucidation are pointed out.
II Experimental
II.1 Sample preparation
The samples used in this study were amorphous indium-oxide (InO) films made by e-gun evaporation of 99.999% pure InO onto room-temperature Si-wafers in a partial pressure of 1.3x10mBar of O and a rate of 0.30.1Å/s. Under these conditions the carrier-concentration N of the samples, measured by the Hall-Effect at room-temperatures, was N(10.1)x10cm. Using free-electron formula, this carrier-concentration is associated with n/10ergcm. The Si wafers (boron-doped with bulk resistivity 2x10cm) were employed as the gate-electrode in the field-effect experiments. A thermally-grown SiO layer, 2m thick, served as the spacer between the sample and the conducting Si:B substrate. The screening length of the material (en/) is 2nm and therefore the voltage that actually affects the sample is 10 of V, the voltage applied between the sample and the gate. At room-temperature the sheet resistance of the samples used here ranged between 22.5k to 25k
Films thickness was measured in-situ by a quartz-crystal monitor calibrated against X-ray reflectometry. Samples geometry was defined by the use of a stainless-steel mask during deposition into rectangular strips 0.90.1mm long and 10.1mm wide. Four different batches were made in this study and here we report detailed results of three different samples from one of these batches with a thickness of 205nm. The dimensionless parameter k for these samples is 0.27-0.29, just on the insulating side of the critical value for this material (0.310.1 28 ).
II.2 Measurement techniques
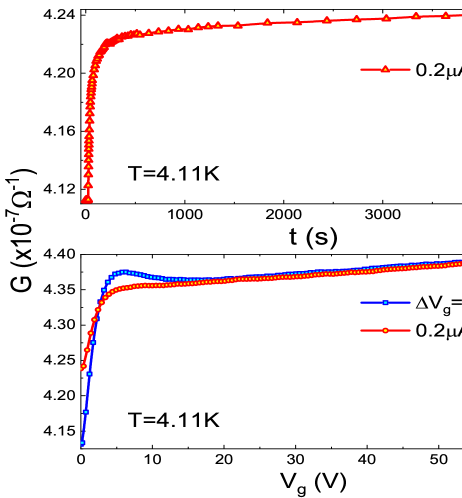
Conductivity of the samples was measured using a two-terminal ac technique employing a 1211 ITHACO current preamplifier and a PAR 124A lock-in amplifier using frequencies of 64-71Hz depending on the RC of the sample-gate structure. R is the source-drain resistance and C is the capacitance between the sample and the gate. C in our samples was typically 10F and R for the samples studied in this work ranged between 1.5-2.5M 4.11K. Except when otherwise noted, the ac voltage bias in conductivity measurements was small enough to ensure near-ohmic conditions. Except where otherwise noted, measurements were performed with the samples immersed in liquid helium at T4.11K held by a 100 liters storage-dewar. This allowed up to two months measurements on a given sample while keeping it cold and in the dark. These conditions are essential for measurements where extended times of relaxation processes are required at a constant temperature. Fuller details of the field-effect measurements setup, samples configuration and characterization are described in 29 . An up to date list of the studied Anderson-insulators that exhibit a memory-dip along with a description of their systematic dependence on the carrier-concentration of the material are given in 19 .
III Results and Discussion
III.1 The basic facts associated with the SMD
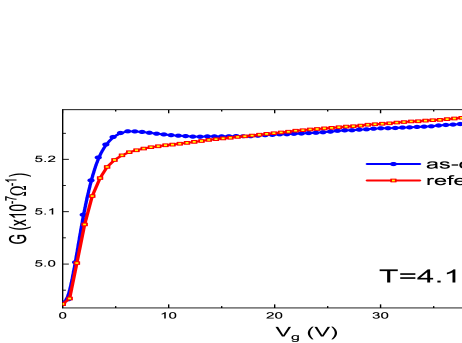
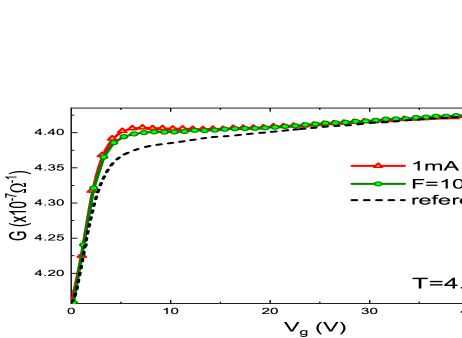
The SMD state is sensitive to the conditions under which it is measured in the field-effect experiment. In particular, sweeping V over a range V that exceeds the typical width of the shoulder results in a shoulderless MD when a V-sweep is taken again along the original interval and polarity. The protocol used throughout this work to achieve this state (labeled as ”reference”) involves sweeping V from 0V to +70V and back to 0V then the sample is relaxed at this position for 20 minutes allowing the ZBA to reform before taking the next G(V) scan. An example is illustrated in Fig.4:
However, this shoulderless G(V) turns out to be metastable; the SMD state of the sample reappears if one let the sample equilibrates under the initial V for long enough time before taking a new sweep. The recovery of the SMD is illustrated in Fig.5 and Fig.6 for the right-hand and left-hand side G(V) scans respectively.
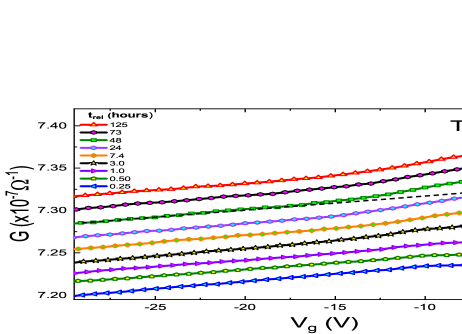
These time-dependent data imply that the SMD state has a lower energy than the reference state.
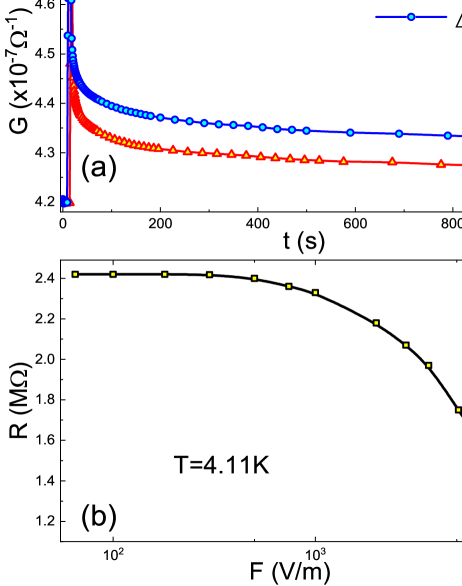
The dynamics associated with the SMD ‘rejuvenation’ process described by the data in Figs. 5 and 6 differs from that exhibited by that of the electron-glass relaxation-process monitored through the conductance G(t) which, characteristically, is logarithmic 27 . The two types of relaxations are compared in Fig.7 for one of the samples:
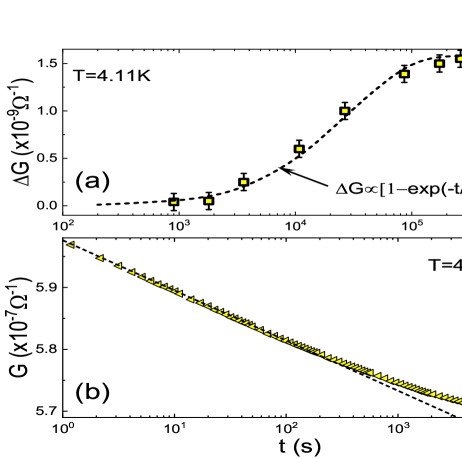
Note first that the SMD evolution persists and is followed for two more decades in time than the conductance relaxation. The main part of the change in G(t) is over while that of G is still building up. Secondly, although the two processes are probably related (and begin and end essentially at the same times), the functional time dependence of G(t) being stretched exponential with exponent =0.78, suggests a process dominated by a relatively narrow rate-distribution 44 . This point will be clarified below.
The disparity in the dynamics of the two types of slow relaxations is also manifested in the dependence of the SMD magnitude on the sweep-rate. This is shown in Fig.8 for another sample in the batch studied.
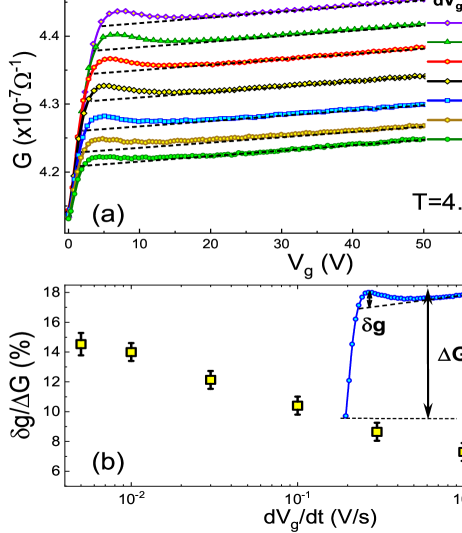
Note that G, the depth of the ZBA in these plots is changing substantially with the sweep-rate (Fig.8a) owing to the relative fast relaxation dynamics of these samples. The logarithmic dependence of G on the sweep-rate is a common feature in electron-glasses 45 . This dependence carries-over to the ratio G/G ( where G is the shoulder height, see: Fig.8b) because of the much weaker change of G with the sweep-rate.
III.2 The shoulder origin - a heuristic interpretation
Based on the data presented above, it is conjectured that the shoulders reflect an increase in the density of states at the edges of the MD in the same vein that the depression of G(V) signifies a depletion of charge at the chemical potential set by v, the equilibrium gate-voltage. The MD has been related to the soft gap at () resulting from the long-range Coulomb interaction 12 ; 13 ; 14 ; 17 ; 18 ; 19 ; 45 .
On its own, the interaction favors a correlated spatial distribution of the states expelled from the low energy of (). Therefore, a lower energy configuration should be attained when the distribution of the nearest-neighbor distances is peaked at a value of the order N where N is the system carrier-concentration. This in turn would show up as a peak in G(V) at Ee/ where is the effective dielectric constant of the medium. The shoulder in our samples is peaked at E7 meV and it tapers-off towards 40-50 meV (Fig.1). For the batch used here, N10cm, the observed peak of the shoulder is consistent with Ee/ if 45. The bare dielectric constant of the material is 10 but the polarization of localized states may enhance it to be consistent with this scenario.
To further asses the plausibility of this picture, we need to consider the role of disorder. The precondition for the MD to be observable in the field-effect experiment is a strong enough disorder 19 . Explicitly, the disorder has to be strong enough to Anderson-localize the system and to render its relaxation slower 19 than the sweep-rate of V. On the other hand, too strong a disorder would defeat the electron-electron tendency to form an ordered structure and randomize the states spatial-distribution thus suppressing the shoulder. Intuitively, out of the systems that exhibit MD, the best candidate to show shoulders is where the disorder to interaction ratio is small. This favors systems with low carrier-concentration N because the disorder necessary to Anderson-localize a system increases with its Fermi-energy EN while the interaction scales with N. Note that the SMD discussed here has the lowest N among all the electron-glasses systems yet reported 19 ; 46 . This may be in line with our charge-ordering scenario in the sense that the present system has more favorable parameters than previously studied electron-glasses to show shoulders in field-effect measurements.
But how favorable are the actual system parameters? The magnitude of the interaction identified above with the position of the shoulder was E7 meV. The relevant 47 disorder W may be estimated from the width of the shoulder (Fig.1) yielding W/E6. The disorder to interaction ratio typical for a degenerate semiconductor ranges between 3 to 100 24 . As anticipated, the current system is at the ”favorable” limit in terms of parameters. Yet, this ratio is far from the W/E1 limit where shoulders are observed in classical simulations 36 ; 37 ; 38 . Hopefully, the results reported here may assist in identifying the missing ingredients from these simulations.
The presence of disorder is also essential for understanding the time-dependent processes depicted in Figs.5 and 6; Sweeping the gate voltage by a V (where is the shoulder-width) results in a shoulderless state (Fig.4). However, given time, the shoulder is sluggishly recovered and G(V) eventually exhibits the SMD behavior. Presumably, the metastable MD-state is made up of charges trapped by disorder over the voltage-range swept by the gate. Some of the charges that were driven by the gate to occupy higher energy-states are trapped by deep wells of the potential while the gate travels back to v. Charges occupying states with shallow wells of the potential will escape these states during the time the gate is set back in v to rebuild the MD for the next G(V) run. This explains both, the shifting of charge away from the shoulder towards higher energies, and the relative absence of the fast relaxation rates in the relaxation associated with the shoulder recovery.
The proposed picture for creating the shoulderless state is analogous to the process by which debris is washed ashore by sea-waves and is held on the beach slope by friction when the wave pulls back seaward.
Despite the apparent difference in their dynamics, it is clear that the shoulder and the memory-dip are two parts of the same phenomenon; when the equilibrium voltage is moved, so is the position of the shoulder. An example, illustrating the ‘two-dip-experiment’ 46 for the current batch of InO, is shown in Fig.9:
The feature that strikes the eye in Fig.9 is the barely discernible MD produced in the third sweep at the original v=0V. The magnitude of this MD is smaller by almost two orders of magnitude relative to either of the two ”fresh” MD’s. This is due to the relatively fast dynamics of this weak-disorder batch 19 ; 46 ; 48 . A closer look at the figure reveals a new aspect of the phenomenon; establishing a new v(at +20V) yields at the edge of the MD a prominent shoulder despite being in voltage-range covered by V in a previous sweep. In a way, this is similar to that the shoulders appear along with the MD upon the first cooldown from room-temperatures. Both the MD and the shoulder appear in this case after a brief relaxation period (typically 20 minutes), no days-long waiting-time is required. In fact, as will be shown next, once a new equilibrium conditions are set, the full SMD appears in the G(V) plot.
III.3 Shoulder destruction and rejuvenation
As shown above, taking a G(V) measurement over a V-range larger than , eliminates the shoulder from showing-up in the next scan. A prolonged relaxation of the sample is required for its recovery. However, there are several ways to restore the SMD without a long time-delay. Two of these were mentioned in the paragraph above. Three other schemes effective in rejuvenating the shoulder are described next.
The SMD’s resulting from applying the first two are illustrated in Fig.10.
Both schemes produce shoulders that exhibit higher visibility than would be expected by allowing the system to relax at v for the time required for completing the scheme (compare with Fig. 5).
The third scheme is the easiest to implement and it turns out to be the most effective in pulling back the shoulder from the reference state. In this case, V is first wept to V=-v staying there for 2 seconds and then set back at V=0V for 20 minutes relaxation before recording a G(V) plot from 0V to +60V. As noted before, this trip erases the shoulder. This ”v” protocol is repeated for different (negative) bias-values thus generating plots as function of -v. In each such plot the shoulder is ”rejuvenated” by pre-biasing the sample with a finite -v. These bias values were taken at random order to verify that ‘history’ does not play a role. A series of such plots with v values ranging from 5V to 80V is shown in Fig.11a.
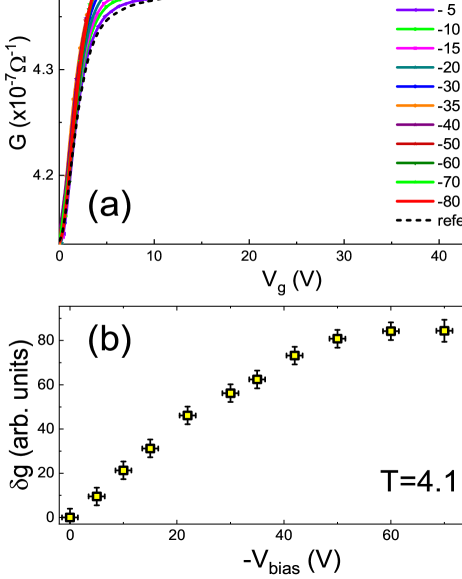
Note (Fig.11b) that the relative magnitude of the shoulder G increases with v and tends to saturate for v-50V. The range over which the gate-voltage bias affects G is similar to the typical width of the shoulder that, in turn, is related to the disorder associated with the phenomenon W. It is emphasized that these data are generated using random values for v in the consecutive measurements. Therefore the correlation between v and G is meaningful and suggestive. Actually, these results lead us to recognize the common element in the four different schemes that produces a SMD from a ”reference” state: They all involve a quench from a state where the charge-carriers are endowed with excess energy E relative to the equilibrium state. These schemes differ by how E is structured (distributed in energy) relative to W, which presumably determines its efficiency in pulling-up the shoulder. When the excess-energy of charge-carriers exceeds W, they are no longer trapped by potential wells of the disorder. Rather, their spatial distribution is controlled by the Coulomb repulsion forcing them apart. In this stage the system is in a fluid, spatially-correlated state that, following a quench and brief relaxation, is well primed to form SMD.
The efficiency of a scheme to produce SMD is not necessarily reflected in the conductance enhancement accompanying the process. For example, stressing the sample with a large longitudinal field enhances the sample conductance by a factor of 2 while the shoulder that results from this scheme is visibly weaker (Fig.10) than that obtained by the brief IR illumination that had a much smaller impact on the conductance (see Fig.12a,b).
III.3.1 Temperature dependence
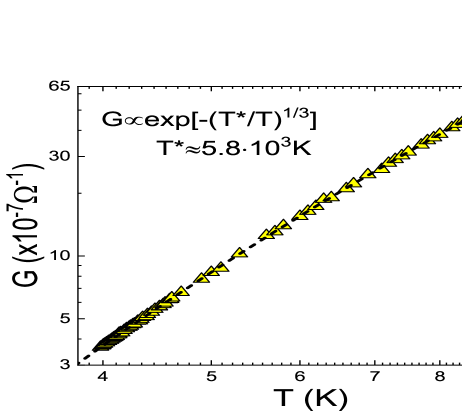
Temperature has a marked effect on the electron-glass features. Both the width of the memory-dip and its relative magnitude are systematically affected by raising the temperature 49 . Here it is shown that the shoulder follows the same trend; its peak is slightly shifted towards a higher V upon increasing the bath temperature, and its magnitude is exponentially suppressed (Fig.13b). This temperature dependence was obtained before in the electron-glass phase of InO films 49 .

Apart from reaffirming that the shoulder is an integral part of the memory-dip, it illustrates how sensitive is its visibility to the addition of high-energy components.
III.3.2 Nonequilibrium steady-state under IR illumination
Even more striking is the effect of a continuous IR illumination which suppresses the shoulder despite the extremely weak power-load on the sample (Fig.14):
Under a continuous IR illumination the sample SMD magnitude was reduced to half its dark-value while the conductance increased by only 2.8% (see, Fig.14a). Based on the conductance versus temperature of this sample shown in Fig.15 this is the equivalent of raising the temperature by 20mK. To achieve a similar reduction of the SMD magnitude of the same sample, the bath temperature must be raised to T5.5K (see Fig.13) which increases the conductance by 300%.
The difference between these two protocols is in how the energy added to the system is distributed among the available degrees of freedom. Under the IR illumination, the system is populated with an excess of high-energy phonons. These are generated by a cascade process: Electrons are excited to high-energy, then relax by optical-phonons emission 50 . This nonequilibrium steady-state has much fewer low-energy phonons than when the sample is heated-up to 5.5K. The density of high-energy phonons is also increased by raising the bath temperature, but most of the absorbed energy is spent on enhancing the conductance. The indication is that the SMD-state is sensitive to the presence of high-energy phonons. This may hint on an underlying mechanism that counteracts the disorder in the competition with interactions. High-energy phonons is a potent source of dephasing which raises the possibility that quantum effects play a role. Effects that hinge on quantum-coherence and may be relevant to the problem at hand are those that promote spatially-extended wavefunctions like resonances 51 ; 52 ; 53 and other wavefunction forms resulting from hybridization. The existence of extended wavefunctions naturally mimics a weaker disorder. There is already evidence for quantum coherence in this system 50 ; 55 so there is reason to further explore this direction.
III.4 Discussion
There are several issues related to the appearance of the shoulders that need to be further clarified. First is the absence of this feature in other versions of InO. In contrast with the samples reported here, all studied Anderson-insulating InO samples with N ranging from 4x10cm to 8x10cm exhibit electron-glass characteristics with MD magnitude and width varying systematically with N but without shoulders 19 ; 27 ; 48 . It seems therefore that, for InO, as N increases from 1x10cm to 4x10cm, the structure manifested by the shoulders melts-away. In terms of In/O ratio, which is the way N is determined in the compound, this range is merely 2% wide 28 . It would be interesting to fine-tune the system N and track the evolution of the phenomenon across this region. This is a much harder undertaking than it may seem and will require establishing a new level of material deposition and post-treatment control. Nonetheless, on the basis of what is already established, this SMDMD transition is surprisingly sharp.
It appears that one has to decide between two possibilities: Either the transition is a real phase-change, or it is a crossover to a regime with ultra slow dynamics. Explicitly, as N increases, the shoulders-dynamics becomes too slow to be resolved on a realistic time scale. This dilemma is similar to the quandary that has haunted the glass community 54 , and perhaps it may take as long to reach a conclusion. In the present case the possibility of a diverging relaxation time has empirical support; The relaxation time of InO electron-glasses with N4x10cm to N10cm was shown to increase dramatically with N 45 ; 46 , and as seen here. the dynamics associated with the shoulders may actually be slower.
Yet, the possibility that the SMD to MD changeover is a true phase-transition cannot be ruled-out either. If the MDSMD transition is indeed a change between two distinct phases what are their nature? The SMD state, characterized by a shoulder in the G(V) plot has been interpreted here as a preponderance of charge at energy of the order E relative to the chemical-potential. It is illuminating to contrast this picture with the spatial-order of the amorphous structure manifested in the electron-diffraction patterns (Fig.2, and Fig.3 above). The shoulders and the diffraction-pattern represent two amorphous structures; one composed of ions, and the other of electronic-charges. The first ring in the former is related to the nearest-neighbor distance between ions which is the analog of the shoulder position in energy. Both the diffraction-ring and the shoulder have a width that is a measure of the disorder associated with the respective phenomenon. The diffraction-ring is relatively much sharper than the shoulder-width. This is due to the difference in the two-particle potential that constrain spatial-freedom of the constituents; Lennard-Jones versus Coulomb-interaction for the ions and charge-carriers respectively. For energies outside the Coulomb gap, this description depicts the SMD-state as a ”frozen-liquid” while the MD-state, lacking ‘medium-range-order’, is a ”frozen-gas”. The experiments that were performed up to and including this work indicate that there is a transition between these states controlled by the carrier-concentration N. This was ascribed to the competition between disorder and interaction that is tilted in favor of the former when N increases. To further test this picture one needs to change disorder, or the interaction, independently which is a challenging task.
A related issue is the use of lower carrier-concentrations than N10cm As mentioned above, in the Anderson-localized regime (a precondition to show electron-glass features 19 ), both disorder W and the Coulomb-interaction E increase with N but WN while EN and therefore a lower disorder-interaction ratio is achievable by reducing N. This however has a limited scope; the ratio is a weak function of N while the dynamics, mainly controlled by W 19 ; 46 , depends on it exponentially. When W decreases the relaxation will quickly become too fast for the experimental V/t to expose a memory-dip in the field-effect experiments. To our knowledge, there is no Anderson-insulator with N10cmthat exhibits either MD or SMD.
There are other factors that may be detrimental for charge-ordering besides too strong disorder. Obviously, sample inhomogeneity beyond that inherent in the sample disorder (estimated ‘globally’, usually on the basis of measuring the resistance) will smear-out the shoulders even when all other conditions are favorable. In particular, an excess of randomly distributed deep potential-wells, should be avoided. Generally, the detailed structure of the background potential, not just its average amplitude, is relevant for the charge-ordering scenario.
A subtle question that is yet to be answered is the effect of a superimposed periodic potential. The effect of underlying crystallinity on the disorder-interaction balance is a pertinent question that may be tested by numerical simulations. However, numerical studies usually use a lattice-model with half-filling, which probably introduces a spatial constraint that likely is incommensurate with the optimal charge arrangement. It is not clear that it may suffice to employ just a very small filling-factor in the simulation to capture the physics of charge-ordering.
Attempts to answer some of these questions may benefit from further experimental work. Systems that exhibit electron-glass features, such as GeTe, TlO, InO, GeSbTe, and Be 19 do not show shoulders in their G(V) plots. It would be useful to know whether this is due to unfavorable W/E or because of their crystallinity. Filling factor in these compounds is naturally small but their relatively high carrier-concentration may be unfavorable. It is worth trying to tweak this by varying their composition. These systems should also be tested for quantum-coherence as this may play a role as alluded to above. A methodical study of these aspects may establish a new platform for the interplay between disorder and interaction in Anderson insulators.
Acknowledgements.
Discussions with Oded Agam, and Ady Vaknin are gratefully acknowledged.References
- (1) L. Fleishman and P. W. Anderson, Interactions and the Anderson transition, Phys. Rev. B 21, 2366 (1980); B. L. Altshuler, Y. Gefen, A. Kamenev, & L. S. Levitov, Quasiparticle lifetime in a finite system: A nonperturbative approach. Phys. Rev. Lett. 78, 2803 (1997); D. M. Basko, I. L. Aleiner, & B. L. Altshuler, Metal insulator transition in a weakly interacting many-electron system with localized single-particle states. Ann. Phys. 321, 1126 (2006); I. V. Gornyi, A. D. Mirlin, & D. G. Polyakov, Interacting electrons in disordered wires: Anderson localization and low-T transport. Phys. Rev. Lett. 95, 206603 (2005).
- (2) Patrick A. Lee and T. V. Ramakrishnan, Disordered electronic systems, Rev. Mod. Phys. 57, 287 (1985) and references therein.
- (3) Daniel C. Tsui, Nobel Lecture: Interplay of disorder and interaction in two-dimensional electron gas in intense magnetic fields, Rev. Mod. Phys. 71, 891 (1999).
- (4) Ipsita Mandal and Rahul M. Nandkishore, Interplay of Coulomb interactions and disorder in three-dimensional quadratic band crossings without time-reversal symmetry and with unequal masses for conduction and valence bands, Phys. Rev. B 97, 125121 (2018).
- (5) A. L. Altshuler and A. G. Aronov, Contribution to the theory of disordered metals in strongly doped semiconductors, Zh. Eksp. Teor, Fiz. 77, 2028 (1979) [Sov. Phys. JETP 50, 968 (1979)]; B. L. Altshuler, A. G. Aronov, and P. A. Lee, Interaction effects in disordered Fermi systems in two dimensions, Phys. Rev. Lett. 44, 1288 (1980).
- (6) Y. Imry and Z. Ovadyahu, Density-of-States Anomalies in a Disordered Conductor: A Tunneling Study, Phys. Rev. Lett., 49, 841 (1982).
- (7) A. G. Zabrodskii, The Coulomb gap: the view of an experimenter, Phil. Mag. B 81, 1131 (2001) and references therein.
- (8) Whitney Mason, S. V. Kravchenko, G. E. Bowker, and J. E. Furneaux, Experimental evidence for a Coulomb gap in two dimensions, Phys. Rev. B 52, 7857 (1995).
- (9) P.W. Anderson, Infrared catastrophe in Fermi gases with local scattering potentials, Phys. Rev. Lett. 18, 1049 (1967).
- (10) J. H. Davies, P. A. Lee, and T. M. Rice, Electron glass, Phys. Rev. Lett. 49, 758 (1982).
- (11) G. Vignale, Quantum electron glass, Phys. Rev. B 36, 8192 (1987).
- (12) C. C. Yu, Time-dependent development of the Coulomb gap, Phys. Rev. Lett., 82, 4074 (1999)
- (13) M. Müller and L. B. Ioffe, Glass Transition and the Coulomb Gap in Electron Glasses, Phys. Rev. Lett. 93, 256403 (2004).
- (14) Eran Lebanon, and Markus Müller, Memory effect in electron glasses: Theoretical analysis via a percolation approach, Phys. Rev. B 72, 174202 (2005); M. Müller and E. Lebanon, History dependence, memory and metastability in electron glasses, J. Phys. IV France, 131, 167 (2005).
- (15) Vikas Malik and Deepak Kumar, Formation of the Coulomb gap in a Coulomb glass, Phys. Rev. B 69, 153103 (2004).
- (16) Vikas Malik and Deepak Kumar, Thermodynamics and excitations of Coulomb glass, Phys. Rev. B 76, 125207 (2007).
- (17) Ariel Amir, Yuval Oreg, and Yoseph Imry, Mean-field model for electron-glass dynamics, Phys. Rev. B 77, 165207 (2008); Ariel Amir, Yuval Oreg, and Yoseph Imry, Electron glass dynamics, Annu. Rev. Condens. Matter Phys. 2, 235 (2011); Y. Meroz, Y. Oreg and Y. Imry, Memory effects in the electron glass, EPL, 105, 37010 (2014).
- (18) M. Pollak, M. Ortuño and A. Frydman, The Electron Glass, Cambridge University Press, England (2013).
- (19) Z. Ovadyahu, Slow Dynamics of the Electron-Glasses; the Role of Disorder, Phys. Rev. B. 95, 134203 (2017).
- (20) G. Srinivasan, Statistical Mechanics of Charged Traps in an Amorphous Semiconductor, Phys. Rev. B 4, 2581 (1971).
- (21) A. Mobius, M. Richter, and B. Drittler, Coulomb gap in two- and three-dimensional systems: Simulation results for large samples, Phys. Rev. B 45,11568 (1992).
- (22) M. Pollak, Effect of carrier-carrier interactions on some transport properties in disordered semiconductors, Discuss. Faraday Soc. 50, 13 (1970).
- (23) A. Efros and B. Shklovskii, Coulomb gap and low temperature conductivity of disordered systems, J. Phys. C: Solid State Phys. 8, L49 (1975).
- (24) E. Yamaguchi, H. Aoki and H. Kamimura, Intra- and interstate interactions in Anderson localised states, J. Phys. C: Solid State Phys., 12, 4801 (1979); H. Kamimura, Theoretical model on the interplay of disorder and electron correlations, Progress of Theoretical Physics Supplement, 72, 206 (1982).
- (25) G. Massey and Mark Lee, Direct Observation of the Coulomb Correlation Gap in a Nonmetallic Semiconductor, Si: B, Phys. Rev. Lett. 75, 4266 (1995).
- (26) V. Yu. Butko, J. F. DiTusa, and P. W. Adams, Coulomb Gap: How a Metal Film Becomes an Insulator, Phys. Rev. Lett. 84, 1543 (2000); V. Yu. Butko & P. W. Adams, Quantum metallicity in a two-dimensional insulator, Nature, 409, 161 (2001).
- (27) A. Vaknin, Z. Ovadyahu, and M. Pollak, Non-Equilibrium Field Effect and Memory in the Electron-Glass , Phys. Rev. B 65, 134208 (2002).
- (28) U. Givan and Z. Ovadyahu, Compositional disorder and transport peculiarities in the amorphous indium-oxides, Phys. Rev. B 86, 165101 (2012).
- (29) Itai Zbeda, Ilana Bar, and Z. Ovadyahu, Microstructure and the boson peak in thermally treated InxO films, Phys. Rev. Materials. 5, 085602 (2021).
- (30) R. Wortis and W. A. Atkinson, Physical mechanism for a kinetic energy driven zero-bias anomaly in the Anderson-Hubbard model, Phys. Rev. B 82, 073107 (2010).
- (31) R. Wortis and Lister Mulindwa, Understanding disorder-induced zero-bias anomalies in systems with short-range interactions: An atomic-limit perspective, Phys. Rev B 90, 035101 (2014).
- (32) Joe Mitchell, Anirban Gangopadhyay, Victor Galitski, and Markus Müller, Two-component Coulomb glass in insulators with a local attraction, Phys. Rev. B 85, 195141 (2012).
- (33) Frank Epperlein, Michael Schreiber, and Thomas Vojta, Quantum Coulomb glass within a Hartree-Fock approximation, Phys. Rev. B 56, 5890 (1997).
- (34) K. Driscoll, A. Ralko , and S. Fratini, Pseudogap metal induced by long-range Coulomb interactions, Phys. Rev. B 103, L201106 (2021).
- (35) Shimon Levit and Dror Orgad, Statistics of Hartree-Fock levels in small disordered systems, Phys. Rev. B 60, 5549 (1999).
- (36) Brigitte Surer, Helmut G. Katzgraber, Gergely T. Zimanyi, Brandon A. Allgood, and Gianni Blatter, Density of States and Critical Behavior of the Coulomb Glass, Phys. Rev. Lett., 102, 067205 (2009).
- (37) A. Möbius and M. Richter, Comment on: Density of States and Critical Behavior of the Coulomb Glass, Phys. Rev. Lett. 105, 039701 (2010).
- (38) B. Surer, A. Glatz, H. G. Katzgraber, G. T. Zimanyi, B. A. Allgood, and G. Blatter, A Reply to the Comment by A. Möbius and M. Richter, Phys. Rev. Lett. 105, 039702 (2010).
- (39) Shimul Akhanjee and Joseph Rudnick, Disorder Induced Transition into a One-Dimensional Wigner Glass, Disorder Induced Transition into a One-Dimensional Wigner Glass, Phys. Rev. Lett., 99, 236403 (2007).
- (40) Chakravarty, S., S. Kivelson, C. Nayak, and K. Voelker, Wigner glass, spin liquids and the metal-insulator transition, Philos. Mag. B 79, 859 (1999).
- (41) R. Chitra, T. Giamarchi, and P. Le Doussal, Pinned Wigner crystals, Phys. Rev. B 65, 035312 (2001).
- (42) Leticia F. Cugliandolo, Thierry Giamarchi, and Pierre Le Doussal, Dynamic Compressibility and Aging in Wigner Crystals and Quantum Glasses, Phys. Rev. Lett. 96, 217203 (2006).
- (43) M. Amini , V. E. Kravtsov, and M. Müller, Multifractality and quantum-to-classical crossover in the Coulomb anomaly at the Mott–Anderson metal–insulator transition, New Journal of Physics 16, 015022 (2014).
- (44) D. C. Johnston Stretched exponential relaxation arising from a continuous sum of exponential decays, Phys. Rev. B 74, 184430 (2006).
- (45) Z. Ovadyahu, Slow conductance relaxations; Distinguishing the Electron Glass from extrinsic mechanisms, Phys. Rev. B 78, 195120 (2008).
- (46) A. Vaknin, Z. Ovadyahu, and M. Pollak, Evidence for interactions in non-ergodic electronic transport, Phys. Rev. Lett., 81, 669 (1998).
- (47) The disorder that is required to localize the system is related to the competition with the system kinetic energy. It may therefore differ from that associated with the competition with the Coulomb interaction.
- (48) Z. Ovadyahu, Transition to exponential relaxation in weakly disordered electron glasses, Phys. Rev. B 97, 214201 (2018).
- (49) A. Vaknin Z. Ovadyahu, and M. Pollak, Temperature dependence of non-equilibrium effects in a Fermi-glass, Europhys. Letters 42, 307 (1998).
- (50) Z. Ovadyahu, Suppressing quantum effects by optically driven nonequilibrium phonons, Phys. Rev. B 103, L100206 (2021).
- (51) I. M. Lifshitz, & V. Y. Kirpichenkov, Tunnel transparency of disordered systems, Zh. Eksp. Teor. Fiz. 77, 989 (1979); Sov. Phys. JETP 50, 499 (1979).
- (52) M. Ya. Azbel, Eigenstates and properties of random systems in one dimension at zero temperature, Phys. Rev. B 28, 4106 (1983).
- (53) J. B. Pendry, Quasi-extended electron states in strongly disordered systems, J. Phys. C: Solid State Phys., 20, 733 (1987)
- (54) .P. Charbonneau, A. Ikeda, G. Parisi, and Francesco Zamponi, Dimensional study of the caging order parameter at the glass transition, PNAS, 109, 35 (2012); G. Biroli, J.P. Garrahan, Perspective: The glass transition, J. Chem. Phys. 138, 12A301 (2013).
- (55) Z. Ovadyahu, Anisotropic Magnetoresistance in a Fermi Glass, Phys. Rev. B 33, 6552 (1986); O. Faran and Z. Ovadyahu, Magneto-conductance in the Variable Range Hopping Regime due to a Quantum Interference Mechanism, Phys. Rev. B 38, 5457 (1988); Z. Ovadyahu, Quantum coherent effects in Anderson insulators, Waves in Random Media, 9(2), 241 (1999).