FACTOID: A New Dataset for Identifying
Misinformation Spreaders and Political Bias
Abstract
Proactively identifying misinformation spreaders is an important step towards mitigating the impact of fake news on our society. In this paper, we introduce a new contemporary Reddit dataset for fake news spreader analysis, called FACTOID, monitoring political discussions on Reddit since the beginning of 2020. The dataset contains over 4K users with 3.4M Reddit posts, and includes, beyond the users’ binary labels, also their fine-grained credibility level (very low to very high) and their political bias strength (extreme right to extreme left). As far as we are aware, this is the first fake news spreader dataset that simultaneously captures both the long-term context of users’ historical posts and the interactions between them. To create the first benchmark on our data, we provide methods for identifying misinformation spreaders by utilizing the social connections between the users along with their psycho-linguistic features. We show that the users’ social interactions can, on their own, indicate misinformation spreading, while the psycho-linguistic features are mostly informative in non-neural classification settings. In a qualitative analysis we observe that detecting affective mental processes correlates negatively with right-biased users, and that the openness to experience factor is lower for those who spread fake news.
Keywords: fake news spreader detection, fake news and political bias dataset, Reddit
languageresourceLanguage Resources
FACTOID: A New Dataset for Identifying
Misinformation Spreaders and Political Bias
| Flora Sakketou∗†, Joan Plepi∗†, Riccardo Cervero‡, Henri-Jacques Geiss ⋄, |
| Paolo Rosso‡ , Lucie Flek† |
| †Conversational AI and Social Analytics (CAISA) Lab |
| Department of Mathematics and Computer Science, University of Marburg, Germany |
| ‡ Pattern Recognition and Human Language Technology (PRHLT) Research Center |
| Universitat Politècnica de València, Spain |
| ⋄ Department of Computer Science, Technical University of Darmstadt |
| ∗ These authors contributed equally to this work |
| {flora.sakketou, joan.plepi, lucie.flek}@uni-marburg.de, {rcerver1@upvnet, prosso@dsic}.upv.es |
| henri-jacques.geiss@stud.tu-darmstadt.de |
Abstract content
1. Introduction
As the popularity of social media platforms continuously grows, so does the dissemination of online disinformation. Many deep learning systems have been therefore developed to detect false or biased news [Zhou and Zafarani, 2020, Zellers et al., 2019, Monti et al., 2019, Shu et al., 2017]. While fake news detection is a big step to mitigate the impact of misinformation on our society [Figueira and Oliveira, 2017, Visentin et al., 2019], it is not sufficient, since limiting the diffusion of false information and avoiding its catastrophic effects is extremely challenging, especially once it has been shared on the Web [Cheng and Chen, 2020, McKay and Tenove, 2020]. Research shows that fact corrections frequently fail in reducing people’s misconception of the truth, and occasionally they even have a “backfiring” effect where people’s misconception is reinforced [Redlawsk et al., 2010, Nyhan and Reifler, 2010, Swire et al., 2017, Berinsky, 2017].
It is essential to address this issue at its origin - to efficiently and rapidly identify accounts and users which are likely to propagate posts from the handles of unreliable news sources. While there are numerous datasets focusing on this issue at a post-level, only very few of those allow to approach this matter on a user level, since, in most cases, fake news posts are not associated with their individual authors.
Moreover, existing datasets designed for identifying misinformation spreaders only include binary labels for the users. However, reality is not black and white, therefore a credibility score associated with each user is more realistic. In addition, since partisan polarization constitutes one of the primary drivers of political fake news sharing [Osmundsen et al., 2021], it is becoming all the more vital to explore the political bias of users in combination with their misinformation spreading behavior. To the best of our knowledge, there is no existing dataset that combines both of these dimensions on a user level with fine-grained scores.
To this end, we introduce a dataset for distinguishing the authors that have shared news from unreliable sources in the past, from those that share news from reliable sources, covering the posting activity of the users before and after the 2020 US presidential elections. We use the terms misinformation spreaders and real news spreaders, respectively. Apart from the binary labels, we assign a credibility score to each user based on the factuality of the news sources they shared, and a political bias score based on the level of partisanship of the news sources they share.
Our contributions can be summarized as follows:
-
•
We introduce FACTOID111https://github.com/caisa-lab/FACTOID-dataset: a user-level FACtuality and pOlitical bIas Dataset, that contains a set of 4,150 news-spreading users with 3.3M Reddit posts in discussions on contemporary political topics, covering the time period from January 2020 to April 2021 on individual user level.
-
•
Additionally, we provide fine-grained scores about the users’ factuality and political bias.
-
•
We conduct classification experiments for identifying misinformation spreaders by utilizing the social connections between the users along with their posting history representations and psycho-linguistic features.
-
•
The curated dataset preserves the structure of the threads, facilitating the exploration of the users’ social activity by modeling it in a graph. We show that the users’ social interactions can, on their own, indicate misinformation spreading, when used in a graph attention network.
-
•
We conduct qualitative analysis of the impact of various psycho-linguistic features, such as affective mental processes and openness to experience.
2. Related Work
Relevant Datasets.
User profiling approaches have been investigated for various tasks, such as author profiling [Vivitha Vijayan, 2019], bot detection [Cai et al., 2017, Hurtado et al., 2019, Kosmajac and Keselj, 2020], gender detection [Daelemans et al., 2019], among others. However, fake news spreader detection is an under-explored research direction. There are some datasets approaching this matter from different angles, for example, attempts have been made to analyze the users reactions to fake news [Glenski et al., 2018] or to analyze users who debunk fake news [Vo and Lee, 2019]. However, there are only a few publicly available datasets suitable for the task.
?) constructed a dataset by assessing the users’ trust level on fake news. More recently, the PAN 2020 competition [Rangel et al., 2020] brought the problem of misinformation spreaders identification to the fore. The dataset of the competition contained 500 users with 100 posts each, for two languages. ?) and ?) created a dataset containing misinformation and real news spreaders by collecting users that posted articles that have been debunked as fake and built their user history based on their previous posts. We draw inspiration from the method of curation of these datasets and use a similar semi-supervised method to obtain a description of the authors and their context. However, the proposed dataset is distinctive in three aspects: it contains fine-grained labels about (a) the users’ credibility and (b) political bias, and (c) it preserves the structure of the threads. Additionally, while the aforementioned datasets utilized Twitter as a source, we utilize Reddit which does not have a word limit on the posts, making the task all the more challenging.
Approaches to Spreader Detection.
Our dataset preserves the structure of the threads, facilitating the exploration of the users’ social activity by modeling it in a graph. The recent advances in graph representation learning [Wu et al., 2021] in various domains provide a promising, under-explored research direction in the context of fake news spreader detection. More specifically, Graph Attention Networks (GAT) [Veličković et al., 2018] have achieved state-of-the-art-results in various natural language processing tasks [Plepi and Flek, 2021, Sawhney et al., 2021, Kacupaj et al., 2021, Ren and Zhang, 2020]. However, this method has not been explored on user graphs in the context of fake news spreader detection. Research has shown that users tend to interact with like-minded individuals [Bahns et al., 2017]. Therefore, we wish to leverage this attribute in order to obtain better user representations.
Traditional feature-based user modeling methods analyze the users’ linguistic patterns in order to infer psycho-linguistic features [Tausczik and Pennebaker, 2010, Girlea et al., 2016]. These works extract evidence of mental processes through the Linguistic Inquiry and Word Count (LIWC) software in order to tackle the problem of identifying deceptive authors. Certain psycho-linguistic characteristics are assumed to underlie the vulnerability to fake information, therefore the LIWC tool has often been used to investigate the phenomenon of misinformation from both document-level [Zhou et al., 2020, Pérez-Rosas et al., 2018] and user-level perspectives [Giachanou et al., 2020, Cervero et al., 2021]. Interestingly, this method has been used in comparison and in conjunction with innovative graph-based architectures [Ren and Zhang, 2020]. Therefore, we believe that leveraging these psycho-linguistic features and their combination together with the users’ social interactions can contribute in order to obtain a strong, competitive baseline.
3. Dataset
3.1. Terminology
The term misinformation in this paper is used specifically in the context of politics as an umbrella term that covers many aspects: (a) misinformation: any news that is false or misleading but is not intended as such, (b) disinformation: any false or misleading information that is spread with the specific intent of deception, (c) hyperpartisan news: news that might not be entirely false, but they are phrased in a way that satisfies a specific political agenda and (d) satirical news: any false content that has a humorous intent.
3.2. Data Collection
Reddit222https://www.reddit.com is an inexpensive source of high-quality data [Jamnik and Lane, 2017]. On Reddit, registered users tend to submit posts with richer content than Twitter, thus we are able to gather enough context for each user. Having enough users with rich contextual density is particularly beneficial for similarity assessment, which makes it the primary choice as the source for collecting disinformation spreaders and real news spreaders post histories.
The data crawling was performed in a user-centric and iterative fashion. To begin with, we manually compiled a list of 65 subreddits regarding controversial political topics that were commonly discussed before the elections, such as general politics or the US presidential race, the SARS-CoV-2 pandemic, women’s and men’s rights, climate change, vaccines, abortion, gun control, 5G in general. For each of those subreddits, the most recent threads were crawled and inserted into a database. On this data, we performed the first iteration of the URL domain-based disinformation and real news spreader extraction to generate a list of Reddit user accounts with equal amounts of users for either class. We then collected the complete histories of all the users in said list, thus gathering all threads in which they participated in the list of political subreddits. All of those threads were inserted into the database from which, again, a now larger list of misinformation and real news spreaders can be extracted. This process was iterated until the dataset reached its current form.
We show the subreddits included in the resulting dataset and the corresponding number of unlabeled, real and fake news posts they contain in Table 1. In the parenthesis, we note the stance that each subreddit supports in its description. For each topic, the subreddits with a very low number of fake news posts, are grouped in the rows named “Other”. In this table, the topics are shown based on a descending number of total fake news posts, the same stands for the subreddits that belong to them. For each topic, we opted for an equal distribution of political partisanship and stances, by selecting the same number of the most popular subreddits for each stance and for the same time period.
As we can see, the largest portion of unlabeled, fake and real news posts are from the subreddit r/politics which is a reddit with no specific political agenda for discussing the news regarding US politics. We can see that the conservative party seems to be posting more frequently based on the number of unlabeled posts. In addition, all topics have a skewed distribution of stances.
| Subreddit | # unlabeled | # real | # fake |
| General political debate | |||
| r/politics (no bias) | 2.399.254 | 81.261 | 3.869 |
| r/Conservative (right) | 346.042 | 5.165 | 2.784 |
| r/conservatives (right) | 24.310 | 526 | 453 |
| r/Republican (right) | 17.797 | 500 | 256 |
| r/ConservativesOnly (right) | 9.431 | 57 | 62 |
| r/democrats (left) | 11.747 | 338 | 41 |
| Other (mostly left) | 72.135 | 2.355 | 81 |
| SARS-CoV-2 | |||
| r/NoNewNormal (anti) | 72.411 | 1.941 | 1.387 |
| r/LockdownSkepticism (no bias) | 62.480 | 1.441 | 275 |
| r/NoLockdownsNoMasks (anti) | 1.887 | 82 | 61 |
| r/Coronavirus (no bias) | 92.163 | 2.753 | 54 |
| Other (mostly no bias) | 21.697 | 606 | 53 |
| Women’s and men’s rights | |||
| r/MensRights (men) | 57.654 | 1.636 | 501 |
| r/Egalitarianism (non-specific) | 83 | 4 | 42 |
| r/antifeminists (men) | 1.138 | 44 | 15 |
| Other (mostly women) | 1.399 | 47 | 11 |
| Climate change | |||
| r/climateskeptics (questioning) | 38.606 | 756 | 856 |
| r/climatechange (science) | 7.858 | 622 | 153 |
| r/GlobalClimateChange (science) | 26 | 2 | 0 |
| r/climate (science) | 120 | 12 | 0 |
| Vaccines | |||
| r/DebateVaccines (no bias) | 32.635 | 1.624 | 637 |
| r/DebateVaccine (no bias) | 2.707 | 57 | 22 |
| r/TrueantiVaccination (anti) | 3.428 | 48 | 18 |
| Other (mixed anti and pro) | 7.255 | 225 | 16 |
| Abortion | |||
| r/prolife (anti) | 7.109 | 167 | 82 |
| r/Abortiondebate (no bias) | 7.590 | 84 | 22 |
| Other (mostly pro) | 5.228 | 84 | 4 |
| Guns | |||
| r/progun (pro) | 10.774 | 453 | 61 |
| r/Firearms (pro) | 12.728 | 200 | 33 |
| r/GunsAreCool (pro) | 4.930 | 233 | 27 |
| r/gunpolitics (no bias) | 1.967 | 61 | 11 |
| r/guncontrol (anti) | 1.062 | 206 | 10 |
| Other (mostly pro) | 9.744 | 338 | 6 |
| 5G | |||
| r/5GDebate (no bias) | 2.192 | 19 | 6 |
| Date | Event Description |
|---|---|
| Feb 5 | Trump is acquitted on the charges of abuse of power and obstruction of Congress. |
| Jul 11 | Mail-in votes are encouraged. |
| Jul 30 | Donald Trump threatens to postpone the election if it appears mail-in votes might go against him. (We regard this as if this had happened in August, since the effects of this political event would be still discussed during that month) |
| Aug 11 | Joe Biden chooses Senator Kamala Harris (D-CA) as his running mate (event 1) |
| Nov 3 | 2020 United States elections (event 2) |
| Jan 6 | US Capitol is attacked by supporters of Trump (event 3) |
| Feb 24 | Johnson & Johnson’s vaccine candidate receives emergency use authorization from the FDA (event 4) |
3.3. Media Domain Lists
Likewise to the work of ?), the website mediabiasfactcheck.com was used as the main source for annotated news outlet domains. It was deemed a suitable resource for the study at hand as it offers annotations for two dimensions: the factuality level and the political bias of a large proportion of high frequented online news media.
Since we also opted for a binary label for the disinformation spreaders, we created a mapping for those labels. To be considered a disinformation domain, the mediabiasfactcheck label has to be below or at Mixed factuality level or labeled as satire, while the real news domains have to be at least Mostly factual and between Right-Center and Left-Center political bias.
As for the credibility of the assigned annotations, the maintainers of mediabiasfactcheck.com state that they “are looking at political bias, how factual the information is, and links to credible, verifiable sources” [mediabiasfactcheck.com, 2021]. In the description of their methodology, they also describe that they base the labels on reviews of at least 10 headlines and 5 news stories [mediabiasfactcheck.com, 2021].
As a further resource to extend the list of disinformation media sources, an “index of fake-news, clickbait, and hate sites” [Review, 2021] by the Columbia Journalism Review333https://www.cjr.org was consulted. Its curators state that it was created by merging pre-existing fake news domain lists from various sources and then checking their actual invalidity with the fact checking platforms PolitiFact and Snopes [Review, 2021]. Finally, to ensure the quality of all annotations, we cross-matched the labels of the common domains by consulting both Snopes and Media Bias/Fact Check.
In total, in this way, we aggregated 1577 disinformation and 571 real news domains for our ground truth and post-level annotations.
3.4. Binary Annotation.
The users were annotated as misinformation spreaders and real news spreaders based on the posted web-links in their history. More precisely, we first extracted news links from the users’ posts using regular expression matching. To decide whether the extracted link was counted as misinformation or real news, its domain was matched with the two lists of domains of online news outlets, each corresponding to one class. Users were then labeled as misinformation spreaders if they had at least two detected misinformation links in their post history, while for being real news spreaders they had to have no shared links from the misinformation list and at least one link posted from the factual news list.
3.5. Fine-grained labels.
In addition to the binary separation of users into misinformation spreaders and real news spreaders, each user was annotated with the following factors by averaging over a float mapping of the labels from mediabiasfactcheck.com, for a more fine-grained annotation.
Factuality degree (fd).
This factor represents the average level of factuality of each author, and is also in the range of [-3, +3] with each label corresponding to different scales; very low (), low (), mixed (), mostly factual (), high (), very high (). Similarly, the factuality factor of each author is computed as follows:
where in the number of posts labeled as
Political bias (pb).
This factor represents the level of partisanship and is a number in the range of [-3, +3] where each of the labels correspond to different scales (); extreme left (), left (), center left (), least biased (), center right (), right (), and extreme right (). The political bias of each author is computed as:
where in the number of posts labeled as
Science belief (sb).
This factor quantifies the level of belief in science and is a number in the range of [-1, +1] where each of the labels correspond to different scales (); conspiracy theory article (), science-based article (). Similarly, the science factor of each author is computed as follows:
where in the number of posts labeled as
Satire degree (sd).
This factor represents the level of satire in the fake news posts. The higher this factor is, the less intentional the misinformation spreading. It is in the range of [0, 1] and is computed as the number of satire posts divided by the number of fake news posts :
Discussion.
Current datasets for fake news spreaders detection characterize a user as a fake news spreader based on whether they posted more than number of posts, which being an arbitrary number around two or three. By introducing these fine-grained labels we pose some interesting questions to the research community. How many times should a user post about fake news in order to be considered as a fake news spreader? Should it also depend on what kind of fake news post they posted (e.g. a post from a pseudoscience source vs post from a source that has a mixed factuality reporting shouldn’t have the same gravity). While satirical news is fake, the intent is usually humorous, however the dissemination of such news could be equally harmful. Should users who post from these sources also be considered as fake news spreaders? Should we consider a threshold of factuality degree instead of counting fake news posts to separate fake news posters and real news spreaders?
3.6. Dataset Statistics
The dataset comprises a total of 3.354.450 posts authored by 4,150 users with a class distribution of 74:26 of real news and fake news spreaders respectively, collected from January 2020 to April 2021. Misinformation spreaders had an average of 1240 posts, with this count being at 654 for the real news spreaders. In total, 2% of the posts contained links to real news media, while 0.3% pointed to domains from the misinformation list.
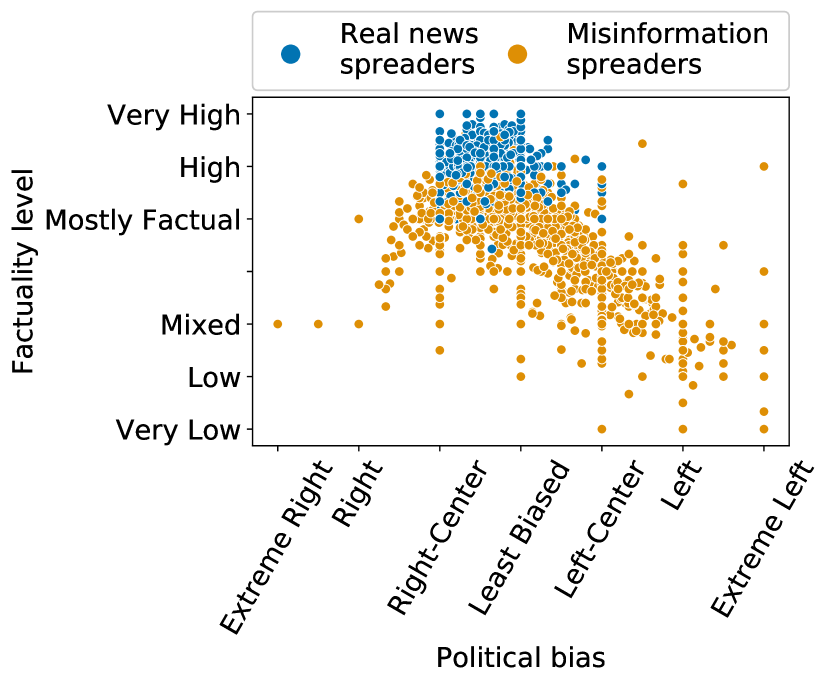
Using the post-level annotations from Section 3.5, the political biases of the users can be looked at: 41.17% of the users that have left wing political bias are misinformation spreaders, while 58.82% of them are real news spreaders. 91.58% of the users that have right wing political bias are fake news spreaders, while only 8.41% of them are real news spreaders. Figure 1 depicts the factuality factor over political bias of each user. While there is an apparent correlation (Pearson correlation of -0.45) between the political bias and factuality of the users, it is important to note that this effect is not an isolated case or a problem that rises from the process of collecting our data, in fact, this phenomenon has been observed by many researchers [Shrestha and Spezzano, 2019] who show that there is indeed a high correlation between the perceived bias of a publisher and the trustworthiness of news content. In addition, [Garrett and Bond, 2021] showed that US conservatives are uniquely susceptible to misinformation regarding the political events and generally political extremes (both the left and the right) are substantially susceptible to conspiracy beliefs. Note that from Table 1, we can see a higher posting activity from the right wing party compared to the left wing, which leads us to the conclusion that right-wing supporters might be more active in social platforms compared to left-wing supporters.
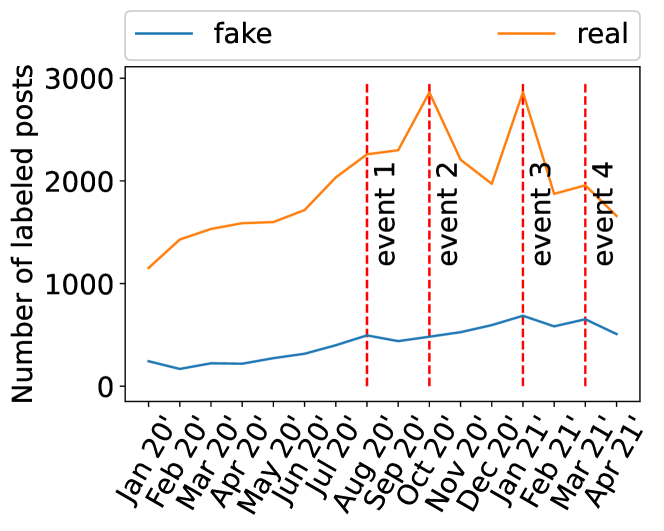
The timestamps and thread structure of all stored posts is preserved in the dataset, in order to encourage a more comprehensive analysis of the users and their posting behavior. Figure 2 shows the number of fake news and real news posted per month.
We also provide a list of pivotal political events444https://en.wikipedia.org/wiki/2020_in_United_States _politics_and_government,
https://en.wikipedia.org/wiki/2021_in_the_United_States that happened during this time period in Table 2. We can see that these events coincide with the increase in the number of fake news and real news posts. We can see an obvious increase in real news right until the US elections and a sudden increase during the attack on the Capitol. This is logical since the elections were scheduled and discussed months before they happened while the attack was an event that developed over a few days. A smoother curve is observed for the fake news, where the numbers do seem to fluctuate in the same manner during these events, but not to the same degree.
4. Encoding the Users
4.1. Problem Formulation
We denote the user to be classified as . Each user is associated with a posting history where is a text authored by the user , posted at time where and is the individual posting history length of each user .
Fake news spreader detection.
For the following experiments we utilize the binary labels introduced in Section 3.4. We therefore formulate the author profiling problem as a binary classification task to predict the class of the user, where misinformation spreader, real news spreader.
Political bias identification.
We utilize the fine-grained labels of the political bias introduced in Section 3.5. The left-wing supporters are the users with , while the right-wing supporters are those with . Accordingly, the identification of partisanship is defined as a binary classification task to predict the class of the user, where left wing, right wing.
4.2. User representations
BERT-based representations
We use Sentence-BERT (SBERT) [Reimers and Gurevych, 2019] to obtain the embedding of each user’s individual historical posts . SBERT is a modification of BERT that is specifically designed to produce semantically meaningful sentence embeddings, and has achieved state-of-the-art performance on various challenging datasets [Agirre et al., 2012, Cer et al., 2017, Marelli et al., 2014], rendering this encoding method particularly suitable for representing the users.
We want to encode the users’ historical context by obtaining their user representations . ?) empirically showed that simple average sentence embeddings compare favorably to more complex methods. Each user’s historical encoding is averaged over the individual posting history length of each user , as:
User2Vec
In addition, we also adopt User2Vec [Amir et al., 2016] to compute the initial user representation. of user based on their corresponding historical posts , optimizing the conditional probability of texts given the author.
Encoding the psycho-linguistic features
In order to analyze the relationship between users’ tendency to spread fake news and their personality traits and mental processes, we use the Big Five Model and LIWC software respectively. The two methodologies are described hereafter.
The Big Five Model (BFM) [John and Srivastava, 1999] assumes that human personality can be summarized in five main aspects: (i) openness to experience, (ii) conscientiousness, i.e. the interactions between rational thought and instincts, (iii) agreeableness, or the intensity of individuals’ reactions within the social context, (iv) extraversion, and (v) emotional instability. After defining these basic dimensions, this approach argues for the existence of semantic associations between them and specific sets of adjectives which are recurrent in the natural language when describing individuals’ psychological traits. Accordingly, ?) derive a personality score with the following process: for each factor, they compute the mean of all the cosine similarities between the embedding representations555The word embeddings are produced by a Word2Vec architecture, pre-trained on the Google News Corpus. of every word in the input text and every benchmark adjective empirically observed as to be able to encode that precise personality trait; the higher this average similarity, the greater the evidence of a given factor. Neuman and Cohen also included 9 extra factors describing mental disorders, like paranoia, and narcissism.
The Linguistic Inquiry and Word Count software (LIWC) [Pennebaker et al., 2015] applies a lexicon-based method for mapping the text into 64 psycho-linguistic categories defined to obtain evidences of many mental processes underlying the natural language, and grouped into 2 macro-categories: (i) linguistic dimensions, i.e. function words, common verbs and adjectives, etc. and (ii) psychological processes of many kinds, including the affective, cognitive, and social type. In conclusion, the LIWC representation of one document consists in the set of relative frequencies for the categories, according to the number of words identified in the text that are associated with each of them. Again, both psycho-linguistic encodings are achieved by an averaging operation over the post-level ones. In particular, it was preferred to extract the values of the LIWC features as means of the relative frequencies at the post level in order to extract the average incidence of each category within the single publication, with the aim of avoiding that the calculations were biased towards the most frequent classes within the composition of the global user discourse.
5. Methodology
5.1. Graph construction
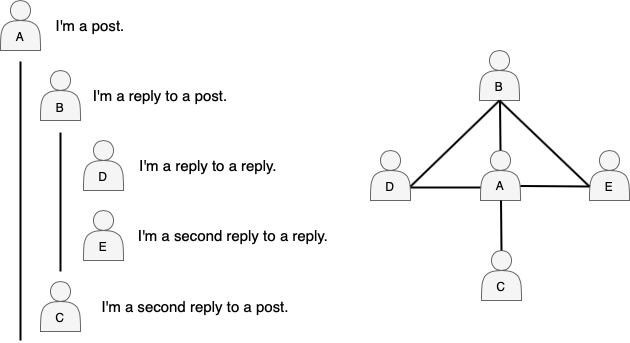
Social science argues that like-minded people tend to interact more with each other [Bahns et al., 2017], therefore we construct the social graph in a way that captures the users’ social interactions with each other. We define as social interaction the replies and mentions in a post thread. For each thread of posts, we connect all the chain of replies to the root (i.e. the original post) of the conversation and all mentions/replies to each other. Following, these connections are translated to user connections in the social graph. This method is more clearly depicted in Figure 3. The social graph is comprised by a set of user nodes and a set of edges between these users.
5.2. Graph Attention Network
Graph neural networks are able to leverage the semantic and social relations between users [Wu et al., 2021]. As users have a different influence on one another, we need to focus on users that have more relevant connections with higher influence. To model the gravity of the influences of the neighbourhood to a node, we use Graph Attention Networks (GAT) [Veličković et al., 2018]. GAT attends to the neighborhood of each user and assigns an importance score to the connections that contribute more to the detection of misinformation spreaders. The input to a GAT layer is a set of users embeddings where . A GAT layer produces updated features, , where . First, the GAT layer applies a shared linear transformation by a weight matrix . Then, we apply a shared self-attention mechanism to each node , using the neighbourhood . The normalized attention weight between node and neighbour node is computed as follows:
| (1) |
where represents the transpose and is the concatenation operation. , is a trainable parameter vector. The attention weights represent the importance of relation from node to node . To stabilize the learning process, we employ a multi-head attention [Vaswani et al., 2017]. We compute the output representation of a node as follows:
| (2) |
where, denotes normalized attention weight and linear transformation for -th head.
Classification Layer
The overall learned representations for each user, are forwarded into a linear layer parameterized by a weight matrix . The final prediction is computed as:
| (3) |
Given the true label for a user, we use cross-entropy loss to calculate the loss as follows:
| (4) |
6. Experiments
6.1. Models used
We compare our graph-based model as described in Section 5, with a Support Vector Machine (SVM), Logistic Regression (LogReg), and a Random Forest (RnFor) classifier which are trained by using the following features:
UBERT: We use the SBERT embeddings of the documents averaged over the user’s history as feature vectors, as described in Section 4.2.
User2Vec: To initialize the user feature vectors, we use User2Vec over the vocabulary of each user during their history.
Psycholing: We concatenate both LIWC and BFM features, to compute an initial feature vector for the users.
6.2. Performance evaluation and ablation study
Table 3 shows GAT’s score on the Reddit dataset for the fake news spreader detection task. We compare the graph-based results by using different initialization methods, namely UBERT, User2Vec, psycho-linguistic, concatenation of User2Vec and psycho-linguistic features, and random vectors. Interestingly, the proposed model achieves the best performance by utilizing User2Vec, despite having lower dimensionality than UBERT. This is mainly attributed to the fact that User2Vec embeddings were obtained based based on this dataset, while UBERT was pre-trained on a general-use corpus. The psycho-linguistic features, on their own, perform rather poorly with GAT and concatenating them to User2Vec does not contribute to the performance. However, the psycho-linguistic features perform comparably to UBERT in the non-neural baselines, which is in line with the observations of ?).
| Fake News Spreader Detection | |
|---|---|
| Model | score |
| GAT + User2Vec (200) | 61.6% |
| GAT + UBERT (768) | 61.2% |
| GAT + Psycholing (83) | 53.6% |
| GAT + User2Vec + Psycholing (283) | 59.4% |
| GAT + Random (200) | 47.8% |
Table 4 shows the score of the baseline models for both the the political bias and fake news spreader detection tasks. For the political bias identification task, UBERT consistently obtains better results than User2Vec, and achieves the best result with SVM. On the other hand, for the Fake news spreader detection task, we observe the reversed behavior. User2Vec consistently obtains significantly better results than UBERT, and achieves the best result with a Random Forest classifier.
| Political Bias | Fake News Spreader | |||
| Model | UBERT | User2Vec | UBERT | User2Vec |
| SVM | 66.2% | 63.0% | 53.9% | 61.1% |
| LogReg | 64.7% | 62.8% | 58.6% | 59.8% |
| RnFor | 64.9% | 63.5% | 49.7% | 61.3% |
Table 5 shows the ablative results of the psycho-linguistic features on the Reddit dataset for both political bias and fake news spreaders detection. In general, psycho-linguistic features show a significantly higher effectiveness in distinguishing users on the basis of political bias. Detected mental processes appear to be significantly more useful than personality factors: this result is coherent with the study conducted through the LIWC software by ?) about the link between political ideology and language use. Most relevant mental process is the affective kind, which correlates negatively with the target class, suggesting that right-biased users tend to express fewer emotions such as anxiety, anger and sadness in the text. As regards the other task, the BFM encoding appears slightly more effective for identifying fake news spreaders. Indeed, since personality regulates the behavior in real contexts, it is reasonable to assume it to be also influential within virtual communities. The dominant factor is here the openness to experience: as expected, in those who spread fake news, there is greater rejection or less curiosity towards ideas outside their belief system. Also, the schizotypy disorder appears relevant, consistent with previous empirical observations [Buckels et al., 2018].
We note that the psycho-linguistic features are not adaptive to the tasks since they are lexicon-based, therefore the embedding-based features achieve significantly higher scores in the political bias detection task. By comparing all results for the fake news spreader detection task, we observe that the GAT model outperforms all baselines. Therefore, the social interactions constitute a promising tool for predicting the behavior of unseen users.
| Political Bias | Fake News Spreader | |||||
| Model | LIWC | BFM | Both | LIWC | BFM | Both |
| SVM | 55.1% | 38.8% | 61.0% | 56.2% | 51.0% | 53.9% |
| LogReg | 63.6% | 51.5% | 63.9% | 58.3% | 55.1% | 58.3% |
| RnFor | 56.6% | 54.8% | 61.7% | 55.9% | 58.4% | 54.8% |
7. Conclusion
In this study we introduce a new user-centered dataset for misinformation spreader analysis, monitoring political discussions on Reddit since the beginning of 2020. We create a dataset that contains over 4K users with 3.4M Reddit posts, covering the time period before and after the US presidential elections. Apart from the fake news/real news distinction, the dataset contains fine-grained labels about the users’ credibility level and political bias. As far as we are aware, this is the first fake news spreader dataset that simultaneously captures both the long-term context of user’s historical posts and the interactions between users. To create the first benchmark on our data, we provide methods for identifying misinformation spreaders by utilizing the social connections between the users along with their psycho-linguistic features. In a subsequent analysis we observe that social connections increase robustness over content features, that detecting affective mental processes correlates negatively with right-biased users, and that the openness to experience factor is lower for those who spread fake news.
8. Ethical Considerations and Limitations
The ability to automatically approximate personal characteristics of online users in order to improve natural language classification algorithms requires us to consider a range of ethical concerns. Researchers are advised to take account of users’ expectations [Shilton and Sayles, 2016, Townsend and Wallace, 2016] when collecting public data such as Reddit. All user data is kept separately on protected servers, linked to the raw text and network data only through anonymous IDs. In addition, any user-augmented classification efforts risk invoking harmful stereotyping, as the algorithm labels people as misinformation spreaders. These can be emphasized by the semblance of objectivity created by the use of a computer algorithm [Koolen and van Cranenburgh, 2017].
Acknowledgements
This work has been supported by the German Federal Ministry of Education and Research (BMBF) as a part of the Junior AI Scientists program under the reference 01-S20060. The work at the Universitat Politècnica de València was in the framework of XAI-DisInfodemics: eXplainable AI for disinformation and conspiracy detection during infodemics (PLEC2021-007681) funded by the Spanish Ministry of Science and Innovation, and IBERIFIER: Iberian digital media research and fact-checking hub (INEA/CEF/ICT/A202072381931, n. 2020-EU-IA-0252) funded by the European Digital Media Observatory.
9. Bibliographical References
References
- Agirre et al., 2012 Agirre, E., Diab, M., Cer, D., and Gonzalez-Agirre, A. (2012). Semeval-2012 task 6: A pilot on semantic textual similarity. In Proceedings of the First Joint Conference on Lexical and Computational Semantics - Volume 1: Proceedings of the Main Conference and the Shared Task, and Volume 2: Proceedings of the Sixth International Workshop on Semantic Evaluation, SemEval ’12, page 385–393, USA. Association for Computational Linguistics.
- Amir et al., 2016 Amir, S., Wallace, B. C., Lyu, H., Carvalho, P., and Silva, M. J. (2016). Modelling context with user embeddings for sarcasm detection in social media. In Proceedings of The 20th SIGNLL Conference on Computational Natural Language Learning, pages 167–177, Berlin, Germany, August. Association for Computational Linguistics.
- Bahns et al., 2017 Bahns, A., Crandall, C., Gillath, O., and Preacher, K. (2017). Similarity in relationships as niche construction: Choice, stability, and influence within dyads in a free choice environment. Journal of Personality and Social Psychology, 11:329–355, 02.
- Baly et al., 2018 Baly, R., Karadzhov, G., Alexandrov, D., Glass, J., and Nakov, P. (2018). Predicting factuality of reporting and bias of news media sources. In Proceedings of the 2018 Conference on Empirical Methods in Natural Language Processing, pages 3528–3539, Brussels, Belgium, 10. Association for Computational Linguistics.
- Berinsky, 2017 Berinsky, A. J. (2017). Rumors and health care reform: Experiments in political misinformation. British Journal of Political Science, 47(2):241–262.
- Buckels et al., 2018 Buckels, E., Trapnell, P., Andjelovic, T., and Paulhus, D. (2018). Internet trolling and everyday sadism: Parallel effects on pain perception and moral judgment. Journal of Personality, 87, 04.
- Cai et al., 2017 Cai, C., Li, L., and Zengi, D. (2017). Behavior enhanced deep bot detection in social media. In 2017 IEEE International Conference on Intelligence and Security Informatics (ISI), pages 128–130.
- Cer et al., 2017 Cer, D., Diab, M., Agirre, E., Lopez-Gazpio, I., and Specia, L. (2017). Semeval-2017 task 1: Semantic textual similarity multilingual and crosslingual focused evaluation. Proceedings of the 11th International Workshop on Semantic Evaluation (SemEval-2017).
- Cervero et al., 2021 Cervero, R., Rosso, P., and Pasi, G. (2021). Profiling fake news spreaders: Personality and visual information matter. In Proc. 26th Int. Conf. on Applications of Natural Language to Information Systems, NLDB-2021, pages 355–363. Springer-Verlag, LNCS(12801), 06.
- Cheng and Chen, 2020 Cheng, Y. and Chen, Z. F. (2020). The influence of presumed fake news influence: Examining public support for corporate corrective response, media literacy interventions, and governmental regulation. Mass Communication and Society, 23(5):705–729.
- Daelemans et al., 2019 Daelemans, W., Kestemont, M., Manjavacas, E., Potthast, M., Rangel, F., Rosso, P., Specht, G., Stamatatos, E., Stein, B., Tschuggnall, M., Wiegmann, M., and Zangerle, E. (2019). Overview of pan 2019: Bots and gender profiling, celebrity profiling, cross-domain authorship attribution and style change detection. In Fabio Crestani, et al., editors, Experimental IR Meets Multilinguality, Multimodality, and Interaction, pages 402–416, Cham. Springer International Publishing.
- Figueira and Oliveira, 2017 Figueira, A. and Oliveira, L. (2017). The current state of fake news: challenges and opportunities. Procedia Computer Science, 121:817–825. CENTERIS 2017 - International Conference on ENTERprise Information Systems / ProjMAN 2017 - International Conference on Project MANagement / HCist 2017 - International Conference on Health and Social Care Information Systems and Technologies, CENTERIS/ProjMAN/HCist 2017.
- Garrett and Bond, 2021 Garrett, R. K. and Bond, R. M. (2021). Conservatives’ susceptibility to political misperceptions. Science Advances, 7(23):eabf1234.
- Giachanou et al., 2020 Giachanou, A., Ríssola, E. A., Ghanem, B., Crestani, F., and Rosso, P. (2020). The role of personality and linguistic patterns in discriminating between fake news spreaders and fact checkers. In Elisabeth Métais, et al., editors, Natural Language Processing and Information Systems, pages 181–192, Cham. Springer International Publishing.
- Girlea et al., 2016 Girlea, C., Girju, R., and Amir, E. (2016). Psycholinguistic features for deceptive role detection in werewolf. In Proceedings of the 2016 Conference of the North American Chapter of the Association for Computational Linguistics: Human Language Technologies, pages 417–422, San Diego, California, 06. Association for Computational Linguistics.
- Glenski et al., 2018 Glenski, M., Weninger, T., and Volkova, S. (2018). Identifying and understanding user reactions to deceptive and trusted social news sources. CoRR, abs/1805.12032.
- Hurtado et al., 2019 Hurtado, S., Ray, P., and Marculescu, R. (2019). Bot detection in reddit political discussion. In Proceedings of the Fourth International Workshop on Social Sensing, SocialSense’19, page 30–35, New York, NY, USA. Association for Computing Machinery.
- Jamnik and Lane, 2017 Jamnik, M. R. and Lane, D. J. (2017). The use of reddit as an inexpensive source for high-quality data. Practical Assessment, Research and Evaluation, 22:5.
- John and Srivastava, 1999 John, O. P. and Srivastava, S. (1999). The big five trait taxonomy: History, measurement, and theoretical perspectives. In Pervin, L.A. and John, O.P. Eds., Handbook of Personality: Theory and Research, Vol. 2, pages 102–138, New York. Guilford Press.
- Jordan et al., 2019 Jordan, K. N., Sterling, J., Pennebaker, J. W., and Boyd, R. L. (2019). Examining long-term trends in politics and culture through language of political leaders and cultural institutions. Proceedings of the National Academy of Sciences, 116:3476 – 3481.
- Kacupaj et al., 2021 Kacupaj, E., Plepi, J., Singh, K., Thakkar, H., Lehmann, J., and Maleshkova, M. (2021). Conversational question answering over knowledge graphs with transformer and graph attention networks. In Proceedings of the 16th Conference of the European Chapter of the Association for Computational Linguistics: Main Volume, pages 850–862, Online, April. Association for Computational Linguistics.
- Koolen and van Cranenburgh, 2017 Koolen, C. and van Cranenburgh, A. (2017). These are not the stereotypes you are looking for: Bias and fairness in authorial gender attribution. In Proceedings of the First ACL Workshop on Ethics in Natural Language Processing, pages 12–22, Valencia, Spain, April. Association for Computational Linguistics.
- Kosmajac and Keselj, 2020 Kosmajac, D. and Keselj, V. (2020). Twitter user profiling: Bot and gender identification - notebook for PAN at CLEF 2019. In Avi Arampatzis, et al., editors, Experimental IR Meets Multilinguality, Multimodality, and Interaction - 11th International Conference of the CLEF Association, CLEF 2020, Thessaloniki, Greece, September 22-25, 2020, Proceedings, volume 12260 of Lecture Notes in Computer Science, pages 141–153. Springer.
- Lee et al., 2020 Lee, J. H., Collados, J. C., Anke, L. E., and Schockaert, S. (2020). Capturing word order in averaging based sentence embeddings. In ECAI.
- Marelli et al., 2014 Marelli, M., Menini, S., Baroni, M., Bentivogli, L., Bernardi, R., and Zamparelli, R. (2014). A SICK cure for the evaluation of compositional distributional semantic models. In Proceedings of the Ninth International Conference on Language Resources and Evaluation (LREC’14), pages 216–223, Reykjavik, Iceland, May. European Language Resources Association (ELRA).
- McKay and Tenove, 2020 McKay, S. and Tenove, C. (2020). Disinformation as a threat to deliberative democracy. Political Research Quarterly, 0(0):1065912920938143.
- mediabiasfactcheck.com, 2021 mediabiasfactcheck.com. (2021). mediabiasfactcheck.com. https://mediabiasfactcheck.com/methodology/. Accessed: 2021-08-10.
- Monti et al., 2019 Monti, F., Frasca, F., Eynard, D., Mannion, D., and Bronstein, M. M. (2019). Fake news detection on social media using geometric deep learning. CoRR, abs/1902.06673.
- Mu and Aletras, 2020 Mu, Y. and Aletras, N. (2020). Identifying twitter users who repost unreliable news sources with linguistic information. PeerJ Comput. Sci., 6:e325.
- Neuman and Cohen, 2014 Neuman, Y. and Cohen, Y. (2014). A vectorial semantics approach to personality assessment. Scientific reports, 4:4761, 04.
- Nyhan and Reifler, 2010 Nyhan, B. and Reifler, J. (2010). When corrections fail: The persistence of political misperceptions. Political Behavior, 32(2):303–330.
- Osmundsen et al., 2021 Osmundsen, M., Bor, A., Vahlstrup, P. B., Bechmann, A., and Petersen, M. B. (2021). Partisan polarization is the primary psychological motivation behind political fake news sharing on twitter. American Political Science Review, 115(3):999–1015.
- Pennebaker et al., 2015 Pennebaker, J. W., Boyd, R., Jordan, K., and Blackburn, K. (2015). The development and psychometric properties of LIWC2015. University of Texas at Austin.
- Pérez-Rosas et al., 2018 Pérez-Rosas, V., Kleinberg, B., Lefevre, A., and Mihalcea, R. (2018). Automatic detection of fake news. In COLING.
- Plepi and Flek, 2021 Plepi, J. and Flek, L. (2021). Perceived and intended sarcasm detection with graph attention networks. In Findings of the Association for Computational Linguistics: EMNLP 2021, pages 4746–4753.
- Rangel et al., 2020 Rangel, F. M., Giachanou, A., Ghanem, B., and Rosso, P. (2020). Overview of the 8th author profiling task at PAN 2020: Profiling fake news spreaders on twitter. In Linda Cappellato, et al., editors, Working Notes of CLEF 2020 - Conference and Labs of the Evaluation Forum, Thessaloniki, Greece, September 22-25, 2020, volume 2696 of CEUR Workshop Proceedings. CEUR-WS.org.
- Rashkin et al., 2017 Rashkin, H., Choi, E., Jang, J. Y., Volkova, S., and Choi, Y. (2017). Truth of varying shades: Analyzing language in fake news and political fact-checking. In Proceedings of the 2017 Conference on Empirical Methods in Natural Language Processing, pages 2931–2937, Copenhagen, Denmark, September. Association for Computational Linguistics.
- Redlawsk et al., 2010 Redlawsk, D. P., Civettini, A. J. W., and Emmerson, K. M. (2010). The affective tipping point: Do motivated reasoners ever “get it”? Political Psychology, 31(4):563–593.
- Reimers and Gurevych, 2019 Reimers, N. and Gurevych, I. (2019). Sentence-BERT: Sentence embeddings using Siamese BERT-networks. In Proceedings of the 2019 Conference on Empirical Methods in Natural Language Processing and the 9th International Joint Conference on Natural Language Processing (EMNLP-IJCNLP), pages 3982–3992, Hong Kong, China, November. Association for Computational Linguistics.
- Ren and Zhang, 2020 Ren, Y. and Zhang, J. (2020). Hgat: Hierarchical graph attention network for fake news detection. ArXiv, abs/2002.04397.
- Review, 2021 Review, C. J. (2021). Cjr index of fake-news, clickbait, and hate sites. https://www.cjr.org/fake-beta. Accessed: 2021-08-10.
- Sawhney et al., 2021 Sawhney, R., Joshi, H., Shah, R. R., and Flek, L. (2021). Suicide ideation detection via social and temporal user representations using hyperbolic learning. In Proceedings of the 2021 Conference of the North American Chapter of the Association for Computational Linguistics: Human Language Technologies, pages 2176–2190, Online, June. Association for Computational Linguistics.
- Shilton and Sayles, 2016 Shilton, K. and Sayles, S. (2016). ” we aren’t all going to be on the same page about ethics”: Ethical practices and challenges in research on digital and social media. In 2016 49th Hawaii International Conference on System Sciences (HICSS), pages 1909–1918. IEEE.
- Shrestha and Spezzano, 2019 Shrestha, A. and Spezzano, F. (2019). Online misinformation: From the deceiver to the victim. In Proceedings of the 2019 IEEE/ACM International Conference on Advances in Social Networks Analysis and Mining, ASONAM ’19, page 847–850, New York, NY, USA. Association for Computing Machinery.
- Shu et al., 2017 Shu, K., Sliva, A., Wang, S., Tang, J., and Liu, H. (2017). Fake news detection on social media: A data mining perspective. CoRR, abs/1708.01967.
- Shu et al., 2018 Shu, K., Wang, S., and Liu, H. (2018). Understanding user profiles on social media for fake news detection. In 2018 IEEE Conference on Multimedia Information Processing and Retrieval (MIPR), pages 430–435.
- Swire et al., 2017 Swire, B., Ecker, U., and Lewandowsky, S. (2017). The role of familiarity in correcting inaccurate information. Journal of Experimental Psychology: Learning, Memory, and Cognition, 43(12):1948–1961, December.
- Tausczik and Pennebaker, 2010 Tausczik, Y. and Pennebaker, J. (2010). The psychological meaning of words: Liwc and computerized text analysis methods. Journal of Language and Social Psychology, 29:24–54, 03.
- Townsend and Wallace, 2016 Townsend, L. and Wallace, C. (2016). Social media research: A guide to ethics. University of Aberdeen, 1:16.
- Vaswani et al., 2017 Vaswani, A., Shazeer, N., Parmar, N., Uszkoreit, J., Jones, L., Gomez, A. N., Kaiser, L., and Polosukhin, I. (2017). Attention is all you need. CoRR, abs/1706.03762.
- Veličković et al., 2018 Veličković, P., Cucurull, G., Casanova, A., Romero, A., Liò, P., and Bengio, Y. (2018). Graph attention networks.
- Visentin et al., 2019 Visentin, M., Pizzi, G., and Pichierri, M. (2019). Fake news, real problems for brands: The impact of content truthfulness and source credibility on consumers’ behavioral intentions toward the advertised brands. Journal of Interactive Marketing, 45:99–112.
- Vivitha Vijayan, 2019 Vivitha Vijayan, S. G. (2019). A survey on author profiling techniques. International Journal of Computer Sciences and Engineering, 7:1065–1069, 3.
- Vo and Lee, 2019 Vo, N. and Lee, K. (2019). Learning from fact-checkers: Analysis and generation of fact-checking language. In Proceedings of the 42nd International ACM SIGIR Conference on Research and Development in Information Retrieval, SIGIR’19, page 335–344, New York, NY, USA. Association for Computing Machinery.
- Wu et al., 2021 Wu, Z., Pan, S., Chen, F., Long, G., Zhang, C., and Yu, P. S. (2021). A comprehensive survey on graph neural networks. IEEE Transactions on Neural Networks and Learning Systems, 32(1):4–24, Jan.
- Zellers et al., 2019 Zellers, R., Holtzman, A., Rashkin, H., Bisk, Y., Farhadi, A., Roesner, F., and Choi, Y. (2019). Defending against neural fake news. CoRR, abs/1905.12616.
- Zhou and Zafarani, 2020 Zhou, X. and Zafarani, R. (2020). A survey of fake news: Fundamental theories, detection methods, and opportunities. ACM Comput. Surv., 53(5), September.
- Zhou et al., 2020 Zhou, X., Jain, A., Phoha, V. V., and Zafarani, R. (2020). Fake news early detection. Digital Threats: Research and Practice, 1:1 – 25.