X-ray Eclipse Mapping Constrains the Binary Inclination and Mass Ratio of Swift J1858.60814
Abstract
X-ray eclipse mapping is a promising modelling technique, capable of constraining the mass and/or radius of neutron stars (NSs) or black holes (BHs) in eclipsing binaries and probing any structure surrounding the companion star. In eclipsing systems, the binary inclination, , and mass ratio, relate via the duration of totality, . The degeneracy between and can then be broken through detailed modelling of the eclipse profile. Here we model the eclipses of the NS low-mass X-ray binary Swift J1858.6-0814 utilising archival NICER observations taken while the source was in outburst. Analogous to EXO 0748676, we find evidence for irradiation driven ablation of the companion’s surface by requiring a layer of stellar material to surround the companion star in our modelling. This material layer extends km from the companion’s surface and is likely the cause of the extended, energy-dependent and asymmetric ingress and egress that we observe. Our fits return an inclination of and a mass ratio . Using Kepler’s law to relate the mass and radius of the companion star via the orbital period ( hrs), we subsequently determine the companion to have a low mass in the range and a large radius in the range . Our results, combined with future radial velocity amplitudes measured from stellar absorption/emission lines, can place precise constraints on the component masses in this system.
keywords:
Accretion: Accretion Discs – Stars: Neutron Stars – X-rays: Binaries1 Introduction
X-ray binary systems comprising of a neutron star (NS) or a black hole (BH) in orbit with a secondary star provide means to develop binary evolution models (Steiner et al., 2010; Podsiadlowski, 2014; Postnov & Yungelson, 2014), study accretion processes (Done, 2010; Zhang et al., 2014; Ponti et al., 2014) and probe the strong gravity regime (Kaaret & Ford, 1997; Dovciak, 2004; Stevens & Uttley, 2017). While relatively rare, observations of eclipsing X-ray binaries are fundamental when measuring physical properties, particularly of NSs, for which the equation of state (EoS) remains uncertain (Özel & Freire, 2016). These observations can also provide a way to probe ablation processes and properties of the companion star’s surroundings (Knight et al., 2021). In such systems, periodic X-ray eclipses occur when the X-ray emitting region is occulted by the companion star (Cominsky & Wood, 1984; Parmar et al., 1986). Naturally, eclipses demand a sufficiently high binary inclination. However, determining the exact inclination angle requires knowledge of the physical properties of secondary star, and the binary mass ratio, , where and are the mass of the companion star and NS respectively, governs the minimum inclination for which eclipses are observable. In eclipsing X-ray binaries, the binary inclination and mass ratio can be disentangled somewhat since they are related via the duration of totality if the companion star is filling its Roche-Lobe (Horne, 1985). Thus, by determining the duration of totality and either the mass ratio or the binary inclination, the remaining parameter can be constrained, providing the orbital period is known.
The binary inclination can be determined independently of the mass ratio and totality duration through several methods. The inclination of material close to the compact object can be determined by comparing the properties of two sides of the jet (Hjellming & Johnston, 1981), or through modelling the effect of Doppler and gravitational shifts on the X-ray spectrum, typically via the iron line (Fabian et al., 1989) but also potentially from the thermal disc spectrum if very good data can be obtained (Parker et al., 2019). Further from the compact object, optical and X-ray disc winds can suggest the inclination of the disc from which they are launched (Ponti et al., 2012; Higginbottom et al., 2018). The inclination of the binary orbit itself can be determined from ellipsoidal modulations arising from tidal distortion of the companion star (Casares et al., 2014), or through X-ray eclipse mapping which models the shape and duration of the ingress, egress and totality to determine the binary mass ratio and totality duration (Knight et al., 2021). Eclipse mapping can, therefore, self-consistently constrain the mass ratio, , the binary inclination, and the totality duration , and is particularly beneficial when modelling extended or asymmetric eclipse profiles (Knight et al., 2021).
Swift J1858.60814 is a NS low mass X-ray binary (LMXB) known to exhibit X-ray eclipses that are heavily extended and asymmetric (Buisson et al., 2021). This source was originally discovered as an X-ray transient in October 2018 (Krimm et al., 2018) with a variable counterpart observed at optical (Vasilopoulos et al., 2018; Baglio et al., 2018) and radio (van den Eijnden et al., 2020) wavelengths. Initially, Swift J1858.60814 displayed significant X-ray variability, changing by factors of several hundred within a few hundred seconds (Hare et al., 2020). As a result, Swift J1858.6-0814 was described as an analogue of the BH sources V4641 Sgr and V404 Cyg, which were observed to show similarly strong variability during their outbursts (Wijnands & van der Klis, 2000; Revnivtsev, M. et al., 2002; Walton et al., 2017; Motta et al., 2017). Swift J1858.60814 transitioned from this so-called flaring outburst state (2018 - 2019) to a steady outburst state (2020) with a more persistent X-ray flux. The first half of 2020 saw the steady-state flux decline and the source has been in quiescence since May 2020 ( MJD) (Saikia et al., 2020; Parikh et al., 2020).
During the steady-state, Type I X-ray bursts were detected (Buisson et al., 2020) thus identifying Swift J1858.6-0814 as a NS LMXB, although no pulsations have been detected. The steady-state enabled the discovery of extended and asymmetric eclipses which appear to depend on energy (Buisson et al., 2021). Analysis by Buisson et al. (2021) of all available NICER observations uncovered an average ingress duration of s and an average egress duration of s. Through simultaneous calculation of the totality duration and orbital period, they respectively determine s and hrs. Additionally, the eclipse duration to orbital period ratio constrains the inclination to, . Buisson et al. (2021) utilise their calculated orbital period to determine the companion’s mass as a function of radius, concluding that the companion must be a sub-giant due to the large inferred stellar radius and inconsistency with the main sequence mass-radius relation of Demircan & Kahraman (1991).
Here we model X-ray eclipse profiles of Swift J1858.60814 in multiple energy bands, using all available archival NICER data. Since the eclipses appear energy-dependent, extended and asymmetric (Buisson et al., 2021), we apply our previously published eclipse profile model (Knight et al., 2021), assuming an X-ray point source, thus allowing us to self-consistently constrain the binary inclination, , the mass ratio, and the totality duration, . We note that the extended ingress and egress duration observed will not allow for a NS radius constraint. These features do, however, enable us to probe the structure of the companion star’s surroundings and we infer the presence of an absorbing medium that extends several thousands of kilometres from the stellar surface. This medium is likely the cause of the observed extended and asymmetric eclipse profiles. In Section 2, we detail our data reduction procedure before presenting stacked energy-resolved eclipse profiles and a fit to the time-averaged spectrum. In Section 3, we model the energy-resolved eclipse profiles and use our results to derive a posterior probability distribution for the mass ratio, and binary inclination, . We discuss our results in Section 4 and conclude in Section 5.
2 Data Reduction and Analysis
We consider all available archival NICER observations of Swift J1858.60814 during outburst; these are all ObsIDs beginning with 120040, 220040, 320040 or 359201. These observations occurred between November 2018 and July 2020, thus containing detections from both the flaring and steady outburst states.
2.1 Data Reduction
The data are reduced using the NICER data reduction software nicerdas V008 (HEASoft V6.29, CALDB 20210707), keeping most filtering criteria to their default values (e.g Buisson et al. 2021). We include data taken at low Sun angle by following the procedure of Buisson et al. (2021) and relax the undershoot rate limit to allow up to 400 cts/s (per FPM). At low Sun angles, optical loading is relatively high, which can deteriorate the response and raise the background at energies keV. This does not impact our timing analysis or modelling of eclipses between keV. We again follow Buisson et al. (2021) to carefully remove any achromatic dips arising from occultation of the detector plane by parts of the ISS as there are some instances in which these are not filtered out by the NICER pipeline. We barycentre the events and use xselect to extract keV time-averaged spectra and light curves with 1 second time bins, in seven energy bands; keV, keV, keV, keV, keV, keV and keV.
2.2 Eclipse profiles
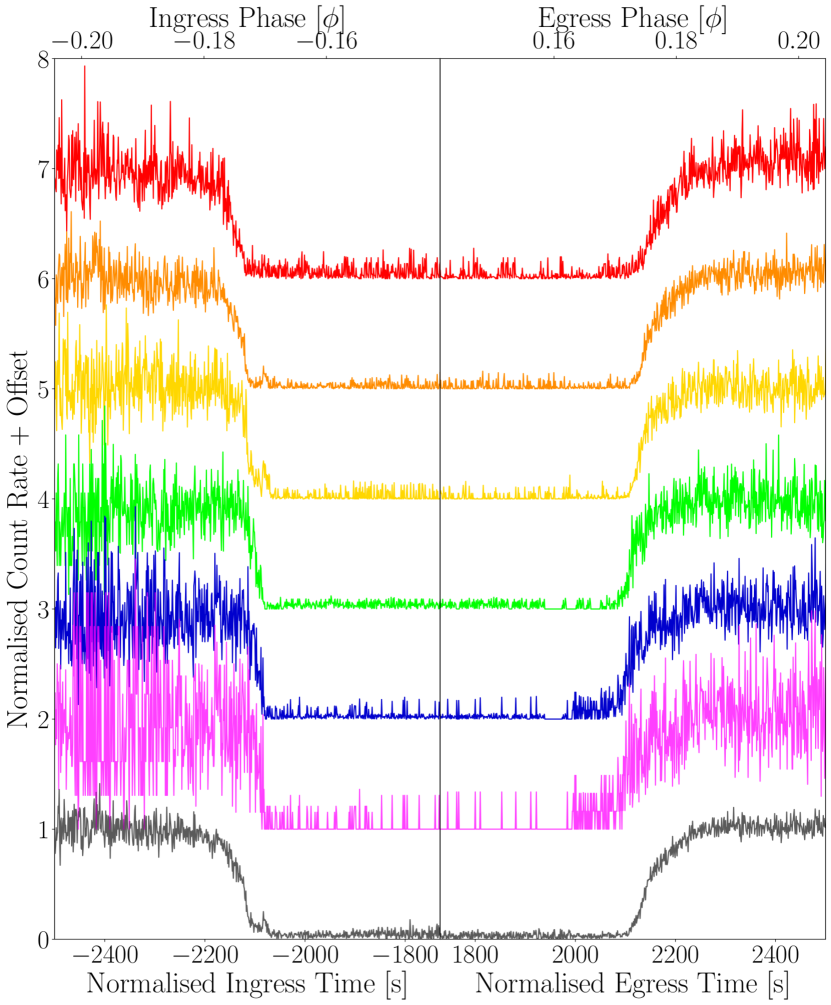
To obtain eclipse profiles in each energy band, we fold the data on the orbital period s ( hours) (Buisson et al., 2021) and divide through by the mean out-of-eclipse count rate. Fig. 1 shows the resulting eclipse profiles for all seven energy bands, displayed with vertical offsets for visual clarity. Note that the eclipse profile in Fig. 1 arises from partial eclipses only since the eclipse duration of s (Buisson et al., 2021) is too long to be observed in full by NICER. We find 5 ingresses ( orbital cycles 39, 43, 47, 52 and 56) and 7 egresses ( orbital cycles 28, 32, 38, 42, 50, 51 and 55), where the zeroth orbital cycle is defined to coincide with the onset of the steady state at MJD (Buisson et al., 2021). Since we divide through by the mean out-of-eclipse count rate, the stacked eclipse profile for each energy band reaches unity during out-of-eclipse phases. The totality, however, is and not zero due to a background contributed, low in-eclipse count rate. The eclipse profiles are also shifted such that the time at the centre of the eclipse is s (orbital phase ).
Swift J1858.6-0814 shows two distinct outburst states - the flaring state and the steady-state divided at MJD 58885 (see in Fig. 1 of Buisson et al. 2021). The eclipses are only readily apparent in the light curves of the more recent (2020) steady-state, which show partial eclipses in the form of 5 ingresses and 7 egresses. However, the flaring state observations are also consistent with including eclipses at the orbital phases expected from analysing the steady-state. The extreme flaring and frequent telemetry drop-outs make it difficult to identify eclipses in the light curves during the flaring state, but folding all observations on the orbital period derived from the steady-state observations reveals that the flaring state count rate is always consistent with the background during expected totality phases (Buisson et al., 2021). Despite this, there are no clear ingresses or egresses in the flaring state data since they all happen to occur within telemetry gaps.
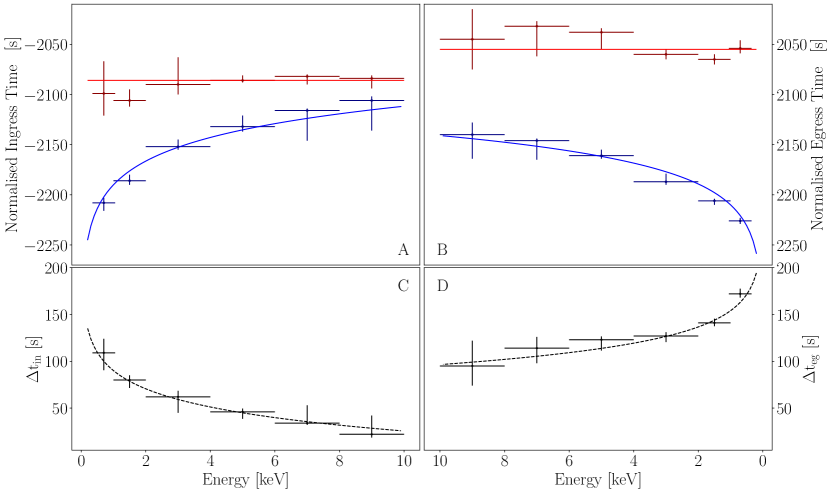
We see from Fig. 1 that the eclipse ingress and egress are both heavily extended in time, with the egress appearing to be longer in duration than the ingress (consistent with the analysis of Buisson et al. 2021). We also see the eclipse profile shape, and therefore ingress and egress duration appears to depend on photon energy. To investigate this further, we plot estimates of the start and end times of ingress and egress as a function of energy in Fig. 2. Here, following Knight et al. 2021, a time during an eclipse transition, , is defined as the time at which the count rate first passes per cent of the mean out-of-eclipse level and remains past it for s. Therefore, when applied to the ingress and egress, measures the ingress start time and the egress end time, while measures the totality start and end times.
The t90 times depend strongly on energy. For the ingress, t90 increases with photon energy and the egress t90 mirrors this, decreasing with photon energy. This behaviour is well described by a logarithmic equation (solid blue trend line in Figs. 2A and 2B). For both the ingress and egress, t10 is approximately independent of energy, although some variations are observed. These variations likely result from the presence of a background contributed, fluctuating, low in-eclipse count rate. The t10 and t90 behaviour is equivalent to the duration of both the ingress and egress decreasing with increasing energy. This is shown explicitly in Figs. 2C and 2D respectively for the ingress and egress. These plots additionally confirm that the egress is longer in duration than the ingress. We measure the ingress duration to be s and the egress duration to be s.
These extended, asymmetric, energy-dependent eclipse transitions are similar to those observed in EXO 0748676 by EXOSAT (Parmar et al., 1991), RXTE (Wolff et al., 2009) and XMM-Newton (Knight et al., 2021), and can be explained by the presence of an ionised layer of material around the companion star (Knight et al., 2021). As our sight-line passes closer to the companion star, the column density of the material layer increases thus causing an energy-dependent drop in flux during the ingress. A sufficiently high column density is, therefore, achieved close to the companion’s surface and results in energy independence at the start and end of totality. The eclipse asymmetry can be explained if the absorbing medium trails behind the companion star as a result of the stars orbital motion. Given the remarkable similarity between the eclipses in EXO 0748676 and Swift J1858.6-0814, here we consider the same model developed in Knight et al. (2021) for EXO 0748676. Since the material layer is much larger than the NS, we approximate the X-ray source as a point source.
2.3 Fit to the Time Averaged Spectrum
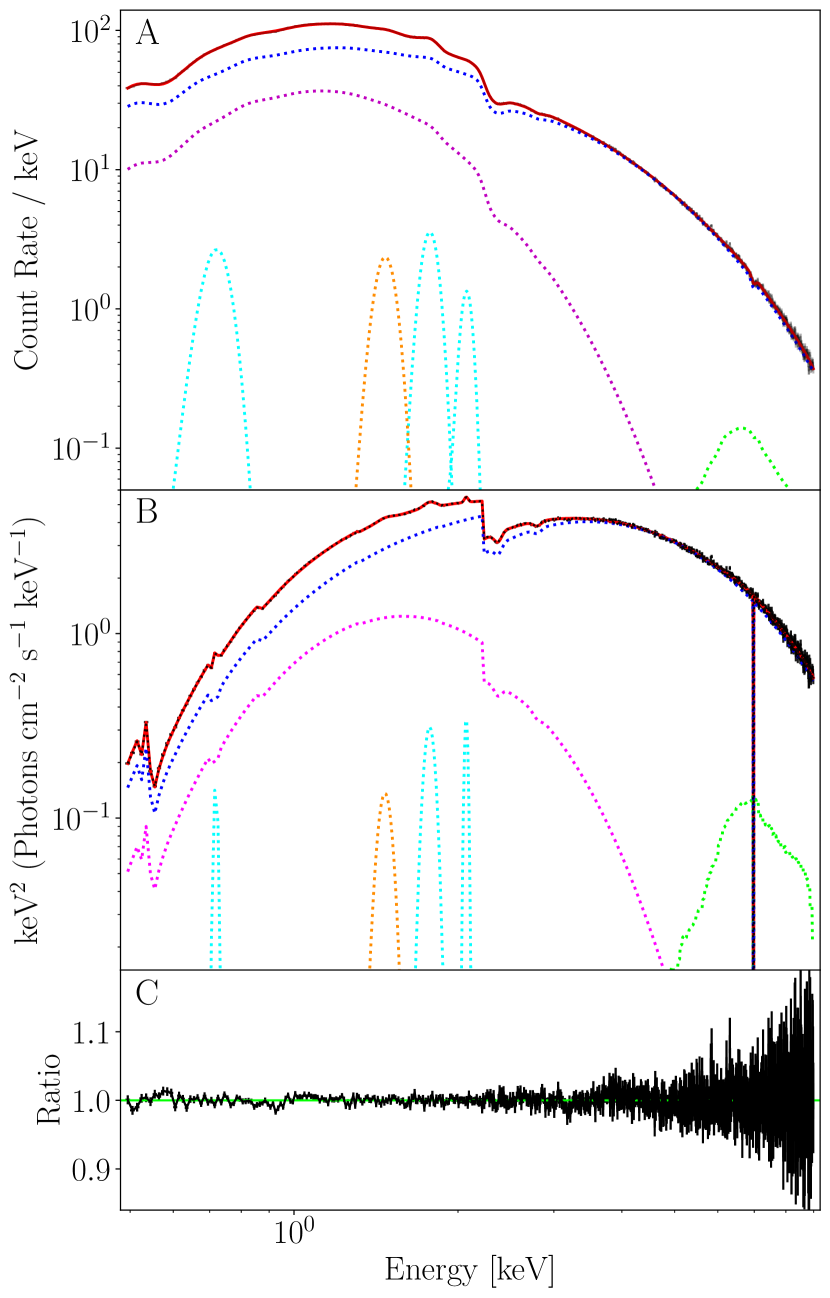
Using xspec V12.12.0 (Arnaud, 1996), we fit the time-averaged spectrum with the model
| (1) |
Here, diskbb and bbody respectively describe the multi-temperature spectrum originating from the accretion disc and a blackbody spectrum originating from the NS surface. Absorption by the interstellar medium is accounted for by tbabs and assumes the abundances of Wilms et al. (2000). The spectrum requires an emission contribution from Fe K which is modelled as a laor emission line with keV (Laor, 1991). The laor component models the Fe K line as a relativistically smeared line, assuming a delta function in the rest frame. It would be more precise to instead use a full X-ray reflection model such as relxill (García et al., 2014), which also accounts for effects such as electron scattering and absorption edges. We attempted spectral fits using relxill, xillver and xillvercp (flavours of the relxill model), but found that these models were not well suited to modelling the softer X-ray components of the spectrum. Nonetheless, the laor component captures the asymmetrically broadened shape of the line indicative of relativistic smearing from a highly inclined disc. There are 3 further components in our spectral model: E, A and G. Here, E corresponds to two absorption edges (edge) at keV and keV. These features likely arise from NICER calibration systematics as they could be attributed to Oxygen ( keV) and a gold M edge (2.14.5 keV complex) (Wang et al., 2021). A corresponds to three Gaussian absorption lines (gabs) at energies keV, keV and keV. The first two are likely associated with the aforementioned gold M absorption while the third physically corresponds to Fe XXVI K. Lastly, G represents four Gaussian emission lines (gauss) at energies keV (Si VIII K), keV (Fe XVIII L), keV (Al K) and keV (P XIV K). These are assumed to be real features with the exception of Al K which may arise from NICER calibration systematics (Wang et al., 2021).
| Model Component | Parameter | Value |
|---|---|---|
| tbabs | [1022 cm-2] | 0.233 |
| diskbb | T [keV] | 1.186 |
| bbody | [keV] | 0.356 |
| laor | [keV] | 6.573 |
| 2.376 | ||
| Rin [GM/c2] | 4.892 | |
| Rout [GM/c2] | 400.0 | |
| [deg] | 86.20 | |
| Absorption Edges (E) | [keV] | 2.224 |
| edge | [keV] | 0.368 |
| [keV] | 0.482 | |
| [keV] | 0.803 | |
| Absorption Lines (A) | [keV] | 2.369 |
| gabs | [keV] | 0.038 |
| [keV] | 2.797 | |
| [keV] | 0.048 | |
| [keV] | 6.974 | |
| [keV] | 0.002 | |
| Emission Lines (G) | [keV] | 1.772 |
| gauss | [keV] | 0.042 |
| [keV] | 0.7181 | |
| [keV] | 0.006 | |
| [keV] | 1.466 | |
| [keV] | 0.043 | |
| [keV] | 2.071 | |
| [keV] | 0.016 |
a Parameter fixed for the duration of the fit.
We show the resulting model (red) in Fig. 3. The individual components, respectively, are coloured green, magenta and blue which correspond to the Laor iron line profile, the NS surface blackbody and the multi-temperature blackbody originating from the accretion disc. The astrophysical emission lines at keV (Fe L), keV (Si K), and keV (P k) are shown in cyan and the keV (Al K) emission line, suspected to be present as a result of NICER calibration systematics is shown in orange. Our fit returns the parameters listed in Table 1, a reduced of and the corresponding null hypothesis probability is . The eclipse duration (the sum of the duration of the ingress, totality and egress) is s, corresponding to of the orbital period. Also, the in-eclipse count rate is low. As such, it is reasonable to assume the out-of-eclipse can be approximated by the time-averaged spectrum. Therefore, we use the time-averaged spectrum within the eclipse profile model. Note that the eclipse profile model is not sensitive to the X-ray spectral model used, but simply requires a reasonable fit to the observed spectrum (see Knight et al. 2021). Since we assume an X-ray point source, any spectral decomposition that fits the observed spectrum would have the same time dependence. Therefore, the X-ray spectral model is not critical to the results obtained via eclipse mapping. As such we are content with our spectral model including a laor iron line profile and we do not pursue a more complex reflection model.
3 Eclipse Mapping
In Section 2 we demonstrated that the observed eclipse profiles of Swift J1858.60814 have many of the same characteristics (extended in time, asymmetric and energy-dependent) as those of EXO 0748676 (Parmar et al., 1991; Wolff et al., 2009; Knight et al., 2021). Furthermore, an orbital phase-resolved spectral analysis of the ingress and egress regions in Swift J1858.6-0814, returns similar results to our previous analysis of EXO 0748676 (Knight et al., 2021). As such, it seems sensible to use the same modelling approach for Swift J1858.6-0814 as we used for EXO 0748676. We find that the abundance of similarities in the eclipse profiles of these two sources requires a thorough discussion, thus we separate our findings. We present the constraints on binary inclination, and mass ratio, obtained via our eclipse profile modelling here, and will present the results of our phase-resolved spectral analysis in a forthcoming study (Knight et al. in prep). Full details of the eclipse mapping model can be found in Knight et al. (2021), however, we include a self-contained summary here.
3.1 Eclipse Profile Model
We assume the companion star is spherically symmetric. The star itself is optically thick, but has a layer of optically thin absorbing material surrounding it. The eclipse transitions, therefore, start when a line-of-sight first passes through this absorbing layer and the hydrogen column density for the line-of-sight is (Knight et al., 2021):
| (2) |
where is the radial density profile of the surrounding material, is surface column density, is the distance from the surface of the companion star defined in units of the companion star radius, is the impact parameter (Knight et al., 2021) and represents the furthest distance from the companion star surface where the density of the material layer is non-negligible. Assuming circular orbits, and that the companion is filling its Roche-Lobe, the inclination, , and mass ratio, are related via the totality duration, , and orbital period, :
| (3) |
where is the ratio of the Roche-Lobe radius to the orbital separation (e.g. equation 8 from Knight et al. 2021). The impact parameter is a function of orbital phase, inclination and (equation 6 from Knight et al. 2021). Therefore, to calculate the impact parameter as a function of orbital phase, the only model parameter required is when and are known.
Four radial density functions are currently provided within the eclipse profile model. These are
-
1.
a power-law with index corresponding to a stellar wind with constant velocity; ,
-
2.
an accelerating stellar wind with acceleration parameter ; ,
-
3.
a Gaussian outflow described by the fractional width of material, ; ,
-
4.
and an exponential outflow described by material scale height, ; .
Here i and ii are often seen in stellar wind modelling (e.g. van der Helm et al. 2019; Puls et al. 2008) while iii and iv would be more typical of ablation or atmosphere modelling (Knight et al., 2021). Our model additionally allows the material layer to be turned off by instead applying an abrupt transition between out-of-eclipse and totality. Thus, the ingress and egress are modelled as straight lines.
The time-dependent specific photon flux, , is the product of an energy dependent transmission factor, and the out-of-eclipse spectrum, (approximated by the time-averaged spectrum in Section 2.3). We use our absorption and scattering model abssca (Knight et al., 2021) to calculate , thus introducing the ionisation parameter () and covering fraction () as properties of the absorbing material. These material properties are free model parameters and their ingress values ( and ) can differ from their egress values ( and ). All forms of are trialled, in addition to trying no material layer. Each of the characteristic density function parameters (, , or , depending on the form being used) can have different values during the ingress and the egress.
3.2 Results
| Density Profile | Parameter(s) | ||||
| No Material | - | 104600 | 2675 | - | - |
| Power-law | m = 2.00 | 99100 | 2675 | - | - |
| m = 10.0 | 32900 | 2675 | - | - | |
| = 198.2 | 2696.0 | 2673 | 0.139 | ||
| = 178.9 | |||||
| Accelerating | = 6.12 | 4640.6 | 2673 | 0.137 | |
| = 7.68 | |||||
| Gaussian | = 0.0099 | 2723.6 | 2673 | 0.433 | 0.140 |
| = 0.0119 | |||||
| Exponential | = 0.0086 | 2679.0 | 2673 | 0.464 | 0.139 |
| = 0.0135 |
a Parameter fixed for the duration of the fit.
| Parameter | Gaussian Density Profile | Exponential Density Profile |
|---|---|---|
| P [s] | 76841.3 | 76841.3 |
| 4103.52 | ||
| 0.1402 | 0.1394 | |
| 80.90 | 80.96 | |
| 1.935 | 1.906 | |
| 1.953 | 1.910 | |
| 0.999 | 0.980 | |
| 0.997 | 0.984 | |
| or | 0.0099 | 0.0086 |
| or | 0.0119 | 0.0135 |
We simultaneously fit the eclipse profiles of Swift J1858.6 -0814 in five energy bands; keV, keV, keV, keV and keV using xspec v12.12.0. All eclipse profiles are obtained following the procedure described in Section 2.2. Note the keV band is preferred to separate keV and keV bands as the former has a higher number of counts per bin, thus allowing the use of chi-squared fit statistics. We ensure the best-fitting model parameters primarily correspond to the eclipse transitions, which host the energy-dependent behaviour, by ignoring most of the out-of-eclipse and totality phase bins. Despite this, a systematic error of per cent is applied to account for the variability in the remaining out-of-eclipse portion of the data. The eclipse duration has previously been measured as s (Buisson et al., 2021), therefore, we initially set s but keep it as an unconstrained free parameter during the fits.
Following the modelling approach of Knight et al. (2021), we first trial our eclipse profile model with no absorbing material surrounding the companion. Given the extended ingress and egress duration in the eclipse profiles, it is unsurprising that this model fits the data poorly (). Therefore, the data require some absorbing medium surrounding the companion star to recreate the extended and asymmetric ingress and egress. We test the four radial density profiles detailed in Section 3.1 and present the resulting fit statistics in Table 2. Although the assumed form of the density profile has a large influence on fit quality, it has little effect on the inferred mass ratio, which is for all fits where constraints are possible.
Assuming reasonable power-law indices of and , the power-law radial density profile does not yield a good fit to the data. Respectively, the reduced chi-squared are and , the associated null-hypothesis probabilities are negligible and the mass ratios are unconstrained. Allowing the power-law indices to be free during the fits yields unphysical values of and for the ingress and egress respectively. While a statically better fit is achieved here () than for the fits assuming power-law indices of and , it is clear that the data require a steeper radial density function. Thus, we discard the power-law density profile.
The accelerating wind profile is a steeper function, with the density dropping off more quickly with distance from the companion star’s surface, thus could improve upon the fits using the power-law density profile. However, this radial density function is simply too steep to model the heavily extended eclipse transitions we observe and is, therefore, discarded. The best-fitting acceleration parameters for the ingress and egress respectively are and , yielding , and the associated null-hypothesis probability is, .
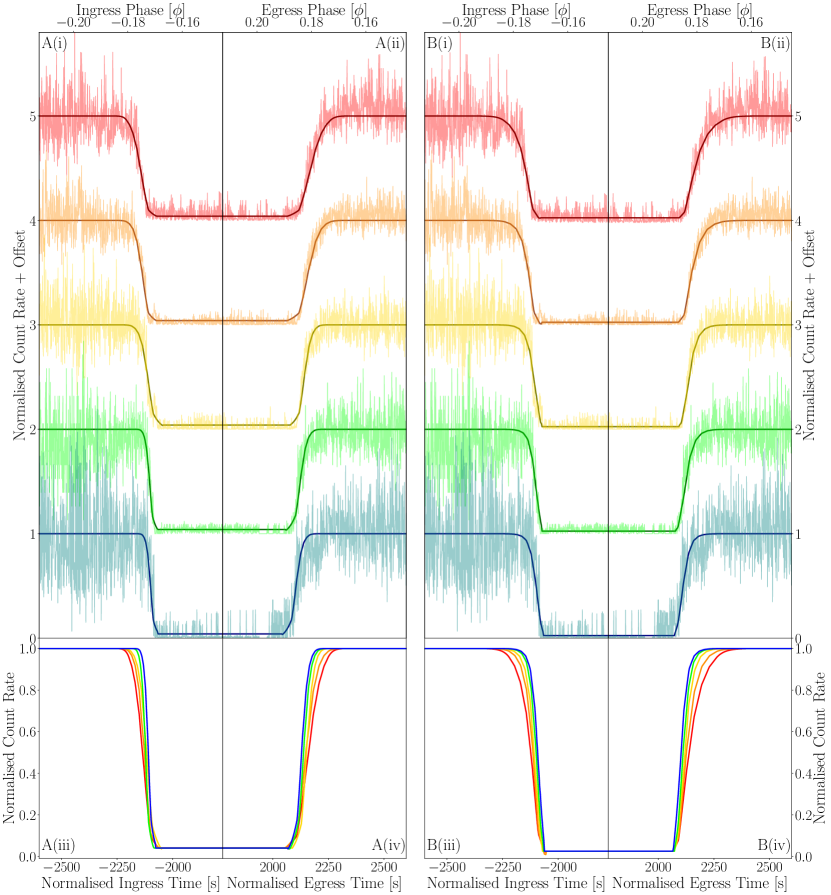
The remaining two density profiles yield acceptable fits to the observed eclipse profiles. We show the resulting eclipse profiles for both the Gaussian and exponential density profiles in Fig. 6A(i) - A(iv) and Fig. 6B(i) - B(iv) respectively. For the Gaussian and exponential density profiles we obtain () and () respectively. Since both fits are statistically similar, we consider both density profiles in our subsequent analysis and present the best fitting parameters from both models in Table 3.
The best-fitting model parameters obtained assuming the Gaussian radial density profile are found to be consistent with the best-fitting model parameters obtained assuming the exponential radial density profile within a error, thus increasing confidence in our constraints on and subsequent constraints on . We find consistent ionisation parameters between the ingress and egress side of the star, which is in contrast to EXO 0748676 where the ingress appeared to be more heavily ionised (Knight et al., 2021). Overall, the surrounding material is less ionised in Swift J1858.60814 where log than for EXO 0748676 where log. We further find consistent covering fractions between the ingress and egress, in contrast to EXO 0748676, where the Gaussian model suggested the leading side of the companion to be less covered. The energy-dependent eclipse timings predicted by the model strongly depend on the density profile chosen, since this governs the X-ray absorption in the surrounding medium. We find both density profiles can recreate both t90 and t10 behaviour presented in Fig. 2. The t10 behaviour is more difficult to model because it relies on a sufficiently high material density and a high material ionisation. Nonetheless, our modelling can reproduce this and the overall eclipse models are shown in Fig. 6.
3.3 Binary Inclination and Mass Ratio
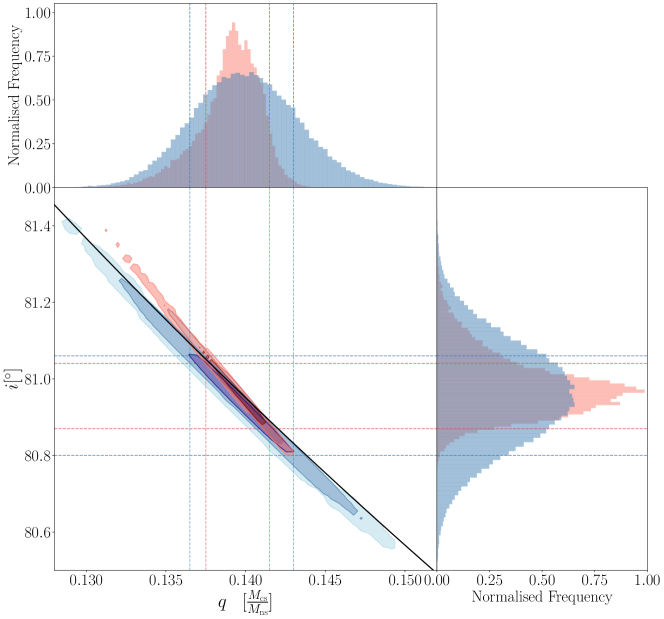
Our fits to the observed eclipse profiles assuming a Gaussian and exponential density profile each return best-fitting values for model parameters and . The binary inclination can then be found from these parameters and Equation 3. We constrain posterior distributions of and by running an Markov Chain Monte Carlo (MCMC) simulation within xspec using 256 walkers, a total of 768000 steps and a burn-in period of 742912 steps (see Appendix A for further details). For each step in the chain, we calculate from and and present the resulting posterior distribution in Fig. 4 (side panel), in which the Gaussian and exponential models are coloured blue and red respectively. Corresponding contours are provided by the dashed lines of the same colours.
Our posterior distributions demonstrate tight constraints on both and finding, at , and when assuming Gaussian density profile and and when assuming the exponential density profile. We further demonstrate this in Fig. 4 where 1, 2 and regions of parameter space are shaded in light, medium and dark shades of blue and red for the Gaussian and exponential models respectively. The black line shows the relation between and assuming a totality duration of s. We see that the fit closely follows this line, but width is introduced into the 2D contour by statistical uncertainty on . We can, therefore, combine these results with future radial velocity amplitude measurements for a precision NS mass measurement.
We note the 5 degree discrepancy between the inclination measured via eclipse mapping () and the preferred inclination of the laor iron line profile used in our spectral fitting (). This difference is very small when considering the modelling uncertainties and we consider their similarity encouraging. Although, eclipse mapping is measuring the inclination of the binary orbit itself while the laor model is measuring the inclination closer to the compact object. This could indicate that the inner disc is misaligned with the binary plane, but likely by a reasonably small amount (e.g. Fragos et al. 2010).
3.4 Nature of the Companion Star
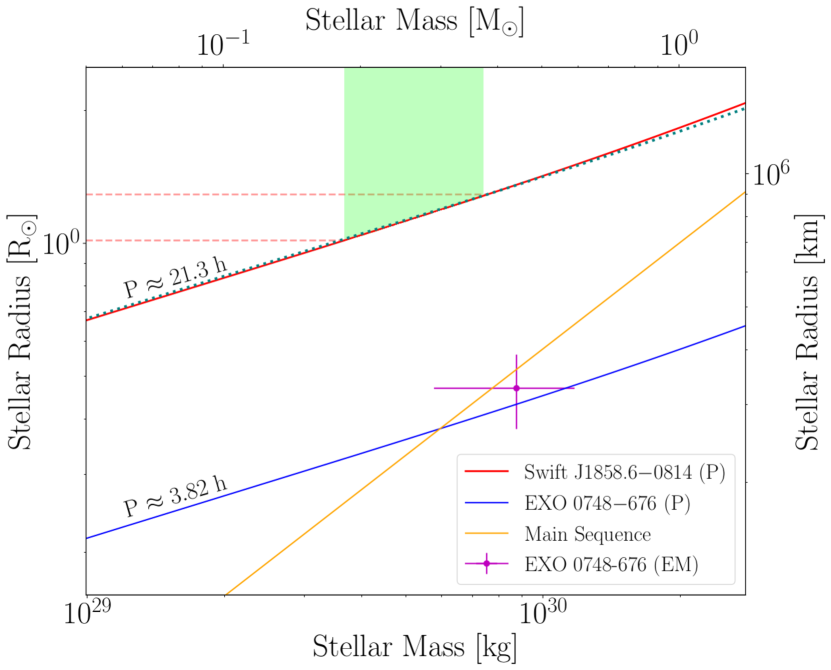
We can make inferences about the companion star properties from the results of our model fits. The mass and radius can be constrained from our measured value of . Given the (current) absence of a binary mass function, the mass estimate, , comes simply from assuming some reasonable range of possible NS masses. From Kepler’s law, the radius and mass are related via the orbital period as (Buisson et al., 2021)
| (4) |
The solid red and dotted teal lines in Fig. 5 show this relation for the orbital period of Swift J18580814, assuming respectively and . We see that the assumed NS mass has little influence on the relation. The green shaded area shows the range of values corresponding to and our measured contour on (we use the distribution from our Gaussian model, which has larger uncertainties than the exponential model). This range of corresponds to (dashed red lines). Following Buisson et al. (2021, see their Fig. 9), we also plot the theoretical mass-radius relation for an isolated main sequence star (Demircan & Kahraman, 1991) as a solid yellow line. It is clear that the companion star has a radius much larger than a main sequence star of the same mass. This was also noted by Buisson et al. (2021), but is now definitively confirmed by our measurement of the mass ratio. For comparison, we also plot the same relation for the orbital period of EXO 0748676 (solid blue line) as well as an eclipse mapping measurement of and (Knight et al., 2021) for that source utilizing the known binary mass function (magenta cross). Interestingly the EXO 0748676 companion is consistent with being on the main sequence.
Evidence for irradiation driven ablation of the companion star’s outer layers is found through the requirement of an additional layer of absorbing material surrounding the companion star beyond the Roche lobe radius. This layer is modelled such that the material’s density decreases with distance from the companion’s surface, thus explaining the observed, extended and energy-dependent eclipses. The best-fitting parameters from our modelling, regardless of the assumed radial density profile, suggests this layer is asymmetric. In the case of the exponential density profile, our modelling yields scale heights of and for the ingress and egress respectively. For the Gaussian density profile we obtain for the ingress and egress respectively. This asymmetry is required by the data since the egress duration is more than times the ingress duration. This can be understood if the material layer is elongated behind the companion star due to its orbital motion in a diffuse ambient medium.
In order to properly compare the height of the material layer around the companion predicted by the Gaussian and exponential models, we define a characteristic radius within which per cent of the mass of the layer is contained. For the Gaussian model, this is simply , and for the exponential model it is . For the Gaussian and exponential density profiles, the characteristic size for the material on the leading side of the star is and respectively. For the egress side of the star these respectively increase by times to and by times to . The characteristic size of the material layer on the ingress side of the companion inferred from the two density profiles are in remarkable agreement, both suggesting the size of the layer is . For the egress side of the companion, the characteristic size of the material layer differs between the two density profiles and lies within the range . Using the constraints on from the previous paragraph, this corresponds to a physical size in the range km for the trailing side of the companion and km for the leading side.
4 Discussion
We have applied our previously published eclipse profile model (Knight et al., 2021) to archival X-ray eclipses of Swift J1858.60814 in multiple energy bands, from which we have measured a mass ratio of and a binary inclination of . Assuming the NS mass to be in the range indicates that the companion star has a low mass in the range and a radius in the range (see Fig. 5). These radii are much larger than a main sequence star of the inferred mass. Buisson et al. (2021) concluded from similar arguments that the companion star is a sub-giant. Naively though, this seems unlikely since the sub-giant phase is a short-lived stage of stellar-evolution and eclipsing LMXBs are very rare, implying that it should be vanishingly unlikely for us to observe such a system.
The apparent low likelihood of the sub-giant scenario could, however, be counteracted by a selection effect. Specifically, if mass transfer is triggered by the expansion of the companion star as it evolves off the main sequence, then the likelihood of a given LMXB containing an evolved star becomes greater than the likelihood of observing an isolated star in an evolved state. Indeed, radio pulsars observed to be in circular orbits with low mass functions have been suggested to be LMXBs with sub-giant companions (Verbunt, 1993). Expanded, sub-giant companions have also been suggested to drive mass transfer in LMXBs with an orbital period in excess of days, e.g. Sco X-1 (Gottlieb et al., 1975). Since the orbital period of Swift J1858.60814 is just under a day, it fits into this class of systems.
However, the expected main sequence lifetime of an isolated star far exceeds a Hubble time, so the companion star simply wouldn’t have yet evolved onto the giant branch unless its evolutionary path had been altered by binary interactions. We also note that the orbital period is short. Under the reasonable assumption that the NS evolved from an intermediate-high mass progenitor, the original orbital period would have been much larger. Therefore, the binary’s evolution requires a mechanism to decrease the orbital separation while keeping the binary system intact. The latter could be avoided if the system formed via capture during a close encounter, as this allows the two components to evolve separately before forming a binary. A close encounter within a globular cluster is one of the formation scenarios considered for Sco X-1 (Mirabel, I. F. & Rodrigues, I., 2003). Like Swift J1858.60814, Sco X-1 has a low mass companion of (Steeghs & Casares, 2002) and a similar orbital period of hrs (Gottlieb et al., 1975). Such a scenario would require Swift J1858.60814 to have a high proper motion from being kicked out of the globular cluster in which it formed.
It seems more likely that the system instead had its separation reduced by a common envelope phase (CE; see Podsiadlowski 2014 for a brief overview). This could have occurred prior to the formation of the NS if the intermediate-high mass progenitor overfilled its Roche lobe and led the system into a period of unstable mass transfer. Alternatively, the progenitor to the current companion could have been initially more massive, initiating the CE itself. Regardless of when the CE occurred, the system would have ejected mass and angular momentum during the CE phase, subsequently forming a short period binary.
An evolutionary path similar to that suggested for PSR J1952+2630 by Lazarus et al. (2013) seems plausible here if both binary components were initially of intermediate mass. This scenario assumes the binary components evolved together and that the binary remained intact after the formation of the NS. Subsequently, there is a period of mass transfer as an intermediate-mass X-ray binary (IMXB), during which the secondary loses some mass through accretion and ablation processes. Such an IMXB phase has also been suggested to have occurred during the evolution of Sco X-1 (Chen, 2017). Towards the end of the IMXB phase, Roche lobe overflow can lead to a period of dynamically unstable mass transfer and the creation of a CE (Lazarus et al., 2013). This assumes the intermediate-mass companion is on the tip of the red-giant or asymptotic-giant branch and the binary has a wide orbit. The wide initial orbit allows the system to survive the CE, emerging as a short period binary consisting of a NS and a stripped He star.
The idea that the companion is a stripped He star is intriguing. Its formation through CE provides a means to significantly reduce the mass of the companion. Additionally, stripped helium stars are suggested to expand to giant dimensions as a result of a continuously growing shell (Dewi et al., 2002; Dewi & Pols, 2003; Yoon et al., 2012; Laplace, E. et al., 2020). This picture could therefore reconcile both the inferred low mass and large radius of the companion in Swift J1858.60814 if the expanding shell of the He star due to the onset of shell He burning was the trigger of the 2018-2020 outburst. This scenario can be tested by using spectroscopy to search for evidence of CNO enhancement of the companion.
Regardless of the prior evolution of Swift J1858.60814, our modelling requires the presence of an ionized layer of material around the companion star and is likely driven by X-ray ablation of the stellar surface. The inferred properties of this layer are very similar to those we inferred for EXO 0748676, for which irradiation driven ablation was also the expected origin (Knight et al., 2021). X-ray ablation impacts the outermost layers of the stellar surface. The incident radiation from the NS and disc (see Castro Segura et al. 2022 for discussion on the disc wind in Swift J1858.60814) bombard the companion, liberating material from its surface that builds up around the star. The radial profile of this collected material is what we measure in our modelling. The overall result of ablation is mass loss from the companion star in addition to that lost via Roche Lobe overflow. Ablation is not expected to be efficient enough to substantially reduce the companion’s mass (e.g Ginzburg & Quataert 2020), so additional factors such as accretion or CE ejection are likely required to explain the extremely low inferred companion mass in Swift J1858.60814.
Ablation can, however, enhance the mass loss from the companion in LMXBs (Podsiadlowski, 2014). The incident irradiation causing ablation can also induce other effects on the companion star, changing the expected evolution of the system. As discussed by Podsiadlowski (1991), these are irradiation driven winds and irradiation driven expansion. If the envelope of the star is sufficiently irradiated by the incident X-ray flux, the star will try to expand by a factor of 2 to 4 in order to reach a new state of thermal equilibrium. This occurs as irradiation changes the degree of ionisation in the outer layers of the star and thus changes the star’s effective surface boundary condition. Podsiadlowski (1991) shows that stellar expansion arising from X-ray irradiation is a function of the initial stellar radius and the incident X-ray flux. Using their calculations, we can infer that a main sequence companion would have a radius for an irradiating flux of . The X-ray flux incident on the companion from the NS can be estimated through the ratio , where and are the X-ray flux incident on the companion star from the NS and the X-ray flux incident on our detector respectively. The orbital separation is and the distance to the source is . The average X-ray flux incident on the detector is ergs/s/cm2, which is calculated from the observed X-ray flux from 10 epochs as reported by van den Eijnden et al. (2020). The orbital separation is found through Kepler’s law and the and assuming the distance to the source is kpc (Buisson et al., 2020) we find . Thus it appears plausible that the irradiation is driving the ablation and evolution of the companion star and could, therefore, be the origin of the inferred material layer around the companion. However, we note that the X-rays driving ablation are powered by accretion, therefore expansion via ablation cannot be the cause of Roche Lobe overflow, they can simply further increase the size of the companion once Roche Lobe overflow has already begun.
While there are many unknowns regarding the prior evolution of Swift J1858.60814, and we cannot favour any particular evolutionary scenario, we note that the irradiation scenario is capable of explaining the origin of the surrounding material layer, the under-massive companion and its larger radius. Despite this, we note that the inferred mass and radius of the companion are somewhat extreme, and additional evidence of X-ray irradiation is required to support this conclusion. In addition, we consider it likely that a prior CE phase occurred if the current binary components evolved together, thus explaining the origin of the short binary period and providing a route for substantial mass loss from the system. Future spectroscopic studies could uncover evidence of CNO enhancement of the companion, thus providing support for a prior CE phase and assist in distinguishing between the possible formation scenarios.
5 Conclusions
We model the energy-dependent eclipse profiles of Swift J1858.60814 in multiple energy bands, placing constraints on the binary inclination, and mass ratio, . We find , and which are related by the duration of totality, s. We combine our measured mass ratio with NS masses in the range to infer that the companion star has a low mass in the range and a large radius in the range . Since an isolated star with a mass in the inferred range would have main sequence lifetime in excess of the Hubble time, the large radius likely arises from of binary interactions.
We consider it likely that a prior CE phase contributed to the ejection of mass from the system and the reduction in the orbital period, thus forming a short period binary with a low mass companion. If the companion emerged from the CE as a stripped star, it may swell to giant dimensions during later evolutionary stages. Future spectroscopic studies could confirm this possibility. An alternative scenario invokes irradiation of the companion star by the X-ray source, causing the companion star to expand (by a factor of 2-4 for low mass stars) to reach a new state of thermal equilibrium. The incident irradiation can also lead to enhanced mass loss (Podsiadlowski, 1991). This scenario also explains the origin of the material layer found to surround the companion star by invoking irradiation driven ablation of the stellar surface. The inferred material layer is ionised and asymmetric ( thicker on the trailing side of the star than the leading side). This material layer is required by our eclipse profile model to recreate the observed extended and asymmetric eclipses in Swift J1858.60814.
The extended and asymmetric eclipses in Swift J1858.60814 are among numerous similarities between Swift J1858.60814 and EXO 0748676. We suggest that in both sources, the companion stars are being ablated by X-ray irradiation from the NS and disc. We will discuss these similarities in detail in a forthcoming study.
Acknowledgements
A. K. acknowledges support from the Oxford Hintze Centre for Astrophysical Surveys, which is funded through generous support from the Hintze Family Charitable Foundation. A. I. acknowledges support from the Royal Society.
Data Availability
The data used in this study are publicly available from the HEASARC website. The eclipse profile model is available upon reasonable request to the authors.
References
- Arnaud (1996) Arnaud K. A., 1996, in Jacoby G. H., Barnes J., eds, Astronomical Society of the Pacific Conference Series Vol. 101, Astronomical Data Analysis Software and Systems V. p. 17
- Baglio et al. (2018) Baglio M. C., Russell D. M., Pirbhoy S., Bahramian A., Heinke C. O., Roche P., Lewis F., 2018, The Astronomer’s Telegram, 12180, 1
- Buisson et al. (2020) Buisson D. J. K., et al., 2020, Monthly Notices of the Royal Astronomical Society, 499, 793
- Buisson et al. (2021) Buisson D. J. K., et al., 2021, Monthly Notices of the Royal Astronomical Society, 503, 5600
- Casares et al. (2014) Casares J., Negueruela I., Ribó M., Ribas I., Paredes J. M., Herrero A., Simón-Díaz S., 2014, Nature, 505, 378
- Castro Segura et al. (2022) Castro Segura N., et al., 2022, Nature, 603, 52
- Chen (2017) Chen W., 2017, A&A, 606, A60
- Cominsky & Wood (1984) Cominsky L. R., Wood K. S., 1984, ApJ, 283, 765
- Demircan & Kahraman (1991) Demircan O., Kahraman G., 1991, Astrophysics and Space Science, 181, 313
- Dewi & Pols (2003) Dewi J. D. M., Pols O. R., 2003, MNRAS, 344, 629
- Dewi et al. (2002) Dewi J. D. M., Pols O. R., Savonije G. J., van den Heuvel E. P. J., 2002, MNRAS, 331, 1027
- Done (2010) Done C., 2010, Accretion Processes In Astrophysics: IAC Winter School Of Astrophysics, 9781107030, 184
- Dovciak (2004) Dovciak M., 2004, PhD Thesis
- Fabian et al. (1989) Fabian A. C., Rees M. J., Stella L., White N. E., 1989, MNRAS, 238, 729
- Fragos et al. (2010) Fragos T., Tremmel M., Rantsiou E., Belczynski K., 2010, The Astrophysical Journal, 719, L79
- García et al. (2014) García J., et al., 2014, ApJ, 782, 76
- Ginzburg & Quataert (2020) Ginzburg S., Quataert E., 2020, Monthly Notices of the Royal Astronomical Society, 500, 1592
- Gottlieb et al. (1975) Gottlieb E. W., Wright E. L., Liller W., 1975, ApJ, 195, L33
- Hare et al. (2020) Hare J., et al., 2020, The Astrophysical Journal, 890, 57
- Higginbottom et al. (2018) Higginbottom N., Knigge C., Long K. S., Matthews J. H., Sim S. A., Hewitt H. A., 2018, Monthly Notices of the Royal Astronomical Society, 479, 3651
- Hjellming & Johnston (1981) Hjellming R. M., Johnston K. J., 1981, ApJ, 246, L141
- Horne (1985) Horne K., 1985, Monthly Notices of the Royal Astronomical Society, 213, 129
- Kaaret & Ford (1997) Kaaret P., Ford E. C., 1997, Science, 276, 1386
- Knight et al. (2021) Knight A. H., Ingram A., Middleton M., Drake J., 2021, Monthly Notices of the Royal Astronomical Society, 510, 4736
- Krimm et al. (2018) Krimm H. A., et al., 2018, The Astronomer’s Telegram, 12151, 1
- Laor (1991) Laor A., 1991, ApJ, 376, 90
- Laplace, E. et al. (2020) Laplace, E. Götberg, Y. de Mink, S. E. Justham, S. Farmer, R. 2020, A&A, 637, A6
- Lazarus et al. (2013) Lazarus P., et al., 2013, Monthly Notices of the Royal Astronomical Society, 437, 1485
- Mirabel, I. F. & Rodrigues, I. (2003) Mirabel, I. F. Rodrigues, I. 2003, A&A, 398, L25
- Motta et al. (2017) Motta S. E., Kajava J. J. E., Sánchez-Fernández C., Giustini M., Kuulkers E., 2017, Monthly Notices of the Royal Astronomical Society, 468, 981
- Parikh et al. (2020) Parikh A. S., Wijnands R., Altamirano D., 2020, The Astronomer’s Telegram, 13725, 1
- Parker et al. (2019) Parker M. L., Buisson D. J. K., Tomsick J. A., Fabian A. C., Madsen K. K., Walton D. J., Fürst F., 2019, Monthly Notices of the Royal Astronomical Society, 484, 1202
- Parmar et al. (1986) Parmar A. N., White N. E., Giommi P., Gottwald M., 1986, ApJ, 308, 199
- Parmar et al. (1991) Parmar A. N., Smale A. P., Verbunt F., Corbet R. H. D., 1991, ApJ, 366, 253
- Podsiadlowski (1991) Podsiadlowski P., 1991, Nature, 350, 136
- Podsiadlowski (2014) Podsiadlowski P., 2014, The evolution of binary systems. Cambridge University Press, p. 45–88, doi:10.1017/CBO9781139343268.003
- Ponti et al. (2012) Ponti G., Fender R. P., Begelman M. C., Dunn R. J. H., Neilsen J., Coriat M., 2012, Monthly Notices of the Royal Astronomical Society: Letters, 422, L11
- Ponti et al. (2014) Ponti G., Muñoz-Darias T., Fender R. P., 2014, Monthly Notices of the Royal Astronomical Society, 444, 1829
- Postnov & Yungelson (2014) Postnov K. A., Yungelson L. R., 2014, Living Reviews in Relativity, 17, 3
- Puls et al. (2008) Puls J., Vink J. S., Najarro F., 2008, The Astronomy and Astrophysics Review, 16, 209
- Revnivtsev, M. et al. (2002) Revnivtsev, M. Gilfanov, M. Churazov, E. Sunyaev, R. 2002, A&A, 391, 1013
- Saikia et al. (2020) Saikia P., Russell D. M., Baglio M. C., Bramich D. M., Lewis F., 2020, The Astronomer’s Telegram, 13719, 1
- Steeghs & Casares (2002) Steeghs D., Casares J., 2002, The Astrophysical Journal, 568, 273
- Steiner et al. (2010) Steiner A. W., Lattimer J. M., Brown E. F., 2010, The Astrophysical Journal, 722, 33
- Stevens & Uttley (2017) Stevens A., Uttley P., 2017, in American Astronomical Society Meeting Abstracts #229. p. 207.06
- Vasilopoulos et al. (2018) Vasilopoulos G., Bailyn C., Milburn J., 2018, The Astronomer’s Telegram, 12164, 1
- Verbunt (1993) Verbunt F., 1993, Annual Review of Astronomy and Astrophysics, 31, 93
- Walton et al. (2017) Walton D. J., et al., 2017, The Astrophysical Journal, 839, 110
- Wang et al. (2021) Wang J., et al., 2021, The Astrophysical Journal Letters, 910, L3
- Wijnands & van der Klis (2000) Wijnands R., van der Klis M., 2000, The Astrophysical Journal, 528, L93
- Wilms et al. (2000) Wilms J., Allen A., McCray R., 2000, The Astrophysical Journal, 542, 914
- Wolff et al. (2009) Wolff M. T., Ray P. S., Wood K. S., Hertz P. L., 2009, The Astrophysical Journal Supplement Series, 183, 156
- Yoon et al. (2012) Yoon S. C., Gräfener G., Vink J. S., Kozyreva A., Izzard R. G., 2012, A&A, 544, L11
- Zhang et al. (2014) Zhang Z., Makishima K., Sakurai S., Sasano M., Ono K., 2014, Publications of the Astronomical Society of Japan, 66
- van der Helm et al. (2019) van der Helm E., Saladino M. I., Portegies Zwart S., Pols O., 2019, A&A, 625, A85
- van den Eijnden et al. (2020) van den Eijnden J., et al., 2020, Monthly Notices of the Royal Astronomical Society, 496, 4127
- Özel & Freire (2016) Özel F., Freire P., 2016, Annual Review of Astronomy and Astrophysics, 54, 401
Appendix A Markov Chain Monte Carlo
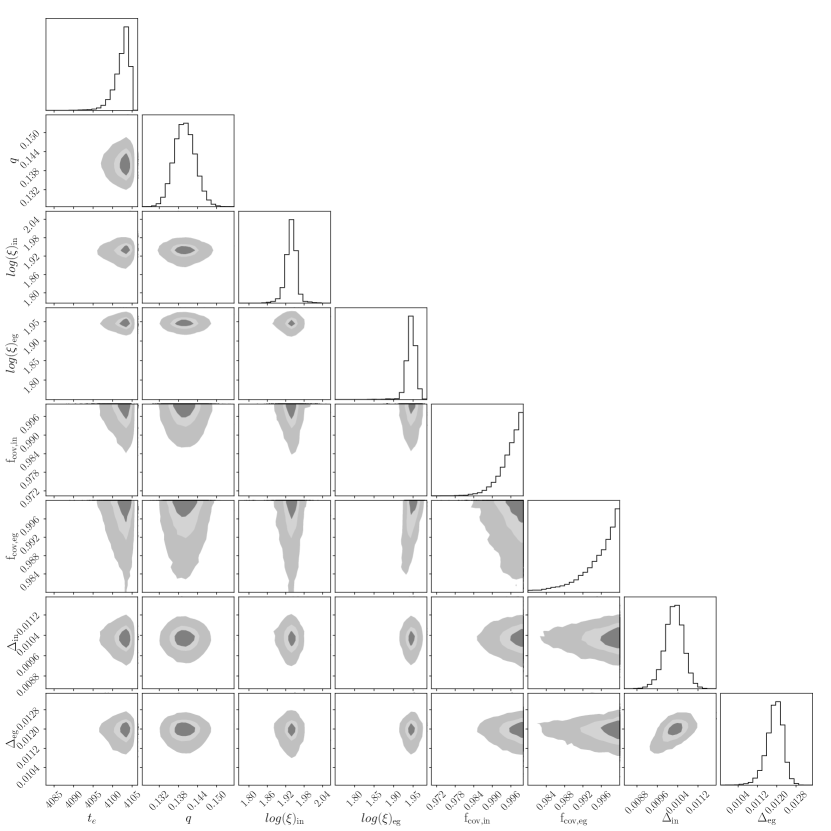
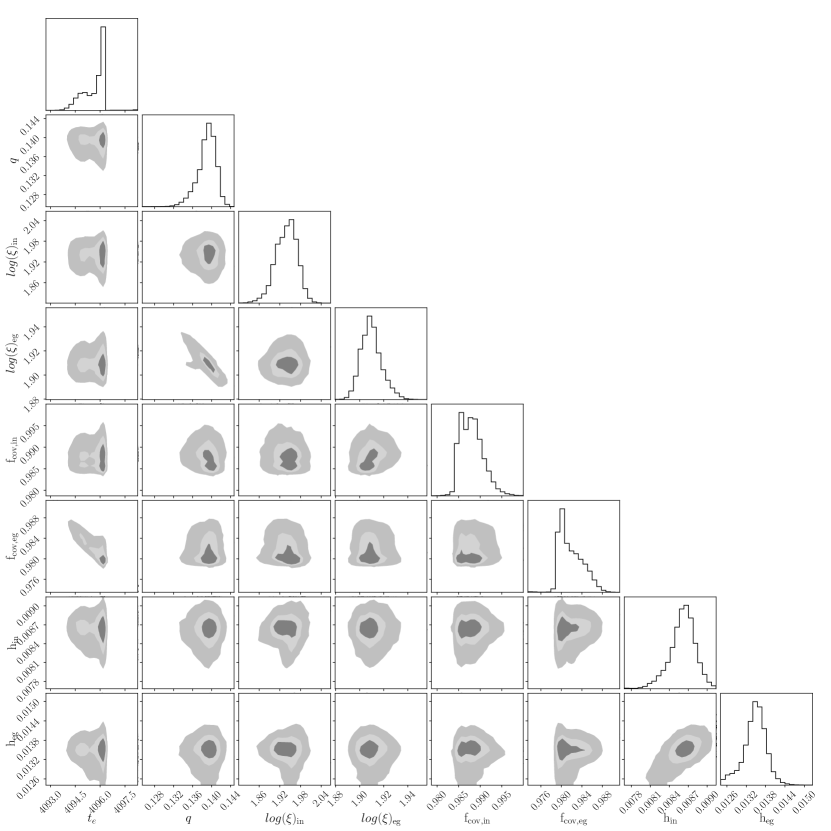
To improve our understanding of the eclipse profile model parameter space, we run a Markov Chain Monte Carlo (MCMC) simulation within xspec. For each assumed density profile, we run the simulation with 256 walkers a chain length of 768000 and a burn-in period of 742912 steps using the Goodman-Weare algorithm. We start the chains from the best fitting parameters presented in Table 3. Figures 7 and 8 show the output distributions for each model parameter, for the eclipse profile model assuming the Gaussian and exponential radial density profiles respectively.
We do not find evidence for strong parameter correlations in the resulting distributions in either density profile model with one exception - the mass ratio, appears anti-correlated with egress ionisation when assuming the exponential density profile. In addition, there is some indication that the width of the material layer on the ingress side of the companion star is correlated with the material layer on the egress side of the companion star. This can be seen for both assumed density profiles.
The Geweke convergence measure was used to check that each of the MCMC simulations achieved convergence. This is carried out by comparing the mean of each parameter in the first of the chain (i.e. shortly after the burn-in) and the last of the chain. For both chains, we determined Geweke values in the range , which suggests that convergence has been reached.