Homophilic and Heterophilic Characteristics Shaping Community Formation in Human Mobility Networks During Extreme Weather Response
Abstract
Community formation in socio-spatial human networks is one of the important mechanisms for ameliorating hazard impacts of extreme weather events. Research is scarce regarding latent network characteristics shaping community formation in human mobility networks during natural disasters. We examined human mobility networks in Harris County, Texas, in the context of the managed power outage forced by Winter Storm Uri to detect communities and to evaluate latent characteristics in those communities. We examined three characteristics in the communities formed within human mobility networks: hazard-exposure heterophily, socio-demographic homophily, and social connectedness strength. The analysis results show that population movements were shaped by socio-demographic homophily, heterophilic hazard exposure, and social connectedness strength. The results also indicate that a community encompassing more high-impact areas would motivate population movements to areas with weaker social connectedness. Hence, the findings reveal important characteristics shaping community formation in human mobility networks in hazard response. Specific to managed power outages, formed communities are spatially co-located, underscoring a best management practice to avoid prolonged power outages among areas within communities, thus improving hazard-exposure heterophily. The findings have implications for power utility operators to account for the characteristics of socio-spatial human networks when determining the patterns of managed power outages.
Cheng-Chun Leea,*, Siri Namburib, Xin Xiaob, Ali Mostafavia
a Urban Resilience.AI Lab, Zachry Department of Civil and Environmental Engineering,
Texas A&M University, College Station, TX
b Department of Computer Science, Texas A&M University, College Station, TX
* correseponding author, email: ccbarrylee@tamu.edu
Keywords Human mobility networks Resilience Managed power outage Homophily Heterophily
1 Introduction
Communities embedded in socio-spatial networks, such as human mobility networks, play a significant role in the ability of populations to respond to and recover from natural hazards and other crises (Hsu \BOthers., \APACyear2022; Coleman \BOthers., \APACyear2021; Fan, Jiang\BCBL \BBA Mostafavi, \APACyear2021; Galeazzi \BOthers., \APACyear2021; Yabe \BOthers., \APACyear2021). The characterization of human mobility networks is particularly applicable to evaluating population response and recovery to hazards. Human mobility networks capture aspects of population protective actions, such as preparedness (Arrighi \BOthers., \APACyear2019; Yuan \BOthers., \APACyear2021) and relocation (Deng \BOthers., \APACyear2021; Lee \BOthers., \APACyear2022; Song \BOthers., \APACyear2016); the collective signatures of these protective behaviors become encoded in the structural and dynamical properties of human mobility networks. One significant characteristic of human mobility networks is the formation of communities shaped by population’s collective responses to hazards. A number of previous studies (Kanavos \BOthers., \APACyear2018; Papadopoulos \BOthers., \APACyear2012; Wu \BOthers., \APACyear2020) examined the formation of communities in online social networks; however, limited attention has been paid to the characterization of community formation in human mobility networks during hazard response. Such characterization may hold the key to a better understanding of human network dynamics during hazard response to inform emergency response and risk reduction plans and policies (Fan, Yang\BCBL \BBA Mostafavi, \APACyear2021; Hong \BOthers., \APACyear2021; Yabe \BBA Ukkusuri, \APACyear2020; Rajput \BBA Mostafavi, \APACyear2022). Recognizing this, the objective of this study is to examine important characteristics of communities formed in human mobility networks. Specifically, we examine hazard-exposure heterophily, socio-demographic homophily, and the strength of social connectedness within communities detected in human mobility networks during hazard response in the context of the managed power outage in the 2021 Winter Storm Uri in Harris County, Texas.
To protect infrastructure, providers may implement managed resource arrangements, such as managed power outages, to protect overwhelmed power grid systems during severe extreme weather events. In particular, in recent years, both intensity and frequency of infrastructure failures during extreme weather events have been increasing. For example, in August 2021, the utility provider shut off power to approximately 48,000 customers in California in response to worsening wildfire weather conditions (Powell, \APACyear2021). This power outage event was a safety measure to protect power lines and to avoid spreading wildfires. During Winter Storm Uri in February 2021, the surge in demand for power for heat generation due to the extreme cold weather in Texas overwhelmed the electricity infrastructure. To protect generating plants and to avoid the collapse of the entire electrical grid, the provider implemented rolling blackouts, and nearly 4.5 million Texas homes and businesses lost power during the peak of this event (Mulcahy, \APACyear2021). It is critical to ensure that managed power outage plans are conducted in a manner that enables populations to properly respond. To understand population response to power outages and the characteristics of communities formed, we investigated the human mobility network during Winter Storm Uri in February 2021 in Harris County, one of the areas that was significantly affected by power outages. Apart from the inequality issues raised in the literature (Lee \BOthers., \APACyear2021), it is imperative to examine population response to the power outages and the characteristics of communities formed to inform future managed power outages. Hence, we identified communities in human mobility networks formed in response to power outage using temporal community detection techniques. Communities identified by community detection techniques can be thought of as subgroups within a large network that are densely connected to each other compared to the whole network.
In this study, we examined three important community characteristics during power outages: 1) hazard-exposure heterophily, 2) socio-demographic homophily, and 3) social connectedness strength. Previous studies have shown that people tend to group with and have relatively stronger social connectedness with persons similar to themselves (McPherson \BOthers., \APACyear1992; Nadkarni \BBA Hofmann, \APACyear2012). Therefore, social connectedness is a salient factor during hazard events to support protective actions due to the nature of the tendency of people seeking support from their social connections (Boon, \APACyear2014; Reich, \APACyear2006). This characteristic is called homophily in network and social sciences. Also, the presence of hazard-exposure heterophily within local communities can provide resourceful connections for people to reach out to mitigate their hazard exposures. Hazard-exposure heterophily exists when two spatial areas (such as census tracts) have dissimilar hazard exposure extent (Liu \BBA Mostafavi, \APACyear2022). For example, if there is a strong connectedness between two special areas, one experiencing extensive power outage, another area experiencing limited power outage, people of living in the impacted spatial area can relocate to the less impacted spatial area. Hazard-exposure heterophily is a characteristic in socio-spatial networks influencing the ability of populations to respond to and recover from hazards. Hence, we examined the extent of hazard-exposure heterophily within communities formed in human mobility networks during power outage response. We implemented temporal community detection techniques to identify local communities in human mobility networks in the study area and investigated the three characteristics—hazard-exposure heterophily, socio-demographic homophily, and social connectedness strength—within the detected communities, as shown in Figure 1.
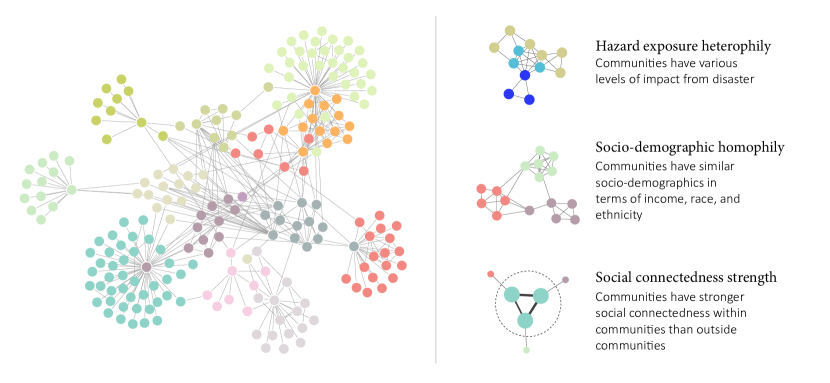
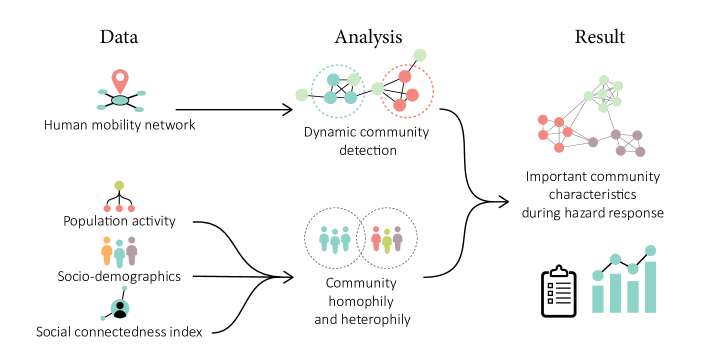
Figure 2 depicts an overview of the research approach (see details in Section 5). The remainder of the paper unfolds as follows. Section 2 presents the results of the dynamic community detection in this study. Section 3 discusses the results related to the three community characteristics (i.e., hazard-exposure heterophily, socio-demographic homophily, and social connectedness strength) for the identified communities. Section 4 discusses the importance of considering the characteristics of communities in socio-spatial networks when developing disaster response plans or managing power outage plans. The description of data sources and methods are presented in Section 5.
2 Community Detection Results Based on Human Mobility Networks
In this study, we adopted the community detection algorithm developed by Boudebza \BOthers. (\APACyear2020) to identify communities in human mobility networks during Winter Storm Uri in February 2021. The human mobility data was obtained from Spectus to construct networks of human movements among spatial areas. In particular, the networks include the information of people’s home census tracts, census tracts where people stay more than two hours, and travel counts between home census tracts and staying census tracts. By applying the community detection technique to human mobility network, we can identify communities where people have more connections in terms of their visit and stay activities. In this study, we aggregated data and constructed mobility networks at the census-tract level. By applying the community detection algorithm, we identified 89 communities in the human mobility network during February 2021 (Figure 3a). Among them, 30 major communities that consist of more than ten census tracts and persisted from February 15 to 17, 2021 were identified to examine the characteristics of communities during the winter storm and the associated managed power outages. Figure 3b demonstrates the location of the 30 major communities.
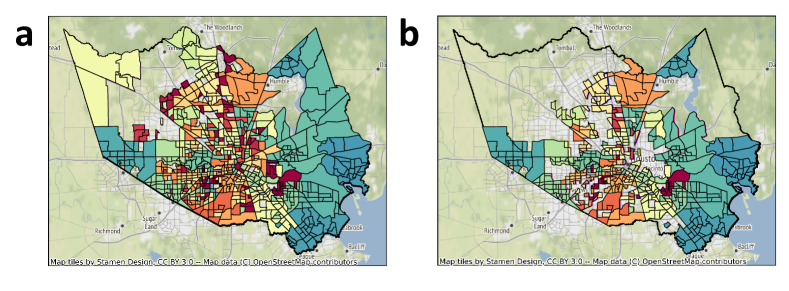
The community detection results based on human mobility data show that the communities formed with census tracts that are spatially co-located, which is reasonable because people would prefer not to travel long distances during extreme weather with difficult traffic conditions. The major communities are located at the south and east areas of Harris County; no major community is identified in northwestern Harris County. Accordingly, we focused on the 30 identified major communities and examined their homophilic and heterophilic characteristics, as well as the strength of social connectedness within communities.
3 Community Characteristics During Winter Storm Uri
This section presents the analysis of characteristics of the identified major communities: 1) hazard-exposure heterophily, 2) socio-demographic homophily, and 3) social connectedness strength.
3.1 Hazard-exposure heterophily
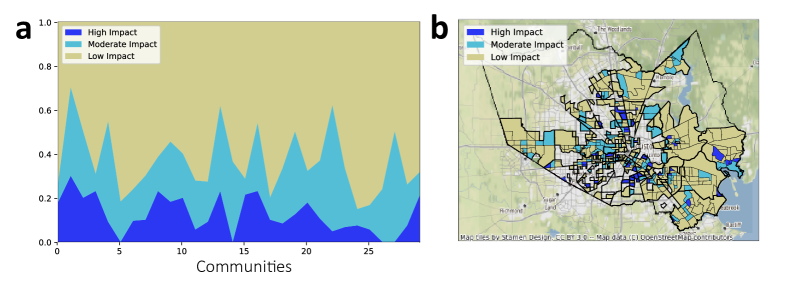
Due to the lack of publicly accessible power outage records, this study determined the impact level of the managed power outage based on population activity data from Mapbox. During power outage events, signal transmission devices, such as base transceiver stations and Wi-Fi routers, may be nonfunctional due to power outage, which also results in lower population activity levels inferred from telemetry-based population activity data. In this study, we adopted the same approach proposed by Lee \BOthers. (\APACyear2021) to calculate the percent change of the activity density for each census tract in Harris County to estimate the impact level of each area. The percent change is calculated as the difference of activity density between evaluation and baseline periods divided by the activity density in baseline period. In other words, a -75% percent change indicates that the activity density of the evaluated census tract is 75% below the activity density in the baseline period. In this study, we determined that the high-impact areas are census tracts having -100% as their lowest percent change during the period of the managed power outage. On the other hand, the low-impact areas are census tracts having the lowest percent change during the period of the managed power outage greater than -75%. The moderate impact areas are the census tract having the lowest activity density percent change between -100% and -75%. Figure 4 demonstrates the percentages of census tracts having high, moderate, and low levels of impact of the managed power outages for the major communities during Winter Storm Uri. Based on this approach, the percentage of high-, moderate-, and low-impact census tracts in the 30 major community are 11.9%, 22.9%, and 65.2%, respectively. The results shown in Figure 4 demonstrate that every community has low-impact areas that can serve as relocation destinations for people living in high- and moderate-impact areas to cope with the power outage impacts. Since we identified these major communities based on the human mobility network, the results show that the presence of hazard-exposure heterophily in communities enabled people to temporarily relocate among census tracts. This result highlights the significance of ensuring hazard-exposure heterophily within a community in coping with hazard events so that people in high-impact areas can seek support from connections in low-impact areas. Thus, hazard-exposure heterophily is a key characteristic in shaping communities in human networks during hazard response.
3.2 Socio-demographic homophily
In addition to the impact level and associated heterophily within the identified major communities, their socio-demographic homophily was examined. People tend to form communities with people having similar identities, such as income levels (McPherson \BOthers., \APACyear1992; Nadkarni \BBA Hofmann, \APACyear2012). Therefore, it is important to examine extent of socio-demographic homophily in communities formed during hazard response. In this study, we used the interquartile range (IQR), which is a measure of statistical dispersion, to understand the distribution of income, race, and ethnicity within a community. The IQR calculates the difference between the third quartile and the first quartile. A smaller IQR means the distribution is narrower, which indicates the socio-demographics in a community are more similar. As shown in Figure 5, we calculated the IQR for all major communities and Harris County to understand the similarity of the socio-demographic attributes within communities in terms of income, race, and ethnicity. Figure 5a shows the comparison of the IQR between the communities (bars) and Harris County (dashed line) based on their income distributions. During the managed power outage, 22 out of 30 major communities have lower IQR of income compared to the IQR in Harris County, which is $43K USD. In addition, more than half of the communities have the IQR of income less than $20K USD, which means the income levels within these major communities are similar.
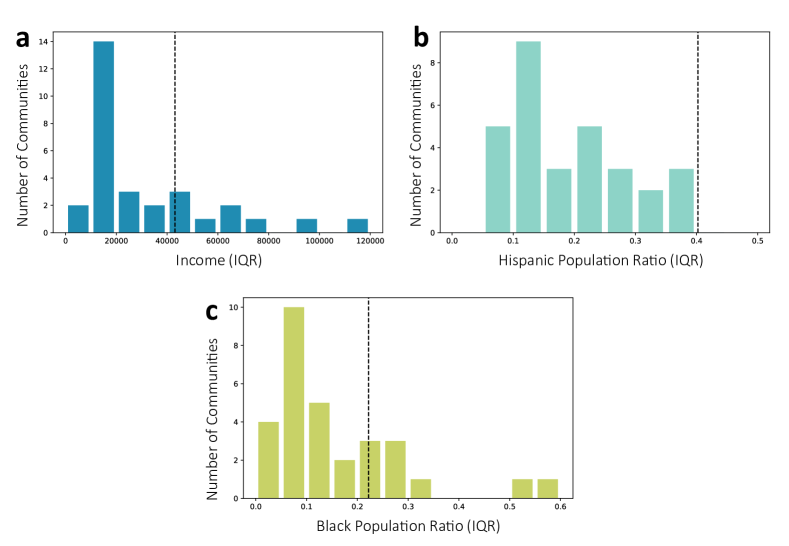
Besides the IQR of income distributions in communities, Figures 5b and 5c demonstrate the comparison of the IQR between the communities and Harris County based on the percentage of Hispanic and Black populations. In Figure 5b, the IQR of Hispanic population percentage in all communities is less than the IQR of it in Harris County (40.22%). Also, during the winter storm, 21 out of 30 major communities have lower IQR of Black population percentage compared to the IQR of values in Harris County (22.2%). The results in Figure 5 show that most of the identified major communities during the managed power outage have relatively similar socio-demographic characteristics compared to Harris County in its entirety in terms of income, race, and ethnicity. This result highlights that socio-demographic homophily plays an important role in the formation of communities during hazard response. Hence, it is crucial for operators to ensure that not all census tracts with similar characteristics are affected at the same time, which may result in people unable to find resources to effectively cope with hazard impacts.
3.3 Strength of social connectedness
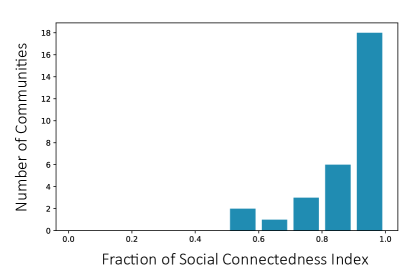
The third characteristic examined was the strength of social connectedness among spatial areas within communities. Social connectedness among populations of spatial areas is also one of the fundamental characteristics in formation of communities. In this study, we used Meta’s Social Connectedness Index (SCI) developed by Bailey \BOthers. (\APACyear2018) to understand the social ties of different census tracts within the identified communities. The SCI is a scaled index showing the social connectedness between two geographical areas based on the number of Facebook friend links in the two areas. A higher SCI value between two geographical areas means more social connectedness between the two areas, where a geographical area of the SCI is a census tract in this study. We calculated a fraction of the SCI to understand the social connectedness strength within the identified major communities. To calculate the fraction, we summed the SCI of census tracts in a community and divided by the sum of the SCI among spatial nodes of which at least one census tract is in the community. (The equation and details of the fraction of the SCI is shown in Equation (3) in Section 5.1.5.) The larger the fraction of the SCI of a community, the more inner social connectedness it has. Figure 6 shows the results of the fraction of the SCI for all identified major communities. During the managed power outage, 24 out of 30 major communities had fractions greater than 0.8, which indicates that the social connectedness within the identified communities is more prominent than the social connectedness outside of the communities. This result confirms the importance of social connectedness in the formation of communities within human mobility networks during hazard response. Therefore, if census tracts with high social connectedness experience great impacts (such as extensive power outage) simultaneously, their ability to cope with the impacts diminishes due to loss of resourceful connections in less impacted areas.
3.4 Overflow movements
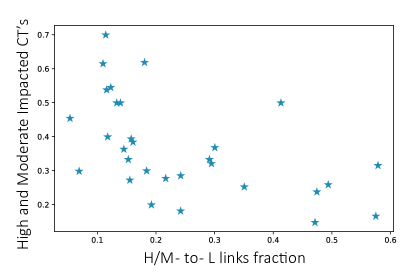
In addition to the analysis results related to the three important characteristics, we also found that the proportion of high- and moderate-impact areas within a community is a key factor determining population response. Figure 7 shows the relationship between the fraction of the mobility links from high- and moderate-impact areas to low-impact areas (H/M-to-L links) and the percentage of high- and moderate-impact areas within communities. The fraction of the H/M-to-L links was calculated as the sum of the weighted links between high- and moderate- to low-impact areas within a community divided by the sum of all weighted links between high- and moderate- to low-impact areas where the high- and moderate-impact areas are in the community, as shown in Equation (1).
| (1) |
where, is the fraction of the H/M-to-L links in community , is the link weighted by the count of visits between census tracts and , where belongs to , high- and moderate-impact census tracts in community , and belongs to , low-impact census tracts in community . is the link weighted by the count of visits between census tracts and , where belongs to , and belongs to , all low-impact census tracts that are connected to census tracts in . In other words, a higher fraction of the H/M-to-L links indicates that a community has more in-community links from high- and moderate-impact to low-impact areas, which means that most of the people affected in the community looked for resources from their social connections in the same community. Yet a lower fraction of the H/M-to-L links means that more people living in high- and moderate-impact areas reach out to their social connections outside of the community. As shown in Figure 7, when the percentage of high- and moderate-impact areas in a community is higher, the fraction of the H/M-to-L links tends to be lower. On the other hand, the communities having relatively higher fraction of the H/M-to-L links are likely to have lower percentage of high- and moderate-impact areas in the communities. The result implies that the fraction of high- and moderate-impact areas determines the within-community response capacity. The increase in the fraction triggers out-of-community movements (which may require longer-distance movements). These overflow movements across communities are due mainly to the imbalance in hazard-exposure heterophily of communities.
4 Discussion
Characterizing human network dynamics in response to hazards is essential for better response and faster recovery from impacts. In this study, we examined communities formed in human mobility networks in response to hazards in the context of the 2021 Winter Storm Uri in Harris County, Texas, and its associated managed power outage. Community formation in socio-spatial networks is a mechanism through which populations cope with and respond to hazards and their impacts. In particular, we examined three important characteristics that shape the formation of communities in response to hazards: heterophilic hazard exposure, homophilic socio-demographics, and strong social connectedness within communities. We implemented community detection techniques to identify communities based on population responses to the managed power outage event. Then we examined the three characteristics within the identified communities. The analysis results reveal important heterophilic and homophilic characteristics shaping community formation in human mobility networks.
Understanding population responses in mobility networks provides opportunities to understand the ways people cope with hazards and impacts. The characteristics of spatial-temporal mobility networks can reveal population behaviors with origin and destination information and temporal dynamics. In particular, human mobility networks encode signatures of human protective actions, hence understanding the characteristics of these networks would shed light on network processes that influence population response to disasters. By applying community detection techniques to mobility networks, communities formed during disaster response can be identified and characterized. Analyzing the identified communities can help unfold the latent characteristics that shape the formation of communities and shed new light on population collective response to disasters. In this study, we investigated three important characteristics in mobility network communities. The analysis results indicate that population movements in response to the managed power outage event was shaped by socio-demographic homophily, hazard-exposure heterophily, as well as the strength of the social connectedness among spatial areas. Within each of the communities, the socio-demographic characteristics are similar in terms of income, race, and ethnicity. Also, most of the communities were formed based on the existing social connectedness instead of creating new ones.
The findings of this study have important implications for human-centric infrastructure resilience assessments based on understanding human-infrastructure interactions. For example, in the event of infrastructure failures, operators and managers should consider the characteristics of social-spatial human networks to prioritize repair and restoration plans to increase hazard heterophily based on consideration of socio-demographic homophily and strong social connectedness. In particular, due to more frequent extreme weather events, there are increasing numbers of managed power outages. In determining the extent and spatial distribution of managed power outages, it is essential to understand response mechanisms in human networks. For example, power utility operators can identify clusters in human mobility networks and plan for implementing power outages in a manner that facilitates a balanced hazard-exposure heterophily within the communities to enable populations to better cope with the impacts. The findings of this study also highlight the need for further characterization of human network dynamics in response to infrastructure disruptions to inform human-centric management and operation of infrastructure during other extreme events.
5 Materials and Methods
5.1 Data sources and study area
5.1.1 Study area
This study collected and analyzed data from various sources in Harris County, Texas, which includes the Houston metropolitan area, during Winter Storm Uri to examine important community characteristics during extreme weather responses. Winter Storm Uri affected most of areas in North America from February 13 through 17, 2021, and affected all of Texas, including Harris County, the study area, on the evening of February 14, 2021, bringing snow and below-freezing temperatures. Due to a lack of experience with cold weather, snow, or icy conditions, Texas residents were significantly impacted by the winter storm especially. The freezing weather broke historical records in both temperature and duration, and at least 146 people lost their lives in Texas due to hypothermia (Freedman \BOthers., \APACyear2021; Hellerstedt, \APACyear2021; Mulcahy, \APACyear2021). During the winter storm, the electricity infrastructure in Texas was overwhelmed due to heating demand, which led to the implementation of rolling power outages to avoid the collapse of the entire power grid in Texas. During the peak of this crisis, nearly 4.5 million homes and businesses in Texas lost power, and the estimated cost of the power outages was at least $195 billion USD (Ferman, \APACyear2021; Mulcahy, \APACyear2021). In particular, more than 90% of residents lost power in the study area, Harris County (Watson \BOthers., \APACyear2021). Data from different sources were aggregated at the census-tract level (786 census tracts in Harris County) and integrated to be comparable.
5.1.2 Mobility network data
The human mobility data used in this study is the location intelligence data obtained from Spectus. Traditionally, analyses corresponding to location data require prolonged data preparation and processing time using conventional surveys and adhering to strict privacy laws. Spectus, a location data platform, provides access to privacy-enhanced GPS data of users who have opted to share their information, while thoroughly anonymizing their personal information through a CCPA- and GDPR-compliant framework. As of publication, Spectus has as many as 15 million active users in the United States. This is made possible through the company’s proprietary SDK present in its partner apps, which collect data anonymously. In addition to de-identifying data, Spectus applies additional privacy enhancements by obfuscating home areas to the census block group-level, removing sensitive points of interest, and permitting only aggregated outputs to leave their platform. By combining different sources like Bluetooth, IoT, and Wi-Fi signals at the device level, they are able to provide accurate geographical coordinates and high-quality mobility data. To understand the population responses during Winter Storm Uri, we harnessed the privacy-enhanced device-level data provided via the Spectus platform that includes the information of home census block groups, census block groups of stay, and stay durations for each anonymized device. In this study, we only retained stays having durations longer than two hours to account for the nature of relocation to cope with the impact. We then aggregated the data at the census-tract level based on travel between home and stay census block groups along with counts of visits to construct home-destination networks for each day in February 2021 in Harris County. Accordingly, a mobility network was constructed as a directed network. Consider a directed network represented as , where is the set of nodes, is the set of edges that connects each of the nodes and w is the weight assigned to each of the edges. In this study, every node is the centroid of a census tract, and edges will be established if people are traveling from one census tract to another. w is the trip counts between origins and destinations. Further data processing was completed for implementing community detection algorithms to identify communities.
5.1.3 Population activity
This study used telemetry-based population activity data provided by Mapbox to assess the impact of power outages. Due to the lack of publicly accessible power outage data, population activity data became a reliable proxy for understanding the extent of power outages (Lee \BOthers., \APACyear2021). Issues during power outage periods would cause a decrease in telemetry-based population activity. For example, because of power outages, people could be without means to charge their cell phones, base transceiver stations for cell phones could not transmit signals, and Wi-Fi routers and cable modems in houses could be nonfunctional. In this study, we followed the same approach as a previous study (Lee \BOthers., \APACyear2021) to calculate activity density at the census-tract level per day and to examine the impact level of power outages based on percent changes between normal and impact periods. Activity index (), a scaling factor representing population activity level, was calculated and provided by Mapbox for each geographic unit, which is a point in a 100-meter by 100-meter spatial-resolution grid. As shown in Equation (2), the activity index was further aggregated and used to calculate the activity density () of each census tract () at each time period ().
| (2) |
where, is the activity density at time in census tract , is the activity index at time of geographic unit , and is the number of geographic units within census tract . We calculated and aggregated the data in Harris County between February 1 through 28, 2021, to understand the extent of power outages during Winter Storm Uri.
5.1.4 Socio-demographics
The socio-demographic data used in this study was retrieved from the American Community Survey database, which is administrated by the U.S. Census Bureau (U.S. Census Bureau, \APACyear2020). The American Community Survey regularly gathers information, including ancestry, educational attainment, income and earnings, disability status, and demographics such as age, race, and housing characteristics. This study used the 2019 five-year estimates data, which represents estimates over the five-year period from 2015 to 2019, at the census-tract level to understand the socio-demographics of population. In particular, we obtained median household income, ratio of the Black population, and ratio of Hispanic population for each census tract in Harris County. We then incorporated the retrieved socio-demographic data to understand the characteristics of the identified communities in Harris County during the power outage events.
5.1.5 Meta Social Connectedness Index
The data of Social Connectedness Index is provided by Meta, a global networking service as a part of its Data for Good program. Facebook has as many as 2.91 billion active users monthly from all over the world, of which around 180 million are from the United States. The Social Connectedness Index was developed by Bailey \BOthers. (\APACyear2018), who used anonymized data of active Facebook user friendship ties between two geographical areas. By aggregating friendship links, the SCI is then calculated to measure the intensity of social connectedness between the locations. In this study, we used the SCI data at the census-tract level as a proxy of the strength of social ties to construct social-spatial networks. To understand the social connectedness strength within communities, we calculated a fraction as shown in Equation (3):
| (3) |
where, is the fraction of the SCI needed to understand the social connectedness strength within community , is the SCI between census tracts and where both and are in , census tracts in community , and is the SCI between census tracts and , where belongs to , all census tracts in networks.
5.2 Dynamic community detection
In the context of population responses during disasters, it is essential to capture the fluctuations of human mobility over time. In this study, we aggregated data from Spectus at the census-tract level to construct human mobility networks for each day in February 2021. The daily mobility network represents nodes as census tracts and links as visitations between home and destination census tracts weighted by the counts of visits. The concept of community detection is to find subgroups of nodes within complex networks to reveal latent relationships. Nodes in an identified community are more densely connected than nodes in different communities. In other words, by applying the community detection technique to human mobility networks, we can identify communities where people have more in-community movements to reveal extreme weather responses and to understand the characteristics shaping communities.
Most of the community detection algorithms are based on static graphs, and the majority follow optimization or heuristic techniques to detect clustering structures. Although it is applicable in static networks, real-life networks exhibit temporal properties. In particular, in our case, the human mobility networks has both spatial and temporal dimensions, raising the need for dynamic community detection techniques (Rossetti \BBA Cazabet, \APACyear2018). The community detection results based on networks at a time snap (e.g., one human mobility network of one day) cannot capture the evolution of communities with several time snaps. Traditionally, multiplex community detection is performed on an ad-hoc basis by taking several independent partitions and assembling them back together for analysis, but as the temporal information is not fully utilized, it might cause information loss. To mitigate the loss of information, many representations have been developed, such as temporal networks (Holme \BBA Saramäki, \APACyear2012), link streams (Latapy \BOthers., \APACyear2017), and snapshot models (Rossi \BBA Neville, \APACyear2012; Soundarajan \BOthers., \APACyear2016) to represent dynamic networks. In particular, Mucha \BOthers. (\APACyear2010) proposed a method to identify communities by linking the same node in different time snapshots with an interslice weight. Greene \BOthers. (\APACyear2010) proposed a matching algorithm that aggregates and analyzes communities found in the consecutive static snapshots of networks to detect dynamic communities. Appel \BOthers. (\APACyear2019) used a shared factorization model that can account for links, weights, and temporal analysis in graphs to detect communities. Qin \BOthers. (\APACyear2020) proposed a density-based clustering algorithm to detect stable communities over time in a dynamic graph. In this paper, we used the algorithm proposed by Boudebza \BOthers. (\APACyear2020), a link stream-based approach, to detect stable communities at multiple temporal scales without redundancy instead of choosing an arbitrarily temporal scale and to perform temporal community detection on all time steps in parallel.
The algorithm follows an iterative process and considers multiple time intervals by searching for communities from a coarser temporal scale to a finer one with moving windows. Both short and long aggregation windows are used to increase sensitivity, decrease noises, and capture low and high-frequency communities. Louvain community detection algorithm (Blondel \BOthers., \APACyear2008), a method to extract communities from static large networks, was implemented for each temporal window to find communities in different temporal scales. The redundant communities appearing at larger time scales were removed by the proposed algorithm to diminish redundancy. To ensure the quality of community detection results, the algorithm only keeps communities with a higher inverse conductance than a threshold, which is 0.8 in this study. Conductance is calculated as the number of links between, within, and outside the community divided by the aggregated degrees of nodes within the community. A higher conductance indicates the community has higher fraction of in-community links. Structural similarity among several time snaps is ensured based on Jaccard similarity, which calculates the node differences between a community at two different time steps. The proposed algorithm only keeps communities with a similarity lower than or equal to a threshold, which is 0.2 in this study. A lower similarity value indicates the nodes in a community in two-time steps have fewer differences. Lastly, stable communities at multiple temporal scales are detected by observing successive time steps, three in this study, to select persistent communities. With the community detection results, we can conduct analysis to understand the latent characteristics encoded in communities in terms of hazard exposures, socio-demographics, and social connectedness.
6 Data Availability
The data that support the findings of this study are available from Spectus and Meta Social Connectedness Data, but restrictions apply to the availability of these data. The data can be accessed upon request submitted to Spectus and Meta Data for Good Program. Other data used in this study are all publicly available.
7 Code Availability
The code that supports the findings of this study is available from the corresponding author upon request.
8 Acknowledgements
The authors would like to acknowledge the funding support from the National Science Foundation CAREER Award under grant number 1846069. The authors would also like to acknowledge Meta’s Data for Good Program for providing the social connectedness data. Any opinions, findings, conclusions, or recommendations expressed in this research are those of the authors and do not necessarily reflect the view of the funding agencies.
References
- Appel \BOthers. (\APACyear2019) \APACinsertmetastarAppel2019Temporally{APACrefauthors}Appel, A\BPBIP., Cunha, R\BPBIL\BPBIF., Aggarwal, C\BPBIC.\BCBL \BBA Terakado, M\BPBIM. \BBOP2019\BBCP. \BBOQ\APACrefatitleTemporally Evolving Community Detection and Prediction in Content-Centric Networks Temporally evolving community detection and prediction in content-centric networks.\BBCQ \BIn (\BPGS 3–18). \APACaddressPublisherSpringer International Publishing. \PrintBackRefs\CurrentBib
- Arrighi \BOthers. (\APACyear2019) \APACinsertmetastarArrighi2019Preparedness{APACrefauthors}Arrighi, C., Pregnolato, M., Dawson, R\BPBIJ.\BCBL \BBA Castelli, F. \BBOP2019\BBCP. \BBOQ\APACrefatitlePreparedness against mobility disruption by floods Preparedness against mobility disruption by floods.\BBCQ \APACjournalVolNumPagesScience of The Total Environment6541010–1022. \PrintBackRefs\CurrentBib
- Bailey \BOthers. (\APACyear2018) \APACinsertmetastarBailey2018Social{APACrefauthors}Bailey, M., Cao, R., Kuchler, T., Stroebel, J.\BCBL \BBA Wong, A. \BBOP2018\BBCP. \BBOQ\APACrefatitleSocial Connectedness: Measurement, Determinants, and Effects Social connectedness: Measurement, determinants, and effects.\BBCQ \APACjournalVolNumPagesJournal of Economic Perspectives323259–280. \PrintBackRefs\CurrentBib
- Blondel \BOthers. (\APACyear2008) \APACinsertmetastarBlondel2008Fast{APACrefauthors}Blondel, V\BPBID., Guillaume, J\BHBIL., Lambiotte, R.\BCBL \BBA Lefebvre, E. \BBOP2008\BBCP. \BBOQ\APACrefatitleFast unfolding of communities in large networks Fast unfolding of communities in large networks.\BBCQ \APACjournalVolNumPagesJournal of Statistical Mechanics: Theory and Experiment10P10008. \PrintBackRefs\CurrentBib
- Boon (\APACyear2014) \APACinsertmetastarBoon2014Disaster{APACrefauthors}Boon, H\BPBIJ. \BBOP2014\BBCP. \BBOQ\APACrefatitleDisaster resilience in a flood-impacted rural Australian town Disaster resilience in a flood-impacted rural australian town.\BBCQ \APACjournalVolNumPagesNatural Hazards711683–701. \PrintBackRefs\CurrentBib
- Boudebza \BOthers. (\APACyear2020) \APACinsertmetastarBoudebza2020Detecting{APACrefauthors}Boudebza, S., Cazabet, R., Nouali, O.\BCBL \BBA Azouaou, F. \BBOP2020\BBCP. \BBOQ\APACrefatitleDetecting Stable Communities in Link Streams at Multiple Temporal Scales Detecting stable communities in link streams at multiple temporal scales.\BBCQ \BIn (\BPGS 353–367). \APACaddressPublisherSpringer International Publishing. \PrintBackRefs\CurrentBib
- Coleman \BOthers. (\APACyear2021) \APACinsertmetastarColeman2021Human{APACrefauthors}Coleman, N., Gao, X., DeLeon, J.\BCBL \BBA Mostafavi, A. \BBOP2021\BBCP. \BBOQ\APACrefatitleHuman Activity and Mobility Data Reveal Disparities in Exposure Risk Reduction Indicators among Socially Vulnerable Populations during COVID-19 Human activity and mobility data reveal disparities in exposure risk reduction indicators among socially vulnerable populations during covid-19.\BBCQ \APACjournalVolNumPagesarXiv:2107.06705 [physics, q-bio]. \PrintBackRefs\CurrentBib
- Deng \BOthers. (\APACyear2021) \APACinsertmetastarDeng2021High-resolution{APACrefauthors}Deng, H., Aldrich, D\BPBIP., Danziger, M\BPBIM., Gao, J., Phillips, N\BPBIE., Cornelius, S\BPBIP.\BCBL \BBA Wang, Q\BPBIR. \BBOP2021\BBCP. \BBOQ\APACrefatitleHigh-resolution human mobility data reveal race and wealth disparities in disaster evacuation patterns High-resolution human mobility data reveal race and wealth disparities in disaster evacuation patterns.\BBCQ \APACjournalVolNumPagesHumanities and Social Sciences Communications811–8. \PrintBackRefs\CurrentBib
- Fan, Jiang\BCBL \BBA Mostafavi (\APACyear2021) \APACinsertmetastarFan2021Evaluating{APACrefauthors}Fan, C., Jiang, X.\BCBL \BBA Mostafavi, A. \BBOP2021\BBCP. \BBOQ\APACrefatitleEvaluating crisis perturbations on urban mobility using adaptive reinforcement learning Evaluating crisis perturbations on urban mobility using adaptive reinforcement learning.\BBCQ \APACjournalVolNumPagesSustainable Cities and Society75103367. \PrintBackRefs\CurrentBib
- Fan, Yang\BCBL \BBA Mostafavi (\APACyear2021) \APACinsertmetastarFan2021Neural{APACrefauthors}Fan, C., Yang, Y.\BCBL \BBA Mostafavi, A. \BBOP2021\BBCP. \BBOQ\APACrefatitleNeural Embeddings of Urban Big Data Reveal Emergent Structures in Cities Neural embeddings of urban big data reveal emergent structures in cities.\BBCQ \APACjournalVolNumPagesarXiv:2110.12371 [physics]. \PrintBackRefs\CurrentBib
- Ferman (\APACyear2021) \APACinsertmetastarFerman2021Winter{APACrefauthors}Ferman, M. \BBOP2021\BBCP. \BBOQ\APACrefatitleWinter storm could cost Texas more money than any disaster in state history Winter storm could cost texas more money than any disaster in state history.\BBCQ \APACjournalVolNumPagesThe Texas Tribune. \PrintBackRefs\CurrentBib
- Freedman \BOthers. (\APACyear2021) \APACinsertmetastarFreedman2021Central{APACrefauthors}Freedman, A., Muyskens, J.\BCBL \BBA Samenow, J. \BBOP2021\BBCP. \BBOQ\APACrefatitleCentral states’ Arctic plunge: The historic cold snap and snow by the numbers Central states’ arctic plunge: The historic cold snap and snow by the numbers.\BBCQ \APACjournalVolNumPagesWashington Post. \PrintBackRefs\CurrentBib
- Galeazzi \BOthers. (\APACyear2021) \APACinsertmetastarGaleazzi2021Human{APACrefauthors}Galeazzi, A., Cinelli, M., Bonaccorsi, G., Pierri, F., Schmidt, A\BPBIL., Scala, A.\BDBLQuattrociocchi, W. \BBOP2021\BBCP. \BBOQ\APACrefatitleHuman mobility in response to COVID-19 in France, Italy and UK Human mobility in response to covid-19 in france, italy and uk.\BBCQ \APACjournalVolNumPagesScientific Reports11113141. \PrintBackRefs\CurrentBib
- Greene \BOthers. (\APACyear2010) \APACinsertmetastarGreene2010Tracking{APACrefauthors}Greene, D., Doyle, D.\BCBL \BBA Cunningham, P. \BBOP2010\BBCP. \BBOQ\APACrefatitleTracking the Evolution of Communities in Dynamic Social Networks Tracking the evolution of communities in dynamic social networks.\BBCQ \BIn (\BPGS 176–183). \PrintBackRefs\CurrentBib
- Hellerstedt (\APACyear2021) \APACinsertmetastarHellerstedt2021February{APACrefauthors}Hellerstedt, J. \BBOP2021\BBCP. \APACrefbtitleFebruary 2021 Winter Storm-Related Deaths – Texas February 2021 winter storm-related deaths – texas \APACbVolEdTR\BTR. \PrintBackRefs\CurrentBib
- Holme \BBA Saramäki (\APACyear2012) \APACinsertmetastarHolme2012Temporal{APACrefauthors}Holme, P.\BCBT \BBA Saramäki, J. \BBOP2012\BBCP. \BBOQ\APACrefatitleTemporal networks Temporal networks.\BBCQ \APACjournalVolNumPagesPhysics Reports519397–125. \PrintBackRefs\CurrentBib
- Hong \BOthers. (\APACyear2021) \APACinsertmetastarHong2021Measuring{APACrefauthors}Hong, B., Bonczak, B\BPBIJ., Gupta, A.\BCBL \BBA Kontokosta, C\BPBIE. \BBOP2021\BBCP. \BBOQ\APACrefatitleMeasuring inequality in community resilience to natural disasters using large-scale mobility data Measuring inequality in community resilience to natural disasters using large-scale mobility data.\BBCQ \APACjournalVolNumPagesNature Communications1211870. \PrintBackRefs\CurrentBib
- Hsu \BOthers. (\APACyear2022) \APACinsertmetastarhsu_human_2022{APACrefauthors}Hsu, C\BHBIW., Liu, C., Nguyen, K\BPBIM., Chien, Y\BHBIH.\BCBL \BBA Mostafavi, A. \BBOP2022\BBCP. \BBOQ\APACrefatitleDo Human Mobility Network Analyses Produced from Different Location-based Data Sources Yield Similar Results across Scales? Do Human Mobility Network Analyses Produced from Different Location-based Data Sources Yield Similar Results across Scales?\BBCQ \APACjournalVolNumPagesarXiv:2204.09915 [physics]. \PrintBackRefs\CurrentBib
- Kanavos \BOthers. (\APACyear2018) \APACinsertmetastarKanavos2018Emotional{APACrefauthors}Kanavos, A., Perikos, I., Hatzilygeroudis, I.\BCBL \BBA Tsakalidis, A. \BBOP2018\BBCP. \BBOQ\APACrefatitleEmotional community detection in social networks Emotional community detection in social networks.\BBCQ \APACjournalVolNumPagesComputers and Electrical Engineering65449–460. \PrintBackRefs\CurrentBib
- Latapy \BOthers. (\APACyear2017) \APACinsertmetastarLatapy2017Stream{APACrefauthors}Latapy, M., Viard, T.\BCBL \BBA Magnien, C. \BBOP2017\BBCP. \BBOQ\APACrefatitleStream Graphs and Link Streams for the Modeling of Interactions over Time Stream graphs and link streams for the modeling of interactions over time.\BBCQ \APACjournalVolNumPagesarXiv:1710.04073 [physics, stat]. \PrintBackRefs\CurrentBib
- Lee \BOthers. (\APACyear2022) \APACinsertmetastarLee2022Specifying{APACrefauthors}Lee, C\BHBIC., Chou, C.\BCBL \BBA Mostafavi, A. \BBOP2022\BBCP. \BBOQ\APACrefatitleSpecifying Evacuation Return and Home-switch Stability During Short-term Disaster Recovery Using Location-based Data Specifying evacuation return and home-switch stability during short-term disaster recovery using location-based data.\BBCQ \APACjournalVolNumPagesarXiv:2201.05253 [physics]. \PrintBackRefs\CurrentBib
- Lee \BOthers. (\APACyear2021) \APACinsertmetastarLee2021Community-scale{APACrefauthors}Lee, C\BHBIC., Maron, M.\BCBL \BBA Mostafavi, A. \BBOP2021\BBCP. \BBOQ\APACrefatitleCommunity-scale Big Data Reveals Disparate Impacts of the Texas Winter Storm of 2021 and its Managed Power Outage Community-scale big data reveals disparate impacts of the texas winter storm of 2021 and its managed power outage.\BBCQ \APACjournalVolNumPagesarXiv:2108.06046 [physics]. \PrintBackRefs\CurrentBib
- Liu \BBA Mostafavi (\APACyear2022) \APACinsertmetastarLiu2022Hazard{APACrefauthors}Liu, C\BHBIF.\BCBT \BBA Mostafavi, A. \BBOP2022\BBCP. \BBOQ\APACrefatitleHazard Exposure Heterophily: A Latent Characteristic in Socio-Spatial Networks Influencing Community Resilience Hazard exposure heterophily: A latent characteristic in socio-spatial networks influencing community resilience.\BBCQ \APACjournalVolNumPagesarXiv:2205.01868 [cs]. \PrintBackRefs\CurrentBib
- McPherson \BOthers. (\APACyear1992) \APACinsertmetastarMcPherson1992Social{APACrefauthors}McPherson, J\BPBIM., Popielarz, P\BPBIA.\BCBL \BBA Drobnic, S. \BBOP1992\BBCP. \BBOQ\APACrefatitleSocial Networks and Organizational Dynamics Social networks and organizational dynamics.\BBCQ \APACjournalVolNumPagesAmerican Sociological Review572153–170. \PrintBackRefs\CurrentBib
- Mucha \BOthers. (\APACyear2010) \APACinsertmetastarMucha2010Community{APACrefauthors}Mucha, P\BPBIJ., Richardson, T., Macon, K., Porter, M\BPBIA.\BCBL \BBA Onnela, J\BHBIP. \BBOP2010\BBCP. \BBOQ\APACrefatitleCommunity Structure in Time-Dependent, Multiscale, and Multiplex Networks Community structure in time-dependent, multiscale, and multiplex networks.\BBCQ \APACjournalVolNumPagesScience3285980876–878. \PrintBackRefs\CurrentBib
- Mulcahy (\APACyear2021) \APACinsertmetastarMulcahy2021At{APACrefauthors}Mulcahy, S. \BBOP2021\BBCP. \BBOQ\APACrefatitleAt least 111 people died in Texas during winter storm, most from hypothermia At least 111 people died in texas during winter storm, most from hypothermia.\BBCQ \APACjournalVolNumPagesThe Texas Tribune. \PrintBackRefs\CurrentBib
- Nadkarni \BBA Hofmann (\APACyear2012) \APACinsertmetastarNadkarni2012Why{APACrefauthors}Nadkarni, A.\BCBT \BBA Hofmann, S\BPBIG. \BBOP2012\BBCP. \BBOQ\APACrefatitleWhy do people use Facebook? Why do people use facebook?\BBCQ \APACjournalVolNumPagesPersonality and Individual Differences523243–249. \PrintBackRefs\CurrentBib
- Papadopoulos \BOthers. (\APACyear2012) \APACinsertmetastarPapadopoulos2012Community{APACrefauthors}Papadopoulos, S., Kompatsiaris, Y., Vakali, A.\BCBL \BBA Spyridonos, P. \BBOP2012\BBCP. \BBOQ\APACrefatitleCommunity detection in Social Media: Performance and application considerations Community detection in social media: Performance and application considerations.\BBCQ \APACjournalVolNumPagesData Mining and Knowledge Discovery243515–554. \PrintBackRefs\CurrentBib
- Powell (\APACyear2021) \APACinsertmetastarPowell2021PGE{APACrefauthors}Powell, T\BPBIB. \BBOP2021\BBCP. \BBOQ\APACrefatitlePG&E briefly shut off power to 48,000 residents as wildfires continue to threaten California’s power grid PG&E briefly shut off power to 48,000 residents as wildfires continue to threaten california’s power grid.\BBCQ \APACjournalVolNumPagesCBS NEWS. \PrintBackRefs\CurrentBib
- Qin \BOthers. (\APACyear2020) \APACinsertmetastarQin2020Mining{APACrefauthors}Qin, H., Li, R\BHBIH., Wang, G., Huang, X., Yuan, Y.\BCBL \BBA Yu, J\BPBIX. \BBOP2020\BBCP. \BBOQ\APACrefatitleMining Stable Communities in Temporal Networks by Density-based Clustering Mining stable communities in temporal networks by density-based clustering.\BBCQ \APACjournalVolNumPagesIEEE Transactions on Big Data1–1. \PrintBackRefs\CurrentBib
- Rajput \BBA Mostafavi (\APACyear2022) \APACinsertmetastarrajput_latent_2022{APACrefauthors}Rajput, A\BPBIA.\BCBT \BBA Mostafavi, A. \BBOP2022\BBCP. \BBOQ\APACrefatitleLatent Sub-structural Resilience Mechanisms in Temporal Human Mobility Networks during Urban Flooding Latent Sub-structural Resilience Mechanisms in Temporal Human Mobility Networks during Urban Flooding.\BBCQ \APACjournalVolNumPagesarXiv:2203.16786 [cs]. \PrintBackRefs\CurrentBib
- Reich (\APACyear2006) \APACinsertmetastarReich2006Three{APACrefauthors}Reich, J\BPBIW. \BBOP2006\BBCP. \BBOQ\APACrefatitleThree psychological principles of resilience in natural disasters Three psychological principles of resilience in natural disasters.\BBCQ \APACjournalVolNumPagesDisaster Prevention and Management: An International Journal155793–798. \PrintBackRefs\CurrentBib
- Rossetti \BBA Cazabet (\APACyear2018) \APACinsertmetastarRossetti2018Community{APACrefauthors}Rossetti, G.\BCBT \BBA Cazabet, R. \BBOP2018\BBCP. \BBOQ\APACrefatitleCommunity Discovery in Dynamic Networks: A Survey Community discovery in dynamic networks: A survey.\BBCQ \APACjournalVolNumPagesACM Computing Surveys51235:1–35:37. \PrintBackRefs\CurrentBib
- Rossi \BBA Neville (\APACyear2012) \APACinsertmetastarRossi2012Time-Evolving{APACrefauthors}Rossi, R.\BCBT \BBA Neville, J. \BBOP2012\BBCP. \BBOQ\APACrefatitleTime-Evolving Relational Classification and Ensemble Methods Time-evolving relational classification and ensemble methods.\BBCQ \BIn (\BPGS 1–13). \APACaddressPublisherSpringer. \PrintBackRefs\CurrentBib
- Song \BOthers. (\APACyear2016) \APACinsertmetastarSong2016Prediction{APACrefauthors}Song, X., Zhang, Q., Sekimoto, Y., Shibasaki, R., Yuan, N\BPBIJ.\BCBL \BBA Xie, X. \BBOP2016\BBCP. \BBOQ\APACrefatitlePrediction and Simulation of Human Mobility Following Natural Disasters Prediction and simulation of human mobility following natural disasters.\BBCQ \APACjournalVolNumPagesACM Transactions on Intelligent Systems and Technology8229:1–29:23. \PrintBackRefs\CurrentBib
- Soundarajan \BOthers. (\APACyear2016) \APACinsertmetastarSoundarajan2016Generating{APACrefauthors}Soundarajan, S., Tamersoy, A., Khalil, E\BPBIB., Eliassi-Rad, T., Chau, D\BPBIH., Gallagher, B.\BCBL \BBA Roundy, K. \BBOP2016\BBCP. \BBOQ\APACrefatitleGenerating Graph Snapshots from Streaming Edge Data Generating graph snapshots from streaming edge data.\BBCQ \BIn (\BPG 109–110). \APACaddressPublisherInternational World Wide Web Conferences Steering Committee. \PrintBackRefs\CurrentBib
- U.S. Census Bureau (\APACyear2020) \APACinsertmetastar2020American{APACrefauthors}U.S. Census Bureau. \BBOP2020\BBCP. \APACrefbtitleAmerican Community Survey 5-Year Estimates (2015-2019). American community survey 5-year estimates (2015-2019). \PrintBackRefs\CurrentBib
- Watson \BOthers. (\APACyear2021) \APACinsertmetastarWatson2021Effects{APACrefauthors}Watson, K\BPBIP., Cross, R., Jones, M\BPBIP., Buttorff, G., Pinto, P., Sipole, S\BPBIL.\BCBL \BBA Vallejo, A. \BBOP2021\BBCP. \APACrefbtitleThe Effects of the Winter Storm of 2021 in Harris County The effects of the winter storm of 2021 in harris county \APACbVolEdTR\BTR. \PrintBackRefs\CurrentBib
- Wu \BOthers. (\APACyear2020) \APACinsertmetastarWu2020Deep{APACrefauthors}Wu, L., Zhang, Q., Chen, C\BHBIH., Guo, K.\BCBL \BBA Wang, D. \BBOP2020\BBCP. \BBOQ\APACrefatitleDeep Learning Techniques for Community Detection in Social Networks Deep learning techniques for community detection in social networks.\BBCQ \APACjournalVolNumPagesIEEE Access896016–96026. \PrintBackRefs\CurrentBib
- Yabe \BOthers. (\APACyear2021) \APACinsertmetastarYabe2021Resilience{APACrefauthors}Yabe, T., Rao, P\BPBIS\BPBIC.\BCBL \BBA Ukkusuri, S\BPBIV. \BBOP2021\BBCP. \BBOQ\APACrefatitleResilience of Interdependent Urban Socio-Physical Systems using Large-Scale Mobility Data: Modeling Recovery Dynamics Resilience of interdependent urban socio-physical systems using large-scale mobility data: Modeling recovery dynamics.\BBCQ \APACjournalVolNumPagesSustainable Cities and Society75103237. \PrintBackRefs\CurrentBib
- Yabe \BBA Ukkusuri (\APACyear2020) \APACinsertmetastarYabe2020Effects{APACrefauthors}Yabe, T.\BCBT \BBA Ukkusuri, S\BPBIV. \BBOP2020\BBCP. \BBOQ\APACrefatitleEffects of income inequality on evacuation, reentry and segregation after disasters Effects of income inequality on evacuation, reentry and segregation after disasters.\BBCQ \APACjournalVolNumPagesTransportation Research Part D: Transport and Environment82102260. \PrintBackRefs\CurrentBib
- Yuan \BOthers. (\APACyear2021) \APACinsertmetastarYuan2021Smart{APACrefauthors}Yuan, F., Fan, C., Farahmand, H., Coleman, N., Esmalian, A., Lee, C\BHBIC.\BDBLMostafavi, A. \BBOP2021\BBCP. \BBOQ\APACrefatitleSmart Flood Resilience: Harnessing Community-Scale Big Data for Predictive Flood Risk Monitoring, Rapid Impact Assessment, and Situational Awareness Smart flood resilience: Harnessing community-scale big data for predictive flood risk monitoring, rapid impact assessment, and situational awareness.\BBCQ \APACjournalVolNumPagesarXiv:2111.06461 [physics]. \PrintBackRefs\CurrentBib