Learning Correlations between Internal Coordinates to improve 3D Cartesian Coordinates for Proteins
Abstract
Motivation. We consider a generic representation problem of internal coordinates (bond lengths, valence angles, and dihedral angles) and their transformation to 3-dimensional Cartesian coordinates of a biomolecule.
Results. We show that the internal-to-Cartesian process relies on correctly predicting chemically subtle correlations among the internal coordinates themselves, and learning these correlations increases the fidelity of the Cartesian representation. We developed a machine learning algorithm, Int2Cart, to predict bond lengths and bond angles from backbone torsion angles and residue types of a protein, and allows reconstruction of protein structures better than using fixed bond lengths and bond angles, or a static library method that relies on backbone torsion angles and residue types on a single residue.
Availability and Implementation. The Int2Cart algorithm has been implemented as a publicly accessible python package at https://github.com/THGLab/int2cart.
1Kenneth S. Pitzer Theory Center and Department of Chemistry, University of California, Berkeley, CA, USA
2Molecular Medicine Program, Hospital for Sick Children, Toronto, Ontario M5S 1A8, Canada
3Department of Biochemistry, University of Toronto, Toronto, Ontario M5G 1X8, Canada
4Chemical Sciences Division, Lawrence Berkeley National Laboratory, Berkeley, CA, USA
5Departments of Bioengineering and Chemical and Biomolecular Engineering, University of California, Berkeley, CA, USA
corresponding author: thg@berkeley.edu
INTRODUCTION
Biomolecular structures are described using two widely used mathematical representations: internal coordinates and Cartesian coordinates. The internal coordinate representation is defined by a set of bond lengths, bond angles, and dihedral or torsion angles, and provides a compact description in terms of the Z-matrix. In contrast, a Cartesian representation defines all of the atomic positions in Euclidean x,y,z coordinates and additionally captures the orientation of a molecule in space. Both representations are useful in certain contexts and applications. Internal coordinates can be beneficial for geometry optimizations1 and are the preferred description for NMR structure determination and refinement in which the bond lengths and bond angles are generally taken as fixed2, while Cartesian coordinates are the preferred format of molecular dynamics simulations3 and X-ray crystallography structures provided in the Protein Data Bank (PDB) repository4.
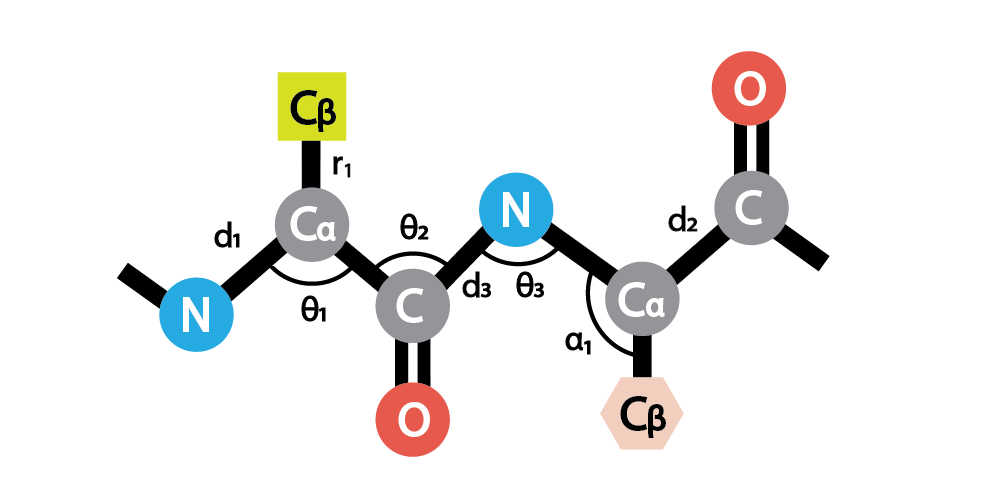
Figure 1 considers the internal coordinates of a protein backbone that contains the three torsion angles (), (), and (), bond lengths (), (), and (), and bond angles (), (), and (); side chain information that may effect the backbone could also include () and () for example. When all of these quantities are specified exactly, the back-transformation from internal coordinates will also result in a perfect 3D Cartesian reconstruction of the protein backbone structure, using algorithms such as the natural extension reference frame (NeRF)5. However, the Cartesian reconstruction is almost universally defined by only the backbone torsions while holding the bond lengths and angles fixed at mean values to decrease the complexity of structure modelling. Sometimes the variations on the torsion angles are also ignored and taken as fixed values of 0°or 180°, due to the planar nature of the peptide bond.6 One might assume that a protein structure can be reconstructed in Cartesian coordinates quite well utilizing fixed bond lengths and angles since they typically have quite small variations around their means. However, even small deviations from the mean of the stiff degrees of freedom can strongly influence the Cartesian reconstruction.
The origin of this error arises especially clearly from the nature of chain molecules: as the protein chain gets longer, small errors in bond lengths and bond angles can quickly accumulate and result in significant differences in the final back-transformed structure. According to a study by Holmes et al.7 on globular proteins, the RMSD errors incurred in the internal coordinate back-transformations to Cα Cartesian positions under fixed bond lengths and angles is 6 Å for an average 150-amino-acid protein, and can be as high as 40 Å for larger proteins.
Alternatively, one could replace the assumption of fixed bonds and bond angles with a statistical approach that conditions on sequence or structural correlations in the PDB. Given the many types of correlations that exist between the internal coordinates of globular proteins, such as the and torsion angles of the Ramanchandran plot8 and the correlation between backbone and sidechain torsion angles used in the Dunbrack rotamer library9, the correlations among the stiff bond lengths and angles with the flexible torsions should not be surprising. Earlier studies on the relationship between bond angles and , torsion angles or amino acid types were mostly focused on the bond angle, using both statistical methods and quantum mechanics calculation on model dipeptides.10, 11, 12, 13. The work by Berkholz14 found that by using a static library for backbone bond angles dependent on backbone , angles and residue types, the median RMSDs of protein reconstruction normalized to 100 amino acids is 2.85 Å. Following this pioneering study, more recent work by Roberto and co-workers have extended the correlation to all bond lengths and bond angles centered on backbone N, Cα and C atoms.15, 16 Similarly, Lundgren et al. studied the correlation between protein backbone angles, secondary structure, and sidechain orientations.17, and Ashraya et al. evaluated the steric-clash Ramanchandran maps conditioned on bond geometries. 18 However, none of these studies have considered the torsion angle dependence of the internal coordinates.
This work provides a more comprehensive machine learning approach that both quantifies and learns internal coordinate correlations within a deeper amino acid sequence context, that in turn provides a more accurate prediction of the 3D Cartesian coordinates relative to the errors incurred under the standard assumptions of fixed bond lengths and angles. By capturing the subtle correlations observed among internal coordinates, the Int2Cart (Internal to Cartesian) algorithm reduces the reconstruction RMSD error to 2.3 Å for test proteins less than 150-amino-acids, and an average RMSD of 3.5 Å over the entire test set for globular proteins as large as 543 amino acids. In addition we consider the "out-of-distribution" performance of Int2Cart on two more difficult test systems, including 42 proteins obtained from the 12th Community Assessment of Structure Prediction (CASP-12) as well as accurate reconstructions for intrinsically disordered protein (IDP) ensembles that we find generates lowers errors and fewer undesirable steric clashes. The Int2Cart deep learning model developed for proteins should be general to other types of chain molecules including RNA, DNA, and lipid molecules if appropriate data sets are made available.
METHODS
Dataset preparation. We have used SidechainNet19 as a preprocessed dataset that uses clustering techniques to extract protein sequences and structures with defined similarity cutoffs, to reduce bias in the original PDB structures, and to prevent information leakage from the training set to the test set relevant to assessing the machine learning generalization.20, 19 The SidechainNet dataset represents each protein by its amino acid sequence, backbone and sidechain torsion angles (, , , , , etc), backbone bond angles -, as well as the all-atom 3D coordinates. For this study we ignore the sidechain torsions as we are only reconstructing backbones, and also supplement the protein dataset with backbone bond lengths - calculated from the 3D coordinates for training, validation and test sets. We also identified some and bond angles that were incorrect due to missing atoms in the next residue, and they were masked out along with the residue at the end of the protein chain. We combined validation sets from 10% to 50% similarity cutoffs to serve as our primary test data.20 When needed, we separated test set proteins at the broken chain positions and only retained chains longer than 50 consecutive amino acids.20 Additionally we compiled two alternative and more difficult test data sets to validate the transferability of our model: the prediction targets from CASP-12 as well as reconstructions for IDP structural ensembles.
Our final training dataset contained 41,380 proteins with a minimum sequence length of 20 and maximum length of 4914 amino acids. The primary test set was comprised of 140 protein or protein fragments with sequence lengths between 23 and 543 amino acids. The challenging 42 proteins or protein fragments in the CASP12 test set ranged in length from 51 to 599 amino acids. The IDP ensemble comprised 1000 conformations for the N-terminal 92 residues of the Sic1 protein;21, 22 we extracted the backbone torsions and rebuilt the Cartesian structures for each conformer under different assumptions about the bond lengths and bond angles as reported in Results.
Neural network design. The structure of the deep neural network, Int2Cart, is depicted in Figure 2. We utilized 3 layers of stacked bidirectional gated recurrent units (GRU) as the central component, each of which contains a hidden state with its information updated by the reset and update mechanisms for each element in the input sequence through the following set of equations23:
| (1) | ||||
| (2) | ||||
| (3) | ||||
| (4) |
where are the trainable parameters of the model, is the input to the cell at the current timestep, and and represent the reset and update gates, which are numbers between that control how much information to retain in the new update vector and how the new hidden state vector is composed from the update vector and the old hidden state . denotes the sigmoid function, and represents element-wise multiplication. Dropout was applied to the hidden states between layers, so that , where each is a Bernoulli random variable that zeros out elements in the hidden state vector with a probability defined by the dropout rate.
The inputs into the first layer of GRU cells are the , and torsion angles and the amino acid types. Each torsion angle, , was represented by a Gaussian smearing function discretized to a vector of length 180 to account for uncertainty in the data, denoted
| (5) |
where is the actual , or angle and (both in degrees), and in this work we used . The custom function
| (6) |
ensures that the periodicity of the angles is taken into account. Each smeared torsion angle vector is further transformed through two fully-connected layers with 90 and 64 units each and Rectified Linear Units (ReLU) activation24 to generate latent representations of the torsion angles. The residue types are encoded by a trainable embedding dictionary and formulated into latent vectors of length 64. The torsion angle latent vectors and the embedded residue types are then concatenated and transformed together through 2 fully-connected layers with 128 and 64 units and ReLU activation and constitute the inputs into the GRU cells.
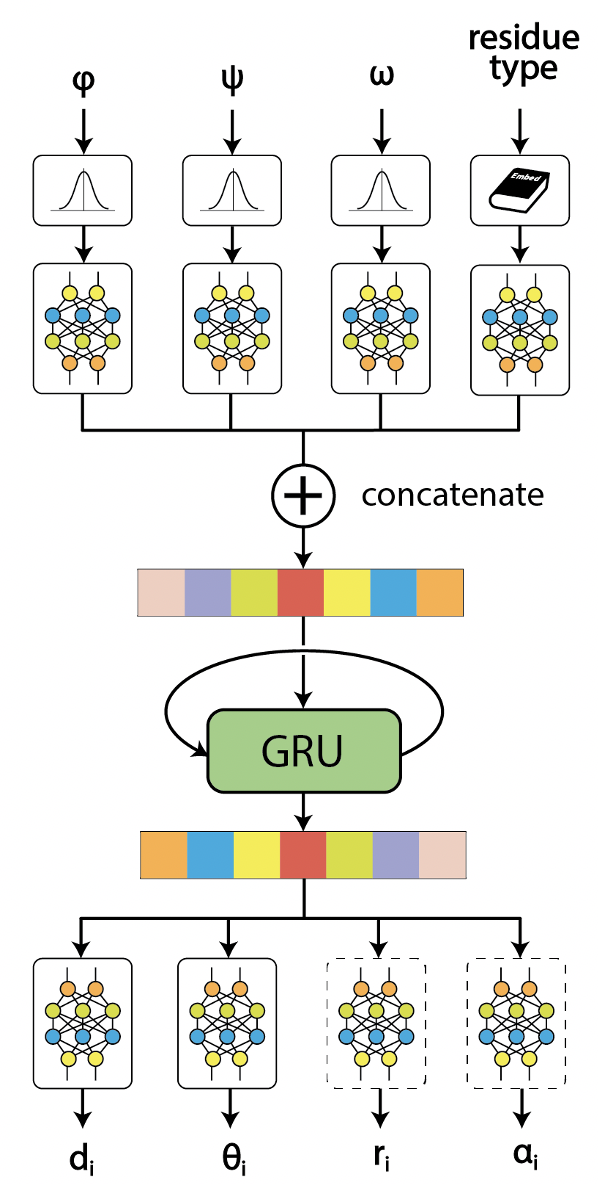
The hidden state output from the last GRU layer is connected with multiple outputs to predict the backbone bond lengths and bond angles, or optionally sidechain bond lengths and bond angles as well. Each output is a fully-connected neural network with a hidden layer of size 100 and activation ReLU, and the output has size of 1 without any activation. The raw outputs are scaled by the standard deviation and translated by the mean value of that data type in the training dataset. The means and standard deviations we used are provided in Supplementary Table 1.
Training details of the Int2Cart machine learning method. The neural network was trained by minimizing the weighted mean square error loss function
| (7) |
where controls the weighting for different data types in the loss function, are the predictions from the model and are the actual values from the data set. In practice we used the same weighting for all the data types. Missing data targets were masked out during the training. We used the Adam optimizer25 with an initial learning rate of 0.001 and an exponentially decayed learning rate schedule, so where is epoch number and in our case. The model was trained for a total of 100 epochs using a batch size of 128.
Building all-atom Cartesian structures from internal angle model predictions. With the full profile of backbone torsion angles and predictions of bond lengths and bond angles from the model, the 3D Cartesian structure of the protein containing all backbone atoms is reconstructed using the SidechainNet package.19 It utilizes the natural extension reference frame (NeRF) algorithm5 to sequentially calculate the position of the next atom with the positions of three previous atoms and the new bond length, bond angle and torsion angle. The all-atom backbone Cartesian structures for all the protein fragments in our test data set are built from either the Int2Cart algorithm vs. a standard baseline of using fixed bond lengths and bond angles (Fixed) with no conditioning on torsions or amino acid type.
RESULTS
Statistical analysis of the protein training set. Given the large collection of protein structures deposited into the PDB, we first consider a statistical analysis of protein bond lengths and bond angles when analyzed over the training set. Overall the distributions of these internal coordinate values are mostly Gaussian with relatively small standard deviations of 0.01 Å for bond lengths and 2.6 for bond angles. Figure 3 a-f depicts the deviations from the mean bond length and angle values for a given combination, and confirms the existence of strong correlations among the internal coordinates averaged over the training data set. Specifically, the angle is larger for the right-hand and left-hand helix regions in the Ramanchandran plot, while the beta-sheet regions have more narrow angles, with deviations from the mean as large as 7.5°. The values are strongly correlated with the torsion angle, with larger angles when is between and 0°, and smaller angles than the mean otherwise. The values for nearly all of the combinations are larger than average, but have smaller angles for helix regions. Similarly, the and bond lengths show greater correlations with the torsion angle, with a preference for larger values when is between and , in which the bond lengths change by as much as 0.02 Å. Finally the correlation for the peptide bond with the backbone torsions is weak, consistent with its partial double bond character, except for a few hot spots where it can vary up to 0.04 Å. These correlations are statistically meaningful, because the standard deviations in each bin are smaller than the mean value differences (Supplementary Figure 1), which means the statistical bias is more significant than the variance.

We have also considered the relationships between backbone torsion angles with bond angles (Figure 3 g-i) and bond lengths (Supplementary Figure 2), and found interesting correlations between internal coordinates and torsion angles. The majority of peptide bonds in proteins are in trans- conformation, with torsion angles close to 180°. However, cis- peptide bonds tend to associate with smaller angles and larger and angles. This result also makes structural sense since cis- peptide bonds incur more steric repulsion between sidechains of two consecutive residues, and larger , and smaller values allow the sidechains to be more separated. On the other hand, the correlation between bond lengths and torsion angles are not obvious (Supplementary Figure 2). These correlations dependent on are also important for accurately predicting internal coordinates from backbone torsion angles, as we will show later.

When we consider the observed distributions of all six internal coordinates conditioned on the residue type (Supplementary Figure 3), we find that the distributions are quite similar between amino acids with only subtle differences in the shape of the peaks, with the exception of glycine, which tends to have and values that are smaller, and angles that are larger than other residues. Proline also defines an exception, with larger values due to the formation of the five-membered ring that requires longer bond lengths. However the bond length and angle distributions when conditioned on backbone torsions and residue type exhibit notable variations across all twenty amino acids as seen in Figure 4 for the bond angle, as well as for the other backbone bonds and angles provided in Supplementary Figures 4-8.
Machine learning of sequence and structural correlations. While the correlation graphs just described could serve as a source for bond lengths and angles when backbone torsion angles and residue types are provided, we are still missing the deeper sequence correlations that are buried beneath the statistics of the single residue results. Therefore, we trained a deep neural network on the same data in order to capture the more subtle correlations among the internal coordinates conditioned on amino acid sequence. After training, the Int2Cart neural network was used to predict the primary test set which has at most 50% sequence and structural similarity with the training proteins. The results are summarized in Table 1 in terms of root-mean-square error (RMSE) and Pearson correlation coefficients (). We find that the bond length predictions are within computational uncertainty as measured by the variance in the data set, while predictions on the bond angles are more successful in terms of the RMSEs that are smaller than the dataset variance.
| Data type | RMSE | |
|---|---|---|
| N-Cα-C () | 1.90° | 0.71 |
| Cα-C-N () | 1.08° | 0.44 |
| C-N-Cα () | 1.36° | 0.54 |
| N-Cα () | 0.011 Å | 0.38 |
| Cα-C () | 0.011 Å | 0.36 |
| C-N () | 0.007 Å | 0.50 |
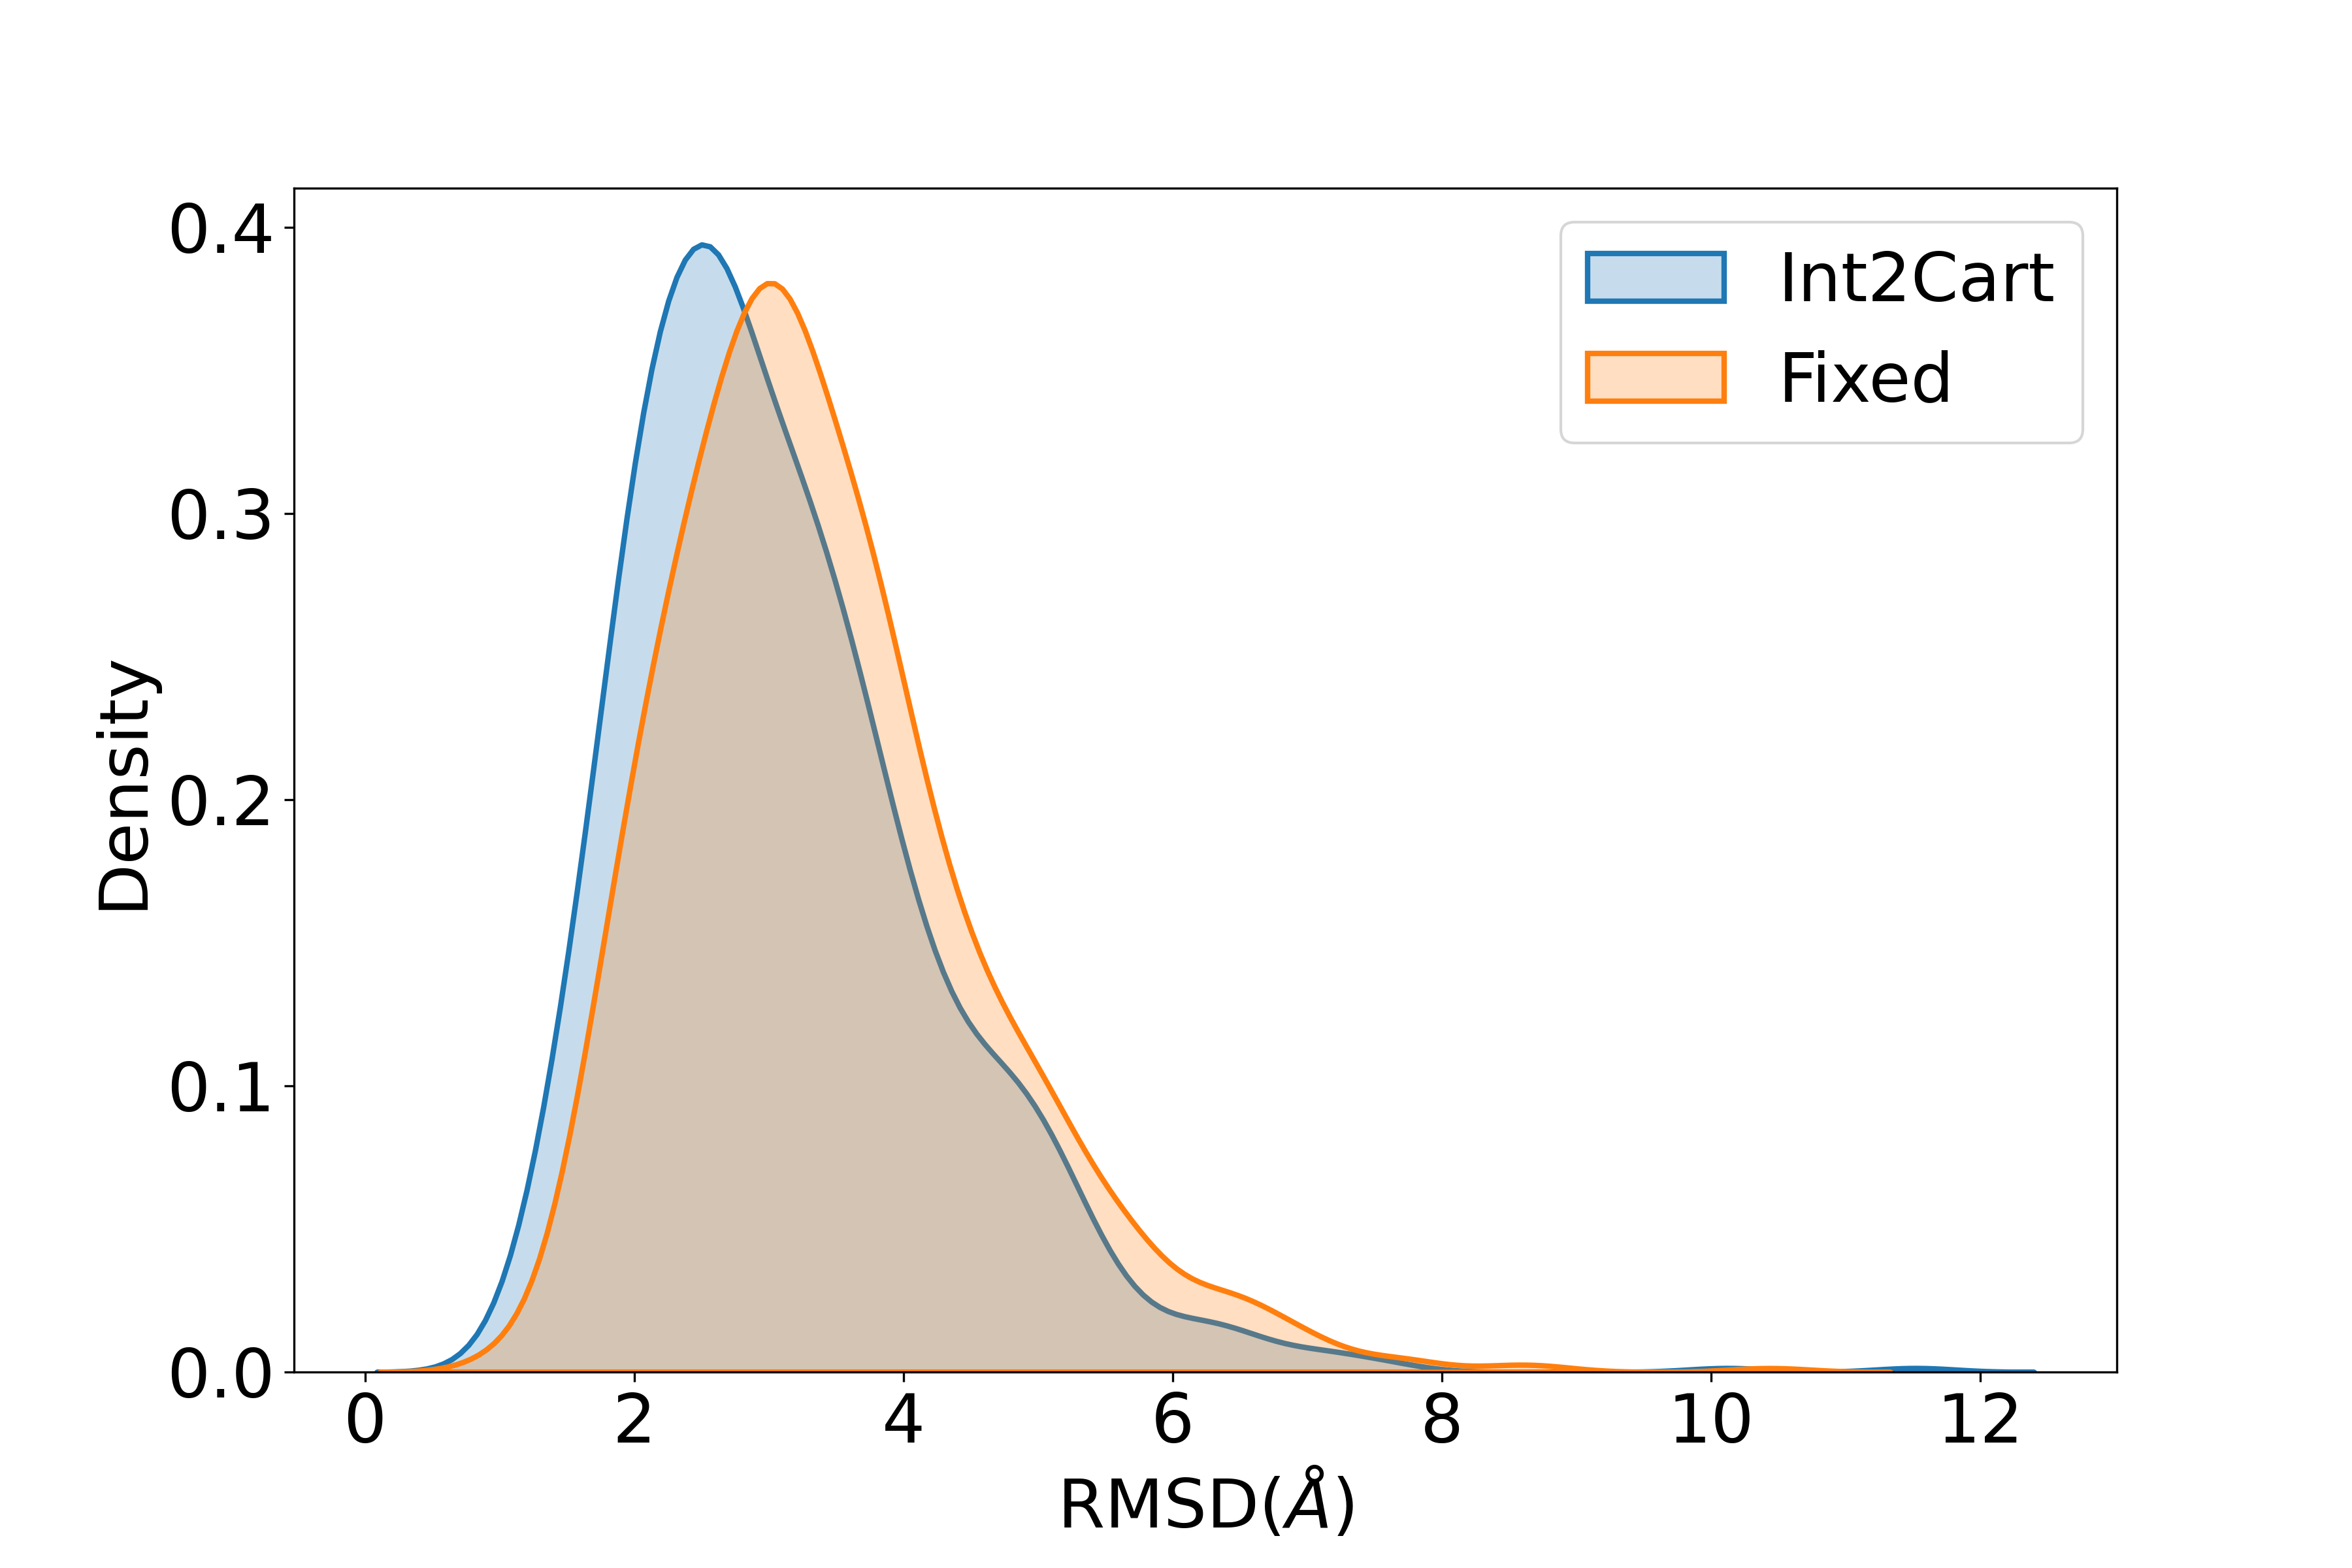
Cartesian coordinate reconstructions. Given the three torsion angles for each residue over the entire protein sequence as input, we next consider how well the Cartesian coordinates are reconstructed based on whether bond and angle geometries are held fixed or learned from Int2Cart. Figure 5a reports the distribution of root-mean-square deviations (RMSD) for all backbone atoms with respect to the actual PDB structure for all proteins in the test set using Int2Cart and the Fixed method. In general, the reconstructed RMSD distributions for the Int2Cart structures are centered around lower RMSD values compared with the Fixed structures, with a median RMSD of 2.14 Å when normalized to 100 amino acids, and the average RMSD over the entire test set is 3.5 Å. By contrast the Fixed model yields a median RMSD of 3.24 Å when all proteins are normalized to 100 amino acids, and the average over the entire test set is 5.1 Å. The Int2Cart results are notably better than previous results, including the Berkholtz study14 that conditioned on , and amino acid type, showing that deeper sequence correlations are beneficial to learn.
Figure 5b illustrates that the proteins reconstructed by assuming fixed bond lengths and bond angles have lost significant secondary structure integrity compared to the reference structures, whereas the Int2Cart structures retained a much higher proportion of secondary structural elements. The pairwise RMSDs for the test proteins reconstructed by Int2Cart are compared to those reconstructed using the Fixed approach in Figure 5c, and the RMSD difference between these two methods as a function of sequence length is shown in Figure 5d. It is evident that the vast majority of the test set proteins benefit from the machine learned bond lengths and bond angles, with an average improvement of Å RMSD over using Fixed bond lengths and bond angles. There is no obvious correlation between the RMSD improvements made by Int2Cart over Fixed in regards sequence length, although the largest improvements occur in those proteins with longer amino acid sequences.
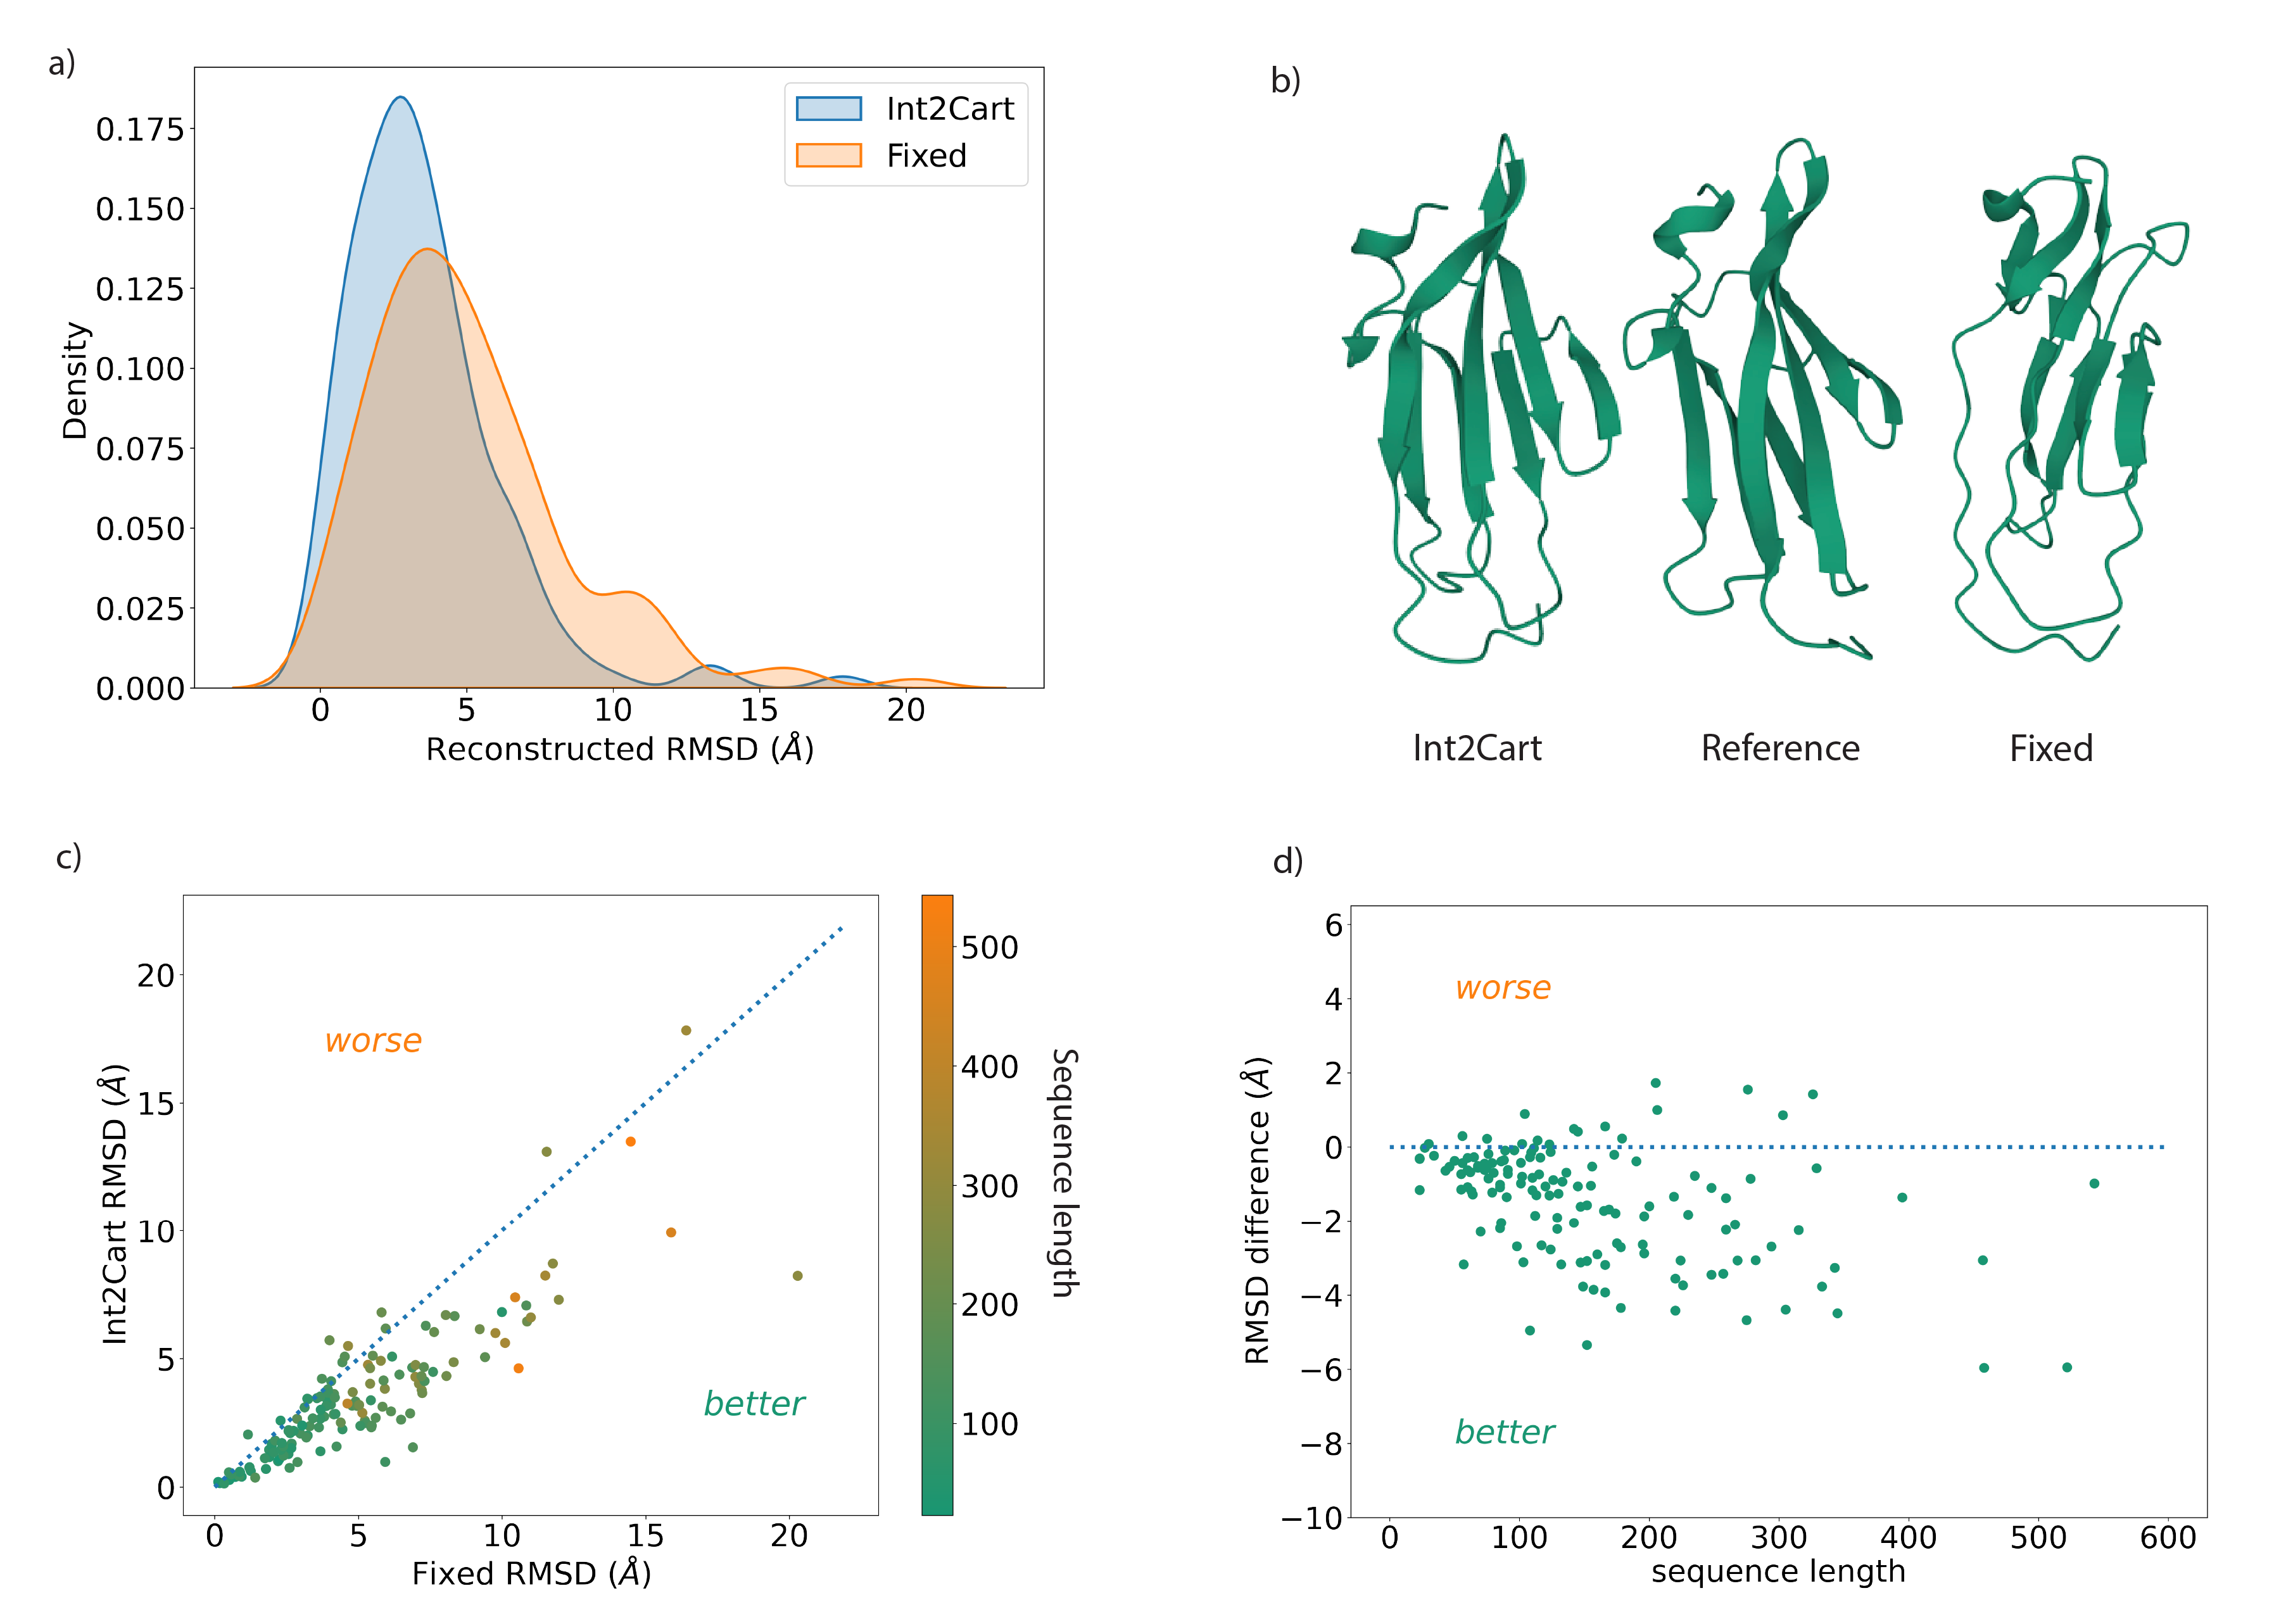
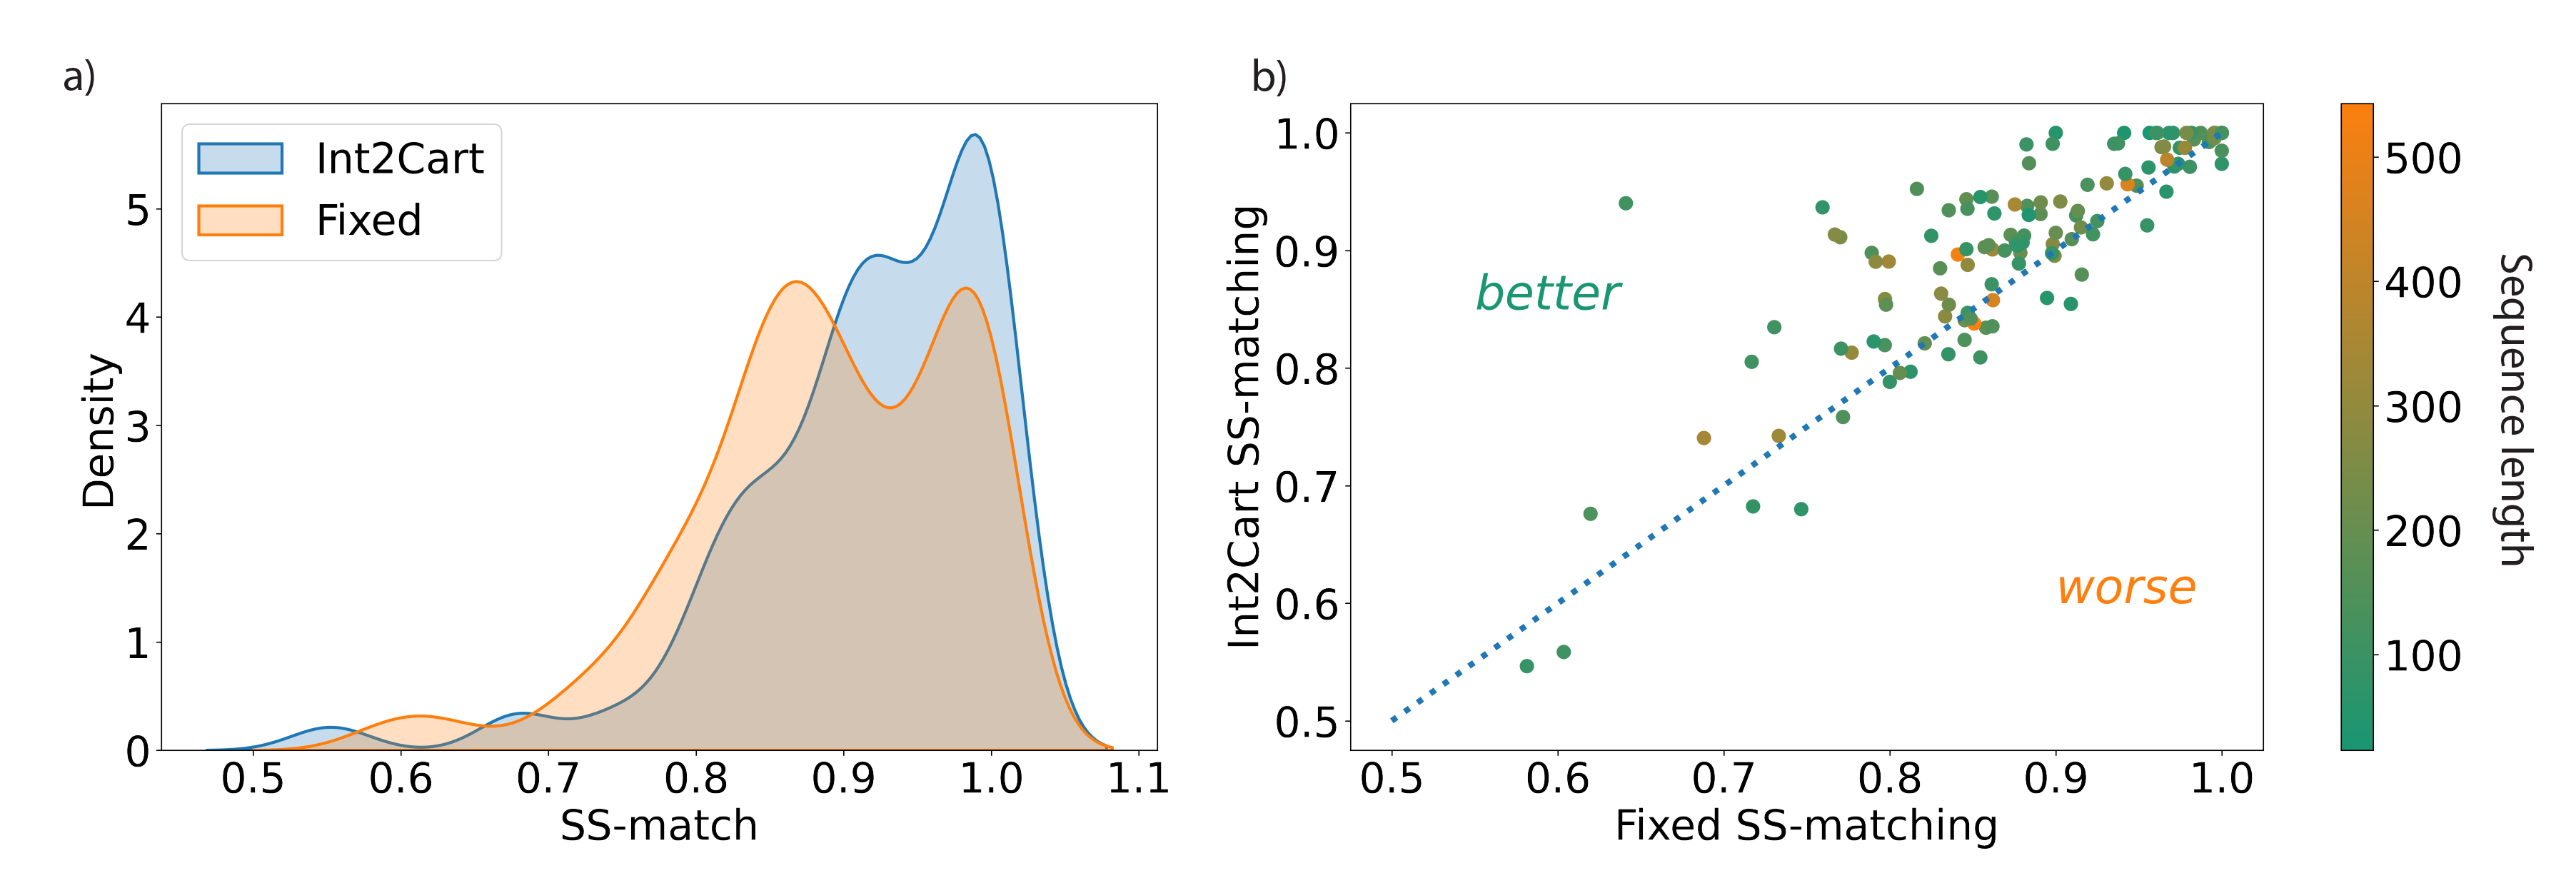
Beyond the anecdotal case in Figure 5b, we performed more extended analysis of Int2Cart and Fixed performance in regards the radius of gyration (Rg) and secondary structure recovery rate (SS-match) over the whole test dataset. Although we find that the Int2Cart Cartesian predictions have closer Rg values to the ground truth structures, the Fixed Cartesian structures still yields a comparably good result as seen in Supplementary Figure 9. However Figure 6a shows that Int2Cart systematically improves upon Fixed in regards the SS-match values with a higher proportion of test set proteins that have SS-match values larger than 0.8 for Int2Cart predicted structures (Figure 6b), which translates to more than 80% of the residues having correct secondary structure assignments.
Ablation studies. To understand the importance of various inputs for prediction accuracy of Int2Cart and the importance of the bond length and bond angle targets in reconstructing Cartesian structures, we performed an ablation study by training separate deep learning models using subsets of the inputs, and reconstructing structures using only predicted bond lengths, only predicted bond angles, or using both. We have also trained models with additional inputs of torsion angles, along with and sidechain bond lengths and bond angles as additional outputs, to evaluate how including sidechain information could improve prediction and reconstruction of backbone structures. All ablation trials are reported in Table 2.
| Model inputs | <d> RMSE (Å) | <> RMSE (°) | Cartesian RMSD (Å) |
|---|---|---|---|
| Residue type | 0.0105E-5 | 1.860.002 | 4.97 0.01 |
| 0.0105E-5 | 1.670.004 | 4.240.02 | |
| + Residue type | 0.0106E-5 | 1.630.004 | 4.050.02 |
| + Residue type | 0.0105E-5 | 1.480.006 | 3.560.03 (2.14 for 100 aa) |
| + Residue type | 0.0092E-5 | 1.360.001 | 3.050.01 |
The differences in predictions of the backbone bond lengths from different deep learning models are not significant, but prediction accuracy for backbone bond angles RMSE and reconstructed Cartesian structure RMSD are highly dependent on what information is available to the model. Specifically, a machine learning model that only knows about the residue types performs the worst with 5 Å in the reconstruction RMSD. Unsurprisingly based on statistical analysis of the PDB, backbone and torsion angles provide more information than residue types alone, and allows the reconstruction RMSD to decrease to 4.24 Å on average. Including both , and residue types further decreases the average reconstruction error to 4.05 Å. As expected from the correlation of bond lengths and bond angles with torsion angles as well, including exact values for torsion angles also significantly improves the model and allows the reconstructed structure RMSD to decrease further to 3.56 Å across the whole test set, and to 2.14 Å for proteins normalized to 100 amino acids. When we tested the inclusion of sidechain torsion angles, we find that the 3D reconstruction model is even better, achieving an average reconstruction structure RMSD of 3.05 Å. That is probably because the torsion angles are indicative of avoidable steric clashes between protein backbones and side chains to create more accurate descriptions of subsequent backbone bond geometries, even though side chain atoms are not explicitly treated during structure reconstruction.
| Source of bond lengths & bond angles | Reconstructed structure RMSD (Å) |
|---|---|
| Fixed bond lengths and angles | 5.073.47 |
| Predicted bond lengths and fixed bond angles | 5.063.46 |
| Fixed bond lengths and predicted bond angles | 3.512.65 |
| Predicted bond lengths and bond angles | 3.512.65 |
Table 3 shows the Cartesian structure RMSDs for protein structures reconstructed with predicted bond lengths, predicted bond angles and both, and compared with using fixed bond lengths and bond angles. Interestingly, the reconstruction quality does not depend on the direct prediction of bond lengths, as it essentially has no effect on the reconstructed structures, which my have been anticipated from the fact that bond length errors are on par with the variance. But this final ablation study provides direct evidence that accurate predictions of bond angles are of primary importance for the quality of the reconstructed Cartesian structures.
Evaluation of the method on more challenging test datasets. Finally we consider two independent test data sets that are quite different from the originally defined test set from SidechainNet, performed to evaluate the transferability of the Int2Cart model. Table 4 reports the prediction RMSE for all bond length and bond angles targets of the CASP-12 protein data set and the mean Cartesian reconstruction error. Compared with the previous test dataset results, the predictions on becomes slightly worse in terms of RMSE and correlation coefficients, but all other prediction targets are very close to the original results described in Table 1. The reconstructed structure RMSD on the CASP-12 test dataset is on average 4.5 Å, but this shift to higher RMSD values relative to the original test set is due to the higher proportion of longer proteins. This is supported by the fact that the reconstructed RMSD as a function of sequence length for the CASP-12 data are indistinguishable from the primary test dataset as illustrated in Supplementary Figure 10. Additionally, the reconstructed RMSD for proteins normalized to 100 amino acids in the CASP12 test set is 2.06 Å, in close agreement with the results of the original test set.
| Data type | RMSE | |
|---|---|---|
| N-Cα-C () | 1.79° | 0.69 |
| Cα-C-N () | 1.01° | 0.60 |
| C-N-Cα () | 1.71° | 0.41 |
| N-Cα () | 0.009 Å | 0.39 |
| Cα-C () | 0.010 Å | 0.48 |
| C-N () | 0.011 Å | 0.39 |
| Reconstruction | RMSD | |
| all CASP12 proteins | 4.49 Å | |
| CASP12 proteins (normalized to 100 aa) | 2.06 Å |
In the second stress test we show that our Int2Cart method can improve upon the Cartesian reconstruction of an ensemble of structures of a disordered protein compared to Fixed bond lengths and angles. Figure 7 compares the Cartesian reconstruction RMSD distributions for Int2Cart and
Fixed for the Sic1 IDP ensemble, in which we find that the Int2Cart method is overall closer to the original ensemble, with a 3.1 Å average RMSD compared to the Fixed method that has a mean RMSD of 3.4 Å. We have also checked the number of steric clashes in the structures generated from these two methods. A steric clash is defined as two atoms in the structure that are closer to 0.6 times the sum of the van der Waals radii of the two atoms.28 Out of the 1000 conformations, 73 structures generated from Int2Cart contained steric clashes, which means 92.7% of the structures are clash-free. By comparison, 102 structures generated using fixed bond lengths and bond angles contained steric clashes, which translates to 89.8% of clash-free structures. A higher proportion of clash-free structures is meaningful because typically structures containing clashes are discarded, and a method with higher proportion of clash-free structures wastes less computational resources, and supports the application of the Int2Cart algorithm to disordered protein ensembles.
DISCUSSION AND CONCLUSION
In this work we have developed a new machine learning approach to the generic representation problem of internal coordinates (bond lengths, valence angles, and dihedral angles) and how to increase the fidelity of the back-transformation to 3D Cartesian coordinates. The Int2Cart algorithm utilizes a gated recurrent unit neural network to predict real-valued backbone bond lengths and bond angles for each residue of a complete protein sequence given its torsion angle profile. In summary Int2Cart can reconstruct the Cartesian structure of 95% of test proteins with RMSDs that are significant improvements over the fixed backbone bond lengths and bond angles that are the standard practice in a large variety of protein modelling approaches. The success of our algorithm on the more dissimilar CASP-12 prediction targets and across IDP ensembles further validates that the Int2Cart algorithm is transferable among different types of proteins, and can consistently improve the quality of Cartesian structure reconstruction.
In its current form the Int2Cart algorithm only generates backbone structures for the target proteins, although we can improve Cartesian reconstruction performance with the inclusion the torsion and predicting and . Theoretical approaches such as the Monte Carlo Side Chain Ensemble (MC-SCE) approach can utilize the backbone from Int2Cart to calculate side chain ensembles in order to complete the full structure.29 It is also clear that there is still room for improvement in the Cartesian reconstruction of larger proteins, and the inherent scaling of error with respect to sequence length is inevitable for a deep learning model that predicts internal coordinates in a sequential manner (i.e. a GRU model). Therefore, it may be possible to improve the quality of Cartesian structure reconstruction with a distance-based neural network model, i.e., by representing the 3D coordinates of the structure directly.
Nevertheless, the model in its current form already provides a useful computational tool to greatly improve the quality of protein structures reconstructed from backbone torsion angles only, regardless of globular folded proteins or disordered protein ensembles. We envision Int2Cart should see broad use in structure refinement and validation30, 31 and development of protein force fields that could benefit from more accurate valence models of backbone bond lengths and bond angles conditioned on other geometrical or sequence features.32 Finally, the Int2Cart GRU neural network model could also be useful for other chain molecules, only requiring retraining with new data if available for systems such as nucleic acids and lipids.
AUTHOR CONTRIBUTIONS
J.L. and T.H.-G. designed the project. J.L. designed and wrote the Int2Cart software. O.Z. also provided input on the neural network design and tuning of the model and valuable critiques including testing. J.L. and T.H.-G. wrote the paper and all authors provided valuable input and discussion.
ACKNOWLEDGEMENTS
T.H.-G. and J.D.F.-K. acknowledge funding from the National Institute of Health under Grant 5R01GM127627-04. J.D.F.-K. also acknowledges support from the Natural Sciences and Engineering Re-search Council of Canada (2016-06718) and from the Canada Research Chairs Program.
References
- Baker et al. 1999 Jon Baker, Don Kinghorn, and Peter Pulay. Geometry optimization in delocalized internal coordinates: An efficient quadratically scaling algorithm for large molecules. The Journal of Chemical Physics, 110(11):4986–4991, 1999. doi: 10.1063/1.478397. URL https://doi.org/10.1063/1.478397.
- Schwieters and Clore 2001 Charles D. Schwieters and G.Marius Clore. Internal coordinates for molecular dynamics and minimization in structure determination and refinement. Journal of Magnetic Resonance, 152(2):288–302, 2001. ISSN 1090-7807. doi: https://doi.org/10.1006/jmre.2001.2413. URL https://www.sciencedirect.com/science/article/pii/S1090780701924139.
- Adcock and McCammon 2006 Stewart A. Adcock and J. Andrew McCammon. Molecular dynamics: Survey of methods for simulating the activity of proteins. Chemical Reviews, 106(5):1589–1615, 2006. doi: 10.1021/cr040426m. URL https://doi.org/10.1021/cr040426m. PMID: 16683746.
- wwPDB consortium 2018 wwPDB consortium. Protein Data Bank: the single global archive for 3D macromolecular structure data. Nucleic Acids Research, 47(D1):D520–D528, 10 2018. ISSN 0305-1048. doi: 10.1093/nar/gky949. URL https://doi.org/10.1093/nar/gky949.
- Parsons et al. 2005 Jerod Parsons, J Bradley Holmes, J Maurice Rojas, Jerry Tsai, and Charlie EM Strauss. Practical conversion from torsion space to cartesian space for in silico protein synthesis. Journal of computational chemistry, 26(10):1063–1068, 2005.
- Craveur et al. 2013 Pierrick Craveur, Agnel Praveen Joseph, Pierre Poulain, Alexandre G de Brevern, and Joseph Rebehmed. Cis–trans isomerization of omega dihedrals in proteins. Amino acids, 45(2):279–289, 2013.
- Holmes and Tsai 2004 J Bradley Holmes and Jerry Tsai. Some fundamental aspects of building protein structures from fragment libraries. Protein science, 13(6):1636–1650, 2004.
- Ramachandran et al. 1963 G.N. Ramachandran, C. Ramakrishnan, and V. Sasisekharan. Stereochemistry of polypeptide chain configurations. Journal of Molecular Biology, 7(1):95–99, 1963. ISSN 0022-2836. doi: https://doi.org/10.1016/S0022-2836(63)80023-6. URL https://www.sciencedirect.com/science/article/pii/S0022283663800236.
- Shapovalov and Dunbrack Jr 2011 Maxim V Shapovalov and Roland L Dunbrack Jr. A smoothed backbone-dependent rotamer library for proteins derived from adaptive kernel density estimates and regressions. Structure, 19(6):844–858, 2011.
- Karplus 1996 P Andrew Karplus. Experimentally observed conformation-dependent geometry and hidden strain in proteins. Protein Science, 5(7):1406–1420, 1996.
- Jiang et al. 1995 Xiaoqin Jiang, Ming Cao, Brian Teppen, Susan Q Newton, and Lothar Schaefer. Predictions of protein backbone structural parameters from first principles: Systematic comparisons of calculated nc (. alpha.)-c’angles with high-resolution protein crystallographic results. The Journal of Physical Chemistry, 99(26):10521–10525, 1995.
- Scháfer et al. 1995 Lothar Scháfer, Ming Cao, and Mary Jane Meadows. Predictions of protein backbone bond distances and angles from first principles. Biopolymers: Original Research on Biomolecules, 35(6):603–606, 1995.
- Yu et al. 2001 Ching-Hsing Yu, Mya A Norman, Lothar Schäfer, Michael Ramek, Anik Peeters, and Christian Van Alsenoy. Ab initio conformational analysis of n-formyl l-alanine amide including electron correlation. Journal of Molecular Structure, 567:361–374, 2001.
- Berkholz et al. 2009 Donald S Berkholz, Maxim V Shapovalov, Roland L Dunbrack Jr, and P Andrew Karplus. Conformation dependence of backbone geometry in proteins. Structure, 17(10):1316–1325, 2009.
- Improta et al. 2015a Roberto Improta, Luigi Vitagliano, and Luciana Esposito. The determinants of bond angle variability in protein/peptide backbones: A comprehensive statistical/quantum mechanics analysis. Proteins: Structure, Function, and Bioinformatics, 83(11):1973–1986, 2015a.
- Improta et al. 2015b Roberto Improta, Luigi Vitagliano, and Luciana Esposito. Bond distances in polypeptide backbones depend on the local conformation. Acta Crystallographica Section D: Biological Crystallography, 71(6):1272–1283, 2015b.
- Lundgren and Niemi 2012 Martin Lundgren and Antti J Niemi. Correlation between protein secondary structure, backbone bond angles, and side-chain orientations. Physical Review E, 86(2):021904, 2012.
- Ravikumar et al. 2019 Ashraya Ravikumar, Chandrasekharan Ramakrishnan, and Narayanaswamy Srinivasan. Stereochemical assessment of (, ) outliers in protein structures using bond geometry-specific ramachandran steric-maps. Structure, 27(12):1875–1884, 2019.
- King and Koes 2021 J. E. King and D. R. Koes. Sidechainnet: An all-atom protein structure dataset for machine learning. Proteins, 89(11):1489–1496, 2021. ISSN 0887-3585 (Print) 0887-3585. doi: 10.1002/prot.26169.
- AlQuraishi 2019 Mohammed AlQuraishi. Proteinnet: a standardized data set for machine learning of protein structure. BMC Bioinformatics, 20(1):311, 2019. ISSN 1471-2105. doi: 10.1186/s12859-019-2932-0. URL https://doi.org/10.1186/s12859-019-2932-0.
- Mittag et al. 2008 Tanja Mittag, Stephen Orlicky, Wing-Yiu Choy, Xiaojing Tang, Hong Lin, Frank Sicheri, Lewis E. Kay, Mike Tyers, and Julie D. Forman-Kay. Dynamic equilibrium engagement of a polyvalent ligand with a single-site receptor. Proceedings of the National Academy of Sciences, 105(46):17772–17777, 2008. doi: 10.1073/pnas.0809222105. URL https://www.pnas.org/doi/abs/10.1073/pnas.0809222105.
- Gomes et al. 2020 Gregory-Neal W. Gomes, Mickaël Krzeminski, Ashley Namini, Erik W. Martin, Tanja Mittag, Teresa Head-Gordon, Julie D. Forman-Kay, and Claudiu C. Gradinaru. Conformational ensembles of an intrinsically disordered protein consistent with nmr, saxs, and single-molecule fret. Journal of the American Chemical Society, 142(37):15697–15710, 2020. doi: 10.1021/jacs.0c02088. URL https://doi.org/10.1021/jacs.0c02088. PMID: 32840111.
- Cho et al. 2014 Kyunghyun Cho, Bart Van Merriënboer, Dzmitry Bahdanau, and Yoshua Bengio. On the properties of neural machine translation: Encoder-decoder approaches. arXiv preprint arXiv:1409.1259, 2014.
- Glorot et al. 2011 Xavier Glorot, Antoine Bordes, and Yoshua Bengio. Deep sparse rectifier neural networks. In Proceedings of the fourteenth international conference on artificial intelligence and statistics, pages 315–323. JMLR Workshop and Conference Proceedings, 2011.
- Kingma and Ba 2015 Diederik P. Kingma and Jimmy Ba. Adam: A method for stochastic optimization. CoRR, abs/1412.6980, 2015.
- Tan et al. 2016 K. Tan, M. Gu, R. Jedrzejczak, and A. Joachimiak. The crystal structure of the n-terminal domain of a novel cellulases from bacteroides coprocola. PDB, 2016. URL https://www.rcsb.org/structure/5JMB.
- Kabsch and Sander 1983 Wolfgang Kabsch and Christian Sander. Dictionary of protein secondary structure: pattern recognition of hydrogen-bonded and geometrical features. Biopolymers: Original Research on Biomolecules, 22(12):2577–2637, 1983.
- Bhowmick and Head-Gordon 2015a Asmit Bhowmick and Teresa Head-Gordon. A monte carlo method for generating side chain structural ensembles. Structure, 23(1):44–55, 2015a.
- Bhowmick and Head-Gordon 2015b Asmit Bhowmick and Teresa Head-Gordon. A monte carlo method for generating side chain structural ensembles. Structure, 23(1):44–55, 2015b. ISSN 0969-2126. doi: http://dx.doi.org/10.1016/j.str.2014.10.011. URL http://www.sciencedirect.com/science/article/pii/S0969212614003566.
- Wilson et al. 1998 KS Wilson, S Butterworth, Z Dauter, VS Lamzin, M Walsh, S Wodak, J Pontius, J Richelle, A Vaguine, C Sander, et al. Who checks the checkers? four validation tools applied to eight atomic resolution structures. Journal of Molecular Biology, 276(2):417, 1998.
- Kleywegt 2009 Gerard J Kleywegt. On vital aid: the why, what and how of validation. Acta Crystallographica Section D: Biological Crystallography, 65(2):134–139, 2009.
- Conway et al. 2014 Patrick Conway, Michael D Tyka, Frank DiMaio, David E Konerding, and David Baker. Relaxation of backbone bond geometry improves protein energy landscape modeling. Protein Science, 23(1):47–55, 2014.