2022
[1]\fnmMalika Nisal \surRatnayake
1]\orgdivComputational and Collective Intelligence Group, Dept. of Data Science and AI, Faculty of Information Technology, \orgnameMonash University, \orgaddress\streetWellington Road, \cityMelbourne, \postcode3800, \stateVictoria, \countryAustralia
2]\orgdivSchool of Media and Communication, \orgnameRMIT University, \orgaddress\streetLa Trobe Street, \cityMelbourne, \postcode3000, \stateVictoria, \countryAustralia
3]\orgdivDepartment of Physiology, \orgnameMonash University, \orgaddress\streetWellington Road, \cityMelbourne, \postcode3800, \stateVictoria, \countryAustralia
Spatial Monitoring and Insect Behavioural Analysis Using Computer Vision for Precision Pollination
Abstract
Insects are the most important global pollinator of crops and play a key role in maintaining the sustainability of natural ecosystems. Insect pollination monitoring and management are therefore essential for improving crop production and food security. Computer vision facilitated pollinator monitoring can intensify data collection over what is feasible using manual approaches. The new data it generates may provide a detailed understanding of insect distributions and facilitate fine-grained analysis sufficient to predict their pollination efficacy and underpin precision pollination. Current computer vision facilitated insect tracking in complex outdoor environments is restricted in spatial coverage and often constrained to a single insect species. This limits its relevance to agriculture. Therefore, in this article we introduce a novel system to facilitate markerless data capture for insect counting, insect motion tracking, behaviour analysis and pollination prediction across large agricultural areas. Our system is comprised of edge computing multi-point video recording, offline automated multi-species insect counting, tracking and behavioural analysis. We implement and test our system on a commercial berry farm to demonstrate its capabilities. Our system successfully tracked four insect varieties, at nine monitoring stations within polytunnels, obtaining an F-score above 0.8 for each variety. The system enabled calculation of key metrics to assess the relative pollination impact of each insect variety. With this technological advancement, detailed, ongoing data collection for precision pollination becomes achievable. This is important to inform growers and apiarists managing crop pollination, as it allows data-driven decisions to be made to improve food production and food security.
keywords:
deep learning, camera trapping, honeybees, pollination, food security, insect tracking1 Introduction
Pollinators play a key role in world food production and ecosystem management. Three out of four flowering plants (Food & Agriculture Organization of the United Nation, \APACyear2019) and 35% of agricultural land (FAO, \APACyear2018) require some degree of animal pollination. This includes over 87 high-value food crops consumed by humans (Aizen \BOthers., \APACyear2009). The annual market value of pollinator contributions to global food production is estimated to be in the range of billion USD (Potts \BOthers., \APACyear2016).
Recently, climate change and other anthropogenic pressures have been implicated in declines in some pollinator populations (Vanbergen \BBA Initiative, \APACyear2013; Schweiger \BOthers., \APACyear2010), threatening global food security. In many instances, pollinator population size is directly correlated with crop yield (Rollin \BBA Garibaldi, \APACyear2019), although the efficiency of different pollinator populations varies between crops (MacInnis \BBA Forrest, \APACyear2019). Hence, improved understanding and management of pollinator communities is important to boost crop yield (Garibaldi \BOthers., \APACyear2017), and for the long-term viability of many farming projects (Garibaldi \BOthers., \APACyear2020). This need strongly motivates the research presented here to describe the design and implementation of computer vision facilitated spatial monitoring and insect behavioural analysis for precision pollination.
Insect monitoring and sampling can help us to understand different insect species’ roles in crop and other flowering plant pollination. Traditional methods of insect monitoring are straightforward to conduct but are time-consuming and labour intensive. The use of human labour for traditional sampling may unintentionally bias results (Dennis \BOthers., \APACyear2006; Simons \BBA Chabris, \APACyear1999), increase processing lead times, reduce reproducibility, and inhibit or interfere with active pollination monitoring conducted simultaneously in different areas of a site. Furthermore, conventional sampling methods lack functional precision – the capacity to model pollinator movements, motion paths and spatial distributions. This restricts their value as a means to understand how insect behaviour effects pollination. Automated and detailed pollination monitoring techniques with high functional precision are needed that allow continuous assessment of pollination levels. Mechanised efforts to count insects have been attempted and improved over the last century, although it is only with improved technology and Artificial Intelligence that individual recognition in complex environments has started to emerge as a realistic proposition (Odemer, \APACyear2022). In turn, this will facilitate the efficient management of pollinator resources as agriculture increasingly embraces data-driven, AI-enhanced technology (Howard \BOthers., \APACyear2021; Abdel-Raziq \BOthers., \APACyear2021; Breeze \BOthers., \APACyear2021).
Improvement in sensor technology has enabled the use of inexpensive Internet of Things (IoT) devices, such as cameras and miniature insect-mounted sensors, for pollination monitoring. Insect-mounted sensors allow movement tracking of tagged insects over large areas (Abdel-Raziq \BOthers., \APACyear2021). However, the technique is unsuitable for agriculture since tagging is laborious, it may increase insect stress or alter behaviour (Batsleer \BOthers., \APACyear2020), and it is simply impractical on a large enough scale to be relevant in this context. Camera-based pollination monitoring can overcome these drawbacks by tracking untagged insects using computer vision and deep learning (Howard \BOthers., \APACyear2021; Ratnayake \BOthers., \APACyear2021\APACexlab\BCnt1).
In this research, we introduce a novel computer vision system to facilitate pollination monitoring for large-scale agriculture. Our system is comprised of edge computing multi-point remote capture of unmarked insect video footage, automated offline multi-species motion tracking, as well as insect counting and behavioural analysis. We implemented and tested our methods on a commercial berry farm to (i) track individual movements of multiple varieties of unmarked insect, (ii) count insects, (iii) monitor their flower visitation behaviour, and (iv) analyse contributions of different species to pollination. Along with this article we publish the monitoring software, a dataset of over 2000 insect tracks of four insect classes, and an annotated dataset of images from the four classes. We believe that these will serve as a benchmark for future research in precision pollination, a new and important area of precision agriculture.
The remainder of the paper is organised as follows. In Section 2 we present a brief overview of related work concerning computer vision for insect tracking in the wild. Section 3 presents our new methods and their implementation. In section 4 we describe experiments to evaluate the performance of our approach and present the results of a pollination analysis to demonstrate our methods’ application. In Section 5 we discuss the strengths and limitations of our approach and suggest future work. Section 6 concludes the paper.
2 Related Work
Recently there has been an increase in the use of computer vision and deep learning in agriculture (Kamilaris \BBA Prenafeta-Boldú, \APACyear2018; Odemer, \APACyear2022). This has been prominent in land cover classification (Lu \BOthers., \APACyear2017), fruit counting (Afonso \BOthers., \APACyear2020), yield estimation (Koirala \BOthers., \APACyear2019), weed detection (Su \BOthers., \APACyear2021), beneficial and insect pest monitoring (Amarathunga \BOthers., \APACyear2021), and insect tracking and behavioural analysis (Høye \BOthers., \APACyear2021). Applications of insect tracking and behavioural analysis algorithms are usually confined to controlled environments such as laboratories (Branson \BOthers., \APACyear2009; Pérez-Escudero \BOthers., \APACyear2014; Walter \BBA Couzin, \APACyear2021; Haalck \BOthers., \APACyear2020), and semi-controlled environments such as at beehive entrances (Campbell \BOthers., \APACyear2008; Magnier \BOthers., \APACyear2019; Yang \BOthers., \APACyear2018). In these situations, image backgrounds and illumination under which insects are tracked vary only a little, simplifying automated detection and tracking tasks. Pollination monitoring of crops however, may require tracking unmarked insects outdoors in uncontrolled environments subjected to vegetation movement caused by the wind, frequent illumination shifts, and movements of tracked and non-target animals. These environmental changes, combined with the complexity of insect movement under such variable conditions, increases the difficulty of the tracking problem. Recent studies attempted to address these issues through in-situ insect monitoring algorithms (Bjerge, Mann\BCBL \BBA Høye, \APACyear2021; Bjerge, Nielsen\BCBL \BOthers., \APACyear2021), but were limited in the spatiotemporal resolution required for efficient pollination monitoring.
To overcome the difficulties listed above, we previously presented a Hybrid Detection and Tracking (HyDaT) algorithm (Ratnayake \BOthers., \APACyear2021\APACexlab\BCnt2) and a Polytrack algorithm (Ratnayake \BOthers., \APACyear2021\APACexlab\BCnt1) to track multiple unmarked insects in uncontrolled conditions. The HyDaT algorithm uses a hybrid detection model consisting of a deep learning-based object detection model (YOLOv2 (Redmon \BBA Farhadi, \APACyear2017)) and a foreground/background segmentation-based detection model (K-nearest neighbours (Zivkovic \BBA Van Der Heijden, \APACyear2006)) to track individual insects. In HyDaT, the deep learning object detection is used to detect insects at their first appearance in the frame. The foreground/background segmentation is used to detect insects’ position in subsequent frames, provided that there are no multiple detections in the foreground. If the environment is too dynamic and the foreground/background segmentation cannot accurately identify the position of the insect, the deep learning model is used for the detection. This enables tracking unmarked and free-flying insects amidst the changes in the environment. The Polytrack algorithm (Ratnayake \BOthers., \APACyear2021\APACexlab\BCnt1) extended methods in HyDaT to track multiple insects simultaneously. In addition, Polytrack includes a low resolution mode to improve its video processing speed.
Although previous algorithms enable tracking unmarked and free-flying insects amidst the changes in the environment, they are limited to one species and one study location at a time. To gain a sophisticated understanding of agricultural pollination, these constraints are limiting since analysis of the behaviour of multiple insect species that contribute simultaneously, in multiple locations, to overall pollination levels or deficiencies is important (Garibaldi \BOthers., \APACyear2020; Rader \BOthers., \APACyear2016). Currently there is no computer vision facilitated system, or any other practical system, capable of achieving this goal. In addition, no previous method can identify and classify insect pollination behaviour across large-scale industrial agricultural areas at a level of detail that permits sub-site-specific interventions to increase farm yield via improved pollination.
3 Methods and Implementation
In this section, we explain the methods and implementation of our insect and pollination monitoring system. An overview of the proposed methodology is shown in Fig. 1.
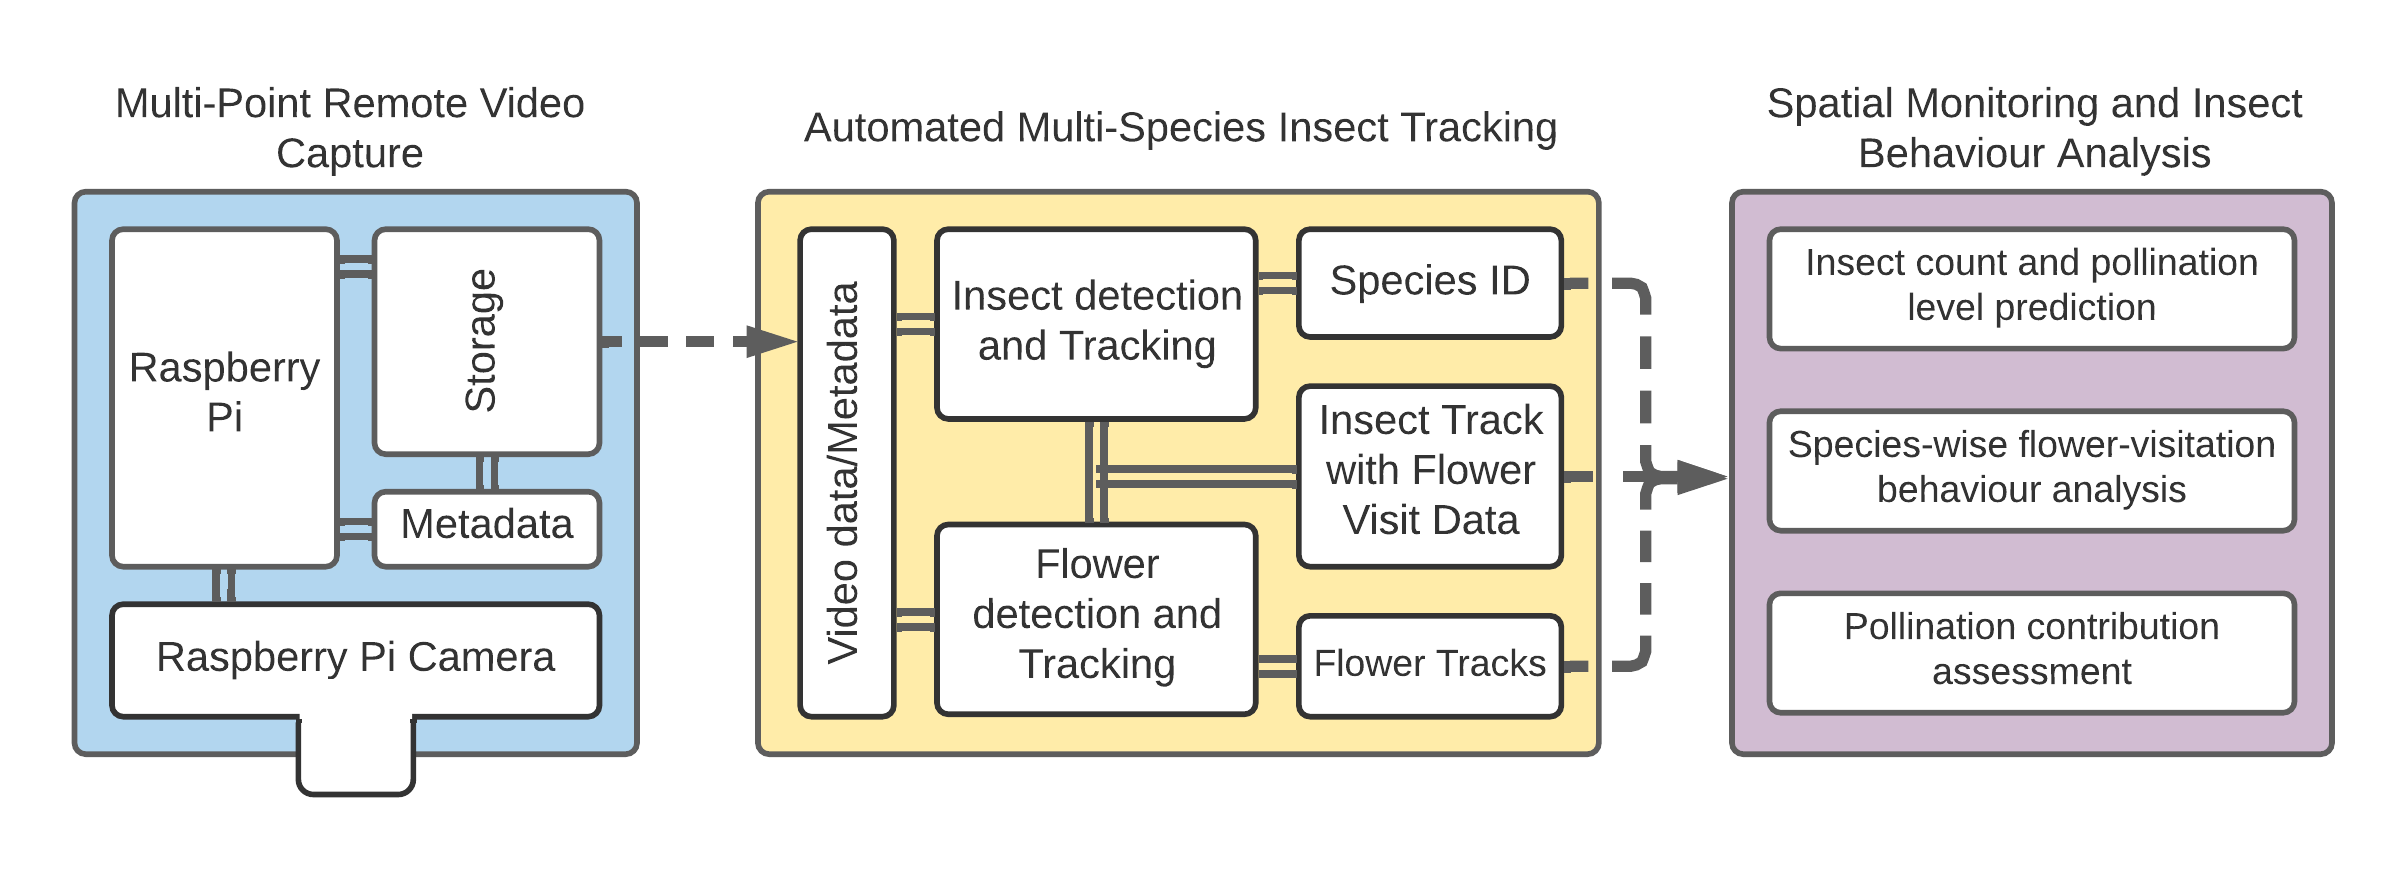
3.1 Multi-point remote video capture
Video footage of freely foraging, unmarked insects required for insect tracking and behavioural analysis was collected using edge computing-based remote camera trap devices built on the Raspberry Pi single board computer. We used a Raspberry Pi 4 and Raspberry Pi camera v2 (Sony IMX219 8-megapixel sensor) because it is widely available, customisable, there’s a wide range of plug-in sensors, and it is sufficiently low-cost for replication across a large area (Jolles, \APACyear2021). Videos are recorded at resolution at , which is the maximum possible frame-rate for resolution on our devices. The system is powered using a battery bank. However, we do not process videos to track pollinators in situ since the Raspberry Pi is currently incapable of processing high quality videos in real-time, and our key goals required detection of insects. Reducing the video resolution or the capture frame-rate to compensate for the lack of speed of the device is not currently feasible within the limitations imposed by pollinator insect speed and size. Video recording units were distributed across nine data collection points in an experimental site (section 3.4 below) and were programmed to continuously record sets of footage clips of 10 minutes duration. The caption of each video clip contained metadata on camera location, recording date and recording time. (Refer to code availability for the software used in the video recording unit.)
3.2 Automated multi-species insect tracking
We processed the videos captured remotely using an offline automated video processing algorithm. Since food crops are usually grown in uncontrolled or semi-controlled environments subject to changes in illumination and foliage movement caused by wind and/or insect and human activity, robust tracking of insects and flowers is essential for accurate pollination and insect behavioural analysis. Here, we build on methods presented in HyDaT (Ratnayake \BOthers., \APACyear2021\APACexlab\BCnt2) and Polytrack (Ratnayake \BOthers., \APACyear2021\APACexlab\BCnt1) algorithms to develop an automated algorithm to track multiple insect varieties simultaneously and detail their interactions with flowers. Our algorithm uses a hybrid detection model (adopted from HyDaT (Ratnayake \BOthers., \APACyear2021\APACexlab\BCnt2)) consisting of a YOLOv4 (Bochkovskiy \BOthers., \APACyear2020) deep learning-based object detection model and a K-nearest neighbours (Zivkovic \BBA Van Der Heijden, \APACyear2006) foreground/background segmentation model to detect and identify insects in videos. Detected insect positions are formed into a coherent trajectory using the methods proposed in Polytrack (Ratnayake \BOthers., \APACyear2021\APACexlab\BCnt1). This includes a low-resolution processing mode that rapidly processes videos when no insects are being tracked. In addition, we introduce two novel algorithms to track flowers and identify insect-flower interactions that enable insect behaviour analysis. In the following sections we present the technical details of our methods.
At the start of processing each video sequence, our algorithm extracts the time and location at which the video was captured from the sequence’s embedded metadata. Next, the video is processed to track movement of insects and their interactions with flowers. Pilot research revealed that the position of each respective flower being recorded varies throughout a day due to wind and farm management activities, and flowers may physically move termed heliotropism in some cases to track sunlight (Kevan, \APACyear1975; van der Kooi \BOthers., \APACyear2019). Therefore, it is essential to track flower position within the frame to reliably identify insect-flower interactions. The positions of all visible flowers are detected and recorded at the start of a video sequence using the deep learning-based object detector in the hybrid detection model. The deep learning model was preferred for the flower detection over a segmentation model as it can be extended to detect and identify different types of flowers in the frame. Flower positions are updated in predefined user-specified intervals. In the current implementation an update interval of 100 seconds is used. A “predict and detect” approach is used to track flower movement. The predicted next position of each flower is initially identical to its current position, since the magnitude of flower movement within a short interval (e.g., ) is assumed to be small. We then used the Hungarian algorithm (Kuhn, \APACyear1955) to associate the predicted position of each flower to a flower detection in order to form a continuous flower movement track. If a flower being tracked is undetected in a given frame, the last detected position is carried forward. If a detected flower cannot be assigned to any predictions it is considered to be a new flower. At the end of a video sequence, the final positions of flowers and their respective tracks of interacting insects are saved for later pollination analysis and visualisation.
When an insect first enters the video frame, the deep learning-based object detector of the hybrid detection model detects its position and identifies its species. In addition, it saves a snapshot of the insect for (optional human) visual verification. After detection and identification of an insect, it is tracked through subsequent frames using the methods presented in the Polytrack algorithm (Ratnayake \BOthers., \APACyear2021\APACexlab\BCnt1). In each frame after the first detection of an insect, its position is compared with the position of recorded flowers to identify flower visits. If an insect is detected inside the radius of a flower for more than 5 consecutive frames (at 30 fps this ensures it is not flying over the flower at typical foraging flight speeds (Spaethe \BOthers., \APACyear2001)), the spatial overlap is stored as a flower visit. The radius of a flower is computed to include its dorsal area and an external boundary threshold. This threshold is incorporated as some insects station themselves outside of a flower while accessing nectar or pollen. Repeat visits to a flower that occur after an intermediate visit to another flower are recorded as flower re-visits. When an insect exits the video frame, the corresponding track is analysed to identify whether it originated from a false positive detection made by the deep learning model. If a track has not visited flowers and the length is less than a predefined threshold value (10 pixels minimum radius of a flower), it is considered a false positive. After the verification, a file with data on camera location, time of capture and insect trajectories with flower visitation information is saved for behavioural analysis. The software and recommended tracking parameter values are available with the source code.
3.3 Insect behaviour analysis
We analysed insect flower visiting behaviour using the extracted movement trajectories to infer likely pollination events. This is appropriate since flowers have evolved structures that enable visiting insects to conduct pollen dispersal and transfer between floral reproductive organs for fertilisation of ovules by pollen (Real, \APACyear2012). Metrics used to analyse flower visitation behaviour and pollination are presented below.
Let and be the set of insects belonging to different species (or varieties at any taxonomic level) and the set of flowers in the experimental environment respectively. Here, denotes the subset of insects in that belong to the species type, and is the insect in . Here, if an insect exits a video frame (i.e., it flies out of the camera view or under vegetation) and later reappears, it will be counted as a new insect. is the cardinality of a given set – e.g., is the number of species types, is the number of insects belonging to the species.
-
•
The number of flowers visited by an insect species is defined as , where is the number of times insect of species visited flower .
(1) -
•
Total number of visits to a flower from species is defined as .
(2) -
•
Total number of visits to a flower is defined as .
(3) -
•
Number of flowers fertilised with visits from species is defined as , where is the number of visits required to fully fertilise a flower.
(4) -
•
Total number of fertilised flowers in a location defined as .
(5)
3.4 Implementation
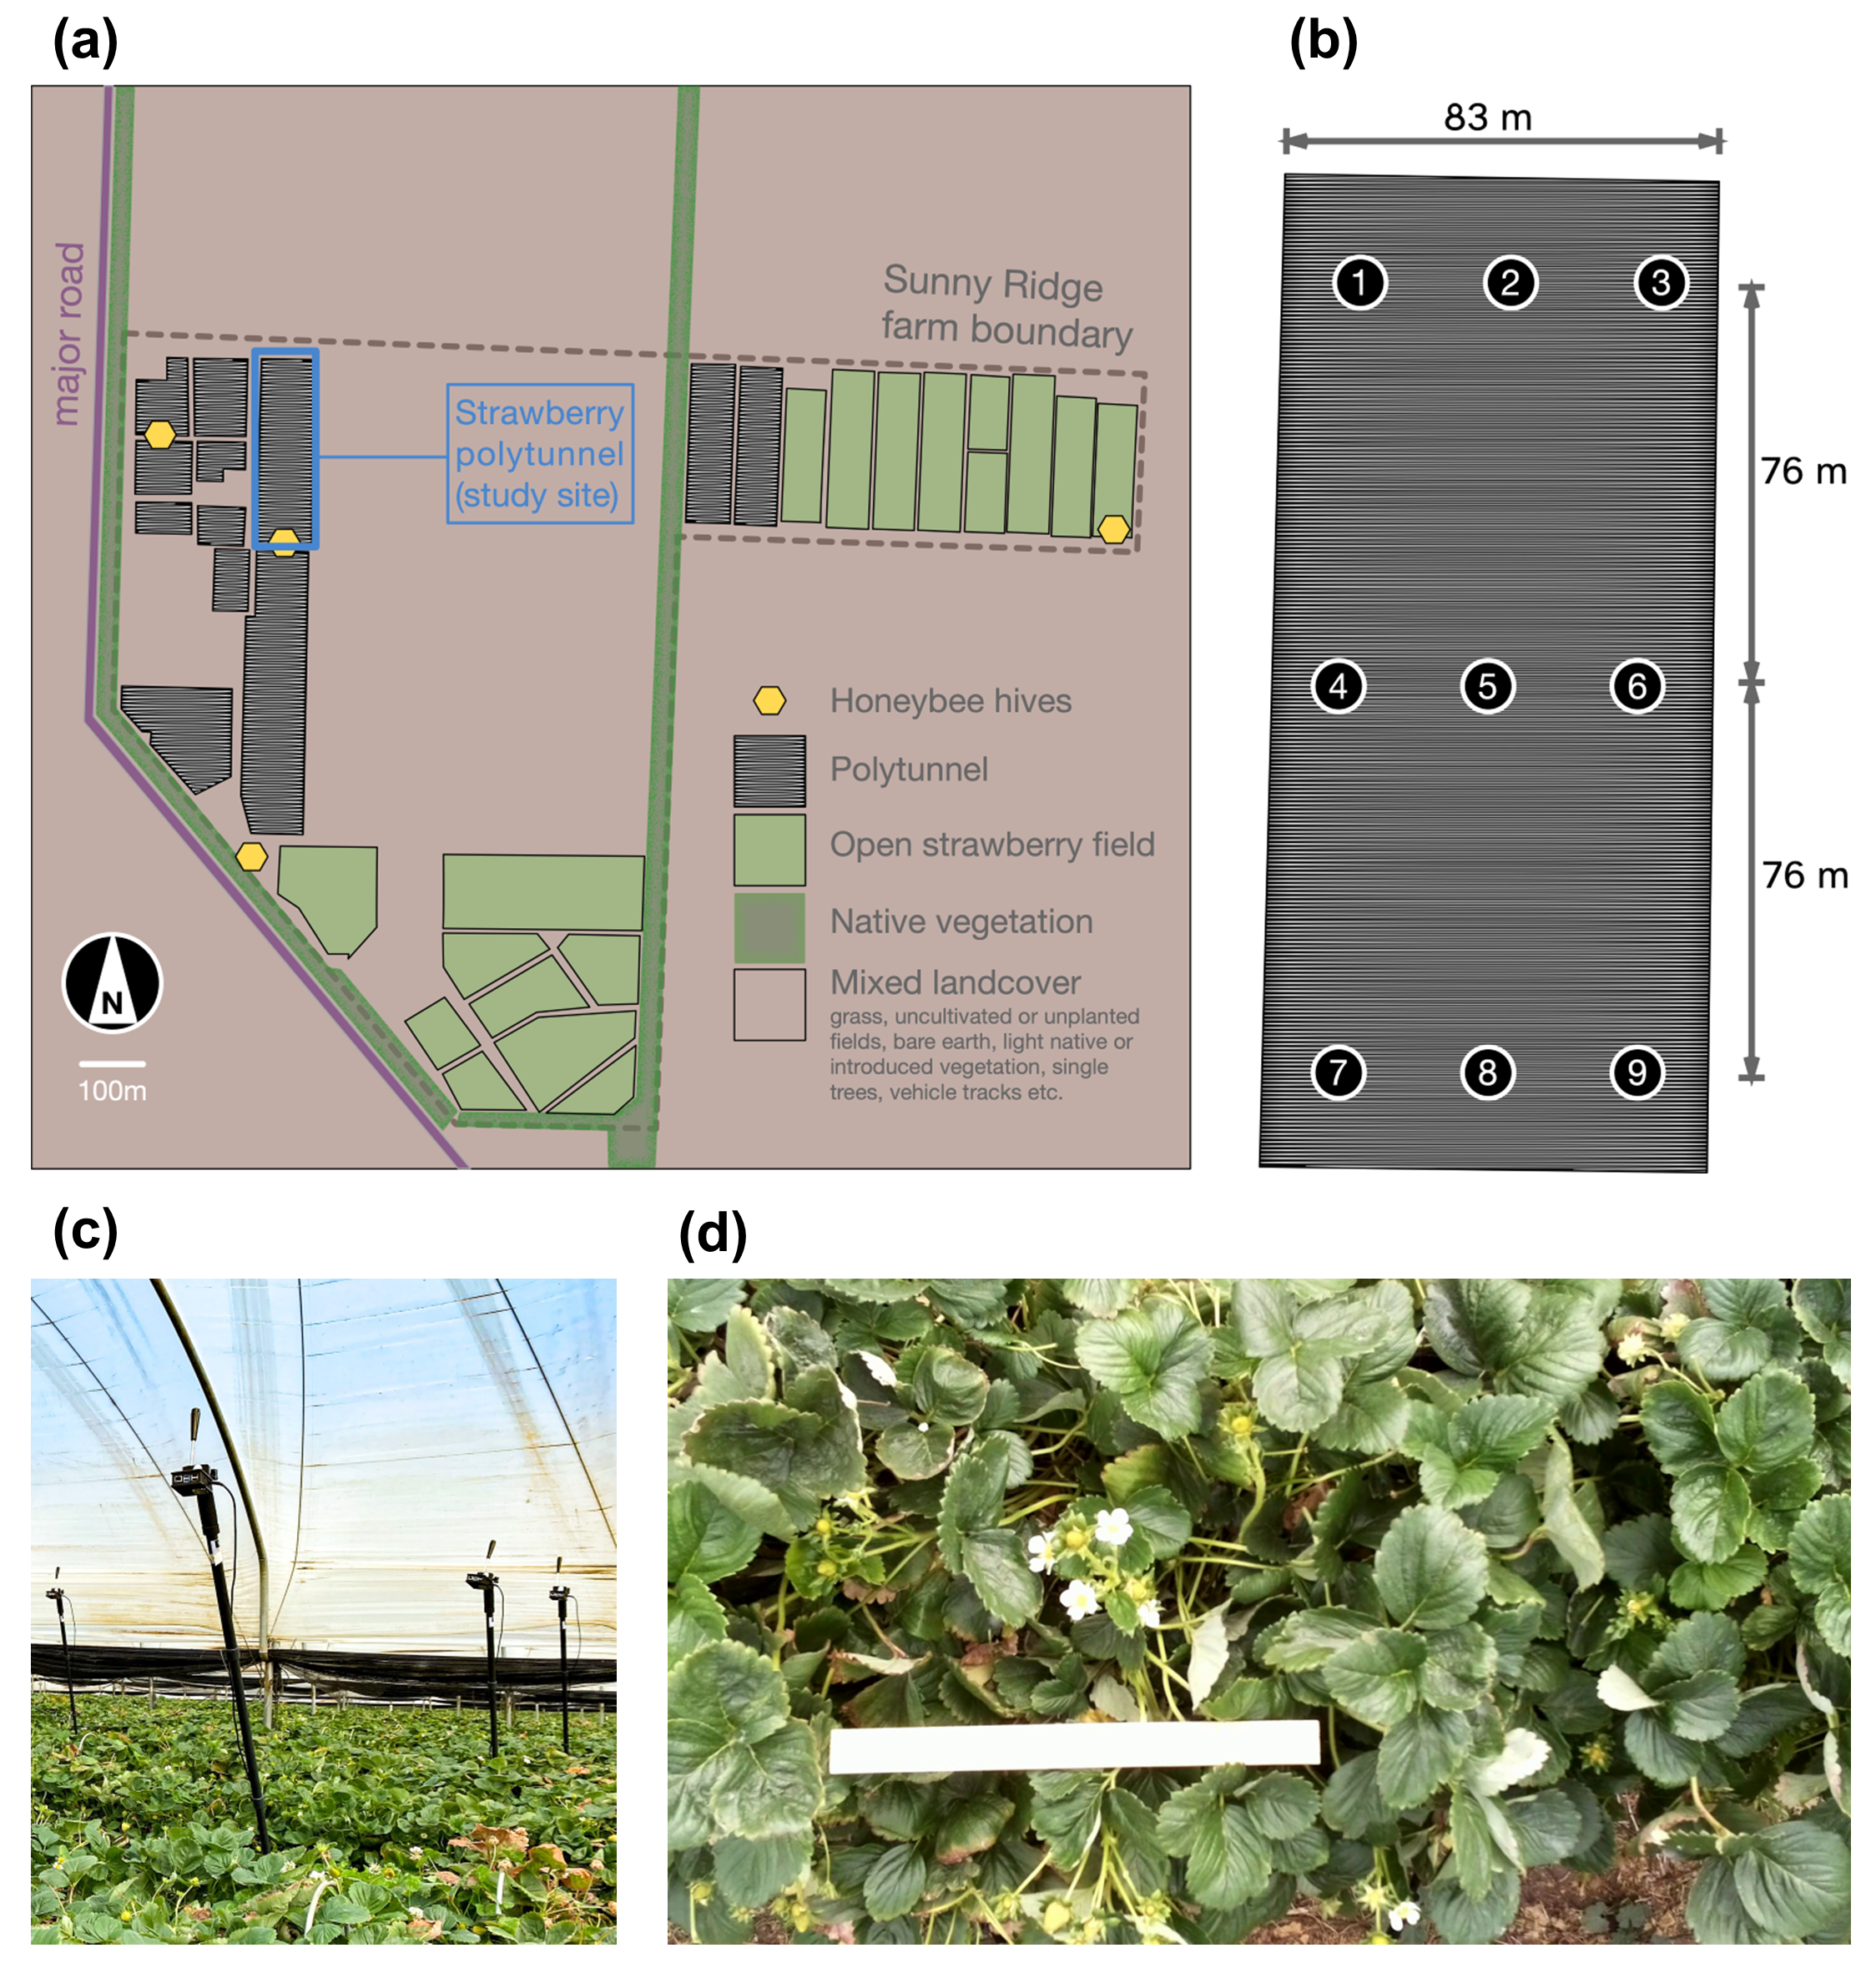
We implemented the proposed spatial monitoring and insect behavioural analysis system on the commercial Sunny Ridge farm in Boneo, Victoria, Australia (, ) (Fig. 2a). Sunny Ridge grows strawberries in polytunnels covered with translucent LDPE diffusing plastic and in open fields. We installed remote video recording units over nine data collection points in strawberry polytunnels (Fig. 2 b) and manually adjusted camera lenses to focus on strawberry flowers. These data collection points were selected to cover the edges and central regions of the polytunnels because previous studies indicated that edge effects might impact insect movement, foraging behaviour and numbers within polytunnels (Hall \BOthers., \APACyear2020; Howard \BOthers., \APACyear2021). Videos were recorded for a period of 6 days (between - March 2021) from to ( hours) to coincide with the key pollination period. The video frames covered an area of which is the width of a planted strawberry row at the site (Fig. 2d).
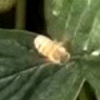
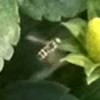
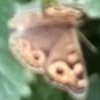
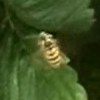
The strawberry farm uses honeybees as managed pollinators but farm management staff had also observed other insects visiting crop flowers. We monitored the behaviour of four key insect types, honeybees (Apis mellifera), Syrphidae (hover flies), Lepidoptera (moths and butterflies), and Vespidae (wasps) that actively forage on the farm (Fig. 3). Moths and butterflies were treated as a single insect pollinator class (Lepidoptera) for pollination analysis because of their relatively low numbers.
3.4.1 Training the deep learning model
The automated video processing system employs a deep learning model YOLOv4 to detect insects and flowers. We created a custom dataset of 3073 images divided into four classes: (i) honeybees/Vespidae (2231/371 instances), (ii) Syrphidae (204 instances), (iii) Lepidoptera (93 instances), and (iv) strawberry flowers (14050 instances). Honeybees and Vespidae were included in a single Hymenopteran class due to their physical similarities and the difficulty of automatically distinguishing between them using the low-quality video footage extracted from the basic cameras (discussed further below). The prepared dataset was manually annotated with bounding boxes using the Computer Vision Annotation Tool (Sekachev \BOthers., \APACyear2019). When annotating small insects such as Syrphidae, videos associated with annotation images were carefully referenced to minimise the possibility of false negative annotations. The YOLOv4 model was then trained on this dataset using TensorFlow (Abadi \BOthers., \APACyear2016) with a learning rate of 0.001. The pretrained YOLOv4 model and its evaluation data are available with the software code.
3.4.2 Processing videos
We processed all recorded videos to extract insect tracks and insect-flower visiting behaviour using the methods described in Section 3.2. Videos were processed on the MASSIVE high performance computing infrastructure (Goscinski \BOthers., \APACyear2014) with Intel Xeon Gold 6150 (2.70 GHz) CPU, 55 GB RAM, NVIDIA Tesla P4 GPU and CentOS Linux (7).
3.4.3 Insect trajectory dataset preparation
We post-processed insect tracks extracted from the videos to correct insect type identifications. Insect type identification was performed on multiple still frames of each insect assigned to a motion track. A further step was appended to this process to manually classify Hymenoptera into two separate classes, honeybees and Vespidae. As reported above, these insects were initially treated as a single class in training the deep learning model due to the difficulty of clearly resolving morphological differences between them in flight at low video resolution and 30 fps. If the insect type could not be confidently identified through still images, the insect was classified based on its movement behaviour after observing the videos (e.g. if the insect visited flowers, it was identified as a honeybee as opposed to a Vespidae since relevant Vespids are considered in study conditions to be predatory insects (Spencer \BOthers., \APACyear2020)). Trajectories that originated through detections that do not correspond to insects were identified as false positives and removed during this process.
4 Results
4.1 Experimental evaluation
We evaluated the performance of our system for extracting the trajectory and flower visitation behaviour of four insect types (Fig. 3). Experiments were conducted using a test dataset of frames/ minutes at 30 frames per second (comprised of 10 sequential videos of 10 minutes each). These videos were randomly selected from the set of recordings unused in deep learning model training and captured from different polytunnel locations (Test video dataset is accessible from Data Availability).
We measured the detection accuracy of our algorithm by calculating precision (Equation 6), recall (Equation 7), and (Equation 8) metrics (Barreiros \BOthers., \APACyear2021) for tracked insects and flowers.
| (6) |
| (7) |
| (8) |
where, is the total number of correctly detected insect positions in a track. A detection was considered correct if the algorithm recorded the position of an insect in an area that was in fact covered by the body of the insect. is the total number of undetected insect positions and is the total number of incorrectly detected insect positions in a track.
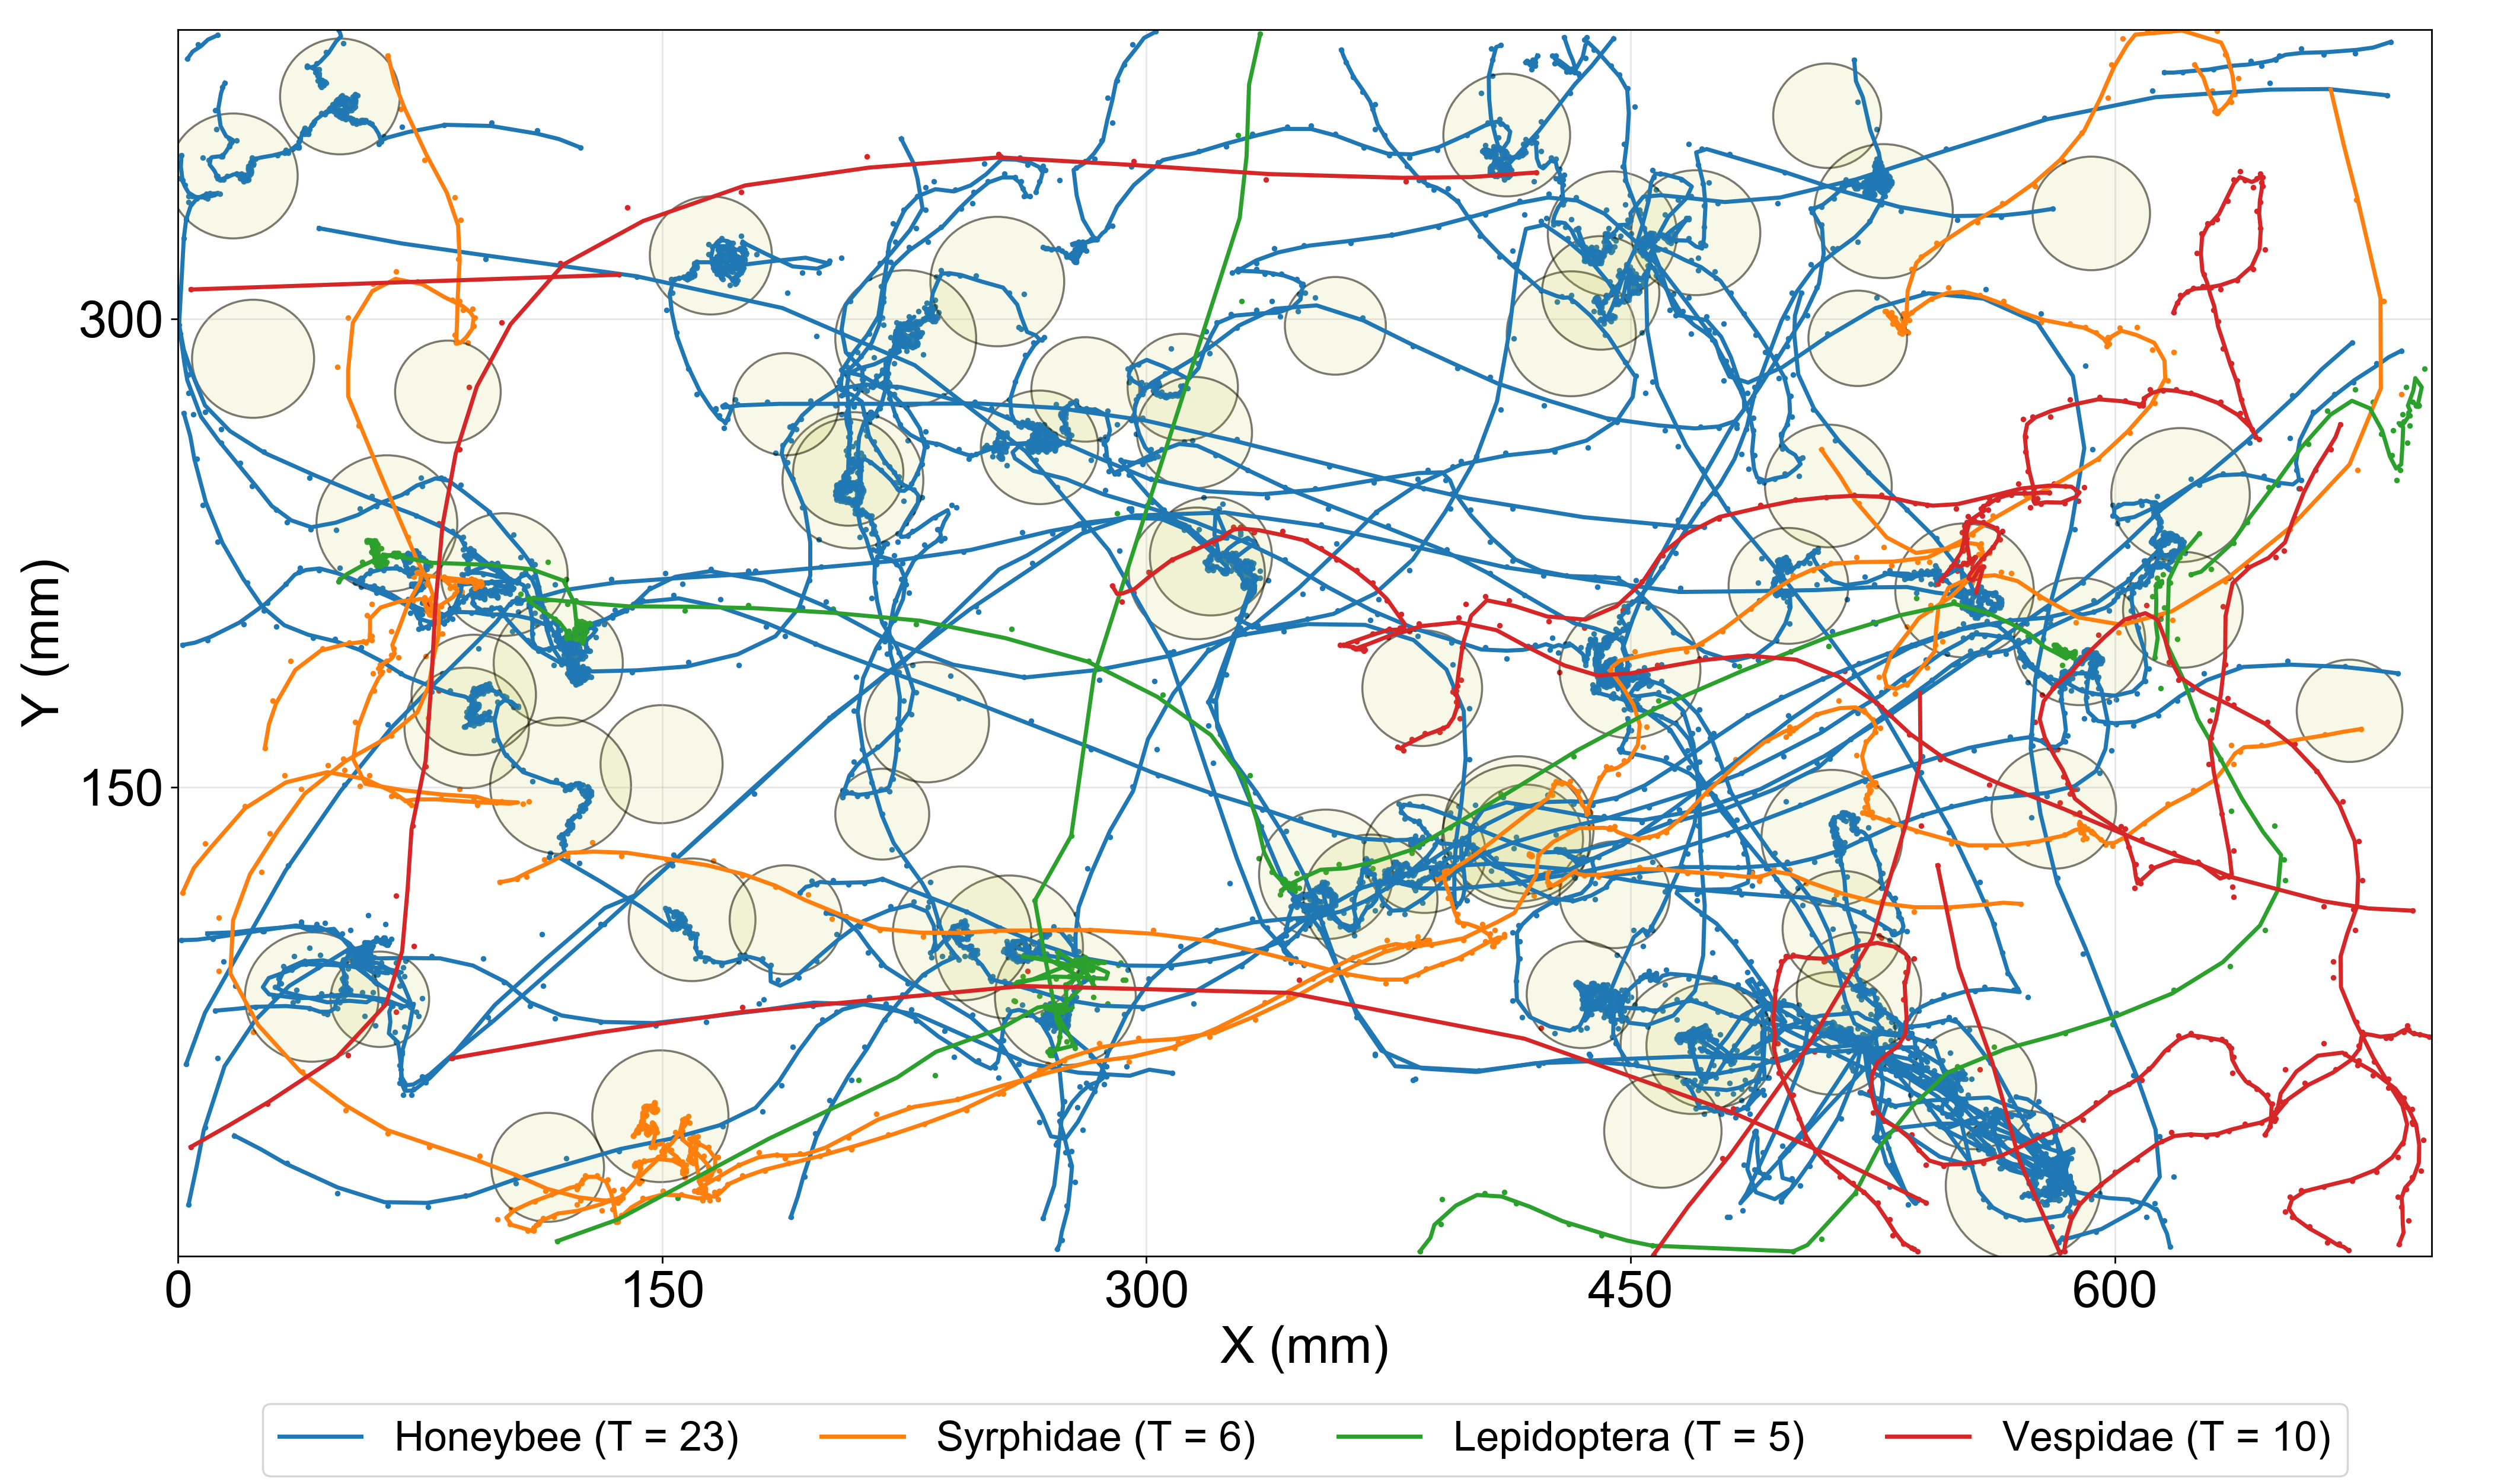
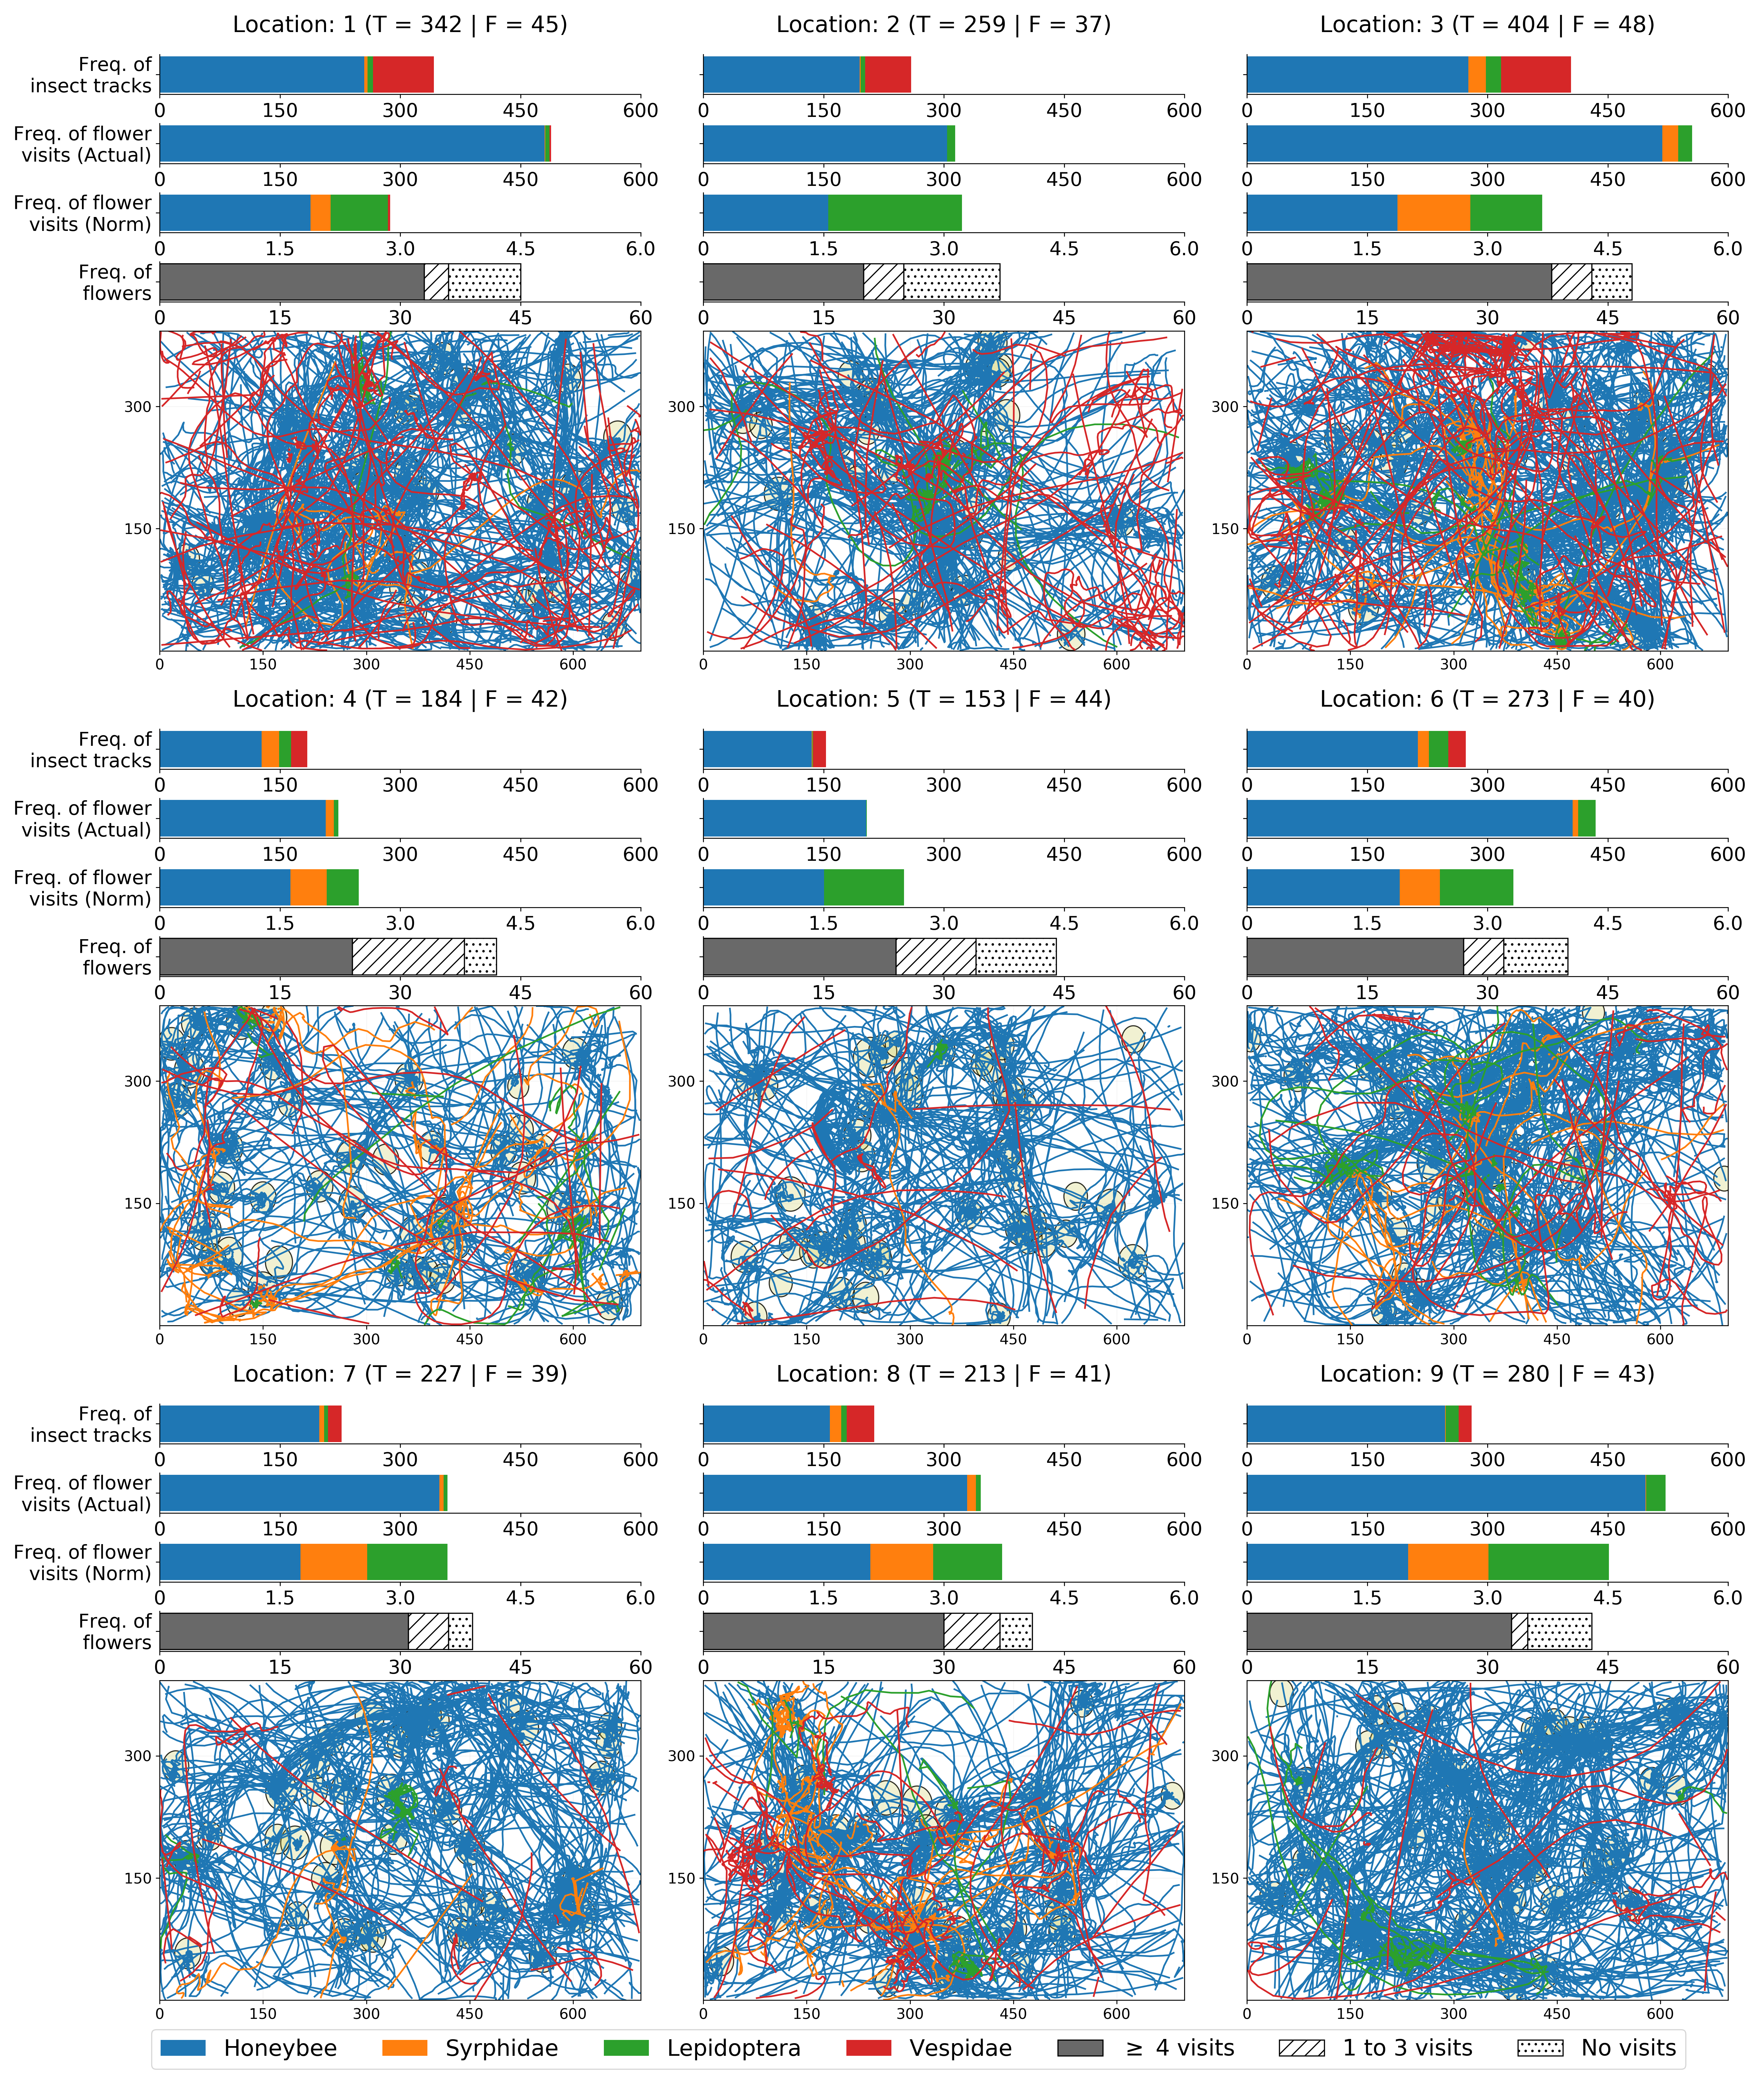
The tracks and flower visits reported by our system were compared against human observations made from the videos for validation as we found no other existing monitoring system against which to compare our software. Test videos were observed by playing them on VLC media player at speed to record insects and flowers. When an insect appeared in the frame, the video was analysed frame by frame to record its flower visits. An insect landing on the dorsal side of a flower was counted as a flower visitor. Insects that appeared inside the frame of the video for less than 5 frames were ignored since at 30 fps this time is too brief to be likely to have any biological impact on pollination. If an insect departed the frame and later reappeared, or if it flew under the foliage and later reappeared, it was considered as a “new” insect. Experimental results related to insect and flower detection are shown in Table 1 and results on flower-visit detection are presented in Table 2. Fig. 4 shows the trajectories of insects recorded in test videos. A detailed description of experimental results is available in Supplementary Information.
| Insect/ Flower | No. of Obs. | Visible Frames | Trackletts Generated | Track Evaluation | Evaluation Metrics | |||||
| TP | FN | FP | IS | Precision | Recall | F-score | ||||
| Honeybee | 20 | 16846 | 23 | 20 | 0 | 0 | 3 | 0.99 | 0.92 | 0.95 |
| Syrphidae | 6 | 3436 | 6 | 5 | 1 | 0 | 1 | 1.00 | 0.71 | 0.81 |
| Lepidoptera | 4 | 3158 | 5 | 3 | 1 | 0 | 2 | 0.99 | 0.71 | 0.81 |
| Vespidae | 10 | 589 | 10 | 10 | 0 | 0 | 0 | 1.00 | 0.73 | 0.83 |
| Flower∗ | 72 | 179306 | 68 | 68 | 4 | 0 | 0 | 1.00 | 1.00 | 1.00 |
-
•
∗ Flower positions were detected and recorded at 100 second (= 3000 frame) intervals.
| Insect Type | Observed Visits | Visit Detection Evaluation | ||
|---|---|---|---|---|
| TP | FP | FN | ||
| Honeybee | 67 | 65 | 0 | |
| Syrphidae | 5 | 4 | 1 | 1 |
| Lepidoptera | 6 | 6 | 1 | 0 |
| Vespidae | 0 | 0 | 0 | 0 |
-
Resulted from undetected flower(s).
In our test videos, the proposed algorithm tracked honeybees with a precision of 0.99, a recall of 0.92 and an F-score of 0.95. The insect behavioural analysis component of the algorithm accurately detected of honeybee-flower interactions, and of flower interactions were not recorded due to undetected flowers. Test videos comprised six appearances of Syrphidae and the algorithm accurately detected five of them resulting in a detection rate of . The algorithm tracked Syrphidae with high precision (1.00), but the recall rate of 0.71 and F-score of 0.81 were lower than that of honeybees. These lower values were due to the frames where the insect was undetected (see Discussion). Tracking metrics related to Lepidoptera were similar to that of Syrphidae, where the algorithm detected and tracked of Lepidopterans with precision, recall and F-score values of 0.99, 0.71 and 0.81 respectively. It also recorded all Lepidopteran flower interactions. The algorithm detected and tracked all Vespidae present in test videos with a precision rate of . However, the recall rate and the F-score were and , respectively. This was because the video frame rate was too low to track some high-speed Vespidae movements. The proposed algorithm recorded identity swaps (multiple tracks generated by the same insect) for honeybees, Syrphidae and Lepidoptera. The study results did not contain false positive tracks for any insect type, as the algorithm accurately identified and discarded tracks that originated from false positive insect detections. The values of the detection evaluation metrics for flowers were high as there was little or no movement of flowers apparent within test videos.
4.2 Insect behavioural analysis for precision pollination
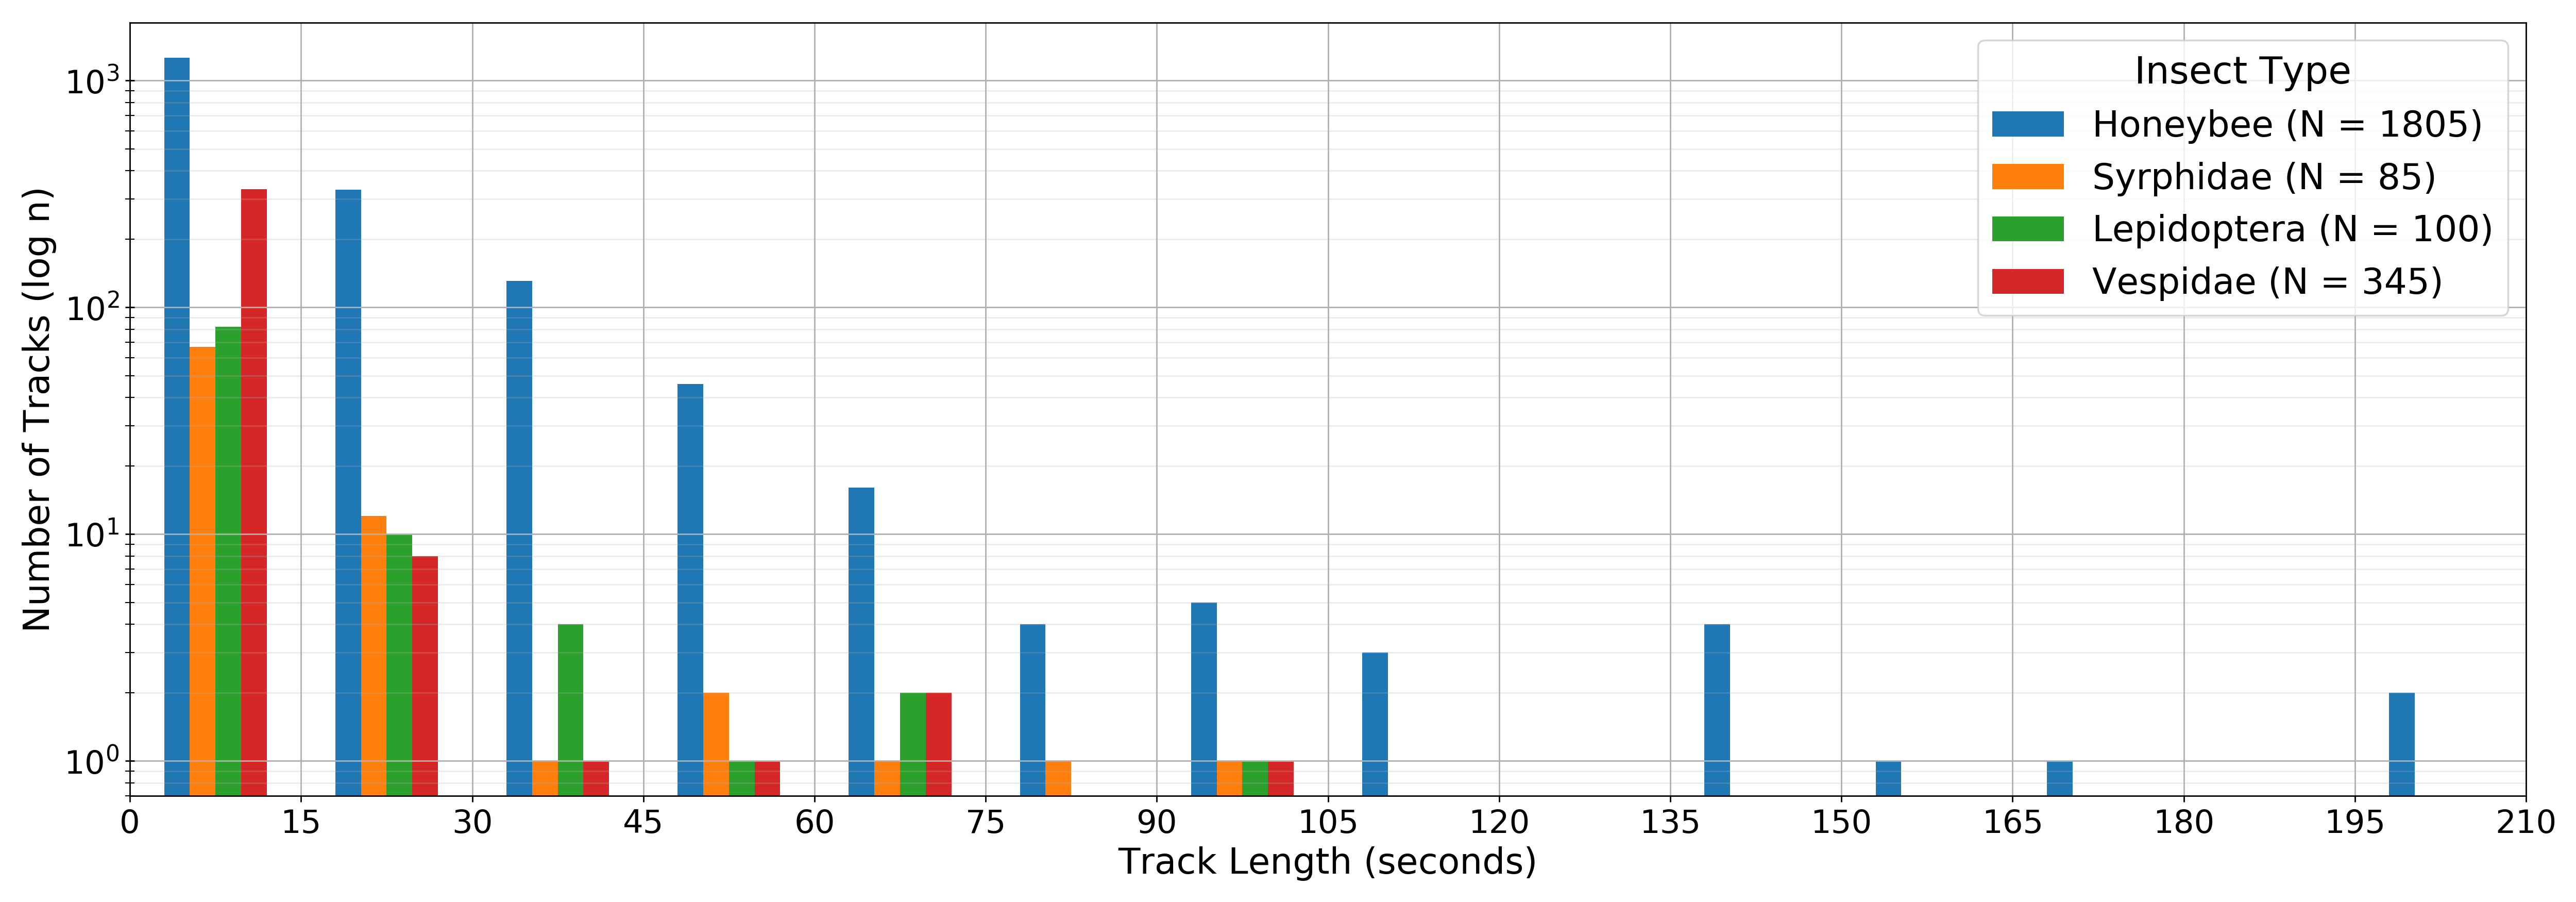
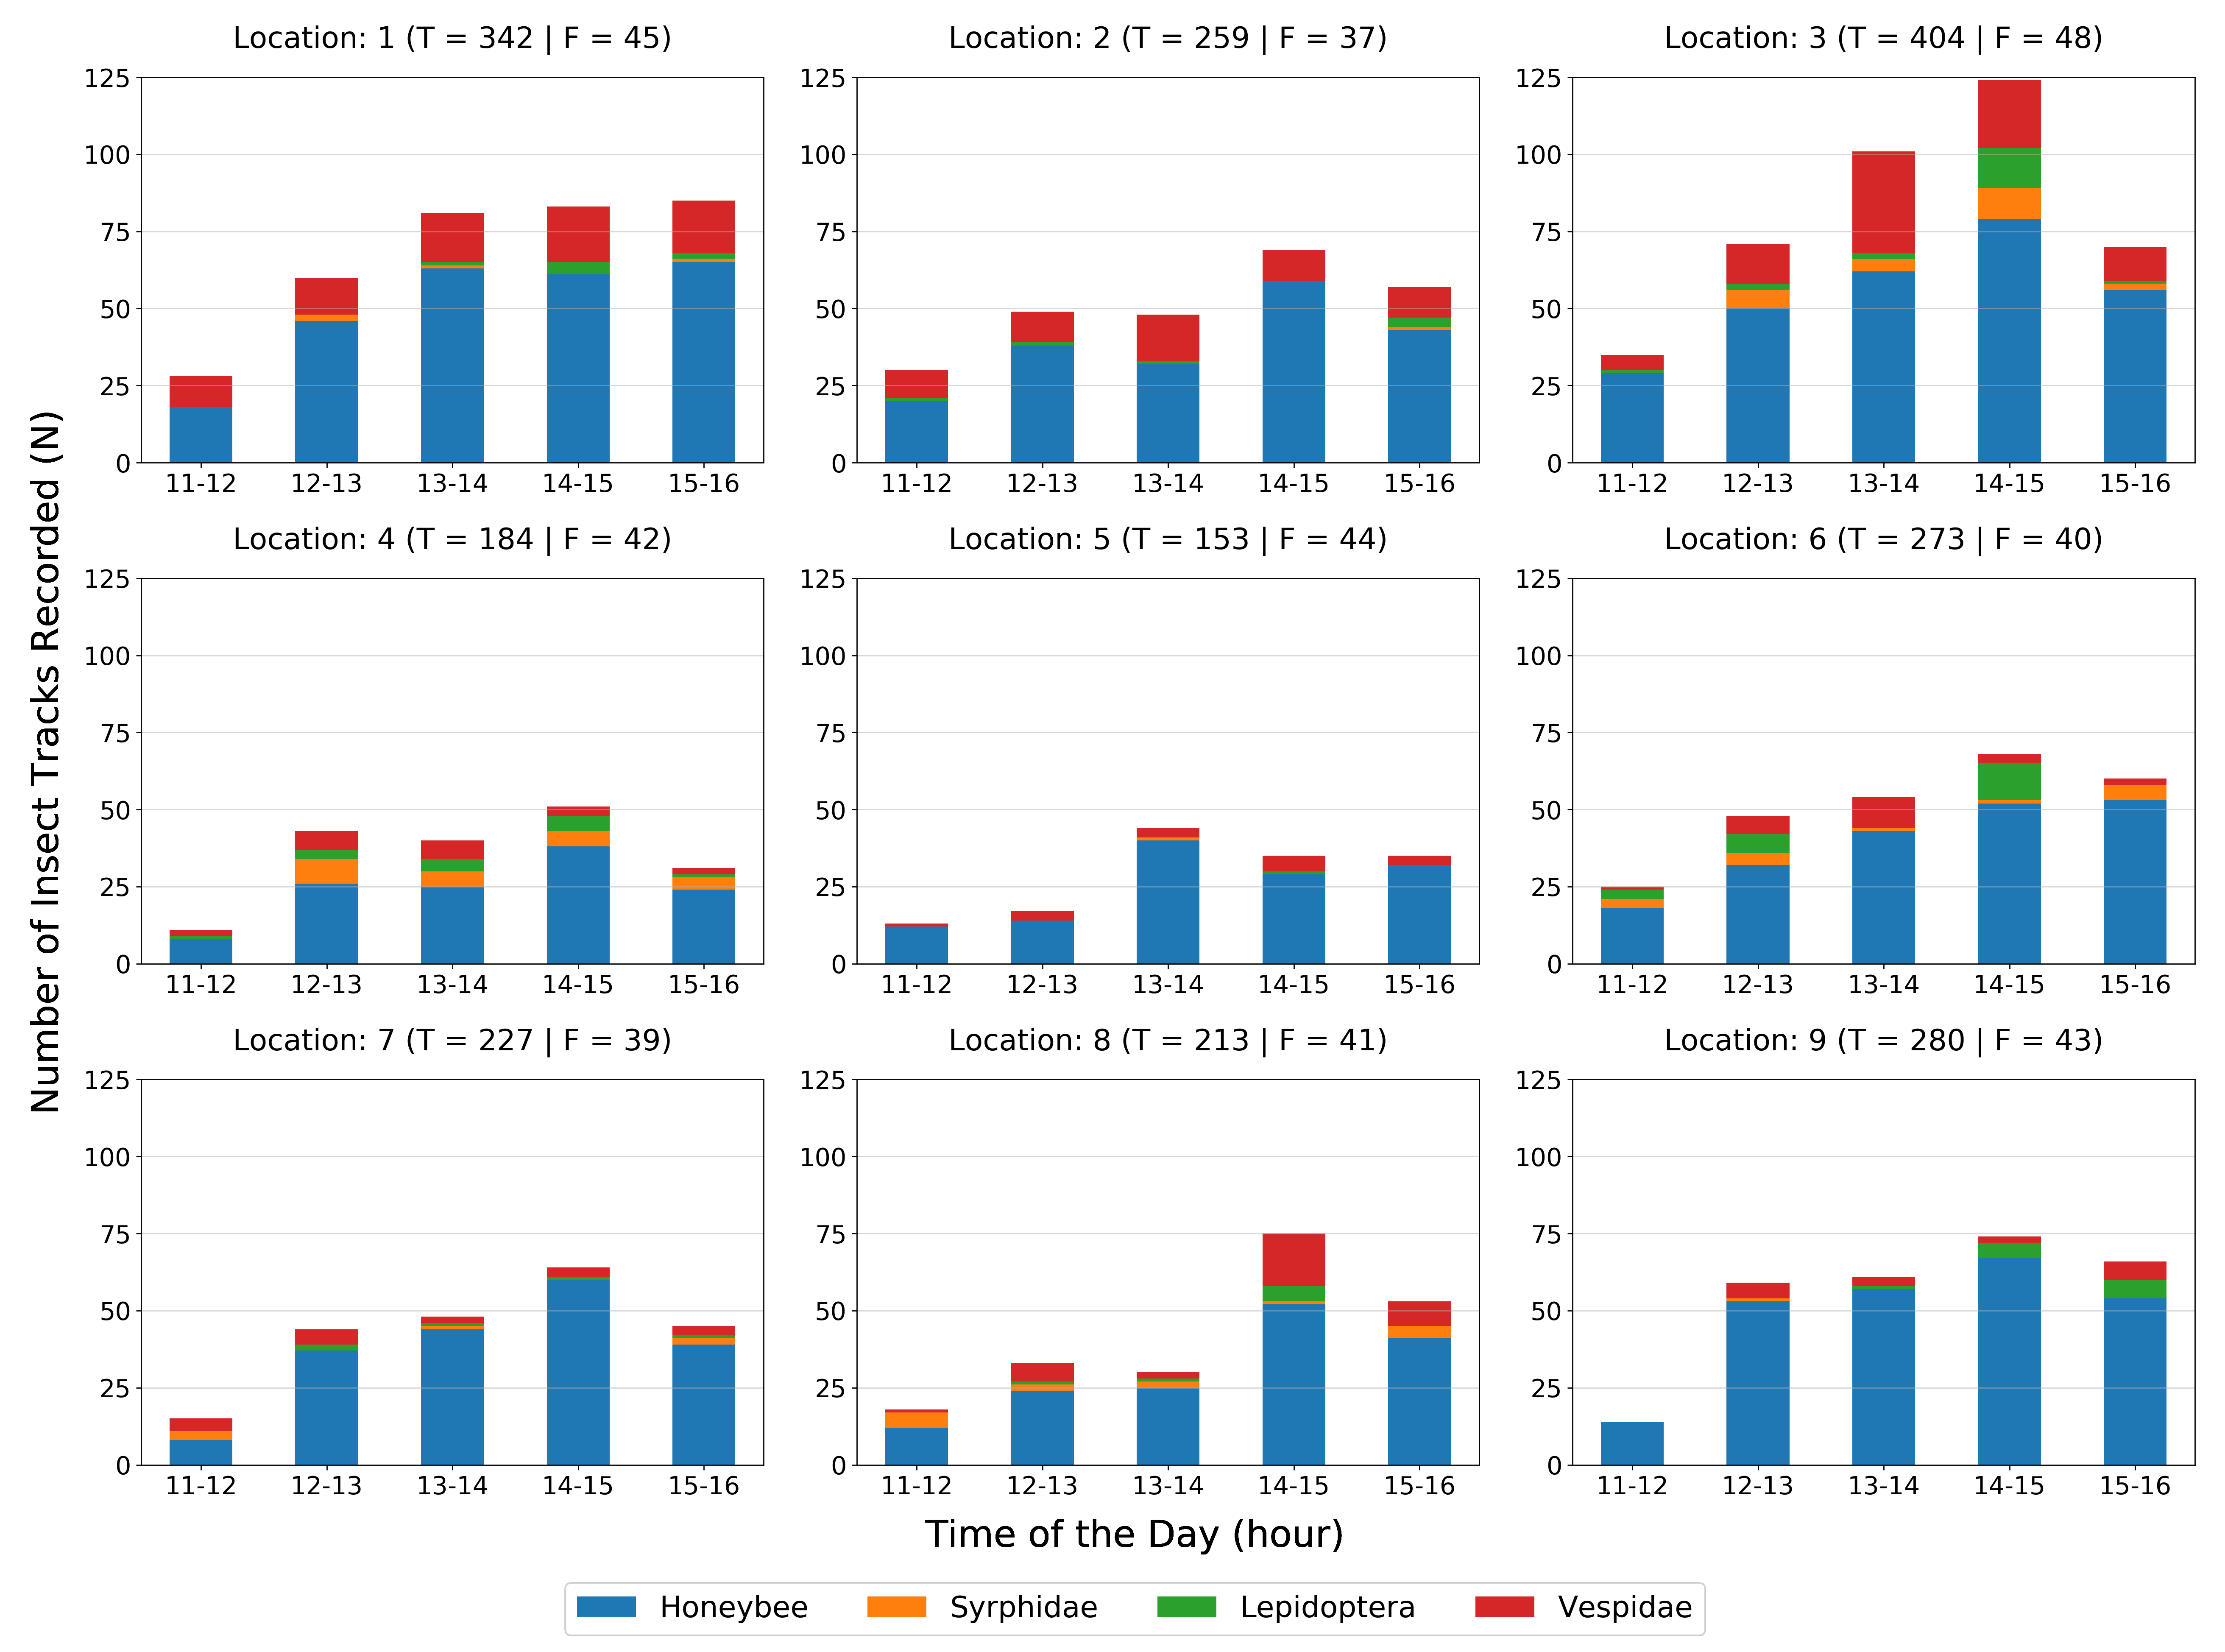
We applied our methods to analyse pollination in a commercial berry farm to demonstrate its practical relevance for precision pollination. The dataset for pollination analysis consisted of 1805 honeybees, 85 Syrphidae, 100 Lepidoptera and 345 Vespids. The complete trajectory dataset of insects and flowers is accessible from Data Availability. The distribution of the trajectory lengths is shown in Fig 5. An analysis of the temporal variations in insect counts across the data collection points is shown in Fig. 6.
Spatial monitoring and insect behavioural analysis can help growers quantify pollination across different farm areas. We compared pollination levels across farm strawberry polytunnels using insect counts and the number of insect-flower interactions recorded at each location. Research suggests that a strawberry flower requires a minimum of four insect visits to be fully fertilised (Garibaldi \BOthers., \APACyear2020; Chagnon \BOthers., \APACyear1989). Therefore, the number of insect visits to a flower can be used to predict its pollination level. We used the collected spatial monitoring data to identify flowers that received at least four insect visits during the biologically relevant data collection period [5 hours] over which our system operated. Analysis results are shown in Fig. 7.
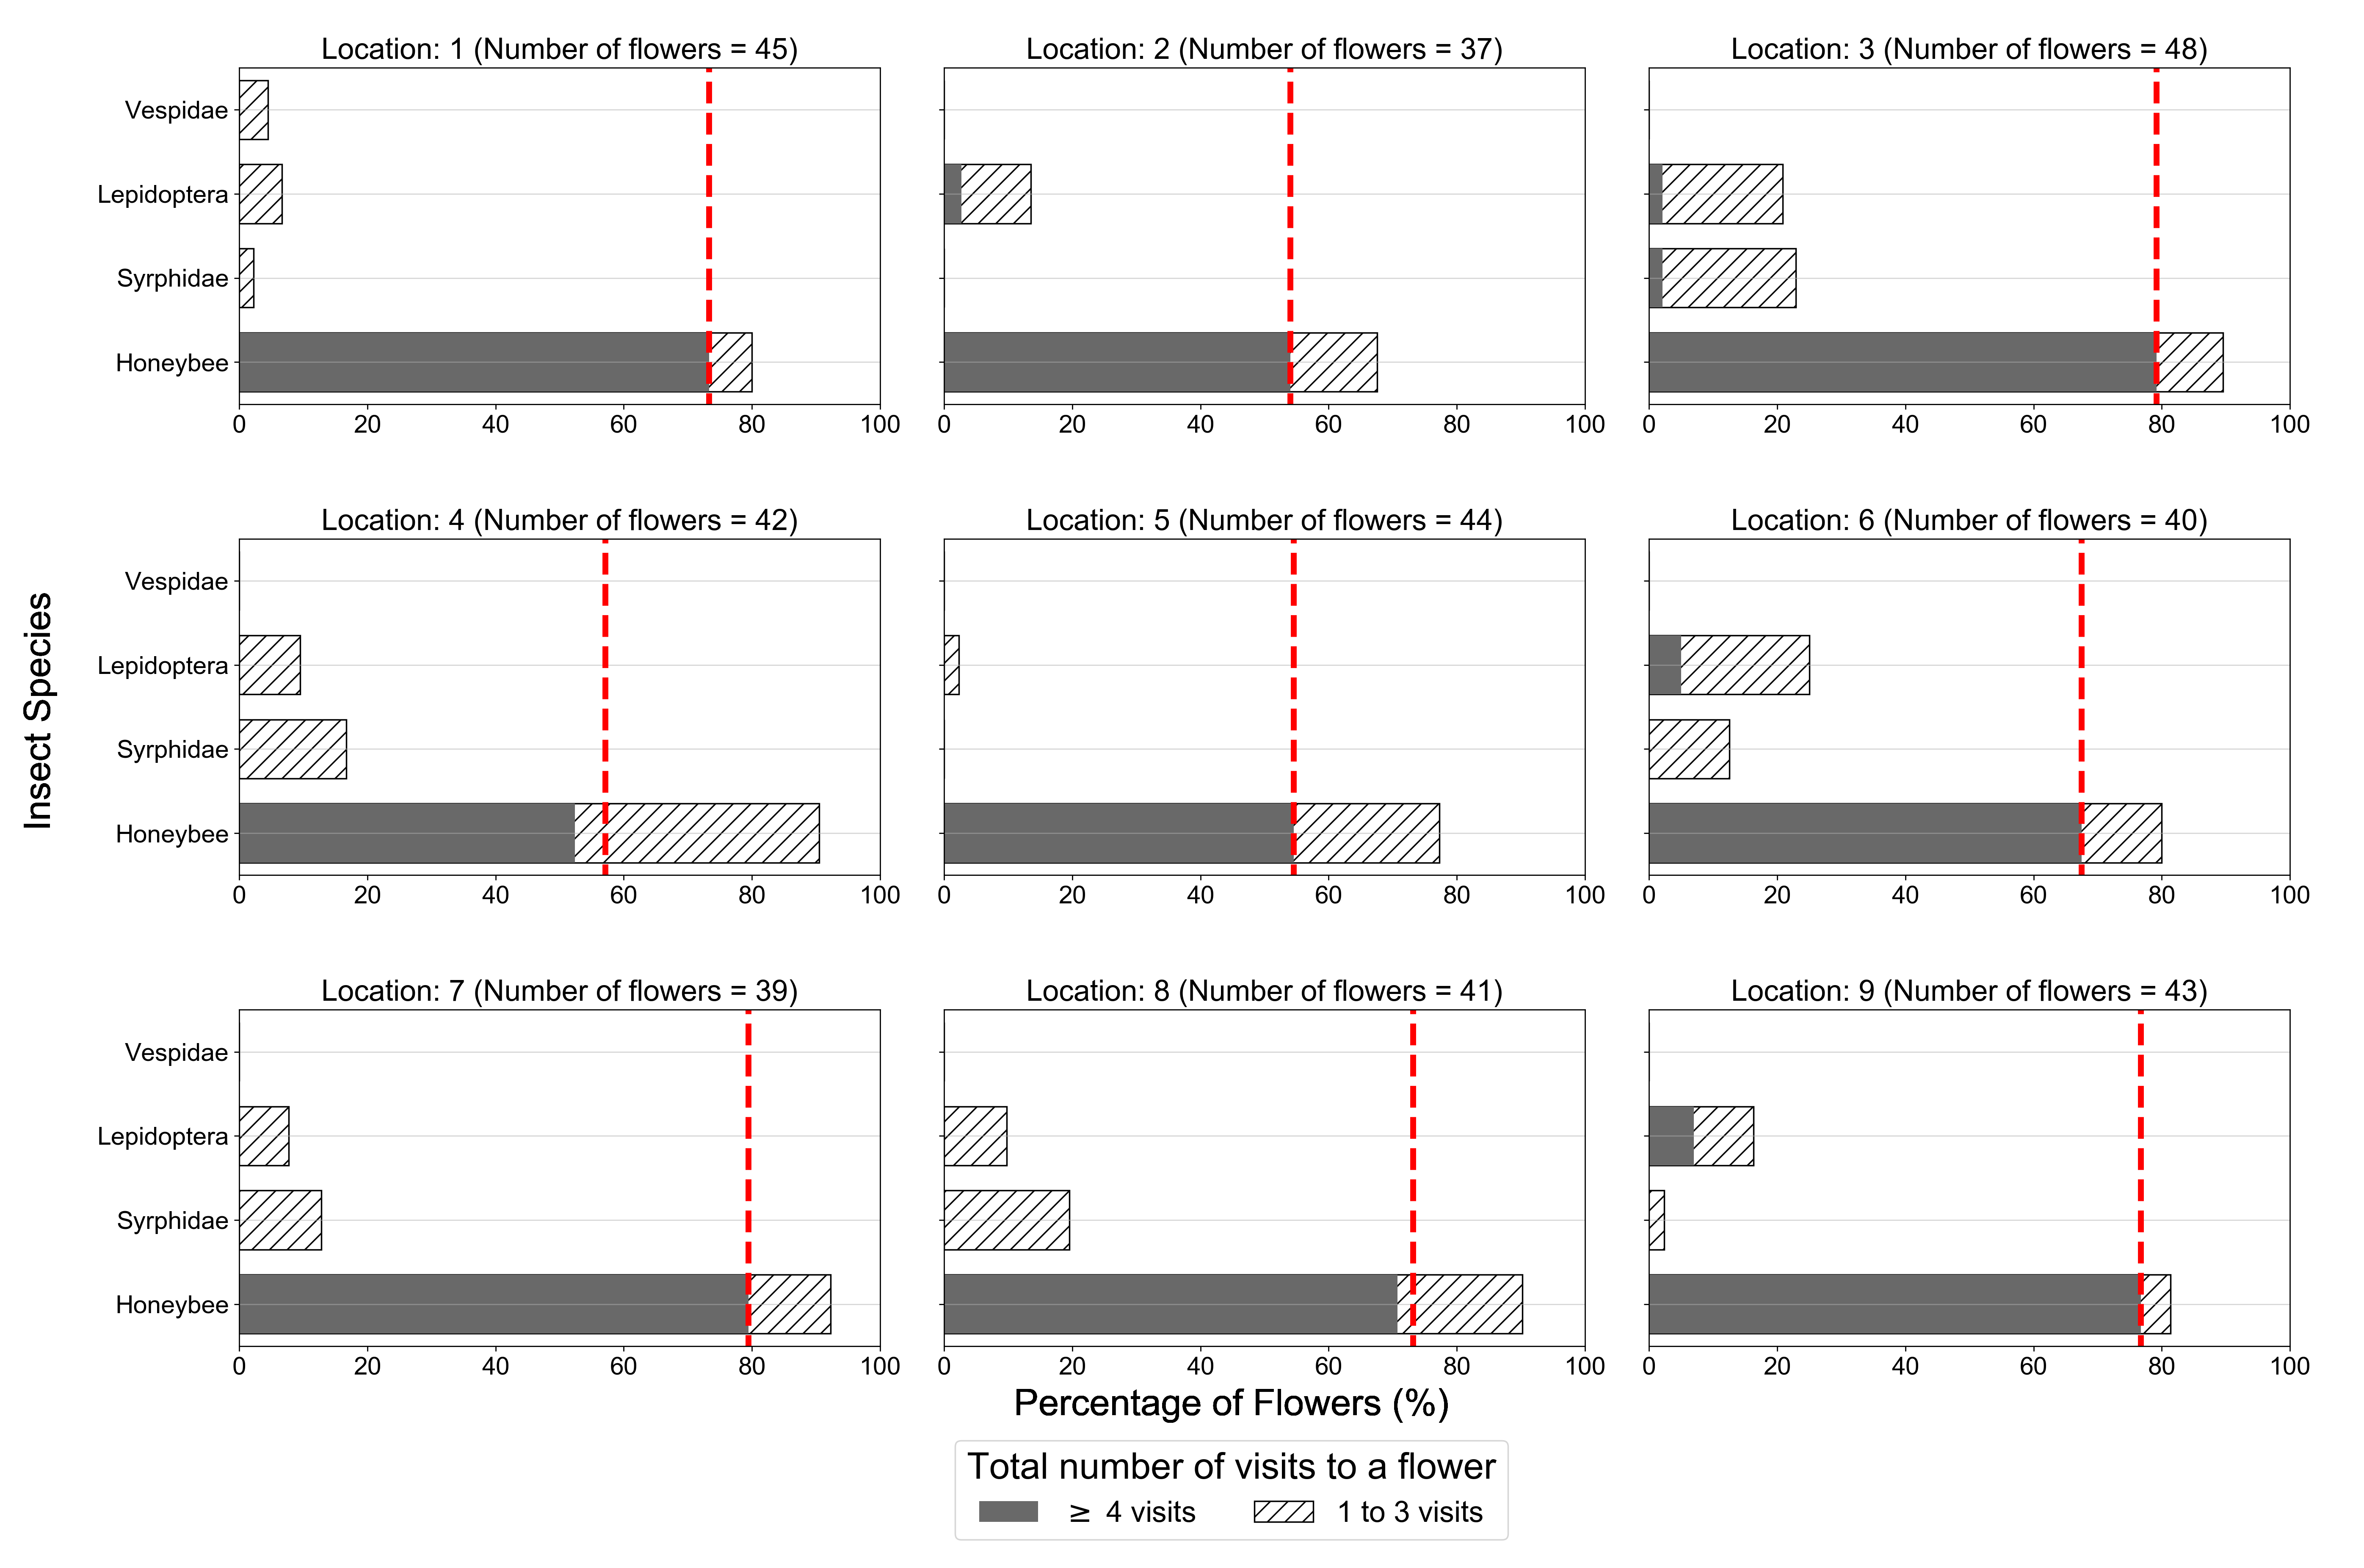
Flower-visitation behaviour reflects insects’ crop pollination contributions. We quantified this on the strawberry flowers by calculating the percentage of flowers that received visits from each insect type. We further analysed insect-flower visits to evaluate the pollination efficacy of insect types by calculating the proportion of flowers that received the minimum of four insect visits required for fertilisation. Results of this analysis are shown in Fig. 8.
At all data collection points, we recorded a higher number of honeybees than other insects (Fig. 7). These insects contributed the most towards achieving the flower-visitation targets required for fertilisation (Fig. 8). The next highest recorded insect were the Vespids (341 tracks) (Fig. 7). However, Vespids were rarely observed to be visiting flowers – at location 1 we did identify Vespidae flower visits; see Fig. 8. This suggests that Vespids do not contribute much to strawberry pollination. Indeed Vespids may be a predator of other insects (Spencer \BOthers., \APACyear2020) and can act to inhibit pollination. We recorded relatively low Lepidopteran and Syrphidae counts in most areas of the farm (Fig. 7). The contribution of these species towards achieving flower-visitor targets required for pollination was observed to be much lower than that of honeybees (Fig. 8). This effect is evident by the low relative frequency with which these insects made successive visits to flowers to meet the four required for optimal fertilisation (Fig. 8). For example, the highest frequency of a non-honeybee pollinator to meet four visits was Lepidoptera at location 9 where less than 15% of flowers achieve this level of pollination; whilst at all locations honeybees significantly exceeded this level of pollination performance (Fig. 8). When pollination across all locations is considered, over 68% of the recorded strawberry flowers received the minimum of four insect visits required for fertilisation, and 67% of flowers attained this threshold through honeybee visits alone. This data thus reconfirms which insects seem, at least as far as the number of visits is concerned, to contribute the most towards pollination at the site.
5 Discussion and Future Work
Insect pollination monitoring can improve our understanding of the behaviour of insects on crops. It can therefore potentially boost crop yield on farms were it not currently heavily constrained by the labour required for manual data collection. In this study, a novel multi-point computer vision-based system is presented to facilitate digital spatial monitoring and insect behavioural analysis on large scale farms. Our system operates in real-world commercial agricultural environments (Fig. 2) to capture videos of insects, identify them (Fig. 3), and count the number of different varieties over large areas (Fig. 7) across time (Fig. 6). Analysis of the insect behavioural data allows comparison of the contributions of different insect varieties to crop pollination (Fig. 7 and 8). Here, we discuss the implications of our research for precision pollination.
5.1 Computer vision for insect tracking and behavioural analysis
Our methods remove the major constraints imposed by the limitations of human observers for horticultural pollination monitoring and the collection of high-resolution spatiotemporal data (Fig. 7) on insect behaviour. The approach therefore also paves the way for computer vision and edge computing devices to identify insect species for other entomological and ethological applications.
The use of relatively inexpensive Raspberry Pi edge computing devices (Fig. 2) for remote recording provides a high degree of scalability and customisability (Aslanpour \BOthers., \APACyear2021; O’Grady \BOthers., \APACyear2019) for insect monitoring. However, the limited capabilities of these devices requires manual focusing of cameras, confines the size of recorded study areas (Fig. 2d) and offers only low frame rates and low quality video. This reduced the system’s ability to detect small Syrphidae, and resulted in issues with the detection and tracking of fast-moving Vespids (Table 1). In addition, the current implementation continuously recorded videos on the Raspberry Pi even when there was no insect in the camera frame. This wastes the limited storage and power capacities available on edge computing devices. We aim to address this drawback in future work by implementing an in-situ algorithm on the edge-computing device for real-time event processing. It is likely that with the rapid improvement of camera technology, video quality and resolution will overcome current limitations and enhance the accuracy and efficiency of our methods.
We used a fixed camera setup covering a confined area to record videos (Fig. 2d). This results in a subsampling of insect flower visitation and behavioural data. We propose that future research should address this limitation by developing methods to extend study areas using multiple or moving cameras. We applied our new methods to monitor insect pollination behaviour in strawberry crops. Strawberry flowers bloom within a narrow vertical spatial range and are usually visible from above (Fig. 2d). By contrast, other crops, such as tomatoes or raspberry, grow within complex three-dimensional structures of vines or canes, making overhead camera tracking of insects problematic. Monitoring their behaviour in such three-dimensional crops will require multi-view video capture and three-dimensional tracking, which is currently a highly complex and unsolved challenge.
Insect detection is an essential precursor to tracking and monitoring. Our algorithm accurately detected honeybees and Vespidae but performed relatively poorly on Syrphidae (Table 1). This is because of the relatively small pixel area covered by the insect with our setup (Syrphidae covers pixels compared to pixels for a honeybee) (Fig. 3). Future improvements in cameras and object detection technologies (Stojnić \BOthers., \APACyear2021) will help here.
We used a hybrid detection model consisting of a deep learning-based and a segmentation-based detection model to detect insects in videos. Using a segmentation-based detection model in tandem reduced the demand for the deep learning model. This helped to achieve F-scores of 0.8 for each variety (Table 1) even when trained with a limited and unbalanced dataset (Ratnayake \BOthers., \APACyear2021\APACexlab\BCnt2, \APACyear2021\APACexlab\BCnt1). Our algorithm uses deep learning to detect and classify insects as they enter the video frame. The results of experimental evaluation showed limitations in Lepidopteran detection and visually similar insect detection (i.e. honeybees, Syrphidae and Vespidae (Fig. 3 and Table 1)). Detection of Lepidopterans was challenging because they sometimes appear similar in shape to foliage and shadows in the environment. Also, both Lepidopterans and Syrphidae rested stationary on flowers for extended periods, prompting the algorithm to classify them as part of the background. Detection and classification of visually similar insects requires a deep learning model trained with large annotated datasets. Although there is a considerable increase in the number of open datasets for animal classification (Van Horn \BOthers., \APACyear2018), there is an absence of suitable open annotated datasets for insect detection in entomology (Høye \BOthers., \APACyear2021). Hence, for the current study, we built a dataset from scratch. However, our dataset was unbalanced, since the number of instances in each class was influenced by the relative abundance of insects recorded at the site (Wang \BOthers., \APACyear2016). We propose that future research should use characteristics of insect behaviour, such as spatial signatures of insect movement, to improve species classification tasks (Kirkeby \BOthers., \APACyear2021). This will help overcome limitations associated with camera quality and deep learning datasets. The insect trajectory and video data we publish with this article offers a starting point for such solutions.
We used the extracted insect trajectory data to monitor insect flower visitation behaviour and infer pollination levels. In our analysis, if an insect departed the frame and later reappeared, or if it flew under the foliage and later reappeared, a “new” trajectory was generated. Although this does not affect the flower-visitor counts, our approach could bias trajectory counts for species with different behaviours or flight path characteristics (e.g., flying under foliage and being occluded, cornering sharply rather than turning smoothly). Our multi-camera system will enable future research on these topics especially when combined with emerging solutions for individual insect identification.
A classic question in any data sampling is the tradeoff between focused detail and global context. Our multi-point system enables a view of what specific insect pollinators are doing at flowers and also a holistic appraisal of how pollination is enabled across an entire agricultural field. This solution can be implemented in a variety of ways by choosing different camera lens focal lengths and thus fields of view, different numbers of cameras, and any field area, depending upon the resolution required to answer a particular research question.
5.2 Spatial monitoring for precision pollination
Spatial monitoring and insect behavioural analysis can help growers understand the distribution of pollinators across a farm and their impact on pollination. We quantified pollination by counting insect numbers and insect-flower interactions (Fig. 7). Farm areas with many flowers and insects will likely yield the most crop if there are a suitable number of insect-flower interactions. Strawberry flowers require at least four insect visits for full fertilisation (Garibaldi \BOthers., \APACyear2020; Chagnon \BOthers., \APACyear1989). However, it is important to note that crop yield and visitation rates have been observed to have a non-linear relationship (Garibaldi \BOthers., \APACyear2020), where higher flower visitation rates can result in lower crop yield (Rollin \BBA Garibaldi, \APACyear2019; Garibaldi \BOthers., \APACyear2020). Therefore, it is beneficial to maintain insect flower visits at an optimum value that depends on the crop type, pollinator species, and environmental conditions (Garibaldi \BOthers., \APACyear2020).
Although different behaviours and morphologies make some insect species more effective pollinators of some flowers than others, we compared the contribution of different insect varieties to strawberry pollination using the number of insect flower visits as a proxy (Fig. 8). The analysis suggests that strawberries can obtain sufficient pollination solely from honeybees (Fig. 8), even without the presence of other insects. Whilst non-honeybee insect species do not reach the threshold of four visits for high effectiveness (Fig. 8), it is possible these insects may still contribute to pollination (Fig. 7 and 8). Indeed, the absolute volume of insects present may impact how thresholds are achieved. Employing the computer vision solutions we share here in different environments where insect abundance naturally varies will likely inform researchers about what insects are most beneficial in specific contexts. In addition, an agricultural system driven by a single pollinator type may not be desirable. Pollinator diversity and associated high flower visitor richness have been shown to affect pollination and crop yield (Garibaldi \BOthers., \APACyear2016). Often the high abundance of a single pollinator species cannot be used as a substitute for species richness (Garibaldi \BOthers., \APACyear2016; Fijen \BOthers., \APACyear2018) as variations in behaviour and foraging inherent to different insect species may be important.
Compared to manual pollination monitoring, our methods provide high-resolution spatio-temporal behavioural data classified by insect type. Our spatial monitoring results (Fig. 7) can assist farm managers to identify farm areas that require immediate attention in order to maximise fruit set. The temporal analysis of variations in insect counts (Fig. 6) can be used as a guide to understand which duration or sampling frequency is necessary for a site to understand pollinator behaviour. Furthermore, the behavioural pollination contribution analysis (Fig. 8) can provide tools and data to identify efficient pollinator species for a particular crop, enabling data-driven pollination management.
Pollination monitoring helps understand the impact of climate change and other anthropogenic activities on insect populations (Settele \BOthers., \APACyear2016). Recently, climate change and other anthropogenic pressures, including intensive agriculture, have caused a decline in some pollinator populations (Vanbergen \BBA Initiative, \APACyear2013; Schweiger \BOthers., \APACyear2010; Hallmann \BOthers., \APACyear2017; Outhwaite \BOthers., \APACyear2022) threatening global food security and terrestrial ecosystem health. The most impacted pollinator populations are native and wild insects that must compete for food with managed pollinators while coping with disease, pollution and habitat loss (Wood \BOthers., \APACyear2020). Digital pollination monitoring systems like that described here, provide much-needed data for understanding the impacts of climate change on insect biodiversity and can ultimately provide a sound basis for conservation.
6 Conclusions
In this paper, we presented a computer vision facilitated system for spatial monitoring and insect behavioural analysis to underpin agricultural precision pollination. Our system comprised of edge computing-based remote video capture, offline, automated, unmarked multi-species insect tracking, and insect behavioural analysis. The system tracked four insect types with F-scores above 0.8 when implemented on a commercial strawberry farm. Analysis of the spatial distribution of flower-visiting behaviour of different insect varieties across the farm, allowed for the inference of flower fertilisation, and the comparison of insects’ pollination contribution. We determined that of flowers met or exceeded the specified criteria for reliable pollination through honeybee visits. However, alternative pollinators were less effective at our study site. This advancement of computer vision, spatial monitoring and insect behavioural analysis, provides pollinator data to growers much more rapidly, broadly and deeply than manual observation. Such rich sources of insect-flower interaction data potentially enable precision pollination and pollinator management for large-scale commercial agriculture.
Supplementary information
Additional and detailed experimental results on presented methods are available in the Supplementary Information file “Supplementary_Information.pdf”.
Acknowledgments
The authors would like to thank Sunny Ridge Australia for the opportunity to conduct research at their farm.
Declarations
-
•
Funding: Authors were supported by the Australian Research Council Discovery Projects grant DP160100161 and Monash-Bosch AgTech Launchpad primer grant. This study was funded by AgriFutures grant PRJ-012993. Amarathunga is supported by ARC Research Hub IH180100002.
-
•
Competing interests: The authors have no competing interests to declare that are relevant to the content of this article.
-
•
Ethics approval: Not applicable
-
•
Consent to participate: Not applicable
-
•
Consent for publication: Not applicable
-
•
Availability of data and materials: The datasets generated during and/or analysed during the current study are available in the repository https://doi.org/10.26180/21533760
-
•
Code availability: Code is available through https://github.com/malikaratnayake/Polytrack2.0
-
•
Authors’ contributions: Conceptualization: Malika Nisal Ratnayake, Adrian G. Dyer, Alan Dorin; Data curation: Malika Nisal Ratnayake; Formal analysis: Malika Nisal Ratnayake; Funding acquisition: Adrian G. Dyer, Alan Dorin; Investigation: Malika Nisal Ratnayake, Don Chathurika Amarathunga, Asaduz Zaman; Methodology: Malika Nisal Ratnayake, Adrian G. Dyer, Alan Dorin; Project administration: Adrian G. Dyer, Alan Dorin; Resources: Adrian G. Dyer, Alan Dorin; Software: Malika Nisal Ratnayake; Supervision: Adrian G. Dyer, Alan Dorin; Validation: Malika Nisal Ratnayake, Don Chathurika Amarathunga; Writing – original draft: Malika Nisal Ratnayake; Writing – review & editing: Malika Nisal Ratnayake, Don Chathurika Amarathunga, Asaduz Zaman, Adrian G. Dyer, Alan Dorin.
References
- \bibcommenthead
- Abadi \BOthers. (\APACyear2016) \APACinsertmetastarabadi2016tensorflow{APACrefauthors}Abadi, M., Barham, P., Chen, J., Chen, Z., Davis, A., Dean, J.\BDBLZheng, X. \APACrefYearMonthDay2016. \BBOQ\APACrefatitleTensorFlow: A system for large-scale machine learning TensorFlow: A system for large-scale machine learning.\BBCQ \APACrefbtitleProceedings of the 12th USENIX Symposium on Operating Systems Design and Implementation, OSDI 2016 Proceedings of the 12th usenix symposium on operating systems design and implementation, osdi 2016 (\BPGS 265—283). \PrintBackRefs\CurrentBib
- Abdel-Raziq \BOthers. (\APACyear2021) \APACinsertmetastar10.1038/s41598-021-82537-1{APACrefauthors}Abdel-Raziq, H.M., Palmer, D.M., Koenig, P.A., Molnar, A.C.\BCBL Petersen, K.H. \APACrefYearMonthDay2021. \BBOQ\APACrefatitleSystem design for inferring colony-level pollination activity through miniature bee-mounted sensors System design for inferring colony-level pollination activity through miniature bee-mounted sensors.\BBCQ \APACjournalVolNumPagesScientific reports1111–12. \PrintBackRefs\CurrentBib
- Afonso \BOthers. (\APACyear2020) \APACinsertmetastarafonso2020tomato{APACrefauthors}Afonso, M., Fonteijn, H., Fiorentin, F.S., Lensink, D., Mooij, M., Faber, N.\BDBLWehrens, R. \APACrefYearMonthDay2020. \BBOQ\APACrefatitleTomato fruit detection and counting in greenhouses using deep learning Tomato fruit detection and counting in greenhouses using deep learning.\BBCQ \APACjournalVolNumPagesFrontiers in plant science111759. \PrintBackRefs\CurrentBib
- Aizen \BOthers. (\APACyear2009) \APACinsertmetastaraizen2009{APACrefauthors}Aizen, M.A., Garibaldi, L.A., Cunningham, S.A.\BCBL Klein, A.M. \APACrefYearMonthDay2009. \BBOQ\APACrefatitleHow much does agriculture depend on pollinators? Lessons from long-term trends in crop production How much does agriculture depend on pollinators? lessons from long-term trends in crop production.\BBCQ \APACjournalVolNumPagesAnnals of botany10391579–1588. \PrintBackRefs\CurrentBib
- Amarathunga \BOthers. (\APACyear2021) \APACinsertmetastaramarathunga2021methods{APACrefauthors}Amarathunga, D.C.K., Grundy, J., Parry, H.\BCBL Dorin, A. \APACrefYearMonthDay2021. \BBOQ\APACrefatitleMethods of Insect Image Capture and Classification: A Systematic Literature Review Methods of insect image capture and classification: A systematic literature review.\BBCQ \APACjournalVolNumPagesSmart Agricultural Technology100023. \PrintBackRefs\CurrentBib
- Aslanpour \BOthers. (\APACyear2021) \APACinsertmetastaraslanpour2021serverless{APACrefauthors}Aslanpour, M.S., Toosi, A.N., Cicconetti, C., Javadi, B., Sbarski, P., Taibi, D.\BDBLDustdar, S. \APACrefYearMonthDay2021. \BBOQ\APACrefatitleServerless edge computing: vision and challenges Serverless edge computing: vision and challenges.\BBCQ \APACrefbtitle2021 Australasian Computer Science Week Multiconference 2021 australasian computer science week multiconference (\BPGS 1–10). \PrintBackRefs\CurrentBib
- Barreiros \BOthers. (\APACyear2021) \APACinsertmetastardeoliveirabarreiros2021{APACrefauthors}Barreiros, M.d.O., Dantas, D.d.O., Silva, L.C.d.O., Ribeiro, S.\BCBL Barros, A.K. \APACrefYearMonthDay2021. \BBOQ\APACrefatitleZebrafish tracking using YOLOv2 and Kalman filter Zebrafish tracking using yolov2 and kalman filter.\BBCQ \APACjournalVolNumPagesScientific reports1111–14. \PrintBackRefs\CurrentBib
- Batsleer \BOthers. (\APACyear2020) \APACinsertmetastarbatsleer2020{APACrefauthors}Batsleer, F., Bonte, D., Dekeukeleire, D., Goossens, S., Poelmans, W., Van der Cruyssen, E.\BDBLVandegehuchte, M.L. \APACrefYearMonthDay2020. \BBOQ\APACrefatitleThe neglected impact of tracking devices on terrestrial arthropods The neglected impact of tracking devices on terrestrial arthropods.\BBCQ \APACjournalVolNumPagesMethods in Ecology and Evolution113350–361. \PrintBackRefs\CurrentBib
- Bjerge, Mann\BCBL \BBA Høye (\APACyear2021) \APACinsertmetastarbjerge2021real{APACrefauthors}Bjerge, K., Mann, H.M.\BCBL Høye, T.T. \APACrefYearMonthDay2021. \BBOQ\APACrefatitleReal-time insect tracking and monitoring with computer vision and deep learning Real-time insect tracking and monitoring with computer vision and deep learning.\BBCQ \APACjournalVolNumPagesRemote Sensing in Ecology and Conservation. \PrintBackRefs\CurrentBib
- Bjerge, Nielsen\BCBL \BOthers. (\APACyear2021) \APACinsertmetastarbjerge2021automated{APACrefauthors}Bjerge, K., Nielsen, J.B., Sepstrup, M.V., Helsing-Nielsen, F.\BCBL Høye, T.T. \APACrefYearMonthDay2021. \BBOQ\APACrefatitleAn automated light trap to monitor moths (Lepidoptera) using computer vision-based tracking and deep learning An automated light trap to monitor moths (lepidoptera) using computer vision-based tracking and deep learning.\BBCQ \APACjournalVolNumPagesSensors212343. \PrintBackRefs\CurrentBib
- Bochkovskiy \BOthers. (\APACyear2020) \APACinsertmetastarbochkovskiy{APACrefauthors}Bochkovskiy, A., Wang, C\BHBIY.\BCBL Liao, H\BHBIY.M. \APACrefYearMonthDay2020. \BBOQ\APACrefatitleYolov4: Optimal speed and accuracy of object detection Yolov4: Optimal speed and accuracy of object detection.\BBCQ \APACjournalVolNumPagesarXiv preprint arXiv:2004.10934. \PrintBackRefs\CurrentBib
- Branson \BOthers. (\APACyear2009) \APACinsertmetastarBranson2009{APACrefauthors}Branson, K., Robie, A.A., Bender, J., Perona, P.\BCBL Dickinson, M.H. \APACrefYearMonthDay2009. \BBOQ\APACrefatitleHigh-throughput ethomics in large groups of Drosophila High-throughput ethomics in large groups of drosophila.\BBCQ \APACjournalVolNumPagesNature methods66451–457. \PrintBackRefs\CurrentBib
- Breeze \BOthers. (\APACyear2021) \APACinsertmetastarbreeze2020{APACrefauthors}Breeze, T.D., Bailey, A.P., Balcombe, K.G., Brereton, T., Comont, R., Edwards, M.\BDBLothers \APACrefYearMonthDay2021. \BBOQ\APACrefatitlePollinator monitoring more than pays for itself Pollinator monitoring more than pays for itself.\BBCQ \APACjournalVolNumPagesJournal of Applied Ecology58144–57. \PrintBackRefs\CurrentBib
- Campbell \BOthers. (\APACyear2008) \APACinsertmetastarcampbell2008{APACrefauthors}Campbell, J., Mummert, L.\BCBL Sukthankar, R. \APACrefYearMonthDay2008. \BBOQ\APACrefatitleVideo monitoring of honey bee colonies at the hive entrance Video monitoring of honey bee colonies at the hive entrance.\BBCQ \APACjournalVolNumPagesVisual observation & analysis of animal & insect behavior, ICPR81—4. \PrintBackRefs\CurrentBib
- Chagnon \BOthers. (\APACyear1989) \APACinsertmetastarchagnon1989{APACrefauthors}Chagnon, M., Gingras, J.\BCBL De Oliveira, D. \APACrefYearMonthDay1989. \BBOQ\APACrefatitleEffect of honey bee (Hymenoptera: Apidae) visits on the pollination rate of strawberries Effect of honey bee (hymenoptera: Apidae) visits on the pollination rate of strawberries.\BBCQ \APACjournalVolNumPagesJournal of Economic Entomology8251350–1353. \PrintBackRefs\CurrentBib
- Dennis \BOthers. (\APACyear2006) \APACinsertmetastardennis2005{APACrefauthors}Dennis, R., Shreeve, T., Isaac, N., Roy, D., Hardy, P., Fox, R.\BCBL Asher, J. \APACrefYearMonthDay2006. \BBOQ\APACrefatitleThe effects of visual apparency on bias in butterfly recording and monitoring The effects of visual apparency on bias in butterfly recording and monitoring.\BBCQ \APACjournalVolNumPagesBiological conservation1284486–492. \PrintBackRefs\CurrentBib
- FAO (\APACyear2018) \APACinsertmetastarfaobee{APACrefauthors}FAO \APACrefYearMonthDay2018. \BBOQ\APACrefatitleWhy bees matter; the importance of bees and other pollinators for food and agriculture Why bees matter; the importance of bees and other pollinators for food and agriculture.\BBCQ \PrintBackRefs\CurrentBib
- Fijen \BOthers. (\APACyear2018) \APACinsertmetastarfijen2018insect{APACrefauthors}Fijen, T.P., Scheper, J.A., Boom, T.M., Janssen, N., Raemakers, I.\BCBL Kleijn, D. \APACrefYearMonthDay2018. \BBOQ\APACrefatitleInsect pollination is at least as important for marketable crop yield as plant quality in a seed crop Insect pollination is at least as important for marketable crop yield as plant quality in a seed crop.\BBCQ \APACjournalVolNumPagesEcology letters21111704–1713. \PrintBackRefs\CurrentBib
- Food & Agriculture Organization of the United Nation (\APACyear2019) \APACinsertmetastarfao2019{APACrefauthors}Food & Agriculture Organization of the United Nation \APACrefYearMonthDay2019. \BBOQ\APACrefatitleGlobal Action on Pollination Services for Sustainable Agriculture Global action on pollination services for sustainable agriculture.\BBCQ \PrintBackRefs\CurrentBib
- Garibaldi \BOthers. (\APACyear2016) \APACinsertmetastargaribaldi2016mutually{APACrefauthors}Garibaldi, L.A., Carvalheiro, L.G., Vaissière, B.E., Gemmill-Herren, B., Hipólito, J., Freitas, B.M.\BDBLothers \APACrefYearMonthDay2016. \BBOQ\APACrefatitleMutually beneficial pollinator diversity and crop yield outcomes in small and large farms Mutually beneficial pollinator diversity and crop yield outcomes in small and large farms.\BBCQ \APACjournalVolNumPagesScience3516271388–391. \PrintBackRefs\CurrentBib
- Garibaldi \BOthers. (\APACyear2017) \APACinsertmetastargaribaldi2017towards{APACrefauthors}Garibaldi, L.A., Requier, F., Rollin, O.\BCBL Andersson, G.K.S. \APACrefYearMonthDay2017. \BBOQ\APACrefatitleTowards an integrated species and habitat management of crop pollination Towards an integrated species and habitat management of crop pollination.\BBCQ \APACjournalVolNumPagesCurrent opinion in insect science21105—114. \PrintBackRefs\CurrentBib
- Garibaldi \BOthers. (\APACyear2020) \APACinsertmetastargaribaldi2020a{APACrefauthors}Garibaldi, L.A., Sáez, A., Aizen, M.A., Fijen, T.\BCBL Bartomeus, I. \APACrefYearMonthDay2020. \BBOQ\APACrefatitleCrop pollination management needs flower-visitor monitoring and target values Crop pollination management needs flower-visitor monitoring and target values.\BBCQ \APACjournalVolNumPagesJournal of Applied Ecology574664–670. \PrintBackRefs\CurrentBib
- Goscinski \BOthers. (\APACyear2014) \APACinsertmetastargoscinski2014multi{APACrefauthors}Goscinski, W.J., McIntosh, P., Felzmann, U.C., Maksimenko, A., Hall, C.J., Gureyev, T.\BDBLothers \APACrefYearMonthDay2014. \BBOQ\APACrefatitleThe multi-modal Australian ScienceS Imaging and Visualization Environment (MASSIVE) high performance computing infrastructure: applications in neuroscience and neuroinformatics research The multi-modal australian sciences imaging and visualization environment (massive) high performance computing infrastructure: applications in neuroscience and neuroinformatics research.\BBCQ \APACjournalVolNumPagesFrontiers in Neuroinformatics830. \PrintBackRefs\CurrentBib
- Haalck \BOthers. (\APACyear2020) \APACinsertmetastarHaalck2020{APACrefauthors}Haalck, L., Mangan, M., Webb, B.\BCBL Risse, B. \APACrefYearMonthDay2020. \BBOQ\APACrefatitleTowards image-based animal tracking in natural environments using a freely moving camera Towards image-based animal tracking in natural environments using a freely moving camera.\BBCQ \APACjournalVolNumPagesJournal of neuroscience methods330108455. \PrintBackRefs\CurrentBib
- Hall \BOthers. (\APACyear2020) \APACinsertmetastarhall2020{APACrefauthors}Hall, M.A., Jones, J., Rocchetti, M., Wright, D.\BCBL Rader, R. \APACrefYearMonthDay2020. \BBOQ\APACrefatitleBee visitation and fruit quality in berries under protected cropping vary along the length of polytunnels Bee visitation and fruit quality in berries under protected cropping vary along the length of polytunnels.\BBCQ \APACjournalVolNumPagesJournal of Economic Entomology11331337–1346. \PrintBackRefs\CurrentBib
- Hallmann \BOthers. (\APACyear2017) \APACinsertmetastarhallmann2017more{APACrefauthors}Hallmann, C.A., Sorg, M., Jongejans, E., Siepel, H., Hofland, N., Schwan, H.\BDBLothers \APACrefYearMonthDay2017. \BBOQ\APACrefatitleMore than 75 percent decline over 27 years in total flying insect biomass in protected areas More than 75 percent decline over 27 years in total flying insect biomass in protected areas.\BBCQ \APACjournalVolNumPagesPloS one1210e0185809. \PrintBackRefs\CurrentBib
- Howard \BOthers. (\APACyear2021) \APACinsertmetastar10.1371/journal.pone.0251572{APACrefauthors}Howard, S.R., Nisal Ratnayake, M., Dyer, A.G., Garcia, J.E.\BCBL Dorin, A. \APACrefYearMonthDay2021. \BBOQ\APACrefatitleTowards precision apiculture: Traditional and technological insect monitoring methods in strawberry and raspberry crop polytunnels tell different pollination stories Towards precision apiculture: Traditional and technological insect monitoring methods in strawberry and raspberry crop polytunnels tell different pollination stories.\BBCQ \APACjournalVolNumPagesPlos one165e0251572. \PrintBackRefs\CurrentBib
- Høye \BOthers. (\APACyear2021) \APACinsertmetastarhoye2021{APACrefauthors}Høye, T.T., Ärje, J., Bjerge, K., Hansen, O.L., Iosifidis, A., Leese, F.\BDBLRaitoharju, J. \APACrefYearMonthDay2021. \BBOQ\APACrefatitleDeep learning and computer vision will transform entomology Deep learning and computer vision will transform entomology.\BBCQ \APACjournalVolNumPagesProceedings of the National Academy of Sciences1182. \PrintBackRefs\CurrentBib
- Jolles (\APACyear2021) \APACinsertmetastarjolles2021broad{APACrefauthors}Jolles, J.W. \APACrefYearMonthDay2021. \BBOQ\APACrefatitleBroad-scale applications of the Raspberry Pi: A review and guide for biologists Broad-scale applications of the raspberry pi: A review and guide for biologists.\BBCQ \APACjournalVolNumPagesMethods in Ecology and Evolution1291562–1579. \PrintBackRefs\CurrentBib
- Kamilaris \BBA Prenafeta-Boldú (\APACyear2018) \APACinsertmetastarkamilaris2018deep{APACrefauthors}Kamilaris, A.\BCBT \BBA Prenafeta-Boldú, F.X. \APACrefYearMonthDay2018. \BBOQ\APACrefatitleDeep learning in agriculture: A survey Deep learning in agriculture: A survey.\BBCQ \APACjournalVolNumPagesComputers and electronics in agriculture14770–90. \PrintBackRefs\CurrentBib
- Kevan (\APACyear1975) \APACinsertmetastarkevan1975sun{APACrefauthors}Kevan, P.G. \APACrefYearMonthDay1975. \BBOQ\APACrefatitleSun-tracking solar furnaces in high arctic flowers: significance for pollination and insects Sun-tracking solar furnaces in high arctic flowers: significance for pollination and insects.\BBCQ \APACjournalVolNumPagesScience1894204723–726. \PrintBackRefs\CurrentBib
- Kirkeby \BOthers. (\APACyear2021) \APACinsertmetastarkirkeby2021advances{APACrefauthors}Kirkeby, C., Rydhmer, K., Cook, S.M., Strand, A., Torrance, M.T., Swain, J.L.\BDBLothers \APACrefYearMonthDay2021. \BBOQ\APACrefatitleAdvances in automatic identification of flying insects using optical sensors and machine learning Advances in automatic identification of flying insects using optical sensors and machine learning.\BBCQ \APACjournalVolNumPagesScientific reports1111–8. \PrintBackRefs\CurrentBib
- Koirala \BOthers. (\APACyear2019) \APACinsertmetastarkoirala2019deep{APACrefauthors}Koirala, A., Walsh, K.B., Wang, Z.\BCBL McCarthy, C. \APACrefYearMonthDay2019. \BBOQ\APACrefatitleDeep learning–Method overview and review of use for fruit detection and yield estimation Deep learning–method overview and review of use for fruit detection and yield estimation.\BBCQ \APACjournalVolNumPagesComputers and electronics in agriculture162219–234. \PrintBackRefs\CurrentBib
- Kuhn (\APACyear1955) \APACinsertmetastarkuhn1955hungarian{APACrefauthors}Kuhn, H.W. \APACrefYearMonthDay1955. \BBOQ\APACrefatitleThe Hungarian method for the assignment problem The hungarian method for the assignment problem.\BBCQ \APACjournalVolNumPagesNaval research logistics quarterly21-283–97. \PrintBackRefs\CurrentBib
- Lu \BOthers. (\APACyear2017) \APACinsertmetastarlu2017cultivated{APACrefauthors}Lu, H., Fu, X., Liu, C., Li, L\BHBIg., He, Y\BHBIx.\BCBL Li, N\BHBIw. \APACrefYearMonthDay2017. \BBOQ\APACrefatitleCultivated land information extraction in UAV imagery based on deep convolutional neural network and transfer learning Cultivated land information extraction in uav imagery based on deep convolutional neural network and transfer learning.\BBCQ \APACjournalVolNumPagesJournal of Mountain Science144731–741. \PrintBackRefs\CurrentBib
- MacInnis \BBA Forrest (\APACyear2019) \APACinsertmetastarmacinnis2019{APACrefauthors}MacInnis, G.\BCBT \BBA Forrest, J.R. \APACrefYearMonthDay2019. \BBOQ\APACrefatitlePollination by wild bees yields larger strawberries than pollination by honey bees Pollination by wild bees yields larger strawberries than pollination by honey bees.\BBCQ \APACjournalVolNumPagesJournal of Applied Ecology564824–832. \PrintBackRefs\CurrentBib
- Magnier \BOthers. (\APACyear2019) \APACinsertmetastarmagnier2019a{APACrefauthors}Magnier, B., Gabbay, E., Bougamale, F., Moradi, B., Pfister, F.\BCBL Slangen, P. \APACrefYearMonthDay2019. \BBOQ\APACrefatitleMultiple honey bees tracking and trajectory modeling Multiple honey bees tracking and trajectory modeling.\BBCQ \APACrefbtitleMultimodal Sensing: Technologies and Applications Multimodal sensing: Technologies and applications (\BVOL 11059, \BPG 110590Z). \PrintBackRefs\CurrentBib
- Odemer (\APACyear2022) \APACinsertmetastarodemer2022approaches{APACrefauthors}Odemer, R. \APACrefYearMonthDay2022. \BBOQ\APACrefatitleApproaches, challenges and recent advances in automated bee counting devices: A review Approaches, challenges and recent advances in automated bee counting devices: A review.\BBCQ \APACjournalVolNumPagesAnnals of Applied Biology180173–89. \PrintBackRefs\CurrentBib
- O’Grady \BOthers. (\APACyear2019) \APACinsertmetastaro2019edge{APACrefauthors}O’Grady, M., Langton, D.\BCBL O’Hare, G. \APACrefYearMonthDay2019. \BBOQ\APACrefatitleEdge computing: A tractable model for smart agriculture? Edge computing: A tractable model for smart agriculture?\BBCQ \APACjournalVolNumPagesArtificial Intelligence in Agriculture342–51. \PrintBackRefs\CurrentBib
- Outhwaite \BOthers. (\APACyear2022) \APACinsertmetastarouthwaite2022agriculture{APACrefauthors}Outhwaite, C., McCann, P.\BCBL Newbold, T. \APACrefYearMonthDay2022. \BBOQ\APACrefatitleAgriculture and climate change reshape insect biodiversity worldwide Agriculture and climate change reshape insect biodiversity worldwide.\BBCQ \APACjournalVolNumPagesNature. \PrintBackRefs\CurrentBib
- Pérez-Escudero \BOthers. (\APACyear2014) \APACinsertmetastarPerez-Escudero2014{APACrefauthors}Pérez-Escudero, A., Vicente-Page, J., Hinz, R.C., Arganda, S.\BCBL De Polavieja, G.G. \APACrefYearMonthDay2014. \BBOQ\APACrefatitleidTracker: tracking individuals in a group by automatic identification of unmarked animals idtracker: tracking individuals in a group by automatic identification of unmarked animals.\BBCQ \APACjournalVolNumPagesNature methods117743–748. \PrintBackRefs\CurrentBib
- Potts \BOthers. (\APACyear2016) \APACinsertmetastarpotts2016{APACrefauthors}Potts, S.G., Imperatriz-Fonseca, V., Ngo, H.T., Aizen, M.A., Biesmeijer, J.C., Breeze, T.D.\BDBLothers \APACrefYearMonthDay2016. \BBOQ\APACrefatitleSafeguarding pollinators and their values to human well-being Safeguarding pollinators and their values to human well-being.\BBCQ \APACjournalVolNumPagesNature5407632220–229. \PrintBackRefs\CurrentBib
- Rader \BOthers. (\APACyear2016) \APACinsertmetastarrader2016{APACrefauthors}Rader, R., Bartomeus, I., Garibaldi, L.A., Garratt, M.P., Howlett, B.G., Winfree, R.\BDBLothers \APACrefYearMonthDay2016. \BBOQ\APACrefatitleNon-bee insects are important contributors to global crop pollination Non-bee insects are important contributors to global crop pollination.\BBCQ \APACjournalVolNumPagesProceedings of the National Academy of Sciences1131146–151. \PrintBackRefs\CurrentBib
- Ratnayake \BOthers. (\APACyear2021\APACexlab\BCnt1) \APACinsertmetastarRatnayake_2021_CVPR{APACrefauthors}Ratnayake, M.N., Dyer, A.G.\BCBL Dorin, A. \APACrefYearMonthDay2021\BCnt1. \BBOQ\APACrefatitleTowards Computer Vision and Deep Learning Facilitated Pollination Monitoring for Agriculture Towards computer vision and deep learning facilitated pollination monitoring for agriculture.\BBCQ \APACrefbtitleProceedings of the IEEE/CVF Conference on Computer Vision and Pattern Recognition Proceedings of the ieee/cvf conference on computer vision and pattern recognition (\BPGS 2921–2930). \PrintBackRefs\CurrentBib
- Ratnayake \BOthers. (\APACyear2021\APACexlab\BCnt2) \APACinsertmetastar10.1371/journal.pone.0239504{APACrefauthors}Ratnayake, M.N., Dyer, A.G.\BCBL Dorin, A. \APACrefYearMonthDay2021\BCnt2. \BBOQ\APACrefatitleTracking individual honeybees among wildflower clusters with computer vision-facilitated pollinator monitoring Tracking individual honeybees among wildflower clusters with computer vision-facilitated pollinator monitoring.\BBCQ \APACjournalVolNumPagesPlos one162e0239504. \PrintBackRefs\CurrentBib
- Real (\APACyear2012) \APACinsertmetastarreal2012pollination{APACrefauthors}Real, L. \APACrefYear2012. \APACrefbtitlePollination biology Pollination biology. \APACaddressPublisherElsevier. \PrintBackRefs\CurrentBib
- Redmon \BBA Farhadi (\APACyear2017) \APACinsertmetastarredmon2016yolo9000{APACrefauthors}Redmon, J.\BCBT \BBA Farhadi, A. \APACrefYearMonthDay2017. \BBOQ\APACrefatitleYOLO9000: better, faster, stronger Yolo9000: better, faster, stronger.\BBCQ \APACrefbtitleProceedings of the IEEE conference on computer vision and pattern recognition Proceedings of the ieee conference on computer vision and pattern recognition (\BPGS 7263–7271). \PrintBackRefs\CurrentBib
- Rollin \BBA Garibaldi (\APACyear2019) \APACinsertmetastarrollin2019impacts{APACrefauthors}Rollin, O.\BCBT \BBA Garibaldi, L.A. \APACrefYearMonthDay2019. \BBOQ\APACrefatitleImpacts of honeybee density on crop yield: A meta-analysis Impacts of honeybee density on crop yield: A meta-analysis.\BBCQ \APACjournalVolNumPagesJournal of Applied Ecology5651152—1163. \PrintBackRefs\CurrentBib
- Schweiger \BOthers. (\APACyear2010) \APACinsertmetastarschweiger2010multiple{APACrefauthors}Schweiger, O., Biesmeijer, J.C., Bommarco, R., Hickler, T., Hulme, P.E., Klotz, S.\BDBLothers \APACrefYearMonthDay2010. \BBOQ\APACrefatitleMultiple stressors on biotic interactions: how climate change and alien species interact to affect pollination Multiple stressors on biotic interactions: how climate change and alien species interact to affect pollination.\BBCQ \APACjournalVolNumPagesBiological Reviews854777–795. \PrintBackRefs\CurrentBib
- Sekachev \BOthers. (\APACyear2019) \APACinsertmetastarcvat{APACrefauthors}Sekachev, B., Manovich, N.\BCBL Zhavoronkov, A. \APACrefYearMonthDay2019. \APACrefbtitleComputer Vision Annotation Tool. Computer vision annotation tool. \APACaddressPublisherZenodo. \APACrefnoteGitHub: https://github.com/opencv/cvat {APACrefDOI} 10.5281/zenodo.3497106 \PrintBackRefs\CurrentBib
- Settele \BOthers. (\APACyear2016) \APACinsertmetastarsettele2016climate{APACrefauthors}Settele, J., Bishop, J.\BCBL Potts, S.G. \APACrefYearMonthDay2016. \BBOQ\APACrefatitleClimate change impacts on pollination Climate change impacts on pollination.\BBCQ \APACjournalVolNumPagesNature Plants271–3. \PrintBackRefs\CurrentBib
- Simons \BBA Chabris (\APACyear1999) \APACinsertmetastarsimons1999{APACrefauthors}Simons, D.J.\BCBT \BBA Chabris, C.F. \APACrefYearMonthDay1999. \BBOQ\APACrefatitleGorillas in our midst: Sustained inattentional blindness for dynamic events Gorillas in our midst: Sustained inattentional blindness for dynamic events.\BBCQ \APACjournalVolNumPagesperception2891059–1074. \PrintBackRefs\CurrentBib
- Spaethe \BOthers. (\APACyear2001) \APACinsertmetastarspaethe2001visual{APACrefauthors}Spaethe, J., Tautz, J.\BCBL Chittka, L. \APACrefYearMonthDay2001. \BBOQ\APACrefatitleVisual constraints in foraging bumblebees: flower size and color affect search time and flight behavior Visual constraints in foraging bumblebees: flower size and color affect search time and flight behavior.\BBCQ \APACjournalVolNumPagesProceedings of the National Academy of Sciences9873898–3903. \PrintBackRefs\CurrentBib
- Spencer \BOthers. (\APACyear2020) \APACinsertmetastar10.1016/j.fooweb.2020.e00144{APACrefauthors}Spencer, E.E., Barton, P.S., Ripple, W.J.\BCBL Newsome, T.M. \APACrefYearMonthDay2020. \BBOQ\APACrefatitleInvasive European wasps alter scavenging dynamics around carrion Invasive european wasps alter scavenging dynamics around carrion.\BBCQ \APACjournalVolNumPagesFood Webs24e00144. \PrintBackRefs\CurrentBib
- Stojnić \BOthers. (\APACyear2021) \APACinsertmetastarstojnic2021method{APACrefauthors}Stojnić, V., Risojević, V., Muštra, M., Jovanović, V., Filipi, J., Kezić, N.\BCBL Babić, Z. \APACrefYearMonthDay2021. \BBOQ\APACrefatitleA method for detection of small moving objects in UAV videos A method for detection of small moving objects in uav videos.\BBCQ \APACjournalVolNumPagesRemote Sensing134653. \PrintBackRefs\CurrentBib
- Su \BOthers. (\APACyear2021) \APACinsertmetastarsu2021data{APACrefauthors}Su, D., Kong, H., Qiao, Y.\BCBL Sukkarieh, S. \APACrefYearMonthDay2021. \BBOQ\APACrefatitleData augmentation for deep learning based semantic segmentation and crop-weed classification in agricultural robotics Data augmentation for deep learning based semantic segmentation and crop-weed classification in agricultural robotics.\BBCQ \APACjournalVolNumPagesComputers and Electronics in Agriculture190106418. \PrintBackRefs\CurrentBib
- Vanbergen \BBA Initiative (\APACyear2013) \APACinsertmetastarecosystemadam{APACrefauthors}Vanbergen, A.J.\BCBT \BBA Initiative, t.I.P. \APACrefYearMonthDay2013. \BBOQ\APACrefatitleThreats to an ecosystem service: pressures on pollinators Threats to an ecosystem service: pressures on pollinators.\BBCQ \APACjournalVolNumPagesFrontiers in Ecology and the Environment115251–259. \PrintBackRefs\CurrentBib
- van der Kooi \BOthers. (\APACyear2019) \APACinsertmetastarvan2019thermal{APACrefauthors}van der Kooi, C.J., Kevan, P.G.\BCBL Koski, M.H. \APACrefYearMonthDay2019. \BBOQ\APACrefatitleThe thermal ecology of flowers The thermal ecology of flowers.\BBCQ \APACjournalVolNumPagesAnnals of Botany1243343–353. \PrintBackRefs\CurrentBib
- Van Horn \BOthers. (\APACyear2018) \APACinsertmetastarvan2018inaturalist{APACrefauthors}Van Horn, G., Mac Aodha, O., Song, Y., Cui, Y., Sun, C., Shepard, A.\BDBLBelongie, S. \APACrefYearMonthDay2018. \BBOQ\APACrefatitleThe inaturalist species classification and detection dataset The inaturalist species classification and detection dataset.\BBCQ \APACrefbtitleProceedings of the IEEE conference on computer vision and pattern recognition Proceedings of the ieee conference on computer vision and pattern recognition (\BPGS 8769–8778). \PrintBackRefs\CurrentBib
- Walter \BBA Couzin (\APACyear2021) \APACinsertmetastarwalter2021trex{APACrefauthors}Walter, T.\BCBT \BBA Couzin, I.D. \APACrefYearMonthDay2021. \BBOQ\APACrefatitleTRex, a fast multi-animal tracking system with markerless identification, and 2D estimation of posture and visual fields Trex, a fast multi-animal tracking system with markerless identification, and 2d estimation of posture and visual fields.\BBCQ \APACjournalVolNumPageseLife10e64000. \PrintBackRefs\CurrentBib
- Wang \BOthers. (\APACyear2016) \APACinsertmetastar7727770{APACrefauthors}Wang, S., Liu, W., Wu, J., Cao, L., Meng, Q.\BCBL Kennedy, P.J. \APACrefYearMonthDay2016. \BBOQ\APACrefatitleTraining deep neural networks on imbalanced data sets Training deep neural networks on imbalanced data sets.\BBCQ \APACrefbtitle2016 international joint conference on neural networks (IJCNN) 2016 international joint conference on neural networks (ijcnn) (\BPGS 4368–4374). \PrintBackRefs\CurrentBib
- Wood \BOthers. (\APACyear2020) \APACinsertmetastarwood2020managed{APACrefauthors}Wood, T.J., Michez, D., Paxton, R.J., Drossart, M., Neumann, P., Gerard, M.\BDBLothers \APACrefYearMonthDay2020. \BBOQ\APACrefatitleManaged honey bees as a radar for wild bee decline? Managed honey bees as a radar for wild bee decline?\BBCQ \APACjournalVolNumPagesApidologie5161100–1116. \PrintBackRefs\CurrentBib
- Yang \BOthers. (\APACyear2018) \APACinsertmetastaryang2018{APACrefauthors}Yang, C., Collins, J.\BCBL Beckerleg, M. \APACrefYearMonthDay2018. \BBOQ\APACrefatitleA model for pollen measurement using video monitoring of honey bees A model for pollen measurement using video monitoring of honey bees.\BBCQ \APACjournalVolNumPagesSensing and Imaging1911–29. \PrintBackRefs\CurrentBib
- Zivkovic \BBA Van Der Heijden (\APACyear2006) \APACinsertmetastarzivkovic2006efficient{APACrefauthors}Zivkovic, Z.\BCBT \BBA Van Der Heijden, F. \APACrefYearMonthDay2006. \BBOQ\APACrefatitleEfficient adaptive density estimation per image pixel for the task of background subtraction Efficient adaptive density estimation per image pixel for the task of background subtraction.\BBCQ \APACjournalVolNumPagesPattern recognition letters277773–780. \PrintBackRefs\CurrentBib