Role of liquid driving on the clogging of constricted particle suspensions
Abstract
Forcing dense suspensions of non-cohesive particles through constrictions might either result in a continuous flow, an intermittent one, or indefinite interruption of flow, i.e., a clog. While one of the most important (and obvious) controlling parameters in such a system is the neck-to-particle size ratio, the role of the liquid driving method is not so obvious. On the one hand, wide-spread volume-controlled systems result in pressure and local liquid velocity increases upon eventual clogs. On the other hand, pressure-controlled systems result in a decrease of the flow through the constriction when a clog is developed. The root of the question therefore lies on the role of interparticle liquid flow and hydrodynamic forces on both the formation and stability of an arch blocking the particle transport through a constriction. In this work, we experimentally analyse a suspension of non-cohesive particles in channels undergoing intermittent regimes, in which they are most sensitive to parametric changes. By exploring the statistical distribution of arrest times and of discharged particles, we surprisingly find that the transport of non-cohesive suspensions through constrictions actually follows a “slower is faster” principle under certain conditions.
I Introduction
The blockage of mass flow through constrictions is unfortunately a common issue in industrial processes, which is typically solved by simply substituting the clogged portion of the conduct, with the subsequent elevated costs. This phenomenon can manifest in different ways depending on the nature of the material being transported. For example, when colloidal suspensions are being passed through narrow passages, colloidal particles often feel an attraction towards the walls and to each other. Under such conditions, particles tend to accumulate in the vicinity of the walls and such a particle aggregate can grow until it blocks the channel (Wyss et al., 2006; Delouche et al., 2021). In such circumstances, cohesive suspensions can also provoke clogs by successive deposition, particles progressively depositing on the wall thus reducing the constriction size (Agbangla et al., 2012; Delouche et al., 2020; Dersoir et al., 2015; Duru and Hallez, 2015).
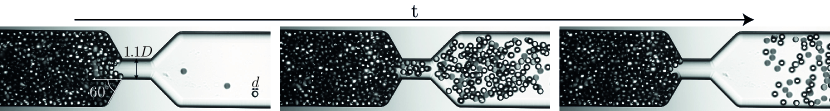
Nonetheless, particles can also clog a constriction purely by mechanical forces, in the absence of cohesive forces towards the wall or towards other particles. This can easily occur when particles (typically larger than colloidal size) form a stable arch that blocks the outlet or the narrow channel, see Figure 1. This is a common way of blocking a passage, not only in granular systems (Zuriguel et al., 2014), but also in car traffic flow (Helbing and Nagel, 2004), people escaping in panic (Garcimartín et al., 2016) or in animal herds (Garcimartín et al., 2015). Although arching in suspensions has several analogies with such many-body systems, suspensions have the special feature of being a two-phase flow, in which both particles and liquid must pass through the constriction. This is a clear and crucial difference, but its implications are still unclear.
Statistical analysis on many-body flow through constrictions have identified very clear patterns (Zuriguel and Garcimartín, 2020) also in suspensions flows (Marin et al., 2018; Souzy et al., 2020), but the role of the liquid flow is far from being well understood. A fluidic system like the one shown in Figure 1 can be driven by forcing a constant volume of fluid (volume-controlled), which will drag the solid particles along. When an arch is formed, the flow encounters high hydrodynamic resistance in the constriction and the local liquid velocity at the constriction will increase. On the contrary, if the system is driven by a hydrodynamic pressure difference, the liquid flow velocity will reduce at the constriction. Which situation will be more favourable for the mass transport through the constriction? in other words, does a higher local flow velocity at the constriction favour the particle transport or does it rather stabilize arches by pushing particles harder together? the answer is far from trivial.
In order to answer this crucial question, in this paper we aim to elucidate the role of the liquid driving method in constricted flows of non-cohesive suspensions, in which the arch formation is entirely due to mechanical forces. Our method is based on reproducible experiments with significant amount of data from which we can obtain significant statistics on both arch formation and destruction. Since the parametric space is so large, we choose to perform in experiments in systems undergoing an intermittent flow regime, in which they are most sensitive to the control parameters. Using the same statistical tools as those employed in granular matter permits us also to make a direct comparison to those “dry” counterparts and have a deeper understanding on the role of liquid flow in the clogging of constricted suspensions by mechanical forces.
II Experiments
Our experimental system is designed to flow in both pressure or volume-controlled driving in an intermittent regime, in which particles flow in bursts, interrupted by the formation of a particle arch that interrupts the flow. Our aim is to obtain (1) the average amount of particles per burst and (2) the probability distribution of time-lapses, the time passing between bursts. The particle flow is characterized experimentally using these statistical tools, which assess how the system responds to either pressure or liquid volume-rate changes.
The experimental set-up is shown in Figure 1. The fluidic system consists of a transparent straight channel of borosilicate glass (isotropic wet etching, Micronit microfluidics) with a rectangular cross-section of which reduces to an almost square cross-section of to form the neck. The constriction is achieved by a linear narrowing of the channel with a half-angle of 60°. This specific design, similar of that used in previous studies (Marin et al., 2018; Souzy et al., 2020), forms a two-dimensional nozzle converging towards the neck. Particles and liquid have been carefully chosen to avoid buoyancy effects, particle aggregation and particle deposition at the micro-channel walls, an effect which has already been previously analysed (Dressaire and Sauret, 2017; Cejas et al., 2017; Delouche et al., 2020, 2021; Sendekie and Bacchin, 2016). The suspension consists of monodisperse spherical polystyrene particles of diameter ). Adopting the neck height as the characteristic length scale, these correspond to neck-to-particle ratios , respectively. Particles are stabilized with negatively charged sulfate groups (Microparticles GmbH) in a density-matched 26.3 wt% aqueous solution of glycerine, with a density kg/m3 and a viscosity mPa.s (Volk and Kähler, 2018). The charged sulfate groups confer them a small negative surface potential (on the order of mV) but sufficient to prevent both their agglomeration and their adhesion to the channel walls (Sendekie and Bacchin, 2016). The suspension is prepared with a particle volume fraction of about , then inserted in the device and driven downstream the constriction towards a filter which only allows only the fluid to flow through. Particles are therefore initially concentrated in that position.
The protocol is similar to the one used in Souzy et al. (2020): an experiment starts when the flow is reversed and particles are dragged by the fluid towards the constriction. The particle volume fraction as the particle reach the constriction is , and the suspension is imaged with a high-speed CMOS camera (PCO.dimax CS1) coupled to an inverted microscope (Nikon Instruments, Eclipse TE2000-U). Figure 1 presents successive snapshots of a typical intermittent flow experience. The flow may become interrupted by the spontaneous formation of arches spanning the bottleneck (left panel). Although the particle flow is abruptly interrupted, the fluid keeps passing through the particles interstices, perturbing the arches which may eventually collapse (Cates et al., 1998). If this happens, the flow of particles is resumed (middle panel) and a burst of particles escape until the development of a new clog arrests the flow again (right panel). Note that arches are stabilized by the mutual friction among particles (Sendekie and Bacchin, 2016; Wyss et al., 2006; Agbangla et al., 2014), implying that, despite the presence of electrostatic stabilization, particle-to-particle contact is unavoidable. However, these contacts are not long-lasting as particles separate downstream the constriction upon resuming the flow.
Before discussing about the driving force inducing the flow, we would like to assert two major comments regarding this experimental set-up: (i) the sole possible clogging mechanism here is by arching, when particles arriving simultaneously at the constriction form an arch which interrupt the flow of particles, i.e. competition of too many particles for little space (Dressaire and Sauret, 2017; Sendekie and Bacchin, 2016). Therefore, clogging can not occur by aggregation (Delouche et al., 2021), successive deposition (Agbangla et al., 2012; Delouche et al., 2020; Dersoir et al., 2015; Duru and Hallez, 2015)) or sieving ( particles being larger than the constriction (Sauret et al., 2014)). (ii) the reason for using such particle size range is dual: on the one hand, we avoid colloidal particle interactions and Brownian motion as the Péclet number , with where is the Boltzmann constant, and is the room temperature. On the other hand, increasing the particle size also involves the flow control of larger volumes of fluid, larger Reynolds number and higher working pressures. Therefore, the range of particle size chosen allows us to work with highly monodisperse particles interacting mainly by hydrodynamic interactions and low-pressure solid contacts, manipulated via microfluidic technology, which allows us to obtain a high degree of control and reproducibility difficult to achieve at other length scales.
II.1 Controlling the liquid driving
To investigate the role of the liquid driving on the clogging/unclogging of constricted particle suspensions, we performed two sets of experiments, where we drive the flow imposing either the flow rate (volume-controlled), either the pressure (pressure-controlled). In both cases, we report the results obtained for neck-to-particle size ratios . These specific values of the neck-to-particle size ratios are selected as they allow to explore the limits of aspect ratios for which intermittency has been reported in previous study performed within the same setup (Souzy et al., 2020).
II.1.1 Volume-controlled driving
In the first set of experiments, the suspension is driven through the constriction at a constant volume flux using a syringe pump (Harvard Apparatus). The flow rate is varied within the range ml/min, and the average particle velocity at the constriction neck ranges from mm/s, corresponding to Reynolds numbers in the range . Note that, even at the highest pressures, the flow is always viscosity-dominated. Reynolds numbers are employed here simply as a way to non-dimensionalise velocities, since the only time scales in the system are given by the driven flow and the liquid’s viscosity. The average particle velocity is used to define the Stokes time (the time a particle takes to travel its own diameter), which will be used as the characteristic time scale. The use of a syringe pump implies that a constant liquid volume flux is forced through the channel, even when an arch forms at the bottleneck blocking particles. In that case, only liquid flows through the bottleneck and pressure increases due to the increased hydrodynamic resistance. For safety, the upstream pressure is measured and the experiment is stopped and re-initialized to avoid damage in the setup if the pressure reaches 700 kPa.
II.1.2 Pressure-controlled driving
The second set of experiments is performed driving the flow with a constant pressure using a microfluidic flow control system (Fluigent). The pressure is varied within the range kPa, and the average particle velocity at the constriction neck ranges from mm/s, corresponding to Reynolds number . Driving the flow with a constant pressure implies that when a clog forms, the hydraulic resistance rapidly increases as the particles accumulate upstream the constriction neck (Kim et al., 2017; Sauret et al., 2018). Constant pressure configuration can thus be considered as self-regulated: the clog reduces both the liquid and particle flow.
III Results
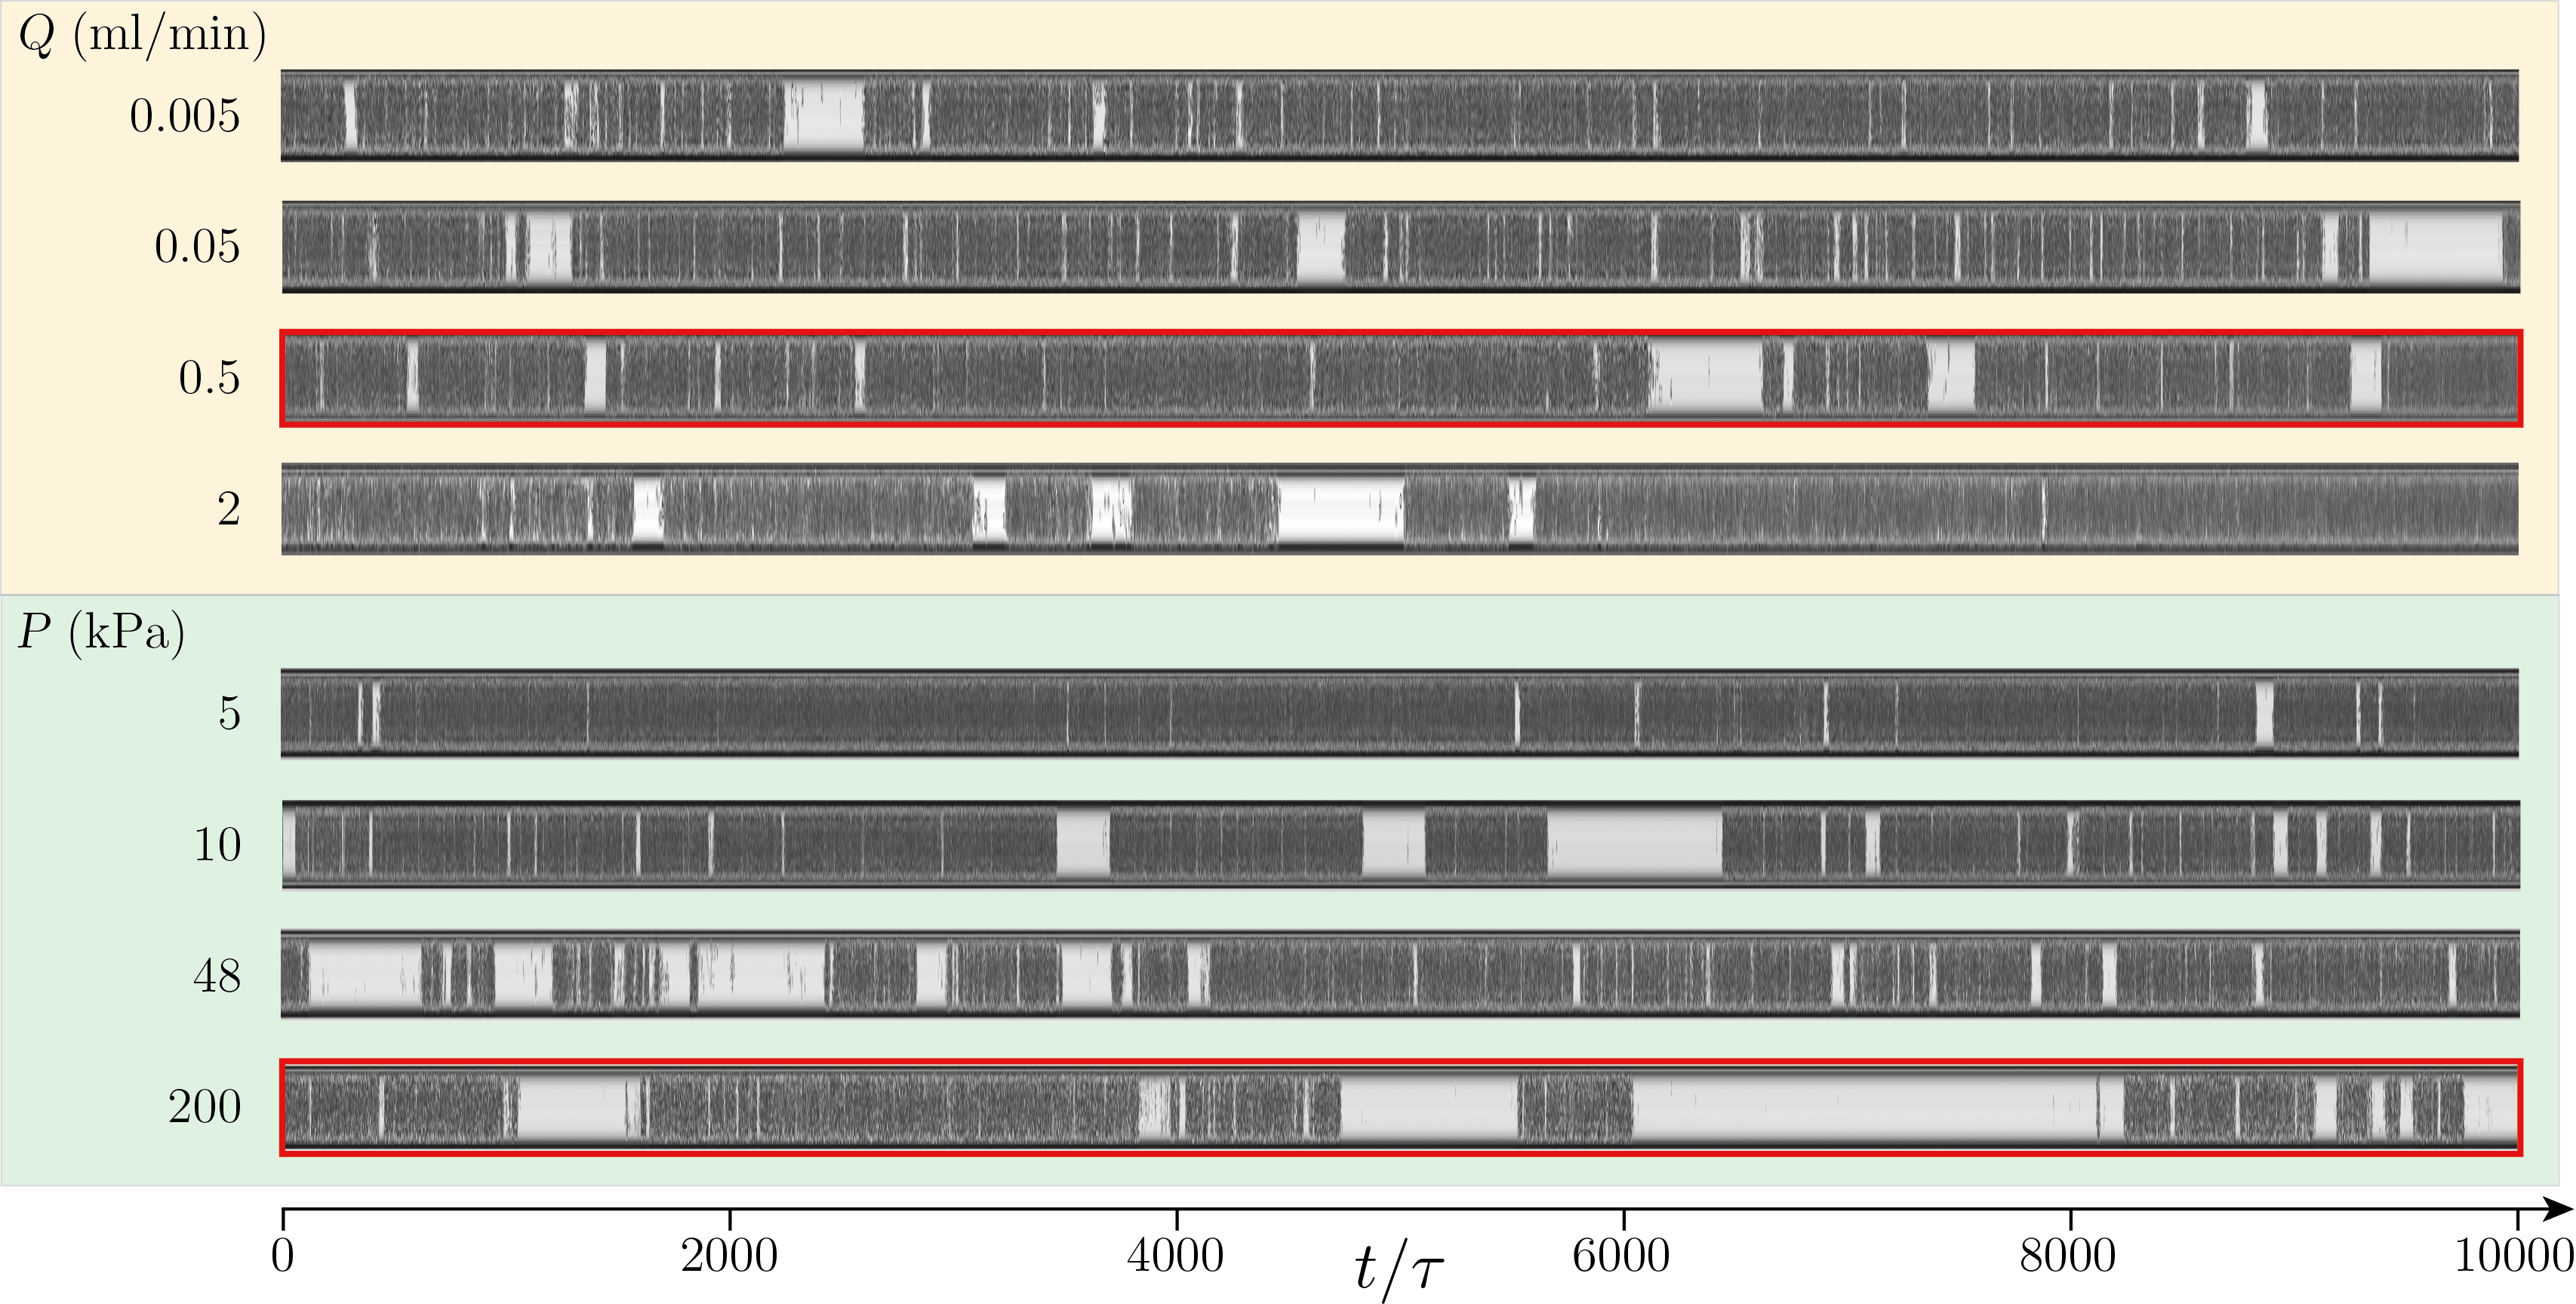
The overall intermittent behaviour, in which several flow and arrested periods of time alternate, can be better visualized in spatio-temporal diagrams as shown in Figure 2111As a guide to the eyes, in the figures an orange background refer to the volume-controlled configuration while a green background refer to the pressure driven configuration.. There, in order to analyze the different regimes of particle flow, we report the results obtained for . A spatio-temporal diagram is constructed by selecting a vertical line of unit pixel width at the middle of the constriction. This line is then sampled for every frame and is stacked alongside. Interestingly, for the volume-controlled driving (top orange panels), there is no clear qualitative difference in the flow behaviour in the investigated range of flow rate. Conversely, for the pressure-controlled driving (bottom green panels), the diagrams clearly reveal a difference in the flow behaviour: for kPa, the flow of particles (which appears in dark) is almost continuous, with only few short-lasting arrest times (which appears in light grey). As is increased up to kPa, less particles escape when a burst of particles is released, and the arrest times become longer and more abundant.
In what follows, we will quantify the intermittent dynamics by analyzing separately the arch formation and destruction processes by looking at the statistics of burst sizes and arrest times respectively.
III.1 Arch formation/clogging probability
Similarly to pedestrians (Garcimartín et al., 2016), animal flocks (Garcimartín et al., 2015) and avalanches (Fisher, 1998), the number of entities escaping per burst has been found to follow an exponential distribution in constricted flow of suspensions (Souzy et al., 2020). This reveals that the arch formation follows a Poissonian process, with an exponential dependence of the discharged particle mass with the neck-to-particle size ratio. Consequently, one can estimate the clogging probability by estimating the average number of escaping particles per burst.
Given the discrete nature of the system, defining an arrest time threshold to set apart successive bursts is not straightforward. We define a clog event as any event where the time lapse between the passage of two consecutive particles is such that , where is the characteristic Stokes time. We checked that this arbitrary choice does not affect the general trend of our results.
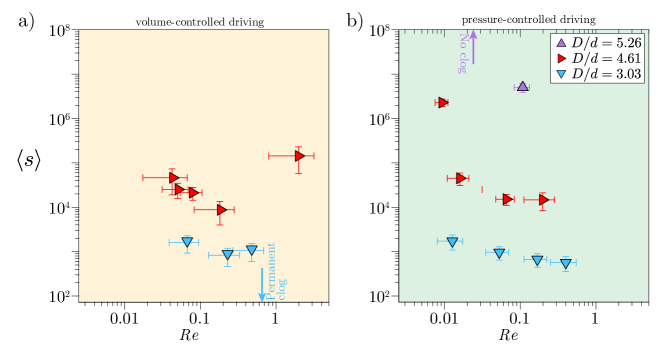
Figure 3 shows for various neck-to-particle size ratios . The error bars stand for the standard deviation of the flowing particle velocity measurement , obtained by performing Particle Image Velocimetry at the constriction neck when particles are flowing. More than 1500 bursts have been analysed in each case. As it is well-known in dry systems (To et al., 2001; Zuriguel et al., 2005; Thomas and Durian, 2015), the neck-to-particle size ratio is the governing parameter for the intermittent clogging statistics, therefore it is not surprising to observe a steep increase of for higher .
For the volume-controlled configuration (Figure 3a, left orange panel), we can first observe that varying the flow rate has a minor effect on the clogging probability, as remains almost constant over the investigated range of . The average number of escapees increases one or two orders of magnitude when we reduce the particle size by just 33% (from to 4.61). An even smaller relative decrease of the particle size results in a continuous flow of particles for , in which could not be defined (over the range of investigated ), which is consistent with what was reported in Souzy et al. (2020). On the other side of the parametric range of this intermittent regime, for larger particle sizes, no intermittency is observed for after a critical Reynolds number/flow rate ( ml/min). After this critical point, any particle arch is either permanent or lasting more than our largest measurable timescale. This is limited by the maximum time that can be captured on our camera’s digital memory, which sets the maximum number of frames that we can capture on each experiment. Nonetheless, the experiments are designed to guarantee that the duration of each movie is at least four orders of magnitude larger than the Stokes time 222The maximum number of frames we can acquire is . For this particular experiment (, flow rate mL/min), running the camera at 5000 fps sets the maximum recording time to 13 sec, which represents roughly more than 10 000 stokes time based on the flow of particles that manage to get through the constriction prior to the eventual formation of a ‘permanent’ arch..
For the pressure-controlled configuration (Figure 3b, right green panel), the trend is noticeably different. A pressure increase (and therefore in particle velocity and ) clearly leads to a decrease in the average number of escapees , thus increasing the clogging probability. Note that this is in direct contradiction with results reported for clogging with cohesive suspensions, in which clogs are built up by successive deposition. In such cases, higher pressure leads to increased shear and to the detachment of deposited particles, and thus to a decrease of the clogging probability (Delouche et al., 2021; Dersoir et al., 2015; Kim et al., 2017). It is nonetheless a striking result even in the absence of cohesive forces, as it reveals a fundamental and yet unexpected effect of the driving force on the clog development process for constricted particle suspensions. This result can be observed for instance by comparing the case of under different driving. For comparable particle velocities (, in volume-controlled, and , in pressure-controlled, highlighted with red-frames both in Figure 2 and Table 1), we obtain 10 times more escapees for a volume-controlled than with the pressure-controlled system. The same trend is observed for the other data sets in different manners. At first glance, the values of for the largest particle size look comparable for both driving methods. However, the pressure-driven set has a clearer inverse dependency with increased pressure. Interestingly, the intermittent regime remains stable up to in the pressure-driven case, while it clogs permanently for the volume-controlled case. Another remarkable example of such a trend between imposing the flow rate and the pressure is given for the smallest particle size, corresponding to : for comparable particle velocities, we observe a continuous particle flow when the flow rate is imposed, while the flow is intermittent for the pressure-driven configuration.
It has been previously suggested that clogging in constricted suspensions by mechanical forces occurs when the particle rate reaches certain critical value, below which bridging will not occur since hydrodynamic forces at the constriction have to overcome the repulsion barrier (Agbangla et al., 2012; Hsu et al., 2021). Our results reveal that clogging by arching of non-cohesive suspensions is not only set by the particle velocity (Ramachandran and Fogler, 1999; Guariguata et al., 2012) but also by the liquid driving choice, as for a given aspect ratio and particle velocity, different qualitative and quantitative behaviour is observed depending on whether the flow is driven imposing a flow rate or pressure.
While the dependence of the arch formation on the liquid driving method is kind of subtle in the data shown so far, it will be much more noticeable on the arch destruction process, which will be analysed using the statistical distribution of time-lapses.
III.2 Arch destruction/unclogging probability
In order to investigate the unclogging process, we now turn to analyse the probability distributions of time lapses between the passage of consecutive particles. This approach has been extensively implemented in previous studies on intermittent flowing systems, such as hungry sheep herds (Garcimartín et al., 2015), pedestrian crowds (Helbing et al., 2005; Krausz and Bauckhage, 2012; Garcimartín et al., 2016), mice escaping a water pool (Saloma et al., 2003), or vibrated silos of dry granular material (Janda et al., 2009; Lastakowski et al., 2015). In such systems, the distribution of arrested time lapses exhibits a power-law tail , a signature of systems susceptible of clogging (Zuriguel et al., 2014; Zuriguel and Garcimartín, 2020). Furthermore, the value of the exponent can be directly related to the long-term behaviour of the system: the average time lapses can only be defined for distributions fulfilling , while diverges for . This feature has therefore been interpreted as a transition to a scenario in which a permanent clog could eventually occur with finite probability. Indeed, for , there is a non-zero probability of observing everlasting clogs, while for , the system can be temporary blocked due to the formation of clogs but no arch will persist infinitely. More detailed discussions can be found in Zuriguel et al. (2014), Zuriguel and Garcimartín (2020), or in Garcimartín et al. (2021).
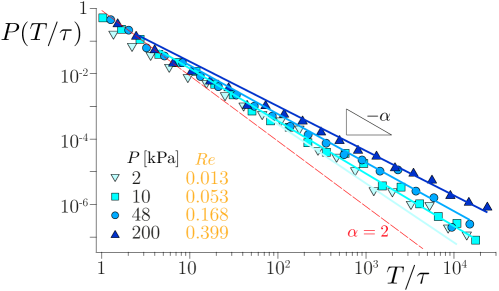
Figure 4 presents the probability distribution of the arrest lapses obtained for with pressure-controlled driving. The distribution exhibits the characteristic power-law tail . The time lapse probability distribution is obtained for (corresponding to kPa) . Note that we have been able to measure time lapses up to four orders of magnitude larger than the Stokes time, and that around 2000 bursts have been analyzed for each investigated configuration. Finding the right parameters for power-law tails can easily suffer from arbitrary biases, therefore the exponent of the power-law tail is obtained using the rigorous and widely accepted Clauset-Shalizi-Newman method (Clauset et al., 2009), which also yields the estimated error of the fit.
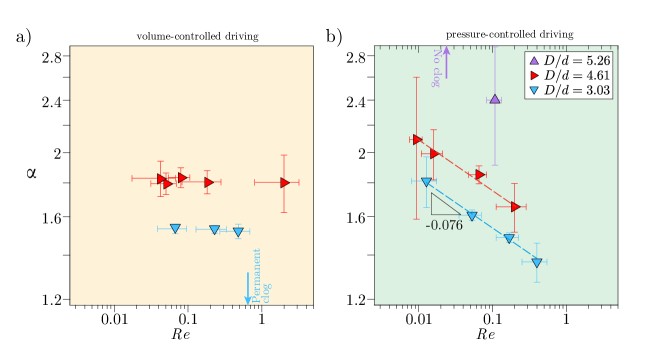
Figure 5 presents the value of , for various neck-to-particle size ratios and different liquid driving methods. The first thing to notice, as previously reported (Souzy et al., 2020), is that the value of decreases significantly with the neck-to-particle size ratios . This is expected: the smaller the particles, the higher the value of , thus the higher is the probability of unclogging. This highlights the fact that arches composed of more particles are less stable, and thus more prone to break due to the perturbations induced by the interstitial flow. In other words, shorter arches are stronger than longer ones.
The response of the system to different driving liquid methods is here more noticeable: for the volume-controlled configuration (Figure 5a, left orange panel), the exponent remains constant over more than two decades of flow rate values, while there is a clear and robust dependence for the pressure-controlled configuration (Figure 5b, right green panel). More specifically, in the pressure-controlled configuration, exhibits a clear power-law decrease which is well fitted by over two decades. This trend is found consistently both for and . The decrease in indicates that, for higher imposed pressure, the probability of breaking an arch decreases. Again, note that this is precisely the opposite trend observed with cohesive suspensions (Delouche et al., 2021; Dersoir et al., 2015; Kim et al., 2017). As mentioned in the previous section, for the flow is found to be intermittent only for ( kPa), thus the exponent could only be determined for the maximum experimental pressure we could impose.
![[Uncaptioned image]](/html/2205.04354/assets/x5.png)
IV Discussions & Conclusion
Using direct visualization at the particle scale, flow measurements and statistical techniques, we investigate the role of the liquid driving in the intermittent flow of non-cohesive particle suspension through a constriction by reporting the average number of escapees per burst (which reflects the probability of clogging), and the exponent of the power-law tail of the distribution of arrest time (which reflects the probability of breaking a clog).
Our aim was to answer the apparently trivial question: will more particles pass through the constriction if we “push” harder? The answer we have found is non-trivial and it depends on the way the liquid is being driven through the channel. Our results reveal striking discrepancies for both the clog development process and the clog destruction process, depending on whether the flow rate or the pressure is imposed.
When a constant liquid flow rate is imposed, both and appear to be constant over the range ( ml/min), the statistics of forming or breaking an arch are practically independent on the flow rate imposed. There is however an exception for the largest particle size tested (), for which we observe a sudden transition from intermittent to permanent clog when the is increased from 0.48 to 0.6 (3a and 5a). We do not have a clear explanation to this sudden transition. It could be due to certain critical behaviour at a certain flow rate, but it could also be an experimental limitation due to our limited time to capture long enough arrest times. Note that these results are in agreement with our previous work (Souzy et al., 2020), performed in volume-controlled configuration, for which we only found intermittent regimes with . Consequently, our previous and current results imply that volume-control leads to intermittent regimes with high probability of persistent clogs.
For the pressure-controlled configuration, both and decrease when increasing the pressure . Such trend is found consistently for and . For the smallest particle size (), the system flows continuously for low pressures, and it becomes intermittent after increasing the pressure (or ) above certain value (kPa, ). Remarkably, for and , values of were found in the pressure-controlled configuration, thus indicating that the intermittent regimes would continue indefinitely, with clogs that would not persist. Thus, in the pressure-controlled configuration, a non-cohesive suspension passing through a constriction behaves similarly to other scenarios where clogging transitions have been reported based on the power-law tails of the arrest times, like vibrated silos (Janda et al., 2009), Brownian particles (Hidalgo et al., 2018), pedestrians (Zuriguel et al., 2014), and self-propelled robots (Patterson et al., 2017). All those systems reported a fairly smooth transition from an intermittent clogged state () to a continuous flow, passing through a region of intermittent flow with .
| Gravity (Arévalo et al., 2014) | Vibrations (Mankoc et al., 2009; Janda et al., 2009) | |||||||
|---|---|---|---|---|---|---|---|---|
| Dry granular |
|
|
||||||
| Driving pressure | Temperature (Hidalgo et al., 2018) | |||||||
| Non-cohesive suspension |
|
|
It is unclear for us why such a smooth transition does not occur with a volume-controlled driving. At this respect, note that due to the narrow size distribution of our particles, the number of particle configurations that result in a stable arch is greatly reduced. That might have an impact in the different regimes that could manifest, and could be an explanation for the sudden transition from an intermittent clogged state () to a continuous flow regime in the volume-controlled driving. Nevertheless, whether such regime () exists or not in the volume-controlled driving configuration remains an open question, which we will continue studying in the future.
We could rationalize the results in the following way. On the one hand, the arch formation follows generally similar trends for both liquid driving configurations, and it follows an intuitive trend: a higher particle rate leads to more chances for clog formation, and therefore a decrease of the burst size. However, quantitatively the average burst size does depend on the choice of liquid driving. For a given aspect ratio and particle velocity, different can be observed depending on whether the flow is driven imposing a flow rate or pressure. On the other hand, the clog breakup seems to be more sensitive to the driving method: The volume-controlled system responds increasing the pressure locally in the region of the arch, and therefore the flow velocity too. Particles progressively accumulate behind the newly formed arch, increasing the hydrodynamic resistance further as the aggregate’s length increase. Since the liquid flow rate needs to be kept constant, the liquid velocity, and therefore the drag pushing particles together increases. This would lead to an increased and more stable contact chain force network, probably close to jamming, following Cates’s approach (Cates et al., 1998). That compact network imposes such a large hydrodynamic resistance, that a flow rate increase (in the range explored here) does not change significantly the stability of the arch. Consequently, remains effectively constant for the range of flow rates explored. However, in a pressure-controlled system, the local pressure, and therefore the liquid velocity decreases in the arch and its vicinity, leaving a rather loose packing in the region behind the arch. An increase in pressure leads to a larger compacted region behind arch stabilizing it. Therefore, lower pressure results actually in less stable archs, which translates into better particle transport: a fluid-dynamical version of the “slower is faster” effect observed in pedestrians (Zuriguel et al., 2014).
Note that these results stand in strike contrast with what is reported for cohesive particle suspensions, which follows a more intuitive trend. The shear flow counteracts particle adhesive forces, and therefore an increase of both pressure or flow rate leads a decrease of the clogging probability (Delouche et al., 2021; Dersoir et al., 2015; Kim et al., 2017).
Our results provide new efficient strategies for controlling the flow of non-cohesive particle suspensions driven through constrictions. Several strategies have already been investigated based on different parameters (see summary in Table 2). For example, Arévalo et al. (2014) showed using simulations that gravity decreases both the probability of clogging and of unclogging for granular inert particles passing through a bottleneck. Janda et al. (2009) and Mankoc et al. (2009) both showed experimentally that for dry granular silos, applying strong vibrations decreases the clogging probability, and that the remaining clogs break also more easily. We herein show that, for non-Brownian and non-cohesive suspensions, increasing the driving pressure leads to an increase of the clogging probability and a decrease of the unclogging probability. Consequently, an efficient strategy for limiting clogging of non-cohesive particle suspension is to drive the flow imposing lower pressure.
V Acknowledgements
This work was supported by the ERC (European Research Council), Starting Grant (grant agreement No.678573). The authors would like to acknowledge the motivation for this work and insights from Iker Zuriguel.
References
- Wyss et al. (2006) H. M. Wyss, D. L. Blair, J. F. Morris, H. A. Stone, and D. A. Weitz, Physical review E 74, 061402 (2006).
- Delouche et al. (2021) N. Delouche, J. van Doorn, T. Kodger, A. Schofield, J. Sprakel, and H. Tabuteau, Journal of Membrane Science 635, 119509 (2021).
- Agbangla et al. (2012) G. C. Agbangla, É. Climent, and P. Bacchin, Separation and purification technology 101, 42 (2012).
- Delouche et al. (2020) N. Delouche, A. Schofield, and H. Tabuteau, Soft Matter 16, 9899 (2020).
- Dersoir et al. (2015) B. Dersoir, M. R. de Saint Vincent, M. Abkarian, and H. Tabuteau, Microfluidics and Nanofluidics 19, 953 (2015).
- Duru and Hallez (2015) P. Duru and Y. Hallez, Langmuir 31, 8310 (2015).
- Zuriguel et al. (2014) I. Zuriguel, D. R. Parisi, R. C. Hidalgo, C. Lozano, A. Janda, P. A. Gago, J. P. Peralta, L. M. Ferrer, L. A. Pugnaloni, E. Clément, et al., Scientific reports 4, 1 (2014).
- Helbing and Nagel (2004) D. Helbing and K. Nagel, Contemporary Physics 45, 405 (2004).
- Garcimartín et al. (2016) A. Garcimartín, D. R. Parisi, J. M. Pastor, C. Martín-Gómez, and I. Zuriguel, Journal of Statistical Mechanics: Theory and Experiment 2016, 043402 (2016).
- Garcimartín et al. (2015) A. Garcimartín, J. Pastor, L. Ferrer, J. Ramos, C. Martín-Gómez, and I. Zuriguel, Physical Review E 91, 022808 (2015).
- Zuriguel and Garcimartín (2020) I. Zuriguel and A. Garcimartín, “Statistical mechanics of clogging,” in Encyclopedia of Complexity and Systems Science, edited by R. A. Meyers (Springer Berlin Heidelberg, Berlin, Heidelberg, 2020) pp. 1–32.
- Marin et al. (2018) A. Marin, H. Lhuissier, M. Rossi, and C. J. Kähler, Physical Review E 97, 021102 (2018).
- Souzy et al. (2020) M. Souzy, I. Zuriguel, and A. Marin, Physical Review E 101, 060901 (2020).
- Dressaire and Sauret (2017) E. Dressaire and A. Sauret, Soft Matter 13, 37 (2017).
- Cejas et al. (2017) C. M. Cejas, F. Monti, M. Truchet, J.-P. Burnouf, and P. Tabeling, Langmuir 33, 6471 (2017).
- Sendekie and Bacchin (2016) Z. B. Sendekie and P. Bacchin, Langmuir 32, 1478 (2016).
- Volk and Kähler (2018) A. Volk and C. J. Kähler, Experiments in Fluids 59, 1 (2018).
- Cates et al. (1998) M. Cates, J. Wittmer, J.-P. Bouchaud, and P. Claudin, Physical review letters 81, 1841 (1998).
- Agbangla et al. (2014) G. C. Agbangla, P. Bacchin, and E. Climent, Soft Matter 10, 6303 (2014).
- Sauret et al. (2014) A. Sauret, E. C. Barney, A. Perro, E. Villermaux, H. A. Stone, and E. Dressaire, Applied Physics Letters 105, 074101 (2014).
- Kim et al. (2017) Y. Kim, K. H. Ahn, and S. J. Lee, Journal of Membrane Science 534, 25 (2017).
- Sauret et al. (2018) A. Sauret, K. Somszor, E. Villermaux, and E. Dressaire, Physical Review Fluids 3, 104301 (2018).
- Note (1) As a guide to the eyes, in the figures an orange background refer to the volume-controlled configuration while a green background refer to the pressure driven configuration.
- Fisher (1998) D. S. Fisher, Physics reports 301, 113 (1998).
- To et al. (2001) K. To, P.-Y. Lai, and H. Pak, Physical review letters 86, 71 (2001).
- Zuriguel et al. (2005) I. Zuriguel, A. Garcimartín, D. Maza, L. A. Pugnaloni, and J. Pastor, Physical Review E 71, 051303 (2005).
- Thomas and Durian (2015) C. Thomas and D. J. Durian, Physical review letters 114, 178001 (2015).
- Clauset et al. (2009) A. Clauset, C. R. Shalizi, and M. E. Newman, SIAM review 51, 661 (2009).
- Note (2) The maximum number of frames we can acquire is . For this particular experiment (, flow rate mL/min), running the camera at 5000 fps sets the maximum recording time to 13 sec, which represents roughly more than 10 000 stokes time based on the flow of particles that manage to get through the constriction prior to the eventual formation of a ‘permanent’ arch.
- Hsu et al. (2021) C.-P. Hsu, H. E. Baysal, G. Wirenborn, G. Mårtensson, L. P. Wittberg, and L. Isa, Soft Matter 17, 7252 (2021).
- Ramachandran and Fogler (1999) V. Ramachandran and H. S. Fogler, Journal of Fluid Mechanics 385, 129 (1999).
- Guariguata et al. (2012) A. Guariguata, M. A. Pascall, M. W. Gilmer, A. K. Sum, E. D. Sloan, C. A. Koh, and D. T. Wu, Physical review E 86, 061311 (2012).
- Helbing et al. (2005) D. Helbing, L. Buzna, A. Johansson, and T. Werner, Transportation science 39, 1 (2005).
- Krausz and Bauckhage (2012) B. Krausz and C. Bauckhage, Computer Vision and Image Understanding 116, 307 (2012).
- Saloma et al. (2003) C. Saloma, G. J. Perez, G. Tapang, M. Lim, and C. Palmes-Saloma, Proceedings of the National Academy of Sciences 100, 11947 (2003).
- Janda et al. (2009) A. Janda, D. Maza, A. Garcimartín, E. Kolb, J. Lanuza, and E. Clément, EPL (Europhysics Letters) 87, 24002 (2009).
- Lastakowski et al. (2015) H. Lastakowski, J.-C. Géminard, and V. Vidal, Scientific reports 5, 1 (2015).
- Garcimartín et al. (2021) A. Garcimartín, B. V. Guerrero, A. Nicolas, R. C. B. da Silva, and I. Zuriguel, in EPJ Web of Conferences, Vol. 249 (EDP Sciences, 2021) p. 03009.
- Hidalgo et al. (2018) R. Hidalgo, A. Goñi-Arana, A. Hernández-Puerta, and I. Pagonabarraga, Physical Review E 97, 012611 (2018).
- Patterson et al. (2017) G. A. Patterson, P. I. Fierens, F. S. Jimka, P. König, A. Garcimartín, I. Zuriguel, L. A. Pugnaloni, and D. R. Parisi, Physical review letters 119, 248301 (2017).
- Arévalo et al. (2014) R. Arévalo, I. Zuriguel, D. Maza, and A. Garcimartín, Physical Review E 89, 042205 (2014).
- Mankoc et al. (2009) C. Mankoc, A. Garcimartín, I. Zuriguel, D. Maza, and L. A. Pugnaloni, Physical Review E 80, 011309 (2009).