Azimuthal-sensitive three-dimensional HBT radius in Au-Au collisions at GeV by the IQMD model
Abstract
We used an Isospin dependent Quantum Molecular Dynamics (IQMD) model to simulate Au + Au collisions at beam energy = 1.23 GeV, which corresponds to center of mass energy GeV. Firstly, we obtained reasonable rapidity and transverse mass spectra of and as well as “apparent” temperature parameters in comparison with the HADES data. Then by calculating three-dimensional Hanbury Brown and Twiss (HBT) radius of same charged pion-pairs, we obtained the square difference of outward radius and sideward radius, i.e. , as well as the freeze-out volume (), which were basically consistent with the trend of HADES experimental results. The azimuthal dependence of the HBT radii was also calculated by a matrix method, and corrected by the rotation matrix. In addition, the eccentricities of the - and - planes of pion-pair emissions were also extracted for different pair transverse momentum and collision centrality, which show that the -eccentricity increases with pair transverse momentum as well as centrality but not for -eccentricity, indicating a more asymmetric transverse emission of particle-pairs with higher transverse momentum in off-central collisions.
I Introduction
Two-particle hadronic intensity interferometry has been widely used to study the phase space evolution of the source in heavy-ion reactions Hanbury Brown and Twiss (1956); Alver and Roland (2010); Lisa et al. (2005). The technique, first proposed by Hanbury Brown and Twiss (HBT), was based on the quantum statistical interference of identical particles Lin et al. (2005); Akkelin and Sinyukov (1995) and was used to measure angular radii of stars in the beginning and later became known as HBT interference. Goldhaber et al. applied such an intensity interference method to hadronic systems Goldhaber et al. (1960); Adamczewski-Musch et al. (2019). However, considering that the shape and size of the particle source is changing due to the influence of space-momentum correlation during collisions Wiedemann (1998), intensity interferometry usually does not yield an exact particle source size, but rather an approximately valid “uniformity length”. Intensity interferometry measures the source regions where the momenta of particle pairs are relatively close to each other, so they are correlated due to quantum statistics or two-body interactions Bowler (1988); Akkelin and Sinyukov (1996). In the region of collision energy at GeV per nucleon, the measured particles usually come from different processes, and intensity interference method can provide additional information to understanding the production mechanism and dynamics of the particle emission source Fang et al. (2016); Lin and Ko (2002); Yang and Zhang (2016); Li et al. (2021).
The intensity interference of pions in heavy-ion collisions was first observed in the Berkeley Bevalac experiment Christie et al. (1993) where an oblate shape of the pion source and a correlation of the source size with the system size were also found Christie et al. (1992). However, people realized that the HBT radius is not only directly corresponding to the spatial size of source, but also related to the so-called “region of homogeneity”. On the other hand, HBT correlation can be used to measure the spatial and temporal information of particle emission source in heavy-ion collisions, which can be used to extract the dynamic information of emission sources. Its related experimental measurement and theoretical analysis have therefore aroused great interests Jeltes et al. (2007); Adamczyk et al. (2015a); Adam et al. (2019); Acharya et al. (2020); Bertsch et al. (1988); Kapusta and Li (2004); Christopher and Kapusta (2017); He et al. (2020); Wang et al. (2021, 2018); Zhou and Fang (2020); Xi et al. (2020).
Since the 1990s, many parametric models have been developed for a more visualized understanding and physical information extraction of the emission sources. On the basis of certain assumptions, some parameterized models can obtain simple and intuitive physical analytical formulas for the HBT radius. This provides a great help in studying the relation between the particle emission and final-state particles Adamczyk et al. (2015a); Adam et al. (2019); Acharya et al. (2020).
In non-central heavy-ion collisions, the random distribution of symmetrical axis of each nucleus-nucleus collision results in smearing or weaken azimuthal angular dependence of the HBT radius. Some works proposed the so-called matrix method Lisa et al. (2000a); Adamczewski-Musch et al. (2020a) to correct this effect through simulating the coordinates of the initial nucleons. In this work, we also consider if this correction can be obtained by momentum distributions at final state, which will be more convenient in experiment with a 4 detector.
This paper is organized as follows. First, a concise introduction to the IQMD model as well as the HBT calculation method is given in Sec. II. Next, the pion yields and three-dimensional pion HBT radius results as well as the corresponding results with experimental data are presented in Sec. III. The azimuthal-angle dependent HBT radii before and after the corrections as well as the eccentricities of and planes are also given in this section. Finally, a brief summary is presented in Sec. IV.
II Models and methods
In experiments, particles are measured in heavy-ion reactions at final stage and it is impossible to directly trace the physical evolution in reactions, so various models have been developed to simulate the reaction process. The commonly-used heavy-ion reaction models can be basically divided into statistical models and transport models. In this study, an Isospin dependent Quantum Molecular Dynamics (IQMD) model, a kind of transport models, is employed to study the reaction system from initial state to final stage in low and medium energy heavy-ion collisions. The HBT radii are calculated from the phase-space data of pions at the freeze-out stage simulated by the IQMD model Pratt et al. (1994). In the following, the IQMD model and HBT calculation methods will be introduced, separately.
II.1 The IQMD model
Quantum Molecular Dynamics (QMD) model is a molecular dynamics model, from which we can get the information on both the collision dynamics and the phase space information Aichelin (1991); Ma and Shen (1995); Feng (2018); Zhang et al. (2021); Guo et al. (2020). The IQMD model is based on the traditional QMD model, by including the isospin degree of freedom of nucleons Hartnack et al. (1998).
In the IQMD model, the normalized wave function of each nucleon is expressed in the form of a Gaussian wave packet,
| (1) |
here and are time-dependent variables describing the center of the wave packet in coordinate space and momentum space, respectively. Given the direction of and , is a six-dimensional function. The parameter is the width of the wave packet, which is related to the size of the reaction system and usually fixed in the simulations. Here the width is fixed as for Au + Au reactions Liu et al. (2017); Yu et al. (2020).
All the nucleons interact through an effective mean field and two-body scatterings. The interaction potential can be expressed as
| (2) |
where , , , , , and represent the density-dependent Skyrme potential, Coulomb potential, Yukawa potential, isospin asymmetric potential, the momentum-dependent interaction potential and Pauli potential, respectively. The nucleon-nucleon collision cross section in the medium () can be expressed as taken in Refs. Westfall et al. (1993); Chen et al. (1968); Zhang and Su (2020)
| (3) |
where is the density of normal nuclear matter, is the local density, is the in-medium correction factor, which is chosen as 0.2 in this paper to better reproduce the flow data Wang et al. (2018), and is the free nucleon-nucleon cross section.
II.2 The HBT radius
In heavy-ion collisions, the momentum correlation between two identical particles is widely used to extract the spatial and temporal dynamic information of particle emission source Miller et al. (2007); Lacey et al. (2011); Adare et al. (2014). This intensity interference can be expressed as Pratt (1984); Bowler (1991); Sinyukov et al. (1998); Ajitanand et al. (2014)
| (4) |
where and represent the relative momentum and mean pair momentum with and being the momenta of the two particles. The correlation function relates to the phase-space density of the source function . In experimental measurements, is usually parametrized in terms of the intercept and the HBT radii by
| (5) |
In the Cartesian system, the relative momentum is decomposed into components parallel to the beam direction ( = longitudinal) and to the pair transverse momentum direction ( = outward), as well as perpendicular to the first two directions ( = sideward) Podgoretsky (1983); Pratt (1986); Yu et al. (2008); Zhang (2011); Zhang et al. (2004).
In the last decade, much attention has been paid to the differential measurement of HBT radius from two-particle correlation, and the (azimuth angle) - dependence has revealed additional information on the space-time structure of the source and given rise to new insights on the underlying nature of the flows Adamczyk et al. (2015b); Retiere and Lisa (2004a).
The azimuth-sensitive HBT analysis includes six parameters , all of which are functions of three components of the pair transverse momentum , rapidity and azimuth angle . They provide the space-time information of the source according to following equations Wiedemann (1998); Adamczewski-Musch et al. (2020b); Wiedemann and Heinz (1999):
| (6) |
where represents the pair velocity in the transverse direction, and represents the pair velocity in the longitudinal directions. is the transverse mass. denotes the spatial correlation tensor
| (7) |
which measures the Gaussian width in space-time of the emission function around the point of highest emissivity . is defined in terms of Cartesian coordinates in an impact parameter fixed system, in which is the time parameter, is parallel to the impact parameter b, is the beam direction, and is perpendicular to the reaction plane constructed from the and directions. The brackets indicate the average over the entire emission source.
As stated in Refs. Lisa et al. (2000b, a), all elements, except and diagonal elements, oscillate symmetrically near zero in collisions with the same mass. This means
| (8) |
As a result, using the fact that the average is zero near the midrapidity (although average ) allows us to express the HBT radii in terms of five non-vanishing components as in Refs. Voloshin and Cleland (1996); Heiselberg (1999); Heiselberg and Levy (1999),
| (9) |
While the amplitude of oscillations of , and are given by the difference between the transverse source sizes in and perpendicular to the reaction plane, that of the oscillations of and is given by . By parameterizing the emission source by an ellipsoid, a nonzero corresponds to a tilt of its longitudinal major axis away from the beam direction in the reaction plane. It can be characterized by a tilt angle,
| (10) |
Rotating the spatial correlation tensor by yields a purely diagonal tensor with the squared lengths of the three major axes given by its eigenvalues. Using Eq. (9), we can then get the HBT radius after the rotation correction.
III Analysis and discussion
In this paper, we use an IQMD model to simulate Au + Au collisions at the beam energy = 1.23 GeV, which corresponds to a center of mass energy = 2.4 GeV. The total number of events included in the simulation is 1600000. The centrality is characterized as , where is the impact parameter, and is the sum of effective shape radius of projectile and target. The compared HADES experimental results are obtained from Refs. Adamczewski-Musch et al. (2020a, b).
III.1 The pion yield
Pions carry interesting information about the high density behavior of symmetry energy and the ratio in heavy-ion collisions depends strongly on isospin asymmetry of the reaction system Li et al. (2008). In heavy-ion collisions at beam energies around about 1 GeV/nucleon and below, most pions are produced through the decay of resonances, see, e.g., Refs. Li and Bauer (1991), since the direct pion production is very small in the intermediate-energy range and can be neglected.
Fig. 1 shows rapidity distributions of positive and negative charged pions for the centrality classes of 0-10, 10-20, 20-30, and 30-40%. Fig. 2 shows the reduced transverse mass distributions of positive and negative charged pions in different rapidity ranges from to . Also shown by solid lines are fitted results using the following function:
| (11) |
where the parameters and account for different slopes at low and high reduced transverse masses, respectively, which we call them “apparent” temperature parameters, and and relate to the corresponding yields. Here we chose a superposition of two Boltzmann distributions because the reduced transverse-mass spectrum of pions deviate from a single exponential spectrum. The detailed fitting processes can be found in Ref. Adamczewski-Musch et al. (2020a).
It is seen from Fig. 1 and Fig. 2 that the yields of and gradually decrease with less central collision and larger transverse mass, respectively. We notice that the yield of pions from the IQMD model is higher than experimental data from Fig. 1, and the ratio of experimental over model values is . This behavior is basically consistent with the values of and in previous IQMD results or other models as given in Ref. Adamczewski-Musch et al. (2020a). As discussed in Ref. Adamczewski-Musch et al. (2020a), the origin of the displayed overshoot of production remains unclear. Recent calculations on the width of nuclear dipole resonance have demonstrated that the nuclear mean free path is strongly corrected in nuclear medium Wang et al. (2020); Liu et al. (2017). Also, it is shown in Ref. Godbey et al. (2021) that the pion yield in this reaction can be described with a reduced nucleon-nucleon inelastic cross section in medium. However, introducing in-medium corrections of the nucleon-nucleon cross section has little impact on the pion spectrum and its nuclear modification factor Lv et al. (2017). The reason might be that the cross section for pion interaction has no significant change while the in-medium correction for nucleon-nucleon cross section changes. Therefore the -excess remains unclear and deserves further exploration for pion dynamics in near future, eg. the pion (re)scattering and (re)absorption processes, at least in the IQMD framework.
As mentioned before, the / ratios strongly depend on the isospin of the system, such that are produced more abundantly than for 197Au systems. In the resonance model for pion production from first-chance independent nucleon-nucleon collisions Stock (1986), the primordial / ratio is where and are neutron and proton numbers in the participant region of the reaction. However, because pion reabsorption and rescattering ( and ) reduce the sensitivity of the / ratio to as seen in the following. In Fig. 1, a comparison of the / ratio between our calculation and the HADES mid-rapidity data for four centrality classes is also plotted. Unlike the single rapidity spectra of and , the / ratio cancels out the over-predicted behavior in single spectra, and they can essentially match up with the data within the systematic uncertainty. For the larger rapidity region (eg. around ) or off-central collisions (eg. 30-40% centrality), the values of our calculated approach to the initial value of the in 197Au, indicating a different production mechanism from those in central rapidities.
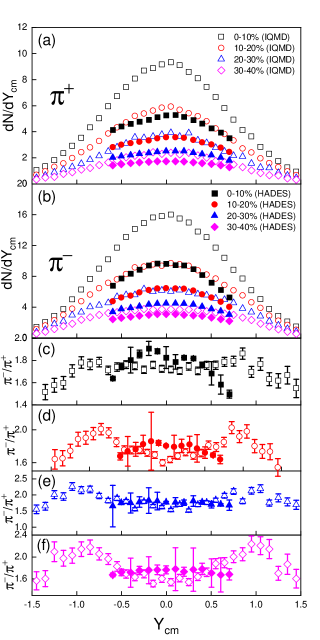
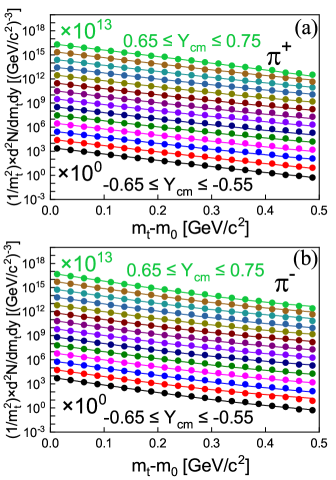
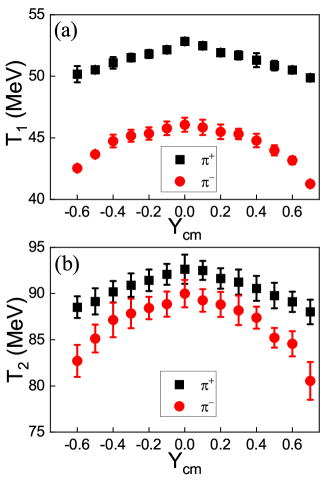
Fig. 3 shows the and from fitting results of charged pions in 0-10% centrality at different rapidity intervals, while Table 1 presents the fit results for mid-rapidity pions at different centrality intervals. describes the slope of the low part of the spectrum, which contains bulk particles and is usually attributed to pions originating from decays Harabasz et al. (2020). stands for the slope at higher , which is often interpreted as a thermal component Hong et al. (1997). In an earlier study with the Boltzmann-Uehling-Ulenbeck equation Li and Bauer (1991), they proposed that the two-temperature shape of negative pion spectra observed in heavy-ion collisions with beam energies of 1 GeV/A is due to the different contributions of -resonances produced early and late during the course of the heavy-ion reaction. As seen from Fig. 3 and Table 1, with increasing rapidity and centrality, and decrease gradually. This can be understood from the much hot source for emission is created at mid-rapidity as well as in more central collisions, than that for larger centralities and rapidities. Table 1 shows perfect agreements between our IQMD calculations and the HADES data for both and . As can be seen from the table 1, there are certain differences between and . It can be mainly attributed by the difference between positive and negative charged pions to the Coulomb potential. Refs. Adamczewski-Musch et al. (2020a); Barz et al. (1998) gave that the Coulomb effect on the transverse momentum of positive and negative charged pions is different. The former are accelerated resulting in reduced yields at low momenta, while the latter are decelerated resulting in increased yields at low momenta. Therefore the effect leads to an “apparent” temperature difference between and spectra. Actually, we checked in our model calculations by switching off the Coulomb potential, the significant difference of the “apparent” temperature between the positive and negative charged pions disappears, especially for .
Here we would also give some remarks on the pion transverse mass spectra. Even though we took the two-parameter fitting method which is the same as the experimental analysis and the excellent agreements for two “apparent” temperatures were reached between the model and the data, the “apparent” temperatures are not really temperatures, which are in fact the additive results of kinetic freeze-out temperature, Coulomb interaction as well as the radial flow etc. In principal, the spectra can be fitted by the blast-wave formula which includes the kinetic freeze-out temperature and radial flow parameters. As shown in our previous work Lv et al. (2014), such freeze-out temperatures will be much lower than the “apparent” temperature extracted from the slope fits. In other words, the radial flow induces the transverse mass spectra harder and then gives larger “apparent” temperature. But this is beyond our present study since we are trying to compare with the HADES data quantitatively.
| (MeV) | ||||
|---|---|---|---|---|
| 0-10 | 54 | 52.83 | 92 | 92.63 |
| 10-20 | 51 | 51.50 | 89 | 89.63 |
| 20-30 | 49 | 49.65 | 86 | 86.90 |
| 30-40 | 47 | 47.59 | 83 | 83.86 |
| 0-40 | 52 | 51.06 | 88 | 88.33 |
| (MeV) | ||||
| 0-10 | 46 | 46.06 | 91 | 89.96 |
| 10-20 | 43 | 43.64 | 85 | 84.17 |
| 20-30 | 42 | 40.15 | 82 | 81.71 |
| 30-40 | 41 | 38.25 | 79 | 78.21 |
| 0-40 | 44 | 44.28 | 87 | 86.83 |
III.2 The three-dimensional HBT radius
For the final-state particle information, which is needed for the HBT study, it is obtained from the IQMD model by correcting it with the event plane method. The n- order event plane angle can be defined by the event flow vector and as Poskanzer and Voloshin (1998); Adamczyk et al. (2013)
| (12) |
where and are the azimuthal angle of the momentum and the weight for the -th particle, respectively. In this work, we chose transverse momentum as weight and construct the first-order (=1) event plane correction.
By simplifying Eq. (9), we can obtain expressions for the three-dimensional HBT radii as Lisa et al. (2000b):
| (13) |
where the , , , are the coordinates and emission times of the charged pions, respectively. and are the component of the pair velocity in the transverse and longitudinal directions, respectively. To get the () dependence of HBT radius, the HBT radius in equation (13) is averaged over and , which correspond to the zeroth-order HBT radius in Ref. Retiere and Lisa (2004b). The () dependence of HBT radius is shown in Fig. 4 and is consistent with the data from the HADES Collaboration Adamczewski-Musch et al. (2020b).
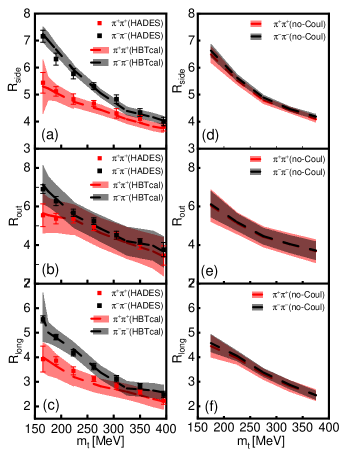
As we can see from (a,b,c) of Fig. 4, , and decrease with increasing transverse mass, which are in good agreement with the HADES experimental results. While for low transverse mass, there is an increase/decrease of the HBT radius for / pairs, which can be attributed to the Coulomb interactions. And the effect apparently fades away at large transverse momentum Barz (1999). Compared with (d,e,f) of Fig. 4, after removing the Coulomb reaction, the three-dimensional HBT radii of and have little difference, which indicates that the increase/decrease excursion of the three-dimensional HBT radius of negative/positive charged pions is indeed due to the Coulomb interaction. And this is consistent with the different “apparent” temperatures of positive and negative pions as shown in Fig. 3 where in lower momentum region there are more negative pions than positive poins. This can be attributed to the fact that in the reaction system positive pions are always pushed away from the system and the negative pions are trapped in the system via the Coulomb interaction, which results in earlier freeze-out status for positive pions than negative poins. The values of and are essentially the same, but different from , which is consistent with the definition of the coordinate system and the beam direction. With the increase in , , and all drop with the transverse mass of pions. This is due to the influence of radial and longitudinal flows, which causes the HBT radius decreasing gradually with . The results are consistent with the conclusions in Refs. Retiere and Lisa (2004b); Barz (1999). In addition, the values of and are bigger than that of , indicating that the expansion effect of the particle source is larger in the sideward and outward directions.
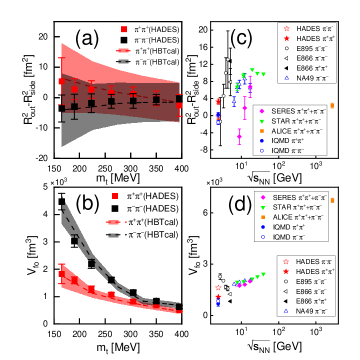
and are related to the emission time duration Hung and Shuryak (1995); Rischke and Gyulassy (1996); Pratt (1984); Chapman et al. (1995); Wiedemann et al. (1996) by the equation Lacey et al. (2013); Shuryak and Zahed (2013). For the freeze-out volume, it can be expressed as . The and dependences of and are shown in Fig. 5.
As seen from Fig. 5(a), the value of drops as increases and finally turns negative for , and its absolute value increases gradually. This indicates that the emission time duration generally becomes shorter for higher pions. However, for much higher pions, the value of becomes negative, which is related to the opacity of the source. The opaqueness of the source affects , and can cause it negative, thus compensating for the positive contribution of the emission duration. This is consistent with the conclusions in Ref.Adamczewski-Musch et al. (2020b); Barz (1999). For the value of as shown in Fig. 5(b), it decreases as increases, indicating the expansion of the emission source since higher pions are emitted earlier. Moreover, both and from the IQMD simulation are basically consistent with the trend of measured results from various experiments as a function of as demonstrated in Fig. 5(c) and (d). Most measured results in these experiments are in the high energy region. For experiments near the low energy region, the errors are, however, large.
III.3 Azimuthal-dependent HBT radius
In the current model calculation and experimental measurement, the phase space of the final state particles is asymmetric with respect to the reaction plane in non-central collisions. To correct the particle phase space, we choose the matrix correction method with a so-called S-matrix constructed by pairs.
With the pairs of mean transverse momentum of 150-200 MeV/c in 10-30% centrality from the IQMD model, from Eq. (7), we can get the uncorrected matrix
| (14) |
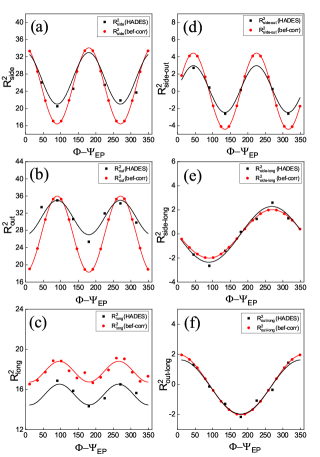
As expected from the consideration of symmetry, only the diagonal elements and are significantly different from 0, resulting in six square radii that do not disappear as indicated by Eq. (8). Using the matrix, we can calculate the HBT radius with Eq. (9), and the results obtained by the IQMD model are compared with experimental data from the HADES Collaboration Adamczewski-Musch et al. (2020b) are shown in Fig. 6. It shows that the HBT radii from the IQMD model and the HADES data have the same phase position and periodicity, and the and obtained by IQMD are in good agreement with those obtained from HADES. For other HBT radii, the IQMD results showed, however, a larger amplitude than that of the HADES data.
The spatial tilt angle of the reaction plane can be calculated from the matrix,
| (15) |
Using the corresponding rotation matrix , we rotate the matrix by around the -axis to obtain the rotation corrected diagonal tensor matrix
| (16) |
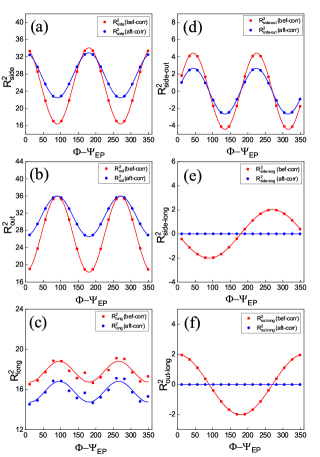
The results of azimuth dependent HBT radius calculated before and after the rotation correction are shown in Fig. 7, respectively. As seen from Fig. 7, for the first-order HBT radius, the oscillation structure of the corrected HBT radius remains unchanged and the amplitude decreases. For the second-order HBT radius, and are approximately zero after correction. The most immediate reason is that the value of becomes 0 after the correction, so that the value of and in Eq. (9) is approximately equal to 0. In addition, it is indicated in Refs. Wiedemann (1998); Lisa et al. (2000c) that the cross terms and cancel to 0 due to the high symmetry of the source after correction. This result is also coincident with that from the RQMD model Lisa et al. (2000b).
Finally, we discuss the eccentricities of - and -plane for emissions of pion-pairs in the viewpoint of the eigenvalues of matrix , namely the temporal and geometrical variances , , and . Using these non-zero eigenvalues, the eccentricities of - and -plane of pion-pairs can be calculated as follows Adamczewski-Musch et al. (2020b):
| (17) |
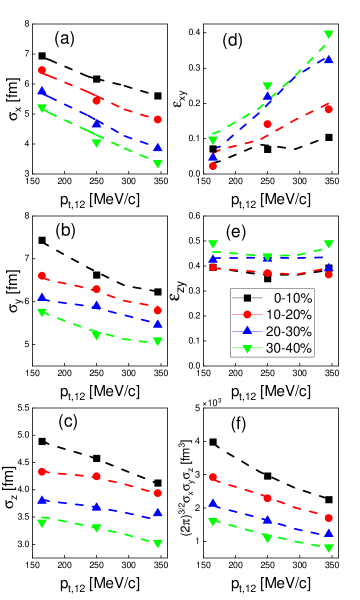
Fig. 8 shows the pair transverse-momentum () dependence of three dimensional eccentric distances (, and ) as well as the - and - eccentricities ( and ) and the freeze-out volume by an approximate formula of for different collision centralities. We can see that all , and decrease with increasing pair transverse momentum as well as centrality, which indicates that pairs with higher pair transverse momentum and/or in less central collisions have less dispersion in the spatial distribution, which is also consistent with the trend of HBT radii with . We can also see that the -eccentricity increases with the pair transverse momentum, indicating a more asymmetric transverse emission for pions with higher transverse momentum. There is, however, no obvious dependence for the -eccentricity. For more central collisions, the eccentricity of -plane becomes very small, approaching essentially zero. This means that the distribution of the final-state particles in the - plane is close to a circular shape. With the increase in centrality, the degree of deviation from the circular-like shape in the - and -plane increases gradually. The deduced freeze-out decreases with the and centrality, which means that pairs with higher pair transverse momentum and/or in off-central collisions have a smaller volume in their homogeneity region. Our calculated results are in good agreement with the experimental results from the HADES data Adamczewski-Musch et al. (2020b).
IV Summary
In summary, the yield of charged pions and their three-dimensional HBT radii were calculated by a simulation of Au + Au collision at 1.23 GeV with the IQMD model. Even though there is an overpredication of single spectra in comparison with the data, the and “apparent” temperature parameters match up with the data. The and obtained by our calculations are basically consistent with the observed results given in various experiments. We also calculated the azimuthal dependence of HBT radii by the matrix-element method and corrected it by the rotation matrix. In this method, the -dependent HBT radii can be calculated from five components of the spatial correlation tensor , and corrected by the rotation matrix. In addition, we also calculated the - and -plane eccentricities as a function of pair transverse momentum and centrality. The results show that the -eccentricity of the pion emission source is approximately zero in the most central collision, which means an approximately circular shape in the -plane. With the increase in pair transverse momentum, the -eccentricity increases gradually, indicating a more asymmetric transverse emission source for higher pair transverse momentum. However, there is no obvious dependence in the -eccentricity. The deduced freeze-out volume decreases with the increasing and centrality, which means that pairs with higher pair transverse momentum and in off-central collision have a smaller homogeneity region volume.
Acknowledgements.
This work was supported in part by the National Natural Science Foundation of China under contract Nos. 11890714, 11875066, 11421505, 11775288, and and 12147101, the National Key R&D Program of China under Grant Nos. 2016YFE0100900 and 2018YFE0104600, and by Guangdong Major Project of Basic and Applied Basic Research No. 2020B0301030008.References
- Hanbury Brown and Twiss (1956) R. Hanbury Brown and R. Q. Twiss, Nature 178, 1046 (1956).
- Alver and Roland (2010) B. Alver and G. Roland, Phys. Rev. C 81, 054905 (2010), [Erratum: Phys. Rev. C 82, 039903 (2010)], arXiv:1003.0194 [nucl-th] .
- Lisa et al. (2005) M. A. Lisa, S. Pratt, R. Soltz, and U. Wiedemann, Ann. Rev. Nucl. Part. Sci. 55, 357 (2005), arXiv:nucl-ex/0505014 .
- Lin et al. (2005) Z.-W. Lin, C. M. Ko, B.-A. Li, B. Zhang, and S. Pal, Phys. Rev. C 72, 064901 (2005), arXiv:nucl-th/0411110 .
- Akkelin and Sinyukov (1995) S. V. Akkelin and Y. M. Sinyukov, Phys. Lett. B 356, 525 (1995).
- Goldhaber et al. (1960) G. Goldhaber, S. Goldhaber, W.-Y. Lee, and A. Pais, Phys. Rev. 120, 300 (1960).
- Adamczewski-Musch et al. (2019) J. Adamczewski-Musch et al. (HADES Collaboration), Phys. Lett. B 795, 446 (2019), arXiv:1811.06213 [nucl-ex] .
- Wiedemann (1998) U. A. Wiedemann, Phys. Rev. C 57, 266 (1998), arXiv:nucl-th/9707046 .
- Bowler (1988) M. G. Bowler, Z. Phys. C 39, 81 (1988).
- Akkelin and Sinyukov (1996) S. V. Akkelin and Y. M. Sinyukov, Z. Phys. C 72, 501 (1996).
- Fang et al. (2016) D. Q. Fang, Y. G. Ma, X. Y. Sun, et al., Phys. Rev. C 94, 044621 (2016), arXiv:1610.04731 [nucl-ex] .
- Lin and Ko (2002) Z.-w. Lin and C. M. Ko, Phys. Rev. C 65, 034904 (2002), arXiv:nucl-th/0108039 .
- Yang and Zhang (2016) J. Yang and W.-N. Zhang, Nucl. Sci. Tech. 27, 147 (2016).
- Li et al. (2021) L.-Y. Li, P. Ru, and Y. Hu, Nucl. Sci. Tech. 32, 19 (2021).
- Christie et al. (1993) W. B. Christie et al., Phys. Rev. C 47, 779 (1993).
- Christie et al. (1992) W. B. Christie et al., Phys. Rev. C 45, 2836 (1992).
- Jeltes et al. (2007) J. M. Jeltes, T. McNamara, W. Hogervorst, et al., Nature 445, 402 (2007).
- Adamczyk et al. (2015a) L. Adamczyk, J. K. Adkins, G. Agakishievet, et al. (STAR Collaboration), Nature 527, 345 (2015a).
- Adam et al. (2019) J. Adam et al. (STAR Collaboration), Phys. Lett. B 790, 490 (2019).
- Acharya et al. (2020) S. Acharya, F. T. Acosta, J. Adam, et al. (ALICE Collaboration), Nature 588, 232 (2020).
- Bertsch et al. (1988) G. Bertsch, M. Gong, and M. Tohyama, Phys. Rev. C 37, 1896 (1988).
- Kapusta and Li (2004) J. I. Kapusta and Y. Li, J. Phys. G 30, S1069 (2004).
- Christopher and Kapusta (2017) P. Christopher and J. I. Kapusta, Phys. Rev. C 95, 044910 (2017).
- He et al. (2020) J. He, S. Zhang, Y.-G. Ma, J. Chen, and C. Zhong, Eur. Phys. J. A 56, 52 (2020).
- Wang et al. (2021) Y.-J. Wang, F.-H. Guan, X.-Y. Diao, et al., Nucl. Sci. Tech. 32, 4 (2021).
- Wang et al. (2018) T.-T. Wang, Y.-G. Ma, C.-J. Zhang, and Z.-Q. Zhang, Phys. Rev. C 97, 034617 (2018), arXiv:1803.08825 [nucl-th] .
- Zhou and Fang (2020) L. Zhou and D.-Q. Fang, Nucl. Sci. Tech. 31, 52 (2020).
- Xi et al. (2020) B.-S. Xi, Z.-Q. Zhang, S. Zhang, and Y.-G. Ma, Phys. Rev. C 102, 064901 (2020).
- Lisa et al. (2000a) M. A. Lisa, U. W. Heinz, and U. A. Wiedemann, Phys. Lett. B 489, 287 (2000a), arXiv:nucl-th/0003022 .
- Adamczewski-Musch et al. (2020a) J. Adamczewski-Musch, O. Arnold, C. Behnke, et al. (HADES Collaboration), Eur. Phys. J. A 56, 259 (2020a).
- Pratt et al. (1994) S. Pratt, J. Sullivan, H. Sorge, et al., Nucl. Phys. A 566, 103 (1994).
- Aichelin (1991) J. Aichelin, Phys. Rep. 202, 233 (1991).
- Ma and Shen (1995) Y. G. Ma and W. Q. Shen, Phys. Rev. C 51, 710 (1995).
- Feng (2018) Z.-Q. Feng, Nucl. Sci. Tech. 29, 40 (2018).
- Zhang et al. (2021) D.-C. Zhang, H.-G. Cheng, and Z.-Q. Feng, Chin. Phys. Lett. 38, 092501 (2021).
- Guo et al. (2020) C.-C. Guo, J. Su, and L. Zhu, Nucl. Sci. Tech. 31, 123 (2020).
- Hartnack et al. (1998) C. Hartnack, R. K. Puri, J. Aichelin, J. Konopka, S. Bass, H. Stoecker, and W. Greiner, Eur. Phys. J. A 1, 151 (1998), arXiv:nucl-th/9811015 .
- Liu et al. (2017) H. L. Liu, Y. G. Ma, A. Bonasera, X. G. Deng, O. Lopez, and M. Veselský, Phys. Rev. C 96, 064604 (2017).
- Yu et al. (2020) H. Yu, D.-Q. Fang, and Y.-G. Ma, Nucl. Sci. Tech. 31, 61 (2020).
- Westfall et al. (1993) G. D. Westfall, W. Bauer, D. Craig, et al., Phys. Rev. Lett. 71, 1986 (1993).
- Chen et al. (1968) K. Chen, Z. Fraenkel, G. Friedlander, J. R. Grover, J. M. Miller, and Y. Shimamoto, Phys. Rev. 166, 949 (1968).
- Zhang and Su (2020) F. Zhang and J. Su, Nucl. Sci. Tech. 31, 77 (2020).
- Miller et al. (2007) M. L. Miller, K. Reygers, S. J. Sanders, and P. Steinberg, Ann. Rev. Nucl. Part. Sci. 57, 205 (2007), arXiv:nucl-ex/0701025 .
- Lacey et al. (2011) R. A. Lacey, R. Wei, N. Ajitanand, and A. Taranenko, Phys. Rev. C 83, 044902 (2011), arXiv:1009.5230 [nucl-ex] .
- Adare et al. (2014) A. Adare et al. (PHENIX Collaboration), Phys. Rev. C 90, 034902 (2014), arXiv:1310.4793 [nucl-ex] .
- Pratt (1984) S. Pratt, Phys. Rev. Lett. 53, 1219 (1984).
- Bowler (1991) M. G. Bowler, Phys. Lett. B 270, 69 (1991).
- Sinyukov et al. (1998) Y. Sinyukov, R. Lednicky, S. V. Akkelin, J. Pluta, and B. Erazmus, Phys. Lett. B 432, 248 (1998).
- Ajitanand et al. (2014) N. N. Ajitanand et al. (PHENIX Collaboration), Nucl. Phys. A 931, 1082 (2014), arXiv:1404.5291 [nucl-ex] .
- Podgoretsky (1983) M. I. Podgoretsky, Sov. J. Nucl. Phys. 37, 272 (1983).
- Pratt (1986) S. Pratt, Phys. Rev. D 33, 1314 (1986).
- Yu et al. (2008) L.-L. Yu et al., Chin. Phys. C 32, 897 (2008).
- Zhang (2011) W.-N. Zhang, Phys. Part. Nucl. Lett. 8, 977 (2011), arXiv:1012.5558 [nucl-th] .
- Zhang et al. (2004) W. N. Zhang, M. J. Efaaf, and C.-Y. Wong, Phys. Rev. C 70, 024903 (2004), arXiv:hep-ph/0409013 .
- Adamczyk et al. (2015b) L. L. Adamczyk, J. K. Adkins, G. Agakishiev, et al. (STAR Collaboration), Phys. Rev. C 92, 014904 (2015b), arXiv:1403.4972 [nucl-ex] .
- Retiere and Lisa (2004a) F. Retiere and M. A. Lisa, Phys. Rev. C 70, 044907 (2004a), arXiv:nucl-th/0312024 .
- Adamczewski-Musch et al. (2020b) J. Adamczewski-Musch et al. (HADES Collaboration), Eur. Phys. J. A 56, 140 (2020b), arXiv:1910.07885 [nucl-ex] .
- Wiedemann and Heinz (1999) U. A. Wiedemann and U. W. Heinz, Phys. Rept. 319, 145 (1999), arXiv:nucl-th/9901094 .
- Lisa et al. (2000b) M. Lisa et al. (E895), Phys. Lett. B 496, 1 (2000b), arXiv:nucl-ex/0007022 .
- Voloshin and Cleland (1996) S. A. Voloshin and W. E. Cleland, Phys. Rev. C 53, 896 (1996), arXiv:nucl-th/9509025 .
- Heiselberg (1999) H. Heiselberg, Phys. Rev. Lett. 82, 2052 (1999), arXiv:nucl-th/9809077 .
- Heiselberg and Levy (1999) H. Heiselberg and A.-M. Levy, Phys. Rev. C 59, 2716 (1999), arXiv:nucl-th/9812034 .
- Li et al. (2008) B.-A. Li, L.-W. Chen, and C. M. Ko, Physics Reports 464, 113 (2008).
- Li and Bauer (1991) B. A. Li and W. Bauer, Phys. Lett. B 254, 335 (1991).
- Wang et al. (2020) R. Wang, Z. Zhang, L.-W. Chen, C. M. Ko, and Y.-G. Ma, Phys. Lett. B 807, 135532 (2020).
- Godbey et al. (2021) K. Godbey, Z. Zhang, J. W. Holt, and C. M. Ko, (2021), 10.48550/arxiv.2107.13384.
- Lv et al. (2017) M. Lv, Y. G. Ma, J. H. Chen, D. Q. Fang, and G. Q. Zhang, Phys. Rev. C 95, 024614 (2017).
- Stock (1986) R. Stock, Phys. Rep. 135, 259 (1986).
- Harabasz et al. (2020) S. Harabasz, W. Florkowski, T. Galatyuk, M. Gumberidze, R. Ryblewski, P. Salabura, and J. Stroth, Phys. Rev. C 102, 054903 (2020).
- Hong et al. (1997) B. Hong et al. (FOPI Collaboration), Phys. Lett. B 407, 115 (1997), arXiv:nucl-ex/9706001 .
- Barz et al. (1998) H. W. Barz, J. P. Bondorf, J. J. Gaardhøje, and H. Heiselberg, Phys. Rev. C 57, 2536 (1998).
- Lv et al. (2014) M. Lv, Y. G. Ma, G. Q. Zhang, J. H. Chen, and D. Q. Fang, Phys. Lett. B 733, 105 (2014).
- Poskanzer and Voloshin (1998) A. M. Poskanzer and S. A. Voloshin, Phys. Rev. C 58, 1671 (1998).
- Adamczyk et al. (2013) L. Adamczyk et al. (STAR Collaboration), Phys. Rev. C 88, 014904 (2013).
- Retiere and Lisa (2004b) F. Retiere and M. A. Lisa, Phys. Rev. C 70, 044907 (2004b).
- Barz (1999) H. Barz, Phys. Rev. C 59, 2214 (1999).
- Hung and Shuryak (1995) C. M. Hung and E. V. Shuryak, Phys. Rev. Lett. 75, 4003 (1995), arXiv:hep-ph/9412360 .
- Rischke and Gyulassy (1996) D. H. Rischke and M. Gyulassy, Nucl. Phys. A 608, 479 (1996), arXiv:nucl-th/9606039 .
- Chapman et al. (1995) S. Chapman, P. Scotto, and U. W. Heinz, Phys. Rev. Lett. 74, 4400 (1995), arXiv:hep-ph/9408207 .
- Wiedemann et al. (1996) U. A. Wiedemann, P. Scotto, and U. W. Heinz, Phys. Rev. C 53, 918 (1996), arXiv:nucl-th/9508040 .
- Lacey et al. (2013) R. A. Lacey, Y. Gu, X. Gong, D. Reynolds, N. Ajitanand, J. Alexander, A. Mwai, and A. Taranenko, (2013), arXiv:1301.0165 [nucl-ex] .
- Shuryak and Zahed (2013) E. Shuryak and I. Zahed, Phys. Rev. C 88, 044915 (2013), arXiv:1301.4470 [hep-ph] .
- Lisa et al. (2000c) M. Lisa, N. Ajitanand, J. Alexander, et al., Physics Letters B 496, 1 (2000c).