The Directly-Imaged Exoplanet Host Star 51 Eridani is a Gamma Doradus Pulsator
Abstract
51 Eri is well known for hosting a directly-imaged giant planet and for its membership to the Pictoris moving group. Using two-minute cadence photometry from the Transiting Exoplanet Survey Satellite (TESS), we detect multi-periodic variability in 51 Eri that is consistent with pulsations of Gamma Doradus ( Dor) stars. We identify the most significant pulsation modes (with frequencies between 0.5–3.9 cycles/day and amplitudes ranging between 1–2 mmag) as dipole and quadrupole gravity-modes, as well as Rossby modes, as previously observed in Kepler Dor stars. Our results demonstrate that previously reported variability attributed to stellar rotation is instead likely due to Dor pulsations. Using the mean frequency of the gravity-modes, together with empirical trends of the Kepler Dor population, we estimate a plausible stellar core rotation period of 0.9 days for 51 Eri. We find no significant evidence for transiting companions around 51 Eri in the residual light curve. The detection of Dor pulsations presented here, together with follow-up observations and modeling, may enable the determination of an asteroseismic age for this benchmark system. Future TESS observations would allow a constraint on the stellar core rotation rate, which in turn traces the surface rotation rate, and thus would help clarify whether or not the stellar equatorial plane and orbit of 51 Eri b are coplanar.
1 Introduction
51 Eridani (51 Eri, HIP 21547, HD 29391) is a F0 IV star (Abt & Morrell, 1995) with a -band magntiude of 5.2 (Høg et al., 2000) located at a distance of 29.910.07 pc (Gaia Collaboration et al., 2016, 2021). It hosts a directly-imaged giant planet (51 Eri b; Macintosh et al., 2015; De Rosa et al., 2015) with a semi-major axis of 10–13 au, a moderate eccentricity of 0.5, and a mass of 11 (e.g., Maire et al., 2019; De Rosa et al., 2020; Bowler et al., 2020; Dupuy et al., 2022). In addition to hosting the imaged giant planet, 51 Eri is a member of the Pictoris moving group (PMG; Zuckerman et al., 2001; Malo et al., 2013), which implies an age of 19–24 Myr for the star (Bell et al., 2015; Miret-Roig et al., 2020). Another member of the PMG, GJ 3305 AB, is an M dwarf binary gravitationally bound to 51 Eri at projected separation of 1990 au (Feigelson et al., 2006; Kasper et al., 2007). Furthermore, 51 Eri has an infrared excess that is consistent with a cold debris disk (Riviere-Marichalar et al., 2014), but resolved imaging of this disk has thus far remained elusive due to its intrinsic faintness (e.g., Pawellek et al., 2021).
A significant challenge is the uncertain system age, which affects mass estimates of 51 Eri b based on substellar cooling models (e.g., Samland et al., 2017; Rajan et al., 2017). As dynamical mass measurements of imaged substellar companions increase thanks to Gaia astrometry (e.g., Brandt et al., 2021; Dupuy et al., 2022; Franson et al., 2022), precise ages are then needed to compare these dynamical masses to masses predicted from different cooling models and thereby test hot/warm/cold-start formation scenarios (e.g., Marley et al., 2007; Spiegel & Burrows, 2012; Mordasini, 2013). Age estimates of the PMG range from 8–40 Myr (e.g., Mamajek & Bell, 2014, their Table 1). Additionally, age estimates for 51 Eri itself include both younger and older ages than the current nominal PMG age of 19–24 Myr. For example, Simon & Schaefer (2011) measured the angular diameter of 51 Eri and combined with stellar evolution models estimated an age of 132 Myr. Montet et al. (2015) combined their dynamical mass measurement of GJ 3305 AB with evolution models to derive an age of 379 Myr, which also applies to 51 Eri assuming the three stars formed at the same time. Precise, independent age estimates are key to further quantifying the properties of this system as well as determining which substellar cooling models are most consistent with 51 Eri b.
Asteroseismology probes stellar interiors and is a powerful tool to determine ages (e.g., review by Kurtz, 2022). Early F-type stars show gravity-mode pulsations with periods between 0.3 to 3 days, forming the class of Doradus variables (Balona et al., 1994; Kaye et al., 1999). The Dor stars are located between the Scuti stars, which lie in the classical instability strip, and solar-like oscillators, with some hybrid Scuti and Dor stars pulsating in pressure and gravity-modes (Grigahcène et al., 2010). The Kepler Mission (Borucki et al., 2010) led to the discovery that nearly all Dor stars pulsate in dipole modes and enabled the measurement of their core rotation rates (Van Reeth et al., 2016; Li et al., 2020). Dor pulsations have been detected in the directly-imaged exoplanet host star HR 8799 (Marois et al., 2008, 2010) using ground-based observations (Zerbi et al., 1999) and were used to constrain an asteroseismic age (Moya et al., 2010, albeit with an ambiguity related to uncertainty in the stellar inclination). However, subsequent space-based data from the Microvariability and Oscillations of STars (MOST) telescope and from the BRIght Target Explorer (BRITE-Constellation) questioned the mode identification and implied only a single independent frequency, limiting the potential for asteroseismology in HR 8799 (Sódor et al., 2014; Sódor & Bognár, 2020). The unambiguous detection of multi-periodic pulsations in 51 Eri would open the door for determining an asteroseismic age for this system.
Koen & Eyer (2002) searched for candidate photometric variables using Hipparcos -band observations and reported 51 Eri as a probable “microvariable.” Desidera et al. (2021) recently investigated Sector 5 Transiting Exoplanet Survey Satellite (TESS, Ricker et al. 2015) photometry of 51 Eri and noted multiple periodicities likely due to stellar pulsations, but provided no further interpretation of 51 Eri’s variability status. Here we present Sector 5 and Sector 32 TESS photometry of 51 Eri and demonstrate that it is a Dor variable. We extract significant frequencies from the light curve in Section 2 and interpret the results in Section 3. We summarize our findings and recommendations in Section 4.
2 TESS Observations and Frequency Extraction
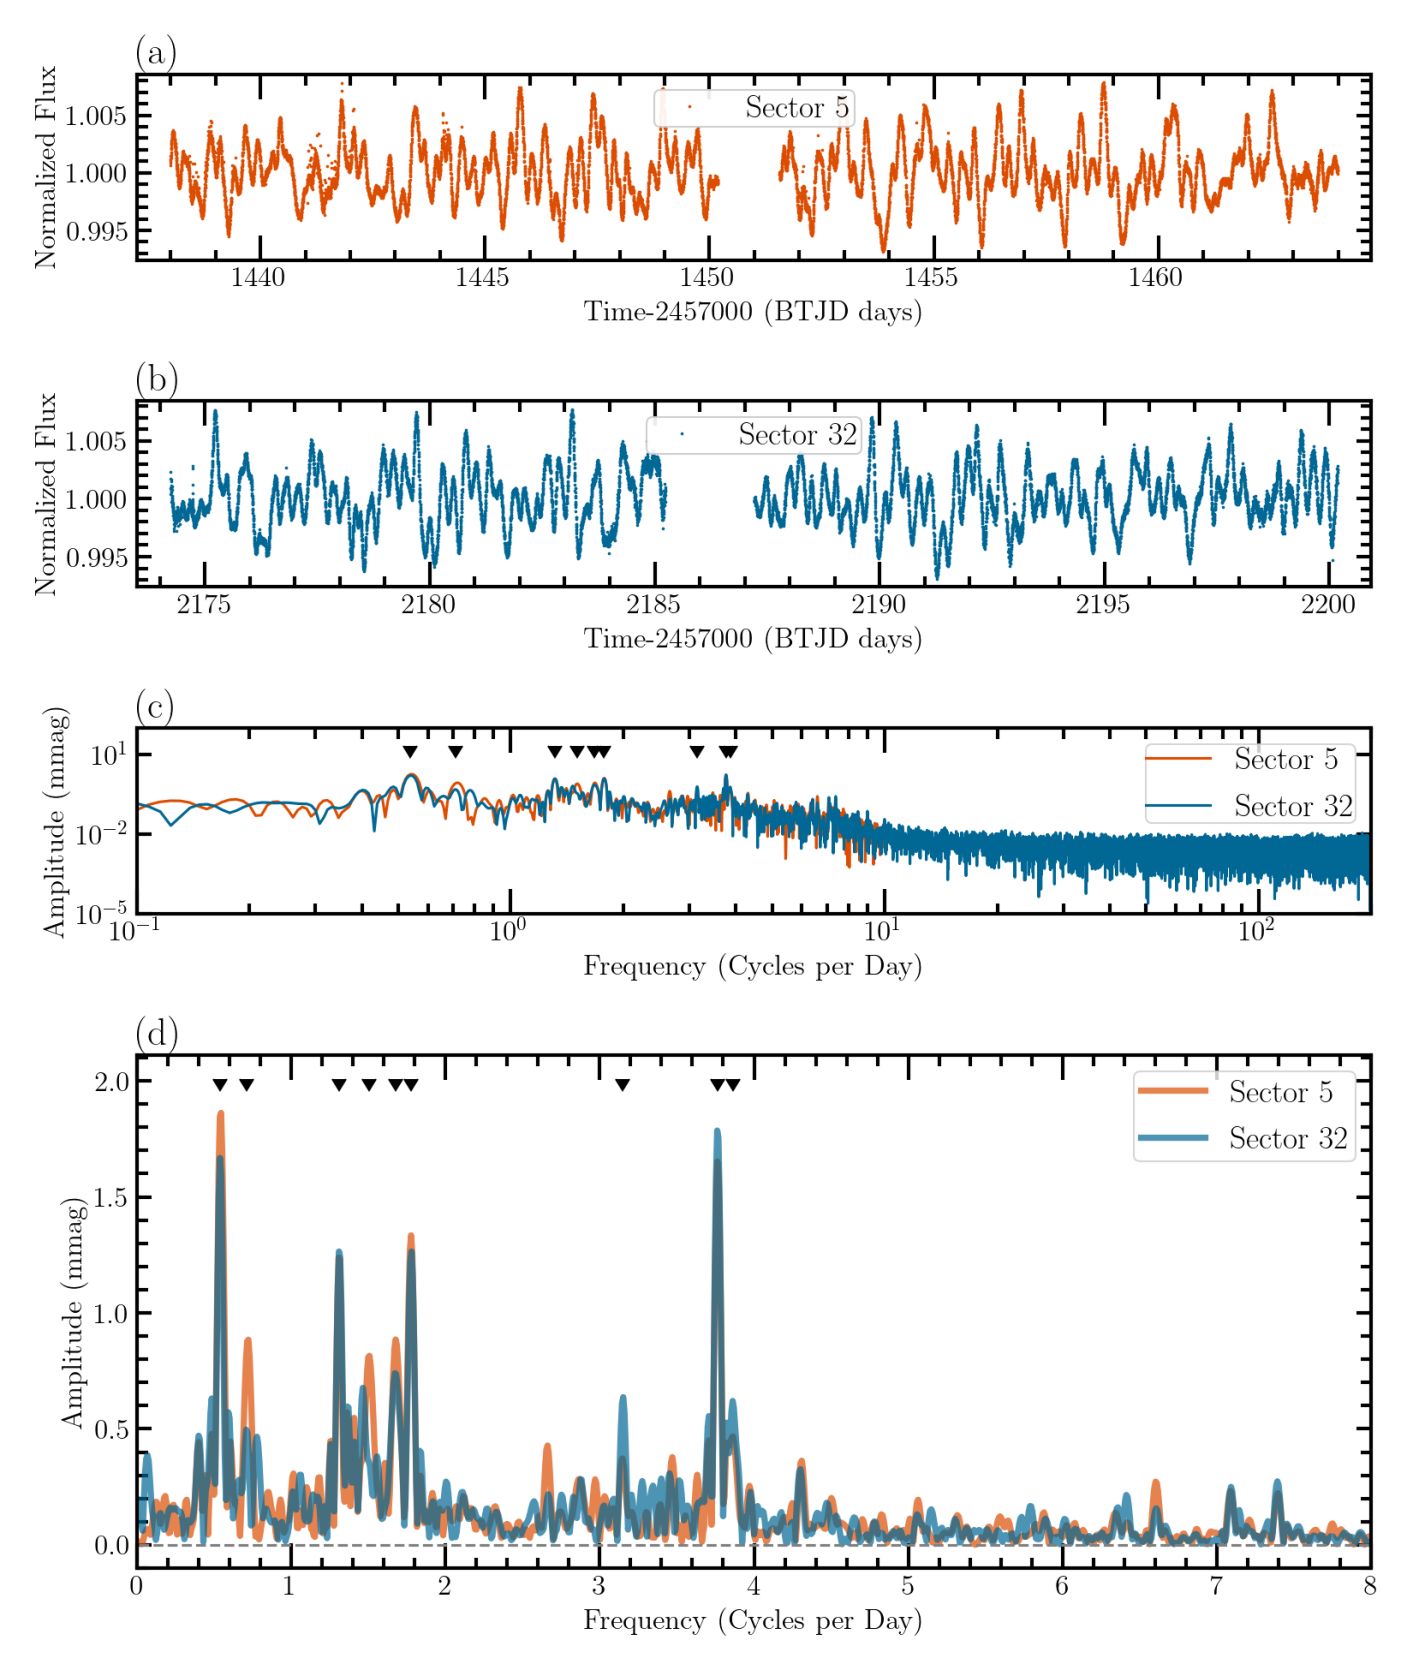
We downloaded all available TESS two-minute cadence observations of 51 Eri (Sectors 5 and 32) using the lightkurve package (Lightkurve Collaboration et al., 2018). We used the PDC-SAP light curves (Smith et al., 2012; Stumpe et al., 2012, 2014) provided by the Science Processing Operations Center (SPOC, Jenkins et al., 2016) and removed outlying photometry using the built-in routines of lightkurve, resulting in 34,908 cadences. The light curves from both sectors show clear evidence for multi-periodic variability (Figure 1a and 1b). We calculated amplitude spectra of each sector, which show consistent pulsation frequencies between 0-8 cycles/day (Figure 1c and Figure 1d). The amplitude differences between the two Sectors (on the order of tenths of mmag) are not surprising given that the observed peaks are expected to comprise individual radial orders (e.g., Li et al., 2020) that are not fully resolved with the current TESS data.
2.1 Pulsation Frequency Extraction
We extracted significant pulsation frequencies using the SigSpec package (Reegen, 2007), which iteratively fits sine-waves to the time series up to our defined spectral significance threshold. To inform our threshold choice, we check the data for red noise, which describes a noise structure that increases towards lower frequencies and is typically a consequence of stellar granulation or instrumental effects. The amplitude spectra in log-log space (Figure 1c) show red noise at 12 cycles/day. We interpret this as evidence for granulation due to a thin surface convection zone on 51 Eri, as found on some intermediate mass Scuti pulsators (e.g., Kallinger & Matthews, 2010). Alternatively, the red noise may also be due to instrumental effects. To mitigate the effect of the red noise, we chose a stringent spectral significance threshold of 500 (corresponding to a signal to noise ratio of 40) for the purpose of identifying significant pulsation modes.
We performed the frequency extraction on the concatenated time series using SigSpec from 0.2–24 cycles/day. This yielded nine significant frequencies that meet our spectral significance threshold and they are displayed in Figures 1c and 1d. A list of these significant frequencies and their corresponding amplitudes are provided as Table 1. Phase angles, which serve as a zero-point for the sine waves, are also included for completeness.111While not used in this study, phase angles are necessary for constructing model light curves from the detected pulsation frequencies and they are also useful quantities when performing mode identification with multi-color photometry. Uncertainties were calculated following Kallinger et al. (2008). Performing the frequency extraction on each Sector separately yields similar results.
Figures 1c and 1d show that there are likely more pulsation frequencies in these data than those reported in Table 1. A more careful treatment of the red noise would be required to better assess their significance. In particular, Figures 1c and 1d show evidence for signal between 6–8 cycles/day, which may be pressure-modes or combination frequencies of gravity-modes. In the pressure-modes scenario, this would indicate that 51 Eri is a hybrid Dor- Scuti pulsator.
| Frequency | Amplitude | Phase Angle | Spectral SignificanceaaFormally we report the cumulative spectral significance for this column. For a more detailed description, see Reegen (2011). | Preliminary Mode-ID |
|---|---|---|---|---|
| (cycles/day) | (mmag) | (rads) | ||
| 0.53980.0005 | 1.770.04 | 1.990.01 | 1621 | Rossby mode |
| 3.76590.0004 | 1.660.04 | 4.650.01 | 1621 | g-mode |
| 1.77640.0005 | 1.330.03 | 1.440.01 | 1511 | g-mode |
| 1.30940.0005 | 1.250.03 | 0.390.01 | 1511 | g-mode |
| 1.67620.0006 | 0.800.02 | 2.580.01 | 1222 | g-mode |
| 0.71320.0006 | 0.900.03 | 2.550.02 | 958 | Rossby mode |
| 1.50520.0007 | 0.750.03 | 5.870.02 | 723 | g-mode |
| 3.86160.0007 | 0.550.02 | 0.700.02 | 674 | g-mode |
| 3.14910.0008 | 0.900.04 | 6.050.02 | 600 | g-mode |
2.2 Probing for Non-Stellar Variability
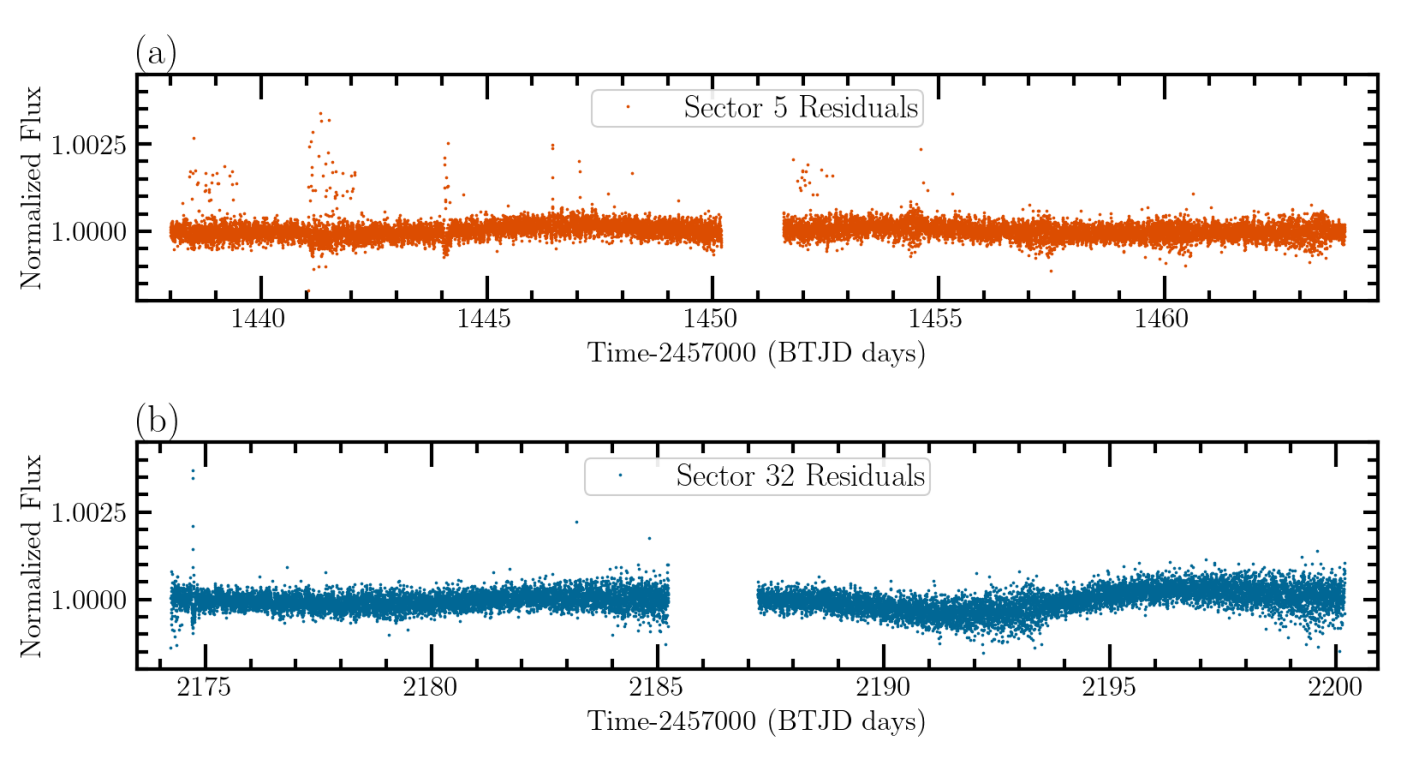
We repeated the frequency extraction procedure in an identical manner but using a spectral significance threshold of 10 for the purpose of removing signal that is intrinsically associated with the star. We inspected the corresponding residual light curve (Figure 2) for any clear indications of brightness “dips” that may be due to transiting companions or infalling bodies around 51 Eri (e.g., Zieba et al., 2019; Hey et al., 2021). Such features could plausibly be obscured by the Dor variability and red noise in the original light curve and thus may be evident after a more aggressive frequency subtraction. Given our lower frequency extraction limit of 0.2 cycles/day, these residuals thereby probe for transiting companions with a period longer than 5 days.
No unambiguous brightness dips are evident in this residual light curve which corresponds to a nondetection of transiting companions in these data. We evaluated this using Box Least Squares (BLS, Kovács et al., 2002) periodograms where we found no significant signal consistent with a transit. Instead, we note a few brightness excess features that may either be systematic artifacts or indicative of stellar flares (e.g., at 1446.45 and 2174.73 days). We also note a trend of long-period variation on the order of 14 days that likely corresponds to an instrumental artifact related to the orbital period of the TESS satellite.
In the scenario where the brightness excess features are flares, they would more likely originate from a contaminating source than from 51 Eri itself. Early F-type stars like 51 Eri are generally not expected to be active due in part to a lack of deep convective envelope (e.g., Charbonneau, 2010; Brun & Browning, 2017). There is some contention in the literature due to a small but growing number of candidate flaring A and F stars that challenge this paradigm (e.g., Balona, 2012, 2015) while, on the other hand, such cases are sometimes explained by contamination from a source other than the respective star (e.g., Pedersen et al., 2017). Antoci et al. (2019) noted a flare in the TESS data for the Dor star PsA, although they suggest it likely originates from a background star or a bound companion and not from PsA itself. While a more thorough investigation for 51 Eri is beyond the scope of this study, we note that the bound M-Dwarf binary GJ 3305 (with a -band magnitude of 10.6, Reid et al., 2004) is separated from 51 Eri by 66 ″(Feigelson et al., 2006). This makes GJ 3305 a likely source of contamination in the TESS aperture that we used for 51 Eri and thus a likely candidate to explain any observed flares.
3 Discussion
3.1 Dor Classification and Preliminary Mode Identification
Our nine extracted pulsation frequencies from the TESS photometry (Table 1) are consistent with those of Dor pulsators. Following the patterns identified for 600 Kepler Dor stars from Li et al. (2020), we interpret the peaks near 0.26 d (3.8 cycles/day) as quadrupole () gravity-modes and the peaks at 0.5–0.8 d (1.3–1.8 cycles/day) as dipole () gravity-modes. Typical gravity-mode period spacings, which enable identification of radial orders and constrain core rotation rates, are on the order of hundreds of seconds and thus cannot be reliably resolved with only two sectors of TESS data. The longest-period peak near 1.9 d (0.54 cycles/day) may be associated with Rossby modes, which are observed in 13% of all Kepler Dor stars (Li et al., 2020). This preliminary mode identification is included in Table 1.
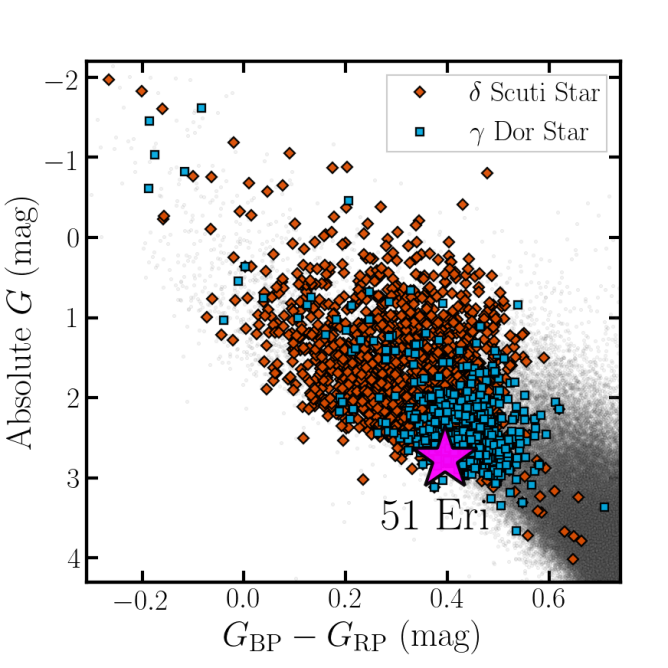
To further illustrate the Dor classification of 51 Eri, we constructed a color-magnitude diagram to compare it to other known Dor and Scuti pulsators from the Kepler mission. The sample is based on the Kepler Input Catalog (KIC, Brown et al. 2011) cross-matched with Gaia Early Data Release 3 (EDR3, Gaia Collaboration et al., 2016, 2021) and we calculated the absolute magnitude using inverse Gaia EDR3 parallax measurements as the distances. To account for dust reddening and extinction, we utilized the -band extinctions derived from 3D dust maps for the KIC stars (Green et al., 2019; Berger et al., 2020) and we converted their values to the corresponding Gaia passbands using the relative extinction ratios from Wang & Chen (2019). We excluded any stars with a Gaia EDR3 parallax uncertainty of . The subsample of Kepler stars that we denote as Scuti pulsators are from Murphy et al. (2019) and the subsample that we denote as Dor pulsators are from Li et al. (2020). Extinction is negligible for 51 Eri (e.g., Guarinos, 1992), and its color and absolute magnitude are indeed consistent with these other Dor and Scuti stars (Figure 3), further supporting its Dor classification.
3.2 On the Rotation Period of 51 Eri
Koen & Eyer (2002) derived a peak frequency of 1.5365 cycles/day using Hipparcos photometry, which has nominally been associated with a stellar rotation period of 0.65 days. Maire et al. (2019) and Desidera et al. (2021) recovered the same period from the Hipparcos data and with ground-based photometry from the Multi-site All-Sky CAmeRA (MASCARA). Assuming the variability is associated with stellar rotation, Maire et al. (2019) combined it with and stellar radius estimates to infer a spin-axis inclination of 41–45∘, which is similar to the estimate of 45∘ reported by Feigelson et al. (2006) using the same period and methods. Notably, these stellar spin-axis inclination estimates based on the 0.65 day rotation period are similar to the orbital inclination of 51 Eri b within its uncertainties (e.g., Maire et al., 2019; De Rosa et al., 2020; Bowler et al., 2020; Dupuy et al., 2022).
The TESS data shows a significant peak at 1.50520.0007 cycles/day (Figure 1d) that recovers this previously reported Hipparcos/MASCARA frequency within the error bars reported by Maire et al. (2019). However, in our analysis this frequency is not among the six most significant frequencies (Table 1). Moreover, the amplitude from TESS for this frequency is only 0.750.03 mmag, whereas Koen & Eyer (2002) report a Hipparcos V-band amplitude of 5.3 mmag. A likely explanation is that the Hipparcos and MASCARA frequency was comprised of unresolved dipole gravity-modes that required the continuous 2-minute cadence of TESS to resolve. We conclude that this frequency is most likely due to gravity-mode pulsations, which means the stellar rotation period of 51 Eri is presently undetermined. Because this nominal rotation period was previously used to estimate the stellar spin-axis inclination (e.g., Feigelson et al., 2006; Maire et al., 2019), the coplanarity of the stellar equatorial plane with the orbit of 51 Eri b is presently unclear.222Consistent line-of-sight inclinations are a necessary but insufficient criteria for two planes to be mutually coplanar. Therefore, significantly differing inclinations can serve to rule out coplanarity, but similar inclinations on their own are consistent with, but do not confirm, coplanarity.
Li et al. (2020) used period-spacings for well-resolved Dor pulsations to infer their core rotation periods. They also derived independent surface rotation periods for 58 of the stars based on their surface rotational modulation signal that was well-separated from pulsation modes to prevent mistaking the pulsations as rotation. They found that both rotation periods were consistent within 5% for the entire subsample, suggesting that the core rotation is a reliable predictor of the surface rotation for these stars. Assuming that 51 Eri also rotates rigidly, a core rotation constraint can thus serve as a reliable tracer of the true surface stellar rotation period.
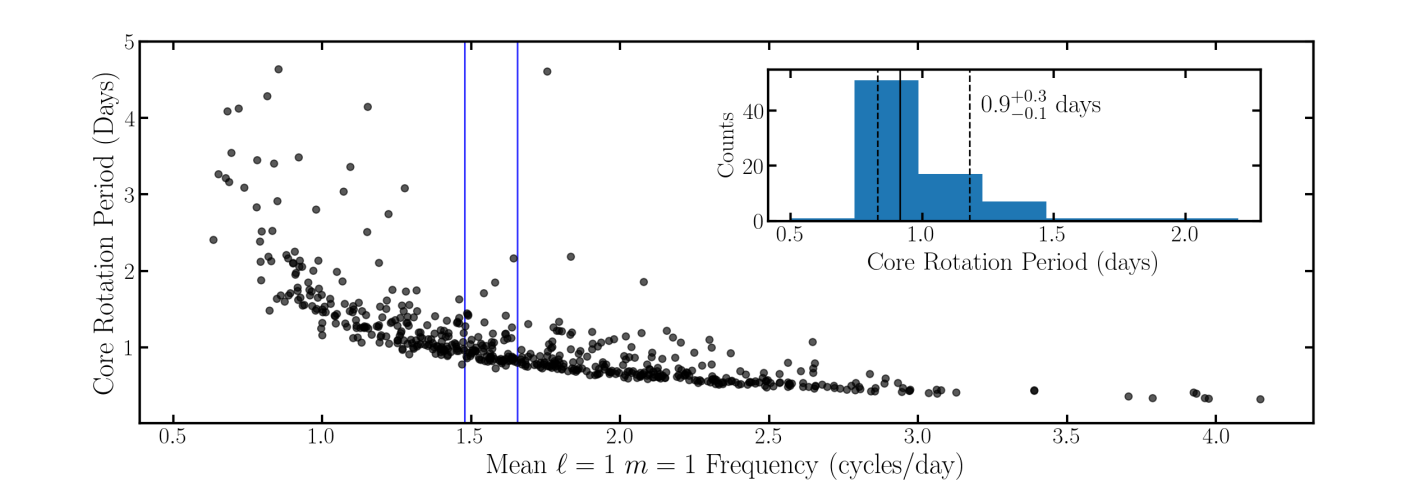
Figure 4 shows an empirical relationship between the mean frequency and the core rotation periods for the population of Dor stars from Li et al. (2020). We estimated a mean frequency of 1.570.09 cycles/day for 51 Eri using the mean of the four significant frequencies from Table 1 and using the error of the mean as the uncertainty. We then used this uncertainty as a boundary to define a subpopulation sample of core rotation periods (N=81) that correspond to the Li et al. (2020) Kepler Dor stars whose mean frequency is consistent with that of 51 Eri (Figure 4). A histogram of these samples is shown as an inset in Figure 4. The median and 16th/84th percentiles of these samples correspond to a core rotation period of 0.9 days, which indicates that the true surface stellar rotation period could lie in this range.
Until the core rotation for 51 Eri is directly measured, this histogram can be interpreted as a Bayesian prior for the expected rotation period of 51 Eri given our estimate of its mean frequency and given the empirical trends of the Kepler Dor population. We estimated the spin-axis inclination for 51 Eri using this 0.9 day stellar rotation period (). We follow Maire et al. (2019) in adopting a projected rotational velocity (sin) of 83 km/s, which is based on the spectroscopic sin measurements from Royer et al. (2007) and Luck (2017). We also used a radius of 1.67 from combining the stellar angular diameter measurement of 51 Eri (0.518 mas, Simon & Schaefer, 2011) with the inverse Gaia EDR3 parallax as the assumed distance. This results in an estimate of 62∘333In a similar fashion, if we instead assume an edge-on stellar inclination of for 51 Eri (which is similar to the orbital inclination of GJ 3305 AB, Montet et al., 2015) then this implies a maximum stellar rotation period estimate of 1.02 days. Truncating the core rotation period samples representative of 51 Eri (Figure 4) to only those that are also consistent with this maximum rotation period reduces the sample from N=81 to N=55 samples. The median and 16th/84th percentiles corresponding to this further reduced sample are 0.86 days.. We did not propagate the statistical uncertainties of the input parameters for our estimation (Masuda & Winn, 2020) nor included potential systematic uncertainty in the input sin value (which may be influenced by the Dor pulsations). In addition, the input is only an informed prediction. Therefore, we caution that our estimate of the stellar spin-axis inclination should not be treated as a robust measurement.
The core rotation period for 51 Eri may be measurable with future TESS observations that extend the continuous time baseline to better resolve the Dor pulsations. While such measurements typically require a long time baseline (e.g., we estimate 11 TESS sectors are required to formally resolve a period spacing of 600 s, which is a typical spacing for stars with a similar mean frequency to 51 Eri), Van Reeth et al. (2022) recently demonstrated that two continuous sectors of TESS photometry were required to measure the core rotation for the Dor star HD 112429. This was largely a consequence of ideal period spacing and pulsation properties, and a longer time baseline would still be needed to improve precision and explore other interior properties. Nonetheless, this demonstrates that the prospect of a future core rotation constraint for 51 Eri may not be far-fetched.
4 Conclusion & Future Directions
We analyzed TESS photometry to classify 51 Eri as a Dor pulsator. This star now joins HR 8799 as a directly-imaged exoplanet host star that is also a Dor variable. We noted that the previously quoted stellar rotation period of 0.65 days is most likely explained as pulsation modes, thereby making the stellar rotation period of 51 Eri presently undetermined. In light of this, the coplanarity of 51 Eri b’s orbit with the equitorial plane of its host star remains unknown. However, we are able to use our results to estimate a plausible rotation period of 0.9 days. We also found no significant evidence for transiting companions in our residual TESS light curve.
The detection of Dor pulsations makes 51 Eri the only directly-imaged exoplanet host star thus far for which an unambiguous asteroseismic age might be feasible. Additional TESS data and multi-color ground-based photometry will be required to confirm the mode identification presented here and facilitate pulsation mode modeling to determine an asteroseismic age. An asteroseismic age would have implications for the PMG in addition to all the constituents of the 51 Eri system.
Additional TESS data may also enable a measurement of the core rotation rate, which in turn will allow constraints on the surface rotation rate enabling a reevaluation of the stellar spin-axis inclination. Together with continued astrometric monitoring to reduce the uncertainty in the orbital inclination, this would thus also help exclude or make plausible a scenario where the orbit of 51 Eri b is coplanar with its host star. Either case is a key detail in investigating the dynamical history of this system.
Acknowledgements. We thank Travis Berger for crossmatching the Kepler Input Catalog with Gaia EDR3.
This material is based upon work supported by the National Science Foundation Graduate Research Fellowship Program under Grant No. 1842402. D.H. acknowledges support from the Alfred P. Sloan Foundation and the National Aeronautics and Space Administration (80NSSC21K0784). This research was funded in part by the Gordon and Betty Moore Foundation through Grant GBMF8550 to M. Liu. T.R.B. acknowledges support from the Australian Research Council (DP210103119).
This work has benefitted from The UltracoolSheet (Best et al., 2020), maintained by Will Best, Trent Dupuy, Michael Liu, Rob Siverd, and Zhoujian Zhang, and developed from compilations by Dupuy & Liu (2012), Dupuy & Kraus (2013), Liu et al. (2016), Best et al. (2018), and Best et al. (2021).
This paper includes data collected by the TESS mission, which are publicly available from the Mikulski Archive for Space Telescopes (MAST). Funding for the TESS mission is provided by the NASA’s Science Mission Directorate.
This work has made use of data from the European Space Agency (ESA) mission Gaia (https://www.cosmos.esa.int/gaia), processed by the Gaia Data Processing and Analysis Consortium (DPAC, https://www.cosmos.esa.int/web/gaia/dpac/consortium). Funding for the DPAC has been provided by national institutions, in particular the institutions participating in the Gaia Multilateral Agreement.
This research has made use of the SIMBAD database, operated at CDS, Strasbourg, France.
This research has made use of NASA’s Astrophysics Data System Bibliographic Services.
This research has made use of the VizieR catalogue access tool, CDS, Strasbourg, France (DOI : 10.26093/cds/vizier). The original description of the VizieR service was published in Ochsenbein et al. 2000.
References
- Abt & Morrell (1995) Abt, H. A., & Morrell, N. I. 1995, ApJS, 99, 135, doi: 10.1086/192182
- Antoci et al. (2019) Antoci, V., Cunha, M. S., Bowman, D. M., et al. 2019, MNRAS, 490, 4040, doi: 10.1093/mnras/stz2787
- Astropy Collaboration et al. (2013) Astropy Collaboration, Robitaille, T. P., Tollerud, E. J., et al. 2013, A&A, 558, A33, doi: 10.1051/0004-6361/201322068
- Astropy Collaboration et al. (2018) Astropy Collaboration, Price-Whelan, A. M., Sipőcz, B. M., et al. 2018, AJ, 156, 123, doi: 10.3847/1538-3881/aabc4f
- Balona (2012) Balona, L. A. 2012, MNRAS, 423, 3420, doi: 10.1111/j.1365-2966.2012.21135.x
- Balona (2015) —. 2015, MNRAS, 447, 2714, doi: 10.1093/mnras/stu2651
- Balona et al. (1994) Balona, L. A., Krisciunas, K., & Cousins, A. W. J. 1994, MNRAS, 270, 905, doi: 10.1093/mnras/270.4.905
- Bell et al. (2015) Bell, C. P. M., Mamajek, E. E., & Naylor, T. 2015, MNRAS, 454, 593, doi: 10.1093/mnras/stv1981
- Berger et al. (2020) Berger, T. A., Huber, D., van Saders, J. L., et al. 2020, AJ, 159, 280, doi: 10.3847/1538-3881/159/6/280
- Best et al. (2020) Best, W. M. J., Dupuy, T. J., Liu, M. C., Siverd, R. J., & Zhang, Z. 2020, The UltracoolSheet: Photometry, Astrometry, Spectroscopy, and Multiplicity for 3000+ Ultracool Dwarfs and Imaged Exoplanets, 1.0.0, Zenodo, doi: 10.5281/zenodo.4169085
- Best et al. (2021) Best, W. M. J., Liu, M. C., Magnier, E. A., & Dupuy, T. J. 2021, AJ, 161, 42, doi: 10.3847/1538-3881/abc893
- Best et al. (2018) Best, W. M. J., Magnier, E. A., Liu, M. C., et al. 2018, ApJS, 234, 1, doi: 10.3847/1538-4365/aa9982
- Borucki et al. (2010) Borucki, W. J., Koch, D., Basri, G., et al. 2010, Science, 327, 977, doi: 10.1126/science.1185402
- Bowler et al. (2020) Bowler, B. P., Blunt, S. C., & Nielsen, E. L. 2020, AJ, 159, 63, doi: 10.3847/1538-3881/ab5b11
- Brandt et al. (2021) Brandt, G. M., Dupuy, T. J., Li, Y., et al. 2021, AJ, 162, 301, doi: 10.3847/1538-3881/ac273e
- Brown et al. (2011) Brown, T. M., Latham, D. W., Everett, M. E., & Esquerdo, G. A. 2011, AJ, 142, 112, doi: 10.1088/0004-6256/142/4/112
- Brun & Browning (2017) Brun, A. S., & Browning, M. K. 2017, Living Reviews in Solar Physics, 14, 4, doi: 10.1007/s41116-017-0007-8
- Charbonneau (2010) Charbonneau, P. 2010, Living Reviews in Solar Physics, 7, 3, doi: 10.12942/lrsp-2010-3
- De Rosa et al. (2015) De Rosa, R. J., Nielsen, E. L., Blunt, S. C., et al. 2015, ApJ, 814, L3, doi: 10.1088/2041-8205/814/1/L3
- De Rosa et al. (2020) De Rosa, R. J., Nielsen, E. L., Wang, J. J., et al. 2020, AJ, 159, 1, doi: 10.3847/1538-3881/ab4da4
- Desidera et al. (2021) Desidera, S., Chauvin, G., Bonavita, M., et al. 2021, A&A, 651, A70, doi: 10.1051/0004-6361/202038806
- Dupuy et al. (2022) Dupuy, T. J., Brandt, G. M., & Brandt, T. D. 2022, MNRAS, 509, 4411, doi: 10.1093/mnras/stab3148
- Dupuy & Kraus (2013) Dupuy, T. J., & Kraus, A. L. 2013, Science, 341, 1492, doi: 10.1126/science.1241917
- Dupuy & Liu (2012) Dupuy, T. J., & Liu, M. C. 2012, ApJS, 201, 19, doi: 10.1088/0067-0049/201/2/19
- Feigelson et al. (2006) Feigelson, E. D., Lawson, W. A., Stark, M., Townsley, L., & Garmire, G. P. 2006, AJ, 131, 1730, doi: 10.1086/499923
- Franson et al. (2022) Franson, K., Bowler, B. P., Brandt, T. D., et al. 2022, AJ, 163, 50, doi: 10.3847/1538-3881/ac35e8
- Gaia Collaboration et al. (2016) Gaia Collaboration, Prusti, T., de Bruijne, J. H. J., et al. 2016, A&A, 595, A1, doi: 10.1051/0004-6361/201629272
- Gaia Collaboration et al. (2021) Gaia Collaboration, Brown, A. G. A., Vallenari, A., et al. 2021, A&A, 649, A1, doi: 10.1051/0004-6361/202039657
- Ginsburg et al. (2019) Ginsburg, A., Sipőcz, B. M., Brasseur, C. E., et al. 2019, AJ, 157, 98, doi: 10.3847/1538-3881/aafc33
- Green et al. (2019) Green, G. M., Schlafly, E., Zucker, C., Speagle, J. S., & Finkbeiner, D. 2019, ApJ, 887, 93, doi: 10.3847/1538-4357/ab5362
- Grigahcène et al. (2010) Grigahcène, A., Antoci, V., Balona, L., et al. 2010, ApJ, 713, L192, doi: 10.1088/2041-8205/713/2/L192
- Guarinos (1992) Guarinos, J. 1992, in European Southern Observatory Conference and Workshop Proceedings, Vol. 43, European Southern Observatory Conference and Workshop Proceedings, 301
- Harris et al. (2020) Harris, C. R., Millman, K. J., van der Walt, S. J., et al. 2020, Nature, 585, 357, doi: 10.1038/s41586-020-2649-2
- Hey et al. (2021) Hey, D. R., Montet, B. T., Pope, B. J. S., Murphy, S. J., & Bedding, T. R. 2021, AJ, 162, 204, doi: 10.3847/1538-3881/ac1b9b
- Høg et al. (2000) Høg, E., Fabricius, C., Makarov, V. V., et al. 2000, A&A, 355, L27
- Hunter (2007) Hunter, J. D. 2007, Computing in Science Engineering, 9, 90, doi: 10.1109/MCSE.2007.55
- Jenkins et al. (2016) Jenkins, J. M., Twicken, J. D., McCauliff, S., et al. 2016, in Society of Photo-Optical Instrumentation Engineers (SPIE) Conference Series, Vol. 9913, Proc. SPIE, 99133E, doi: 10.1117/12.2233418
- Kallinger & Matthews (2010) Kallinger, T., & Matthews, J. M. 2010, ApJ, 711, L35, doi: 10.1088/2041-8205/711/1/L35
- Kallinger et al. (2008) Kallinger, T., Reegen, P., & Weiss, W. W. 2008, A&A, 481, 571, doi: 10.1051/0004-6361:20077559
- Kasper et al. (2007) Kasper, M., Apai, D., Janson, M., & Brandner, W. 2007, A&A, 472, 321, doi: 10.1051/0004-6361:20077646
- Kaye et al. (1999) Kaye, A. B., Handler, G., Krisciunas, K., Poretti, E., & Zerbi, F. M. 1999, PASP, 111, 840, doi: 10.1086/316399
- Koen & Eyer (2002) Koen, C., & Eyer, L. 2002, MNRAS, 331, 45, doi: 10.1046/j.1365-8711.2002.05150.x
- Kovács et al. (2002) Kovács, G., Zucker, S., & Mazeh, T. 2002, A&A, 391, 369, doi: 10.1051/0004-6361:20020802
- Kurtz (2022) Kurtz, D. W. 2022, Annual Review of Astronomy and Astrophysics, 60, null, doi: 10.1146/annurev-astro-052920-094232
- Li et al. (2020) Li, G., Van Reeth, T., Bedding, T. R., et al. 2020, MNRAS, 491, 3586, doi: 10.1093/mnras/stz2906
- Lightkurve Collaboration et al. (2018) Lightkurve Collaboration, Cardoso, J. V. d. M., Hedges, C., et al. 2018, Lightkurve: Kepler and TESS time series analysis in Python, Astrophysics Source Code Library. http://ascl.net/1812.013
- Liu et al. (2016) Liu, M. C., Dupuy, T. J., & Allers, K. N. 2016, ApJ, 833, 96, doi: 10.3847/1538-4357/833/1/96
- Luck (2017) Luck, R. E. 2017, AJ, 153, 21, doi: 10.3847/1538-3881/153/1/21
- Macintosh et al. (2015) Macintosh, B., Graham, J. R., Barman, T., et al. 2015, Science, 350, 64, doi: 10.1126/science.aac5891
- Maire et al. (2019) Maire, A. L., Rodet, L., Cantalloube, F., et al. 2019, A&A, 624, A118, doi: 10.1051/0004-6361/201935031
- Malo et al. (2013) Malo, L., Doyon, R., Lafrenière, D., et al. 2013, ApJ, 762, 88, doi: 10.1088/0004-637X/762/2/88
- Mamajek & Bell (2014) Mamajek, E. E., & Bell, C. P. M. 2014, MNRAS, 445, 2169, doi: 10.1093/mnras/stu1894
- Marley et al. (2007) Marley, M. S., Fortney, J. J., Hubickyj, O., Bodenheimer, P., & Lissauer, J. J. 2007, ApJ, 655, 541, doi: 10.1086/509759
- Marois et al. (2008) Marois, C., Macintosh, B., Barman, T., et al. 2008, Science, 322, 1348, doi: 10.1126/science.1166585
- Marois et al. (2010) Marois, C., Zuckerman, B., Konopacky, Q. M., Macintosh, B., & Barman, T. 2010, Nature, 468, 1080, doi: 10.1038/nature09684
- Masuda & Winn (2020) Masuda, K., & Winn, J. N. 2020, AJ, 159, 81, doi: 10.3847/1538-3881/ab65be
- Miret-Roig et al. (2020) Miret-Roig, N., Galli, P. A. B., Brandner, W., et al. 2020, A&A, 642, A179, doi: 10.1051/0004-6361/202038765
- Montet et al. (2015) Montet, B. T., Bowler, B. P., Shkolnik, E. L., et al. 2015, ApJ, 813, L11, doi: 10.1088/2041-8205/813/1/L11
- Mordasini (2013) Mordasini, C. 2013, A&A, 558, A113, doi: 10.1051/0004-6361/201321617
- Moya et al. (2010) Moya, A., Amado, P. J., Barrado, D., et al. 2010, MNRAS, 405, L81, doi: 10.1111/j.1745-3933.2010.00863.x
- Murphy et al. (2019) Murphy, S. J., Hey, D., Van Reeth, T., & Bedding, T. R. 2019, MNRAS, 485, 2380, doi: 10.1093/mnras/stz590
- Ochsenbein et al. (2000) Ochsenbein, F., Bauer, P., & Marcout, J. 2000, A&AS, 143, 23, doi: 10.1051/aas:2000169
- pandas development team (2021) pandas development team, T. 2021, pandas-dev/pandas: Pandas 1.3.1, v1.3.1, Zenodo, doi: 10.5281/zenodo.5136416
- Pawellek et al. (2021) Pawellek, N., Wyatt, M., Matrà, L., Kennedy, G., & Yelverton, B. 2021, MNRAS, 502, 5390, doi: 10.1093/mnras/stab269
- Pedersen et al. (2017) Pedersen, M. G., Antoci, V., Korhonen, H., et al. 2017, MNRAS, 466, 3060, doi: 10.1093/mnras/stw3226
- Rajan et al. (2017) Rajan, A., Rameau, J., De Rosa, R. J., et al. 2017, AJ, 154, 10, doi: 10.3847/1538-3881/aa74db
- Reegen (2007) Reegen, P. 2007, A&A, 467, 1353, doi: 10.1051/0004-6361:20066597
- Reegen (2011) —. 2011, Communications in Asteroseismology, 163, 3. https://arxiv.org/abs/1006.5081
- Reid et al. (2004) Reid, I. N., Cruz, K. L., Allen, P., et al. 2004, AJ, 128, 463, doi: 10.1086/421374
- Ricker et al. (2015) Ricker, G. R., Winn, J. N., Vanderspek, R., et al. 2015, Journal of Astronomical Telescopes, Instruments, and Systems, 1, 014003, doi: 10.1117/1.JATIS.1.1.014003
- Riviere-Marichalar et al. (2014) Riviere-Marichalar, P., Barrado, D., Montesinos, B., et al. 2014, A&A, 565, A68, doi: 10.1051/0004-6361/201322901
- Royer et al. (2007) Royer, F., Zorec, J., & Gómez, A. E. 2007, A&A, 463, 671, doi: 10.1051/0004-6361:20065224
- Samland et al. (2017) Samland, M., Mollière, P., Bonnefoy, M., et al. 2017, A&A, 603, A57, doi: 10.1051/0004-6361/201629767
- Simon & Schaefer (2011) Simon, M., & Schaefer, G. H. 2011, ApJ, 743, 158, doi: 10.1088/0004-637X/743/2/158
- Smith et al. (2012) Smith, J. C., Stumpe, M. C., Van Cleve, J. E., et al. 2012, PASP, 124, 1000, doi: 10.1086/667697
- Sódor & Bognár (2020) Sódor, Á., & Bognár, Z. 2020, in Stars and their Variability Observed from Space, ed. C. Neiner, W. W. Weiss, D. Baade, R. E. Griffin, C. C. Lovekin, & A. F. J. Moffat, 91–92
- Sódor et al. (2014) Sódor, Á., Chené, A. N., De Cat, P., et al. 2014, A&A, 568, A106, doi: 10.1051/0004-6361/201423976
- Spiegel & Burrows (2012) Spiegel, D. S., & Burrows, A. 2012, ApJ, 745, 174, doi: 10.1088/0004-637X/745/2/174
- Stumpe et al. (2014) Stumpe, M. C., Smith, J. C., Catanzarite, J. H., et al. 2014, PASP, 126, 100, doi: 10.1086/674989
- Stumpe et al. (2012) Stumpe, M. C., Smith, J. C., Van Cleve, J. E., et al. 2012, PASP, 124, 985, doi: 10.1086/667698
- Van Reeth et al. (2016) Van Reeth, T., Tkachenko, A., & Aerts, C. 2016, A&A, 593, A120, doi: 10.1051/0004-6361/201628616
- Van Reeth et al. (2022) Van Reeth, T., De Cat, P., Van Beeck, J., et al. 2022, A&A, 662, A58, doi: 10.1051/0004-6361/202142921
- Virtanen et al. (2020) Virtanen, P., Gommers, R., Oliphant, T. E., et al. 2020, Nature Methods, 17, 261, doi: 10.1038/s41592-019-0686-2
- Wang & Chen (2019) Wang, S., & Chen, X. 2019, ApJ, 877, 116, doi: 10.3847/1538-4357/ab1c61
- Zerbi et al. (1999) Zerbi, F. M., Rodríguez, E., Garrido, R., et al. 1999, MNRAS, 303, 275, doi: 10.1046/j.1365-8711.1999.02209.x
- Zieba et al. (2019) Zieba, S., Zwintz, K., Kenworthy, M. A., & Kennedy, G. M. 2019, A&A, 625, L13, doi: 10.1051/0004-6361/201935552
- Zuckerman et al. (2001) Zuckerman, B., Song, I., Bessell, M. S., & Webb, R. A. 2001, ApJ, 562, L87, doi: 10.1086/337968