Physical properties of MnSi at extreme doping with Co: Quantum criticality.
Abstract
The samples of (Mn1-xCox)Si with and were grown and their physical properties: magnetization and magnetic susceptibility, resistivity and heat capacity were studied. The data analysis included also the previous results at . The indicated doping MnSi with Co completely destroys the helical phase transition whereas basically saves the helical fluctuation area normally situated slightly above the phase transition temperature. This area spreading from 5 to 0 K is not changed much with doping and forms some sort of helical fluctuation cloud revealing the quantum critical properties: at .
I Introduction
The study of quantum criticality in the model substance of MnSi by doping with Fe and Co were carried out in Ref. 1 ; 2 ; 3 ; 4 . The main idea was to imitate the high-pressure condition by substituting Mn with smaller ions that would place the material in a situation where the pure MnSi experiences a quantum phase transition at zero temperature 5 ; 6 ; 7 . As was shown in Ref. 1 ; 2 the helical phase transition in (Mn1-xFex)Si can be seen close to zero temperature at doping level . At the same time in case of (Mn1-xCox)Si doping MnSi with Co completely destroys the phase transition at and temperature about 8 K. However, the helical fluctuation maxima or humps, which are normally situated slightly above the phase transition temperature, survive even much heavier doping 4 . Although, temperature of the mentioned maxima appears to be not quite sensitive to doping above . This intriguing feature led to a tentative conclusion, which should be verified, that at large concentration of Co substitutes a cloud of the helical fluctuations spreading over a significant range of concentrations and temperatures arose close to 0 K (Ref. 4 ).
II Experimental results and discussion
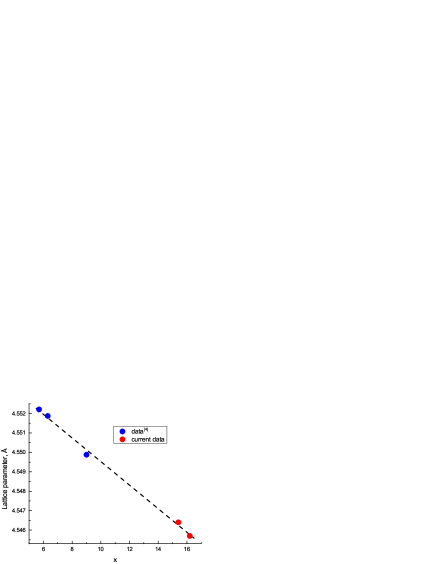
With all that in mind we decided to extend our previous study 4 by including samples with larger concentration of Co dopant that probably could throw a new light to this problem. The samples of (Mn1-xCox)Si with were prepared by a procedure, described in Ref. 4 and two of them with and , as determined by the electron probe microanalysis, were selected for further examination. The lattice parameters of the samples, measured by the X-ray powder diffraction techniques, are correspondingly 4.5464 Å and 4.5457 Å.
Fig. 1 illustrates a dependence of the lattice parameters of (Mn1-xCox)Si on the Co content. Note that the lattice parameter of the material with reaches the corresponding value for pure MnSi at the quantum phase transition phase point at pressure about 14 kbar 3 .
The magnetization curves of (Mn1-xCox)Si including those studied earlier 4 are shown in Fig 2. The curves are naturally shifted with the Co concentration changing a form and gradually loosing saturation features. That was observed also in Ref. 2 at smaller Co concentrations.
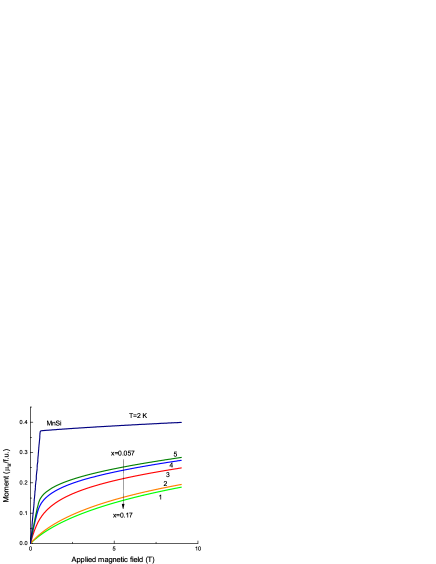
In fact, as seen in Fig. 2 a saturation of magnetization does not occur in the doped samples even at magnetic fields to . It should be noted here that a spin system in heavy doped (Mn1-xCox)Si samples at low temperatures as it will be evident further has a kind of disordered structure complicated by the intense helical fluctuations 8 ; 9 and the Co impurity spins. Why all this prevent the magnetization from saturation remain to be seen.
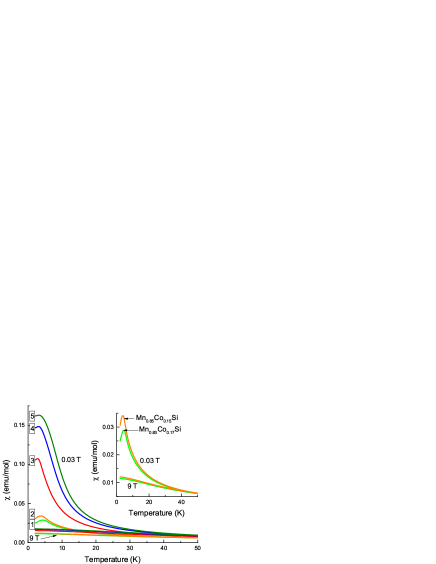
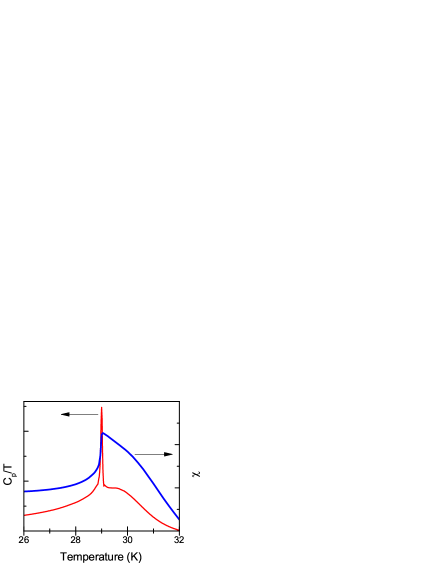
Nevertheless, as one can see in Fig. 3 absolutely clear evidences of peculiar behaviour of magnetic susceptibility that most certainly genetically connected with the inflection point on curve of pure MnSi slightly above the phase transition point 10 . In turn the inflection point corresponds to the helical fluctuation maximum discovered at heat capacity measurements in the same range of temperature 10 (see Fig. 4). So, it suggests that the helical fluctuations survive the heavily doping of MnSi with Co.
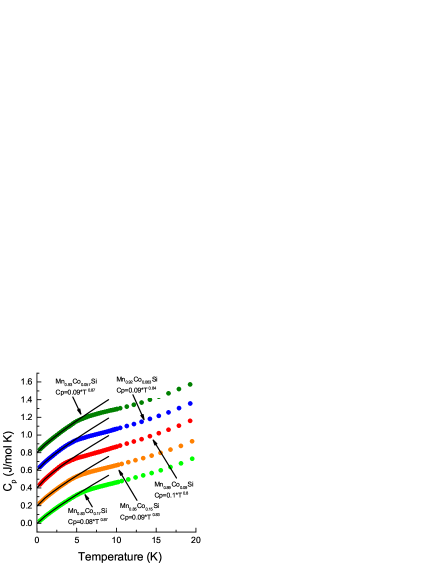
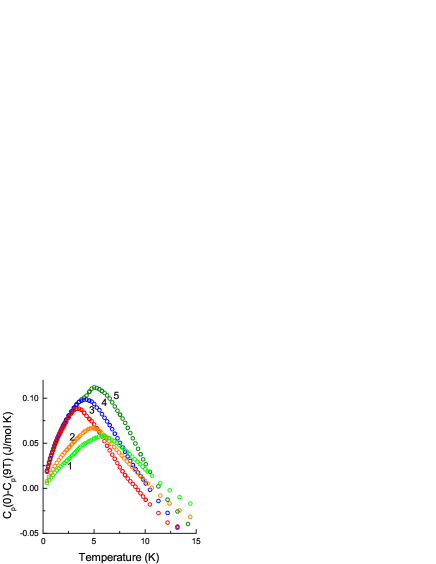
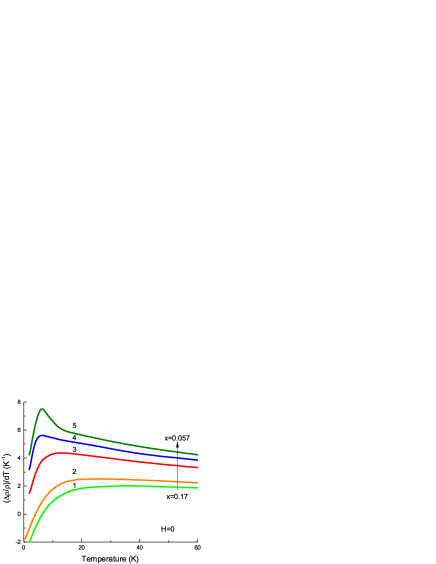
Another proofs for that follows from the heat capacity measurements shown in Fig. 5, where the new results are displayed together with the data 4 . As is seen in Fig. 5 the heat capacity curves noticeably change their slops at temperatures about 5 K. The low temperature parts of the curves can be described by the power function with the exponents less than one (Fig. 5). This immediately leads to the diverging ratio , which is a signature of quantum critical behaviour (Fig. 6). The mentioned slope change becomes more evident after a subtraction from the heat capacity curve at zero magnetic field the corresponding curve at as it was suggested in Ref. 4 (see Fig. 7).
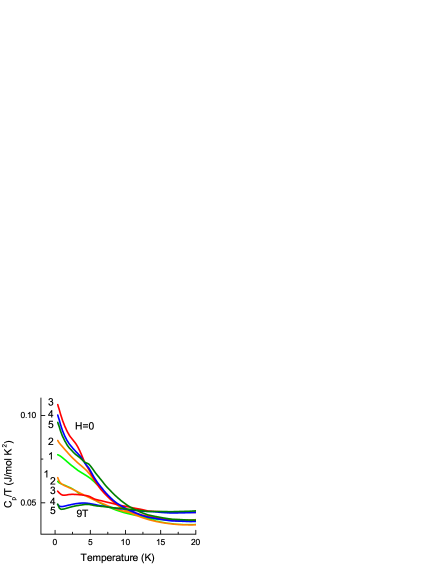
A behavior of ratio of all samples (Mn1-xCox)Si is demonstrated in Fig. 6. The diverging of at is obvious, but a weak response of samples with and to applied magnetic field may indicate an increase of the intensity of fluctuations.
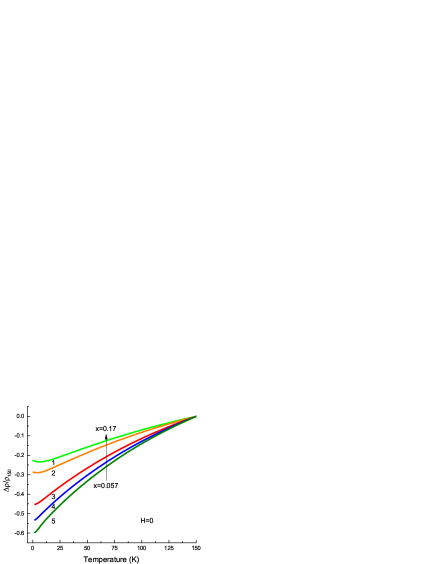
How as seen in Fig. 8 the temperature dependence of resistivity of samples becomes reduced with the doping increase that is actually expected. But the weak localization features for samples with and (see Fig. 9) were not anticipated on the basis of heat capacity data, which show no distinct differences between the samples. So, the conductivity electrons probably do not contribute to the magnetic fluctuation phenomena.
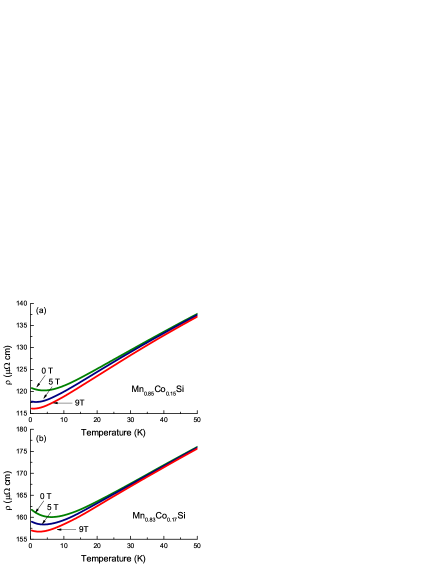
Temperature derivatives of resistivity of the samples (Mn1-xCox)Si depicted in Fig. 10 show progressive degradation of the specific features of corresponding curves with doping therefore probably indicating that the electron scattering on magnetic fluctuations becomes dominated by the impurity scattering.
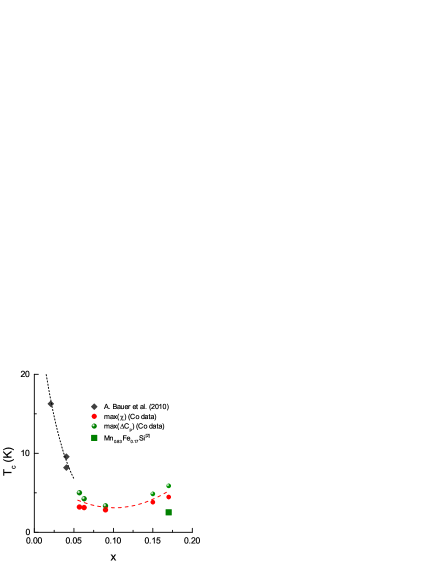
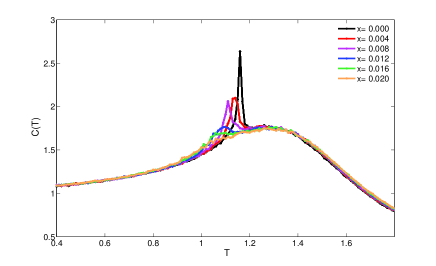
We can see in Fig. 11 that the helical fluctuations do not disappear on heavy doping with Co. Moreover, the temperature of fluctuation maxima practically does not change with Co concentration as a contrast to a behavior of the phase transition temperature. So, we have to confirm our former conclusion that that at large concentration of Co substitutes a cloud of the helical fluctuations spreading over a significant range of concentrations and temperatures arose close to 0 K (Ref. 4 ). Some insight can be obtained from Fig. 12, where a result of the Monte-Carlo modelling of behaviour of a classical spin system with the frozen impurities in interstitial positions is shown 11 . As is seen the helical phase transition in this spin system disappears with doping whereas the fluctuation maximum is not changed at all. Probably just a frozen nature of impurities not an exact their positions are responsible for such behavior of fluctuations.
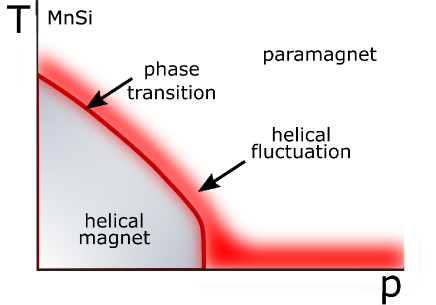
It needs to be reminded that as a difference to the spin model our real (Mn1-xCox)Si system experience a regular volume decrease on doping (see Fig. 1) that is equivalent to hydrostatic compression of the material. So, if we would try to describe our finding (Fig. 11) in terms of temperature and pressure it would look like the diagram depicted in Fig. 13. The suggested extended region of helical fluctuations in Fig. 13 probably correlates with early findings of the non-Fermi liquid behaviour 12 and the partial order 13 in pure MnSi at pressure above the magnetic phase transition and low temperature.
III Summary and conclusion
1. The observed linear dependence of the lattice parameters of (Mn1-xCox)Si (Vegard rule) indicates that the Co component forms a solid solution with MnSi at the studied concentrations (Fig. 1).
2. A saturation of magnetization does not occur in the doped samples to (Fig. 2). This correlates with a weak response of the diverging part of to strong magnetic field.
3. The helical fluctuations survive the heavily doping of MnSi with Co (Fig. 3).
4. The low temperature parts of the heat capacity curves can be described by the power function with the exponents less than one. This immediately leads to the diverging ratio , which is a signature of quantum critical behaviour (Fig. 5).
5. The diverging of at is clearly observed, but a weak response of samples with and to applied strong magnetic field looks surprising though perhaps indicates a change in the intensity of helical interaction (Fig. 6).
6. The weak localization features for samples with and (see a Fig. 9) were observed.
7. Temperature derivatives of resistivity of the samples (Mn1-xCox)Si show progressive degradation of the specific features of corresponding curves with doping therefore probably indicating that the electron scattering on magnetic fluctuations becomes dominated by the impurity scattering (Fig. 10).
8. Helical fluctuations do not disappear on heavy doping with Co. Moreover, the temperature of fluctuation maxima practically does not change with Co concentration as a contrast to a behaviour of the phase transition temperature (Fig. 11).
IV Acknowledgements
The authors gratefully acknowledge the technical support of Dr. V.A. Sidorov.
References
- (1) C. Meingast, Q. Zhang, T. Wolf, F. Hardy, K. Grube, W. Knafo, P. Adelmann, P. Schweiss, H. v. Löhneysen; V. Zlatić, A. C. Hewson (eds.), Properties and Applications of Thermoelectric Materials, 261 NATO Science for Peace and Security Series B: Physics and Biophysics, Springer Science-Business Media B.V. (2009).
- (2) A. Bauer, A. Neubauer, C. Franz, W. Münzer, M. Garst, and C. Pfleiderer, Phys. Rev. B 82, 064404 (2010).
- (3) A. E. Petrova, S. Yu. Gavrilkin, D. Menzel, and S. M. Stishov, Phys. Rev. B 100, 094403 (2019).
- (4) A. E. Petrova, S. Y. Gavrilkin, G. V. Rybalchenko, D. Menzel, I. P. Zibrov, and S. M. Stishov, Phys. Rev. B 103, L180401 (2021).
- (5) J. D. Thompson, Z. Fisk, and G. G. Lonzarich, Phys. B (Amsterdam, Neth.) 161, 317 (1989).
- (6) C. Pfleiderer, G. J. McMullan, and G. G. Lonzarich, Phys. B (Amsterdam, Neth.) 206–207, 847 (1995).
- (7) C. Thessieu, J. Flouquet, G. Lapertot, A. N. Stepanov, and D. Jaccard, Solid State Commun. 95, 707 (1995).
- (8) C. Pappas, E. Leli‘evre-Berna, P. Falus, P.M.Bentley, E. Moskvin, S. Grigoriev, P. Fouquet, and B. Farago, Phys. Rev. Lett. 102, 197202 (2009).
- (9) S. V. Grigoriev, E. V. Moskvin, V. A. Dyadkin, D. Lamago, T. Wolf, H. Eckerlebe, and S. V. Maleyev, Phys. Rev. B 83, 224411 (2011)
- (10) S. M. Stishov, A. E. Petrova, S. Khasanov, G. K. Panova, A. A. Shikov, J. C. Lashley, D. Wu, and T. A. Lograsso, Phys. Rev. B 76, 052405 (2007).
- (11) A. M. Belemuk, S. M. Stishov, Phys. Rev. B 104, 064404 (2021)
- (12) C. Pfleiderer, S. R. Julian, G. G. Lonzarich, Nature 414, 427 (2001)
- (13) C. Pfleiderer, D. Reznik, L. Pintschovius, H. v. Löhneysen, M. Garst, A. Rosch, Nature 427, 227 (2004)