Planetesimals Around Stars with TESS (PAST): II. An M Dwarf “Dipper" Star with a Long-Lived Disk in the TESS Continuous Viewing Zone
Abstract
Studies of T Tauri disks inform planet formation theory; observations of variability due to occultation by circumstellar dust are a useful probe of unresolved, planet-forming inner disks, especially around faint M dwarf stars. We report observations of 2M0632, an M dwarf member of the Carina young moving group that was observed by TESS over two one-year intervals. The combined light curve contains 300 dimming events, each lasting a few hours, and as deep as 40% (0.55 magnitudes). These stochastic events are correlated with a distinct, stable 1.86-day periodic signal that could be stellar rotation. Concurrent ground-based, multi-band photometry show reddening consistent with ISM-like dust. The star’s excess emission in the infrared and emission lines in optical and infrared spectra, reveal a T Tauri-like accretion disk around the star. We confirm membership of 2M0632 in the Carina group by a Bayesian analysis of its Galactic space motion and position. We combine stellar evolution models with Gaia photometry and constraints on , luminosity, and the absence of detectable lithium in the photosphere to constrain the age of the group and 2M0632 to 40-60 Myr, consistent with earlier estimates. 2M0632 joins a handful of long-lived disks which challenge the canon that disk lifetimes are Myr. All known examples surround M dwarfs, suggesting that lower X-ray/UV irradiation and slower photoevaporation by these stars can dramatically affect disk evolution. The multi-planet systems spawned by long-lived disks probably experienced significant orbital damping and migration into close-in, resonant orbits, and perhaps represented by the TRAPPIST-1 system.
keywords:
stars: low mass – T Tauri, Herbig Ae/Be – circumstellar matter – planetary systems – Galaxy: open clusters and associations – protoplanetary disks1 Introduction
Space-based transit surveys, particularly Kepler, have revealed that Earth- to Neptune-size planets are common around other stars (Silburt et al., 2015; Hsu et al., 2019; Bryson et al., 2021). They also indicate that the occurrence of small planets on close-in orbits increases with decreasing stellar mass (Mulders et al., 2015; Hardegree-Ullman et al., 2019). Due to the low luminosity of these stars, some of these planets could have equilibrium temperatures that are consistent with the stability field of liquid water, and could in principle be habitable if they are rocky and Earth-like. The planetary systems of nearby M dwarfs represent the most promising targets for characterization of habitable planets and searches for atmospheric biosignatures, e.g. with JWST (Greene et al., 2019; Lustig-Yaeger et al., 2019; Tremblay et al., 2020).
M dwarf stars differ significantly from their solar-mass counterparts: do these differences manifest themselves in the properties of their planetary systems? For example, impacts onto planets in the compact habitable zones of M dwarfs will be at higher velocities and be more erosive of any atmospheres (Lissauer, 2007). These planets will also experience elevated high-energy (X-ray and UV) irradiance (Ansdell et al., 2015), which is expected to heat, inflate, and evaporate atmospheres (Owen, 2019). The slower pre-main sequence evolution of M dwarfs means that planets orbiting in the habitable zone experience prolonged high total irradiation at early times that could drive a runaway greenhouse and loss of H2O by escape of H to space (Luger & Barnes, 2015). Other differences could arise during planet formation due to differences in the structures (Gaidos, 2017), temperature distribution (Kennedy et al., 2007; Mulders et al., 2021), and lifetime (Zawadzki et al., 2021) of disks. There may be other, less obvious but equally profound differences such as the abundance of short-lived radionuclides (e.g., 26Al) that heat the interiors of planetesimals (Gaches et al., 2020).
Studies of disks around young stellar objects (YSOs) as counterparts to those which formed the planetary systems detected around older stars offer insight into potential variation along the main sequence. But the regions of most disks corresponding to the orbits of most known planets ( au) cannot be resolved at the distance of the nearest star-forming regions, even by the ALMA mm-wave interferometer. Near-infrared Interferometers such as GRAVITY can resolve the inner regions of the brightest T Tauri disks, but sample the - spatial frequency plane less and allow fitting of relatively simple disk models (Perraut & Gravity Collaboration, 2021; Bohn et al., 2022). Disks around M dwarf stars are even more challenging to study because they are less luminous and host less massive disks (Pascucci et al., 2016). As a result, comparatively little is known about disks around the lowest-mass stars. Multiple studies found a trend of increasing disk fraction at a given age (and by infererence disk lifetime) with decreasing stellar mass (e.g., Luhman & Mamajek, 2012; Ribas et al., 2015), although this trend may be at least in part the product of detection bias and inappropriate pre-main sequence stellar models (Richert et al., 2018). Disk mass and accretion rates are observed to approximately scale with stellar mass and its square, espectively (Manara et al., 2022, and references therein), naively suggesting disk lifetime inversely decreases with stellar mass. Kastner et al. (2016) suggest substantially longer disk lifetime among M dwarfs related to their intrinsic high-energy luminosity and pre-main sequence lifetime. In addition, a handful of other long-lived ( Myr) disks have been identified, all around M dwarfs (Silverberg et al., 2020). This may be related to low predicted evaporation rates for disks around such stars (Wilhelm & Portegies Zwart, 2022).
One approach to study inner protoplanetary disks is to observe the variability produced by circumstellar material as it occults the star (Herbst et al., 1994). As is the case for exoplanets, observations of occultations are far more sensitive to circumstellar material than scattering or emission, and can be performed on fainter stars such as M dwarfs. If a disk is highly inclined towards our line of sight, occultations can be produced by stellar magnetosphere-funneled accretion flows from the inner disk edge onto the star (Bouvier et al., 2003; Bodman et al., 2017), and vertical structures that are the result of instabilities such as the Rossby wave instability (Stauffer et al., 2015; Ansdell et al., 2016). Other mechanisms need not require an inclined disk, or a disk at all, e.g., dust lofted in disk winds (Varga et al., 2017; Fernandes et al., 2018), gravitationally bound clumps of planetesimals (Ansdell et al., 2016), disintegrating comet-like planetesimals (Kennedy et al., 2017; Ansdell et al., 2019), or evaporating planets (Rappaport et al., 2012; Sanchis-Ojeda et al., 2015). Such occultations are opportunities to probe the properties and composition of dust and gas close to the star through wavelength-dependent scattering and polarization (Natta et al., 1997; Bouvier et al., 2014), and atomic or molecular line absorption (Sorelli et al., 1996; Zhang et al., 2015; Gaidos et al., 2019a).
Although dimming due to occultation by circumstellar dust has been studied from the ground for decades, e.g. among UX Orionis-type variables and a few low-mass stars (e.g., Herbst et al., 1994; Bouvier et al., 1999), recent space-based photometry of (10 Myr) star-forming regions by CoRoT, Spitzer and K2 has greatly expanded the number and diversity of stars known to exhibit dimming. Notably, many “dipper" stars exhibit quasi-periodic or stochastic dimming that is on the timescale of one day (Alencar et al., 2010; Morales-Calderón et al., 2011; Cody et al., 2014; Ansdell et al., 2016); this photometric behavior is difficult to detect and monitor from the ground. The Transiting Exoplanet Survey Satellite (TESS) is obtaining precise photometry over nearly the entire sky with a cadence of 30 min for intervals of at least 27 days (Ricker et al., 2014). This permits monitoring of and discovery of dimming events in stellar clusters and dispersed young moving groups (YMGs) with an even great range of ages (Gaidos et al., 2019b). The Gaia astrometric mission (Gaia Collaboration et al., 2016; Lindegren et al., 2018) is allowing new members of such YMGs to be identified, as well as new groups themselves (Faherty et al., 2018; Tang et al., 2019), and to estimate the ages of these groups by comparison of color-magnitude diagrams to stellar models. This Gaia-TESS synergy promises to revolutionize our understanding of stellar variability caused by orbiting planetesimals and dust.
Here we describe 2M0632, a nearby (93 pc) M-dwarf member of the Carina young moving group that exhibits both dipper-like variability as well as all the hallmarks of a T Tauri-like accretion disk. Its location in the TESS Southern Continuous Viewing Zone (SCVZ) means that TESS observations have afforded two nearly continuous year-long light curves, providing a high-precision picture of its variability on time scales of minutes to a 1 year. The Carina young moving group was previously assigned an age of 45 Myr (Bell et al., 2015), thus this star along with several previously described systems (Murphy et al., 2018; Silverberg et al., 2020), seem to have maintained disks for an order of magnitude longer than the canonical disk lifetime of 5 Myr (Bell et al., 2013). In this work, we combine the unparalleled TESS dataset of this star with ground-based observations to examine the dimming phenomenon in more detail, investigate the properties of its disk, and exploit the precision of Gaia astrometry and photometry to re-assess the age of the host stellar group and this unusual object.
2 Observations and Data Reduction
2.1 TESS
TESS photometer data were retrieved from the Mikulski Archive for Space Telescopes (MAST). TESS light curves are manually inspected by the Visual Survey Group, a team of citizen and academic scientists, for notable phenomena, including “dipper" stars. The search is conducted using LcTools (Schmitt et al., 2019), a free and publicly available software program that provides a set of applications for efficiently building and visually inspecting large numbers of light curves (Kipping et al., 2015). For more details on the LcTools package and the visual survey methodology, see Rappaport et al. (2018). TESS Input Catalog (TIC) source 167303776 was flagged for its variability by the Visual Survey Group on 3 March 2019, and subsequently identify by Tajiri et al. (2020) as a candidate “dipper" star using a convolutional neural network trained on a set of eclipsing binary light curves. TIC 167303776 is associated with the 2MASS infrared source J06320799-6810419 and hereafter is referred to as 2M0632.
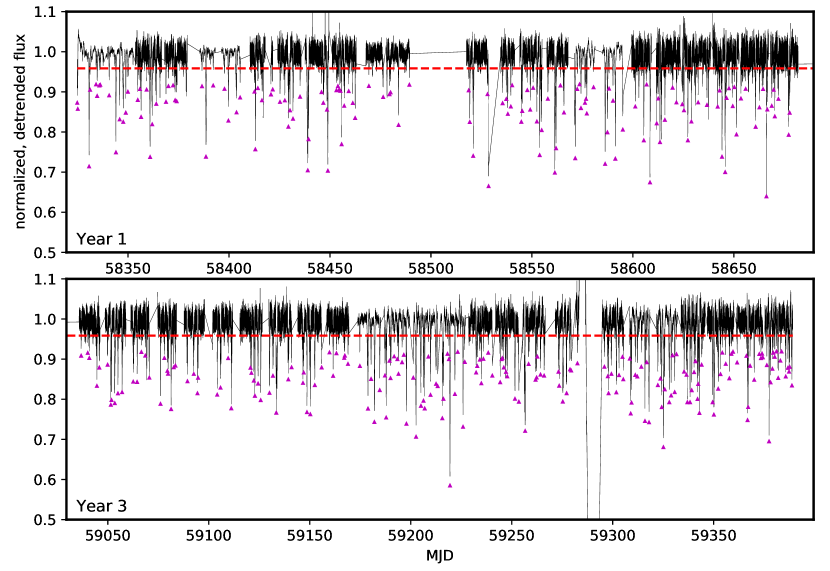
2M0632 was observed by TESS over the first (Sectors 1-13) and third (Sectors 27-39) years of its mission, with the exception of a 27-day interval (Sector 7). The star was not selected as a 2-min cadence target in Sectors 1, 3, 10, 32, and 37, thus light curves for those sectors were obtained from the TESS-SPOC pipeline analysis of the 30- or 15-min Full Frame Image data (Caldwell et al., 2020). The Pre-search Data Conditional Simple Aperture (PDCSAP) photometry with an optimized 3- or 4-pixel aperture was used. Slow variation that is an artifact of spacecraft pointing drift and the rotation of the field between sectors was removed by iterative third-order, 300-point Savitzky-Golay filtering (Savitzky & Golay, 1964) of a high- and low-flux-clipped set of points, where the clip thresholds of top 1% and bottom 40% were chosen to exclude dimming events based on inspection. The light curve was normalized by the filtered, clipped curve, the ordered pixel values and clip thresholds recomputed, and the fit repeated iteratively until convergence. To make the noise properties of the composite light curve, which contains observations at different cadence, more uniform, the detrended version was convolved with a Gaussian with a FWHM of 15 min. This preserves the structure in the long-cadence data (30 min) while increasing the SNR of the short-cadence (2 min) data. Figure 1 shows the resulting normalized, composite light curve.
2.2 LCOGT photometry
Observations of 2M0632 were obtained with the 0.4-m telescope network of the Las Cumbres Observatory Global Telescope (LCOGT, Brown et al., 2013). Each telescope is equipped with a 3K 2K SBIG 6303 camera with 0″.571 pixels and a field of view of 29′.2 19′.5. Photometry was obtained through Sloan and Pan-STARRS filters. All five 0.4-m telescopes at the austral sites of LCOGT (Sutherland/SAAO, CTIO, and Siding Spring) were used. The first set of observations between UT 17 October and 23 November 2019 comprised 75 sets of 3 exposures through each of the filters. Individual exposure times were 300, 300, 270, and 300 sec, respectively. The second set, obtained between December 3, 2021 and January 21, 2022, consisted of 142 sets of images, each with 600 sec integrations.
LCOGT images are processed by the BANZAI pipeline (McCully et al., 2018), which performs bias removal, flat-fielding, and source identification and aperture photometry using the SExtractor routines (Bertin & Arnouts, 1996). Along with photometry in several apertures of fixed diameters, fluxes are also measured within an “optimal" elliptical Kron aperture (Kron, 1980). Although Kron photometry was originally developed for galaxy photometry, stars in LCOGT images are often non-circular due to imperfect tracking, focus, or astigmatism, and we adopted that approach for our analysis.
Relative, time-series photometry was calculated using the procedures more fully described in Narayanan et al., in prep.; we highlight the major features of the algorithm here. For the sources in each band-pass, including 2M0632, photometry was calculated by matrix solution of a set of linear equations describing the relation between instrumental magnitudes of the th observation of the th star with instrument (a unique site/enclosure/telescope/camera index), apparent magnitudes , observation zero-points , a second-order extinction coefficient , and an instrument-specific color-term ,
| (1) |
Note that since this is relative, not absolute, photometry, terms that are invariant with observation for any given star, such as a color term, are ignored. We adopted the Gaia color for . When solving for the coefficients of Eqn. 1, we only use those sources with peak pixel value (to avoid saturation), and belong to stars with Gaia fractional variability 0.3%, where:
| (2) |
Here (photo_g_mean_flux) and (phot_g_mean_flux_error) are the Gaia source brightness (counts sec-1) and its standard error, and is the number of individual photometric observations (photo_g_n_obs). Gaia makes multiple photometric measurements during the brief passage or transit of a star across the detector field of view; the star will not vary significantly during a transit, thus the effective number of epochs at which Gaia measures variability is reduced by the mean number of observations per transit, which is 8.86 (Jordi et al., 2010). The variance of each individual star is calculated after solution of Eqn. 1, and a small but arbitrary (here 3%) fraction of the most variable stars are removed from the sample before re-calculating the photometry. The median error in the zero-points is used as a metric for the quality of the solution. As more of the most discrepant stars are removed, the error in zero-points decreases, but beyond some optimal point when the median zero-point error is minimized, the decrease in sample size results in increasing error. We adopted the solution at the minimum for calculating light curves for 2M0632.
In a subset of the images obtained with one particular detector, the image of 2M0632 fell on a “hot" pixel which produced errors in the photometry. These data were excluded based on proximity of the PSF centroid to this pixel. Many -band images – usually the first in a series of exposures – suffered from residual telescope shake and poor tracking after a telescope slewed to a target. This smeared stellar images and made detection and accurate photometry of 2M0632, already faint in this band-pass, problematic. To mitigate this, we excluded data from images for which the seeing (L1FWHM, which is the median PSF FWHM for all sources in the image) is 3″. (Here, “seeing” includes the effects of focus and tracking problems.)
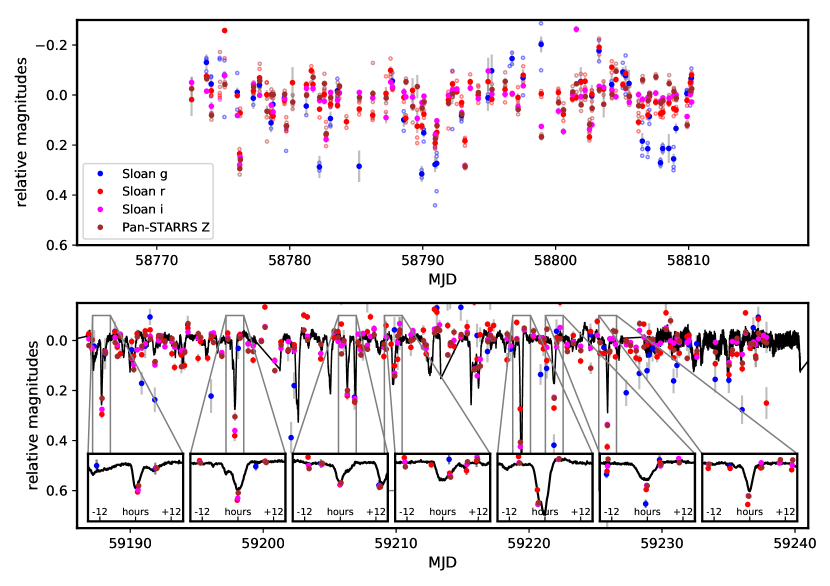
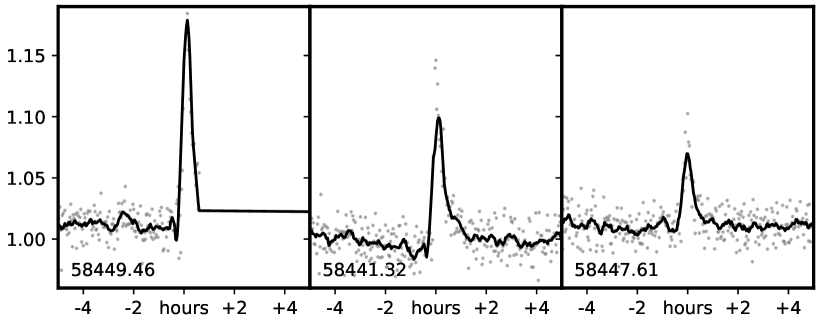
Figure 2 plots the LCO photometry along with the TESS light curve. To remove as far as possible uninteresting offsets between the datasets, the median value after exclusion of the faintest 16% of points (those likely to be obtained when the star in the dimm state) was subtracted. The threshold of 16% was based on an analysis of the TESS light curve (Sec. 3.1). The two LCO campaigns are plotted in separate panels in Fig. 2; the second contains the concurrent TESS observations with insets showing the details of some dips observed with both TESS and LCO.
2.3 Spectroscopy
On the night of 2019 December 2 (UT), we observed 2M0632 with the Goodman High-Throughput Spectrograph (Clemens et al., 2004) on the Southern Astrophysical Research (SOAR) 4.1 m telescope atop Cerro Pachón, Chile. We took all exposures using the red camera, the 1200 lines mm-1 grating, the M5 setup, and the 0″.46 slit rotated to the parallactic angle. This setup provides a nominal resolution of 5000 spanning 6350–7500Å, although we found the effective resolution to be closer to 3000 due to drift of the wavelength solution (see below). We took five exposures, each with 600 second integration times. We took a standard set of calibration data during the daytime (flats and biases) as well as a set of Ne arcs immediately before observing the target.
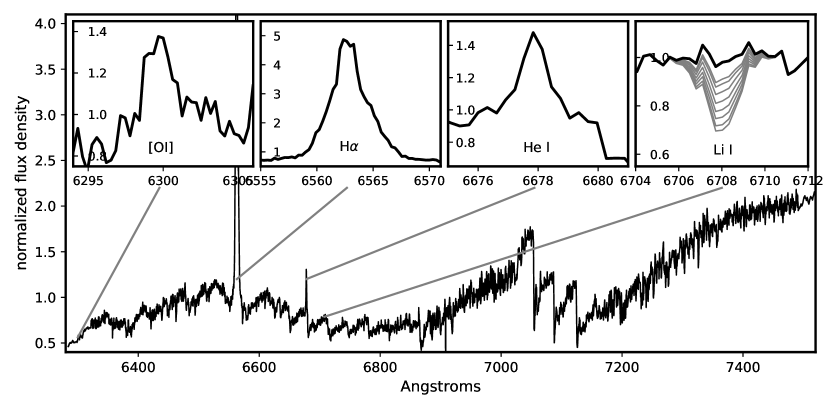
Using custom scripts, we performed bias subtraction, flat fielding, optimal extraction of the target spectrum, and mapping pixels to wavelengths using a fifth-order polynomial derived from the Ne lamp spectra. We then stacked the five extracted spectra using the robust weighted mean. The stacked spectrum had a signal-to-noise ratio (SNR) 100 over most of the wavelength range. We measured the radial velocity of 2M0632 by cross-correlating the Goodman spectrum against a series of radial-velocity template spectra from Nidever et al. (2002). Due to an issue with the flexure compensation system on SOAR, the wavelength solution can shift during exposures. This caused some loss in spectral resolution and could impact the inferred radial velocities by as much as 30 km s-1 (based on tests with radial velocity standards). To correct for this, we derived a linear fit to wavelengths of the OH sky emission lines and O2 absorption lines in each extracted spectra (prior to background subtraction). The shifts are larger near the edges of the spectrum, but there are too few skylines for a higher-order fix, so we masked out 100Å on each side. The final velocity from our analysis was 21.5 2.3 km s-1. The error is based on the cross-correlation and the uncertainty in the skyline fit; however, tests on RV standards suggest the uncertainty could be as high as 3 km s-1. The [OI] line at 6300Å is at the edge of the first two spectra but falls partially or completely off the edge in the others. For that region, we used only the first spectrum. The extracted, normalized spectrum is plotted in Fig. 3.
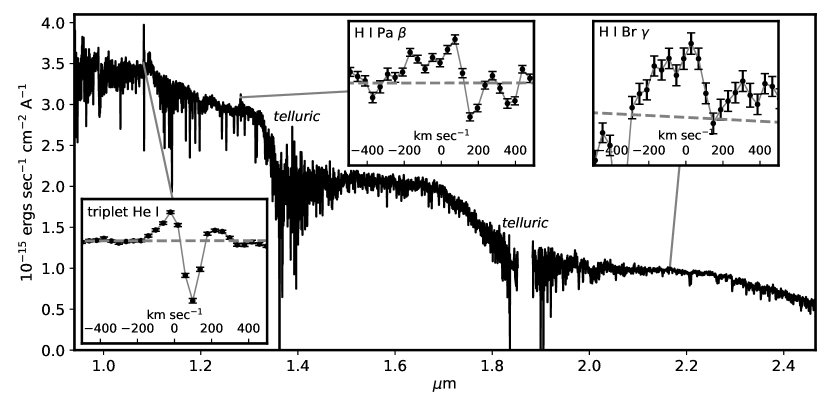
We obtained infrared spectra of 2M0632 with the TripleSpec-4.1 instrument during its Science Verification stage on the SOAR 4.1-m telescope in April 2019. TripleSpec-4.1 is a cross-dispersed spectrograph featuring a fixed slit of 1″.1 by 28″, resulting in spectra of resolution of 3500 and covering a simultaneous wavelength range of 0.8 to 2.47 µm (Schlawin et al., 2014). Using an A-B nod pattern, we obtained four consecutive spectra of 2M0632, shifting the star along the slit to perform sky subtraction. We did the same for the A0V star HD 61834, used to correct the 2M0632spectra of telluric absorption. We reduced the data using the version of SpexTool for the TripleSpec 4.1 at SOAR111https://noirlab.edu/science/observing-noirlab/observing-ctio/observing-soar/data-reduction/triplespec-data (Cushing et al., 2004). We constructed a telluric spectrum from the spectrum of HD 61834 and used this to correct the spectrum of 2M0632 with the routine xtellcor (Vacca et al., 2003). This corrected spectrum is plotted in Fig. 4; insets show details of emission in the lines of triplet He I at 1.083 µm and H I Pachen- and Brackett .
2.4 Adaptive optics imaging
Adaptive optics (AO) imaging was obtained with the Nasmyth Adaptive Optics Camera Near-Infrared Imager and Spectrograph (NACO; Lenzen et al., 2003; Rousset et al., 2003) at the UT1 8-m telescope at Paranal on UT 19 January 2019, as part of a survey (program 1101.C-0092(D), PI: R. Launhardt), and we retrieved these data from the ESO Science Archive. NACO delivered a 14″ 14″ field of view with 13.22 mas pixels. The single usable image is a 10-sec exposure through the filter at an airmass of 1.4. A single saturated source appears in the image; the WCS solution locates it 1″.65 east and 7″.67 north of the Gaia location, but since a 2MASS image shows no comparably bright sources within 1’, we conclude this offset is the boresight error. There are no detected sources within the image, within 0″.53 for any position angle or within 0".75 for 75% of possible position angles.
3 Analysis
3.1 Validation and Characterization of transient dimming
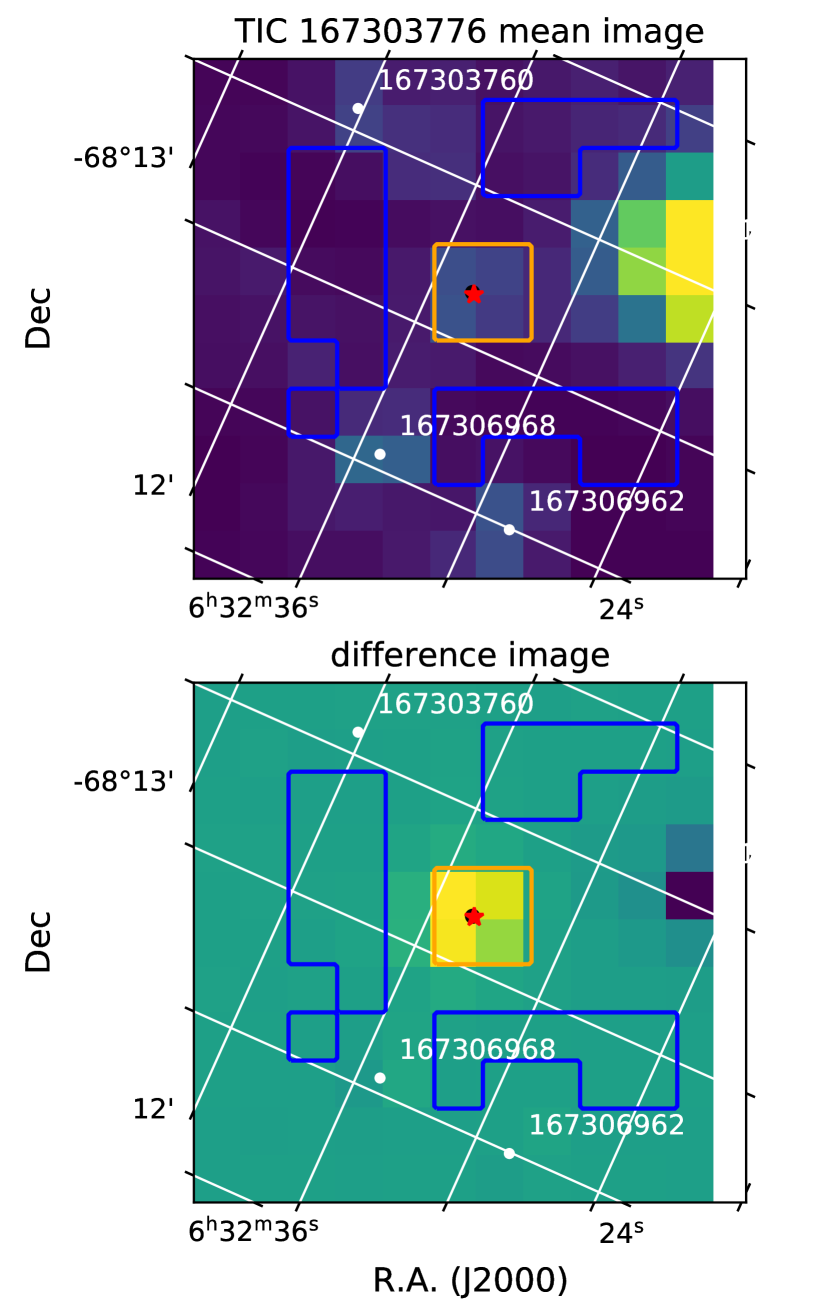
There are no other TIC sources within the 42″ 42″ photometric aperture (top panel of Fig. 5). The brightest Gaia EDR3 source within 30″ (1.5 TESS pixels) is 2 magnitudes fainter in Gaia -band (a band-pass which is bluer but overlapping with the TESS photometer band), and the separation is 24″, thus it cannot be responsible for dimming which is 16%. The Gaia Reduced Unit Weight Error (RUWE) is 1.158, consistent with a single star, and available AO data show no other sources within a few arcsec. We constructed a difference image by segregating the TESS images into “in" and “out" of occultation events, where the latter is defined by a drop in flux 4.15% relative to a filtered median (see below). This is shown in the lower panel of Fig. 5. The separation in the centroid between the mean and difference images is only 0″.57, thus conclusively demonstrating that 2M0632 must be the source of the dimming signal.
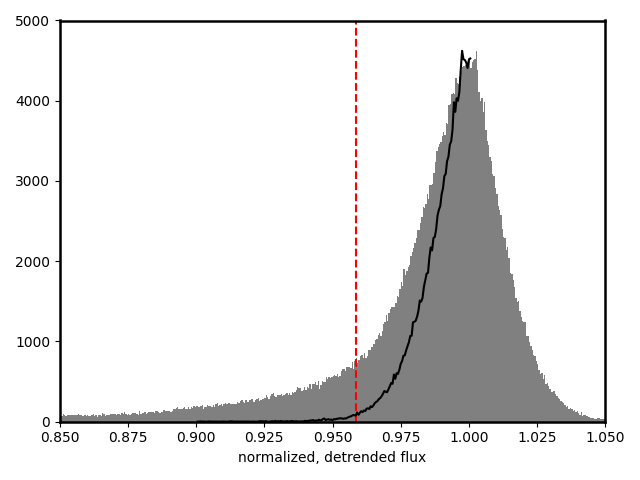
A histogram of the composite light curve is shown in Fig. 6. The distribution is clearly asymmetric and we identify a normalized level (95.85%, vertical red dashed line) below which the distribution is 10 times that expected if it were symmetric. About 16% of the time the stellar brightness is below this level. We calculated the overall quasi-periodicity parameter and asymmetry parameter as defined by Cody et al. (2014). For the calculation of , the overall RMS was taken to be the outlier-resistant mean absolute deviation (MAD) of the original light curve, and for the calculation of the systematic noise was taken to be the MAD of the detrended light curve after removal of the periodic signal (see below) and exclusion of dimming events. We found and , characteristic of a highly stochastic dipper (Cody et al., 2014).
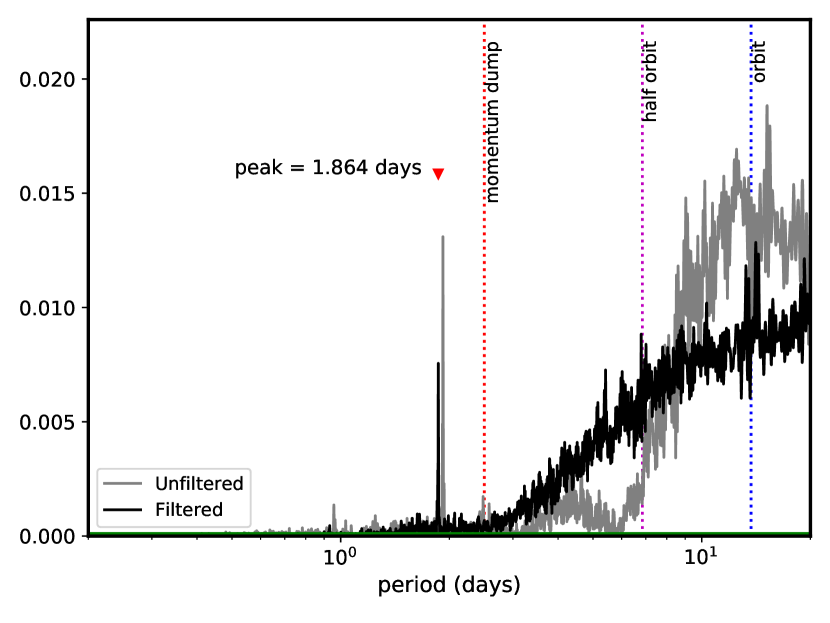
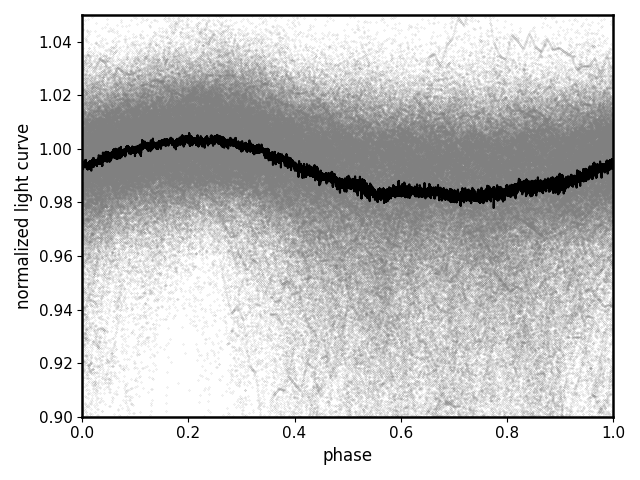
We identified a pronounced day periodic signal in the composite light curve using a Lomb-Scargle periodogram analysis (Scargle, 1982, Fig. 7) and determining the standard error by fitting a Gaussian to the envelope of the peak and its neighbors. This signal is somewhat reduced but still pronounced when the analysis is repeated after excising the 16% of the light curve in the dim state. It is distinct from artifacts produced by removal of momentum from the spacecraft control wheels and motion of the spacecraft over an orbit (dashed lines). This signal is much weaker (2% peak-to-peak) than the dimming, but is apparent when the light curve is phased to the period (Fig. 8).
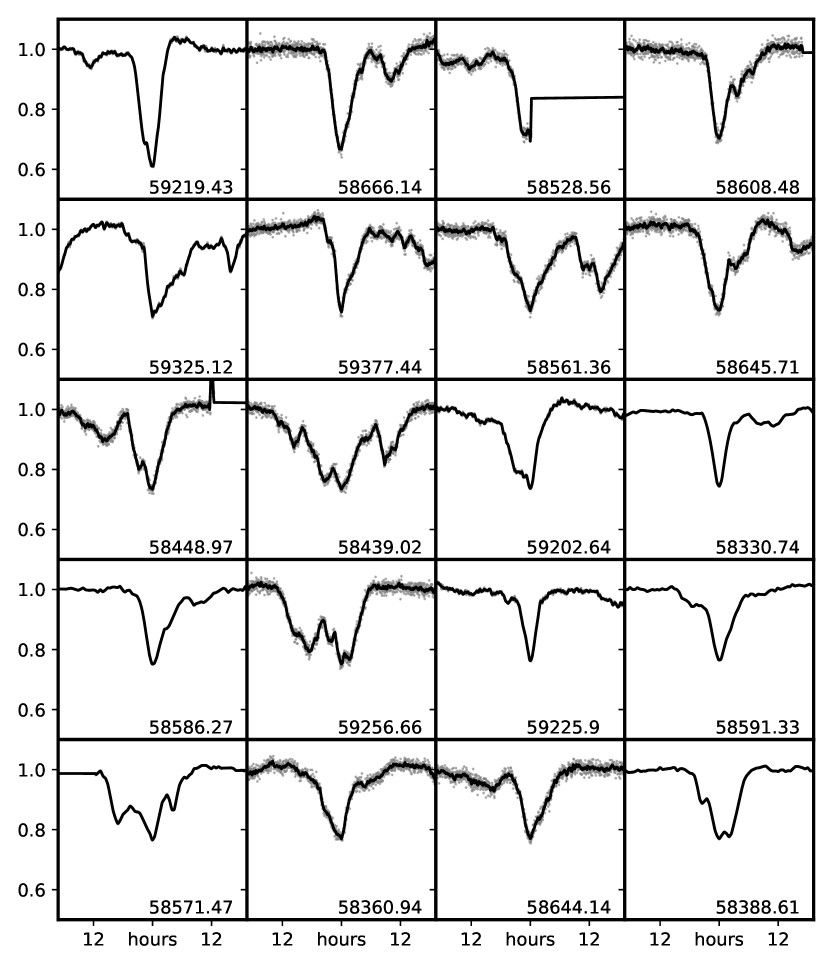
We identified dimming events in a version of the light curve smoothed by a second-order Savitzky-Golay filter with a window of 20 min. 345 candidate dimming events were identified as local minima in a 12-hour windowing of the light curve. A characteristic “FWHM" duration for each event was calculated as the interval of time between the most recent decline below 50% of the minimum before the minimum, and the earliest rise above 50% of the minimum after the minimum. We used a linearly-interpolated version of the light curve for greater time resolution. Events with not exceeding twice the cadence (2 min) were discarded, leaving 329 events. These are marked as magenta triangles in Fig. 1).
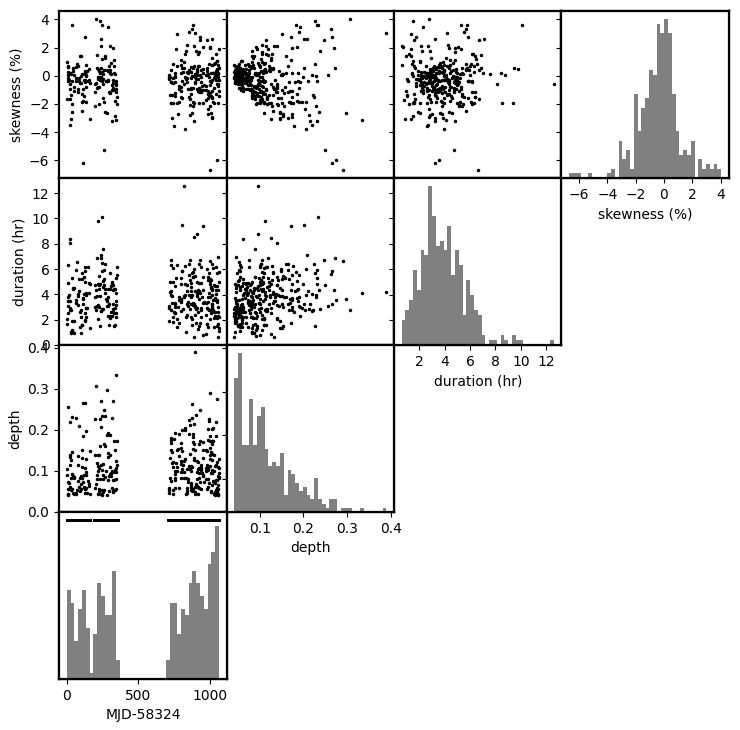
Depth vs. as well as the time-series for each is plotted in Fig. 10. Most events have 4 hr and nearly all have a 6 hr. The longest events appear to consist of clusters of 2-3 dips, while the shortest events could be artifacts of the identification process. Figure 9 plots 1.6-day subsets of the TESS light curve centered on the twenty deepest dips. We computed the skewness in time of each event using Fischer’s coefficient of skewness:
| (3) |
where and the integrals are over the event’s duration. The distribution is plotted in Fig. 10; is typically small (%), but there is a significant excess in negative values (195 compared to 134) such that there are more dips with leading tails. (We also calculated skewness over the 30% of dip depth range and obtained similar results.)
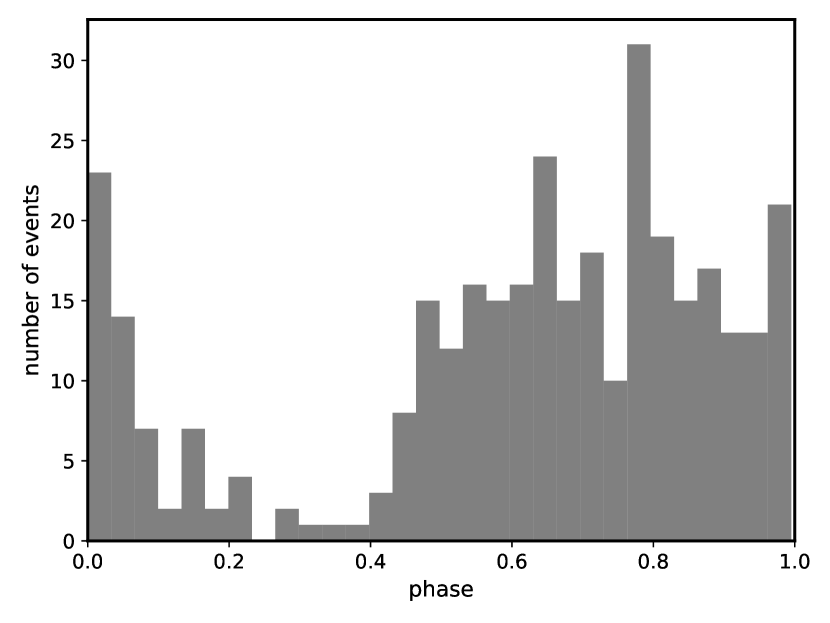
The distribution of dimming events with the phase of the periodic 1.863-day signal identified in our periodogram analysis is non-uniform (Fig. 11). A Kolmorogov-Smirnov test compared to a uniform distribution returns and . This is also apparent in the phased light curve (Fig. 8), thus it is not simply a bias to the additive effect of stellar rotational variability and dimming. Dips are more likely to occur in the dimmer phase of the star’s rotational light curve, perhaps when a more spotted region of the star faces us.
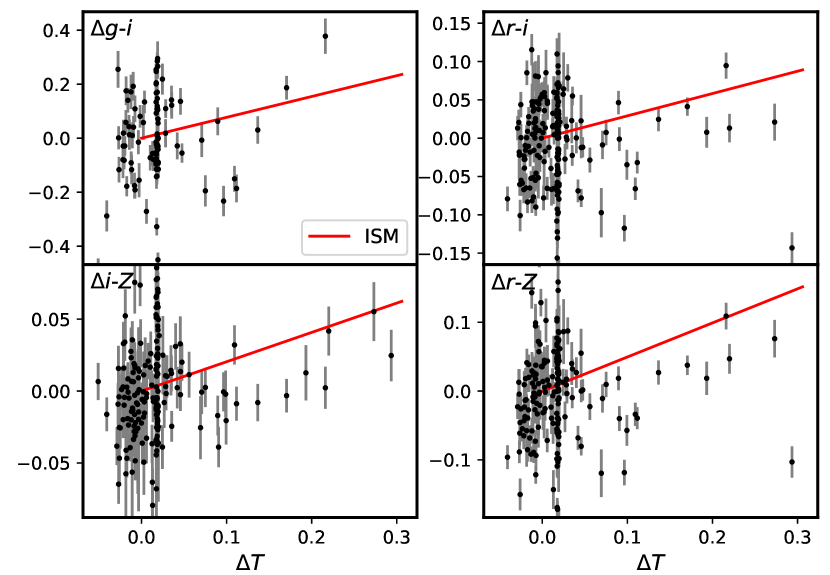
The multi-bandpass photometry of LCO (, spanning 3800-9350Å) can measure reddening during dimming and constrain the grain-size distribution and composition of the occulting dust (Budaj et al., 2015). We used the TESS data to identify 38 dimming events during the 50-day interval that LCO and TESS were both observing 2M0632 (Fig. 2). Reddening-extinction diagrams were constructed by comparing variation in LCOGT-based colors to changes in TESS magnitudes. We corrected for the variability of the star over the finite time each set of multi-bandpass observations took place (up to an hour) by subtracting the known variation in the TESS magnitude over this interval multiplied by the ratio of extinction coefficients where the indices 1 and 2 refer to the two LCOGT band-passes used to construct the color, and refers to TESS. We assumed ISM values for extinction coefficients (see below) but because the variation in is small and departures from this assumption would have a minor effect. The reddening-extinction diagrams (Fig. 12) for the pass-bands show clear trends that are consistent or even slightly steeper than expected for ISM-like dust (red lines). Significant scatter in -band photometry is expected from variable stellar H emission (Fig. 3) and in -band photometry due to detector fringing. Elevated extinction in the band is strongly suggested in LCOGT data obtained non-contemporaneously with TESS (top panel of Fig. 2) and there is a possible trend in vs. in Fig. 12, but the poor quality of the -band photometry due to low SNR and poor tracking preclude any definitive conclusion.
3.2 Stellar properties
| Catalog | ID | |
|---|---|---|
| Gaia EDR3a | 5280226578890455168 | |
| TICb | 167303776 | |
| 2MASS PSCc | J06320799-6810419 | |
| AllWISEd | J063207.99-681041.6 | |
| UCAC4e | 110-012461 | |
| Property | Value (error) | Source |
| Right Ascension | 06h 32m 07s.97 | Gaia EDR3a |
| Declination | -68d 10′ 41″.99 | |
| [mas yr-1] | 9.350 (0.033) | |
| [mas yr-1] | 33.936 (0.034) | |
| distance [pc] | 93.0 (0.2) | |
| RUWE | 1.158 | |
| RV [km s-1] | +22.5 (2.3) | this work |
| 21.49 (0.35) | Galex GR6+7f | |
| 20.66 (0.21) | ||
| 17.297 (0.012) | Gaia EDR3a | |
| 14.240 (0.005) | ||
| 15.518 (0.003) | ||
| 14.07 (0.03) | DENIS DR3g | |
| 12.41 (0.06) | ||
| 11.43 (0.08) | ||
| 12.395 (0.026) | 2MASS PSCc | |
| 12.798 (0.027) | ||
| 11.50 (0.023) | ||
| W1 [3.4] | 11.258 (0.022) | AllWISEd |
| W2 [4.6] | 10.96 (0.02) | |
| W3 [12] | 9.195 (0.022) | |
| W4 [25] | 7.519 (0.065) | |
| Inferred properties | ||
| [K] | 3100 (75) | SED fit |
| SpT | M4.5 (0.5) | photometry, |
| [L⊙] | SED + parallax | |
| [] | 0.40 (0.02) | and teff |
| log g | 4.0 (0.5) | SED fit |
| [] | 0.13-0.23 | isochrone fit |
| age [Myr] | 30-60 | isochrone fit + Li |
| rotation period [days] | 1.863 (0.003) | TESS photometry |
Our AO imaging rules out near equal-brightness companions between 0″.05 and 0″.7 (Sec. 2.4). Gaia can resolve more widely-separated binaries and a search of EDR3 within 3 deg. of 2M0632 identified one star (5280267398259251712) 34′.6 away at about the same distance (89.8 1.4 pc) as 2M0632 (93.0 ) and with a similar but statistically different proper motion (, mas yr-1). With and the star falls close to the best-fit isochrones for the Carina moving group (see Sec. 3.4) and is likely a fellow member, but the projected separation is nearly au and the two stars cannot be bound. The Reduced Unit Weight Error of 2M0632, a measure of the goodness-of-fit of a single-star solution to the astrometric data, is 1.158, consistent with a single star (Belokurov et al., 2020). We therefore assumed that 2M0632 is a single star in our subsequent analysis.
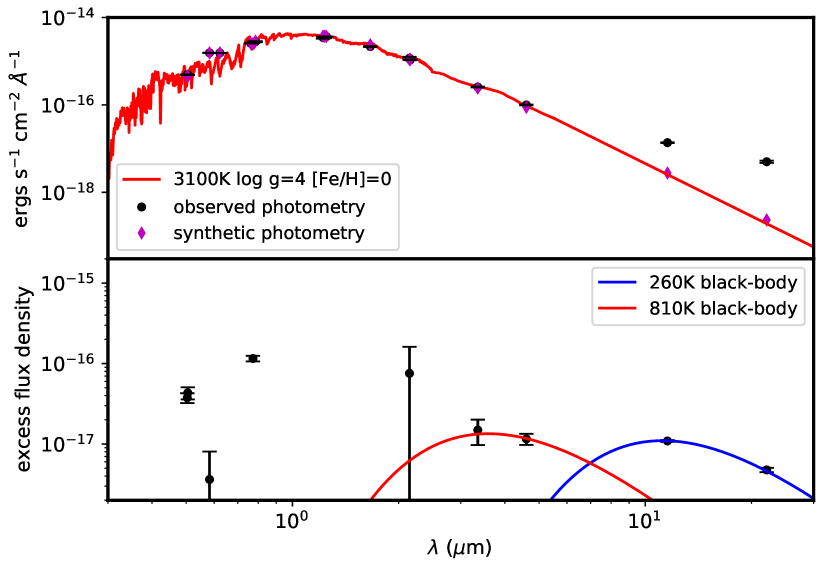
Photometry of 2M0632 was obtained from Gaia (,,, Riello et al., 2021), the Deep Near Infrared Survey of the Southern Sky (DENIS and , Schuller et al., 2003; Denis, 2005), VISTA and (Cross et al., 2012), 2MASS (Skrutskie et al., 2006), and WISE 3.4, 4,4, 12, and 25 m (Wright et al., 2010; Cutri et al., 2013). Based on the 3-d dust map of Leike et al. (2020) (see Sec. 3.4 for details), we estimated interstellar extinction of . The extinction-corrected spectral energy distribution (SED, Fig. 14) was fit to stellar models using the SED analysis tools of the Virtual Observatory (Bayo et al., 2008). The VISTA photometry was ultimately excluded from the fit as redundant, with anomalously small errors, and the AllWISE data were excluded due to excess emission (see Sec. 3.3). We assumed a near-solar metallicity for 2M0632 due to its young age. The best-fit (28.4 with degrees of freedom) solar-metallicity BT-SETTL model with Caffau et al. (2011) relative abundances has =3100K and =4. (Stellar surface gravity is very poorly constrained by photometry and should be regarded as merely a fitting parameter.) As a check, we compared our spectrum (Fig. 4), particularly the CO lines in -band, to PHOENIX model spectra using the STARFISH emulator (Czekala et al., 2015) and found good agreement with =3100K, =4, and [Fe/H]=0. A PHOENIX model spectrum with these parameters from Husser et al. (2013) is plotted in Fig. 14. Pecaut & Mamajek (2013) assign a spectral type of about M4.5-5 to a of 3100K.
Stellar luminosity was calculated by combining the integrated best-fit SED and the Gaia parallax. The radius was determined using the luminosity, temperature, parallax, and the Stefan-Boltzmann equation. Masses were found by applying Eqn. 5 to the best-fit isochrone in each set of models compared to the stellar parameters of Carina moving group stars (see Sec. 3.4). The different model sets yielded different masses (inversely related to age) and these ranged between 0.13 and 0.23M⊙. For calculations involving the stellar mass, we adopted 0.18M⊙. Note that this implies a slightly higher gravity of g of 4.5, but still consistent with that expected of a pre-main sequence M dwarf.
The rapid rotation ( days, Sec. 3.1) of 2M0632 is an indicator of a young age for this single star. Elevated emission in the Balmer line of H I and the ultraviolet are also indicators, but in this case the signals seem dominated by accretion (Sec. 3.3). 2M0632 is flaring, but only modestly so; we detected just three large flares (amplitudes greater than 5% quiescent level) in the entire light curve, all within an interval of about 8 days time (Fig. 13). This could be the result of the appearance of an especially active region on the star.
3.3 Circumstellar Disk
Our optical and infrared spectra of 2M0632 contain multiple signatures of an accreting disk, including lines of H I, [OI], and triplet He I (Figs. 3 and 4). The equivalent width (EW) of the H line was calculated using the line and pseudo-continuum regions defined in Lépine et al. (2013) and determined to be 22.1Å. The 10% kinematic width was calculated as 336 km s. Both of these measures are well in excess of established criteria for distinguishing accreting vs. non-accreting (and merely magnetically active) stars (White & Basri, 2003; Mohanty et al., 2005), and can be used to estimate accretion rate. The -H EW relation of Herczeg & Hillenbrand (2008) yields an accretion rate of M⊙-1, while the relation of Natta et al. (2004) gives a significantly higher accretion rate of M⊙-1, with an uncertainty of a factor of 2.
The EW of the optical triplet He I line was estimated over the range 6676.8-6680.8Å to be 0.71Å. Unfortunately, our optical spectrum is not flux-calibrated nor does it completely span the wavelength range of any filter with available photometry for 2M0632. Instead, we use the model spectrum from Husser et al. (2013) to compute the continuum flux density at 6678Å relative to the integrated flux over the Gaia pass-band. We arrive at a line flux of ergs sec-1 cm-2 which at the distance of the star is a luminosity of ergs sec-1 or L⊙. Using the scaling relations between indicator line luminosity and accretion luminosity of Herczeg & Hillenbrand (2008) we estimated the latter to be L⊙. Using Eqn. 8 in Gullbring et al. (1998) with the disk inner edge at 5, we estimate an accretion rate of M⊙ yr-1, in good agreement with the H EW-based estimate, but not the H 10% width-based estimate. We note the latter is affected by stellar inclination (Curran et al., 2011), and that the Natta et al. (2004) relation was developed for objects 0.01-0.1M⊙, i.e. somewhat less massive than 2M0632. We have not corrected for continuum veiling, but this is expected to be negligible at these low accretion rates.
The profile of the He I triplet line at 1.085 µm contains blue-shifted (-20 km s) emission and red-shifted (+100 km s) absorption that is characteristic of many T Tauri stars (Fig. 4, Kwan et al., 2007). Modestly blue-shifted emission arises from a hot wind moving nearly perpendicular to the line of sight, plus red-shifted sub-continuum absorption is the hallmark of “funneled" accretion flows. Although there is no indicator of blue-shifted absorption due to an intervening wind, the limited spectral resolution cannot preclude some weak absorption.
2M0632 is also excessively luminous in the far-ultraviolet (FUV, 1340-1806Å) and near-ultraviolet (NUV, 1693-3007Å) channels of GALEX (Bianchi et al., 2017) relative to expectations for its photosphere. But its UV luminosity is low (Table 1), compared to YSOs in the Taurus-Aurigae star-forming region (Gómez de Castro et al., 2015) and at the detection limits of GALEX. 2M0632 has a FUV-NUV color of 0.8, similar to that of classical T Tauri stars, disfavoring interstellar or circumstellar extinction as the primary cause of its UV faintness (Gómez de Castro et al., 2015). Instead, its low accretion rate may be responsible (Sec. 3.3).
The disk of 2M0632 also manifests itself as excess emission at the longest wavelengths. There is a pronounced excess in the 12- and 25-µm channels of WISE, and smaller but still formally significant excesses in the 3.4 and 4.6-µm channels (Fig. 14). Minimum fitting shows that no single black-body can explain this emission, suggesting that instead there is a disk or at least multiple belts of circumstellar material.
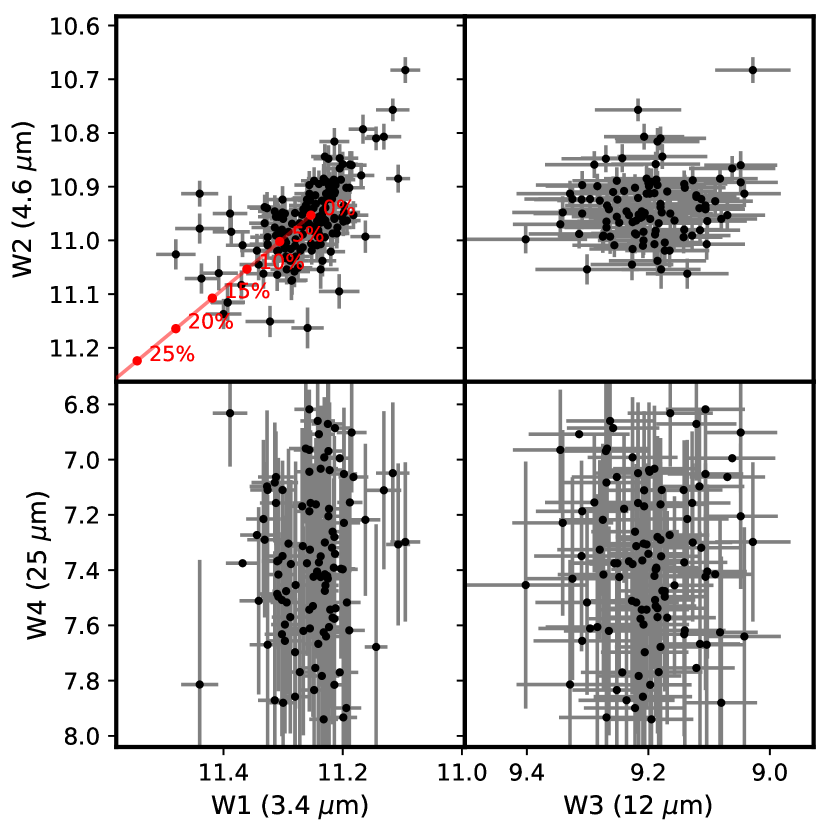
AllWISE multi-epoch photometry of 2M0632 show significant variability in the WISE W1 and W2 channels ( of 862 and 1180, respectively, for =160 degrees of freedom; Fig. 15). The W1 and W2 emission is significantly correlated (Spearman non-parametric rank test ). In contrast, there is no detected variability in the longer-wavelength (W3 and W4 channels ( of 113 and 58 for 106 degrees of freedom, respectively, for a fit to a constant value). Some of the variability in W1 and W2 could be due to variable extinction along the line of sight occulting the star (but not the cooler disk) but only if the extinction is largely achromatic, i.e., the occulting material has a large grain size (Fig. 15). This would be in conflict with the LCO results (Fig. 12). Also, it appears that the outer regions of the disk that dominate long-wave emission are not variably shadowed by inner disk material (“see-saw" variability, Muzerolle et al., 2009).
3.4 Moving Group Membership and Age
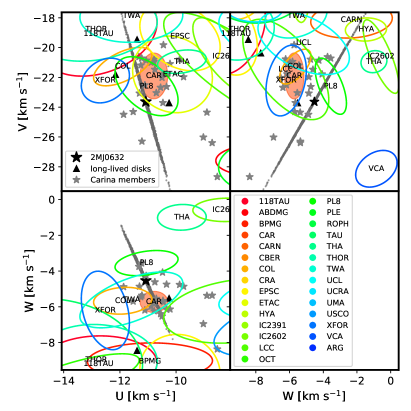
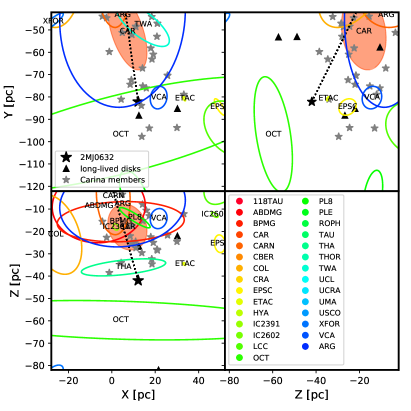
Based on Gaia EDR3 astrometry and our measured RV, we calculated Galactic space motions relative to solar of km sec-1. Applying the Bayesian Banyan algorithm (Gagné et al., 2018) to the 6-dimensional space and motion coordinates, we found a 92.3% probability of membership in the Carina moving group and negligible probability for every other cluster and moving group in the database; the remainder probability is assigned to the field. The posterior distribution of 2M0632 passes through the cluster of Carina members cataloged by Booth et al. (2021) and intercepts the center of the moving group (Fig. 16). 2M0632 lies in the neighborhood of the Octans group (Fig. 16) but is kinematically distinct. It also passes close to the Columba moving group and the Platais 8 open cluster, but the star is distant from these two in spatial coordinates (Fig. 16). However, Torres et al. (2008) previously related Carina with Columba and the Tucana-Horologium groups, all of which appear co-eval (Bell et al., 2015). Gagné et al. (2021) proposed that Carina, Columba, and the Theia 92, 113, and 208 moving groups are all derived from the Platais 8 open cluster (Platais et al., 1998), possibly by partial disruption of the cluster into “tails", and are all thus co-eval.
Based on a comparison with PARSEC, Dartmouth, Pisa and Baraffe et al. (2015) isochrones, Bell et al. (2015) estimated the age of the Carina moving group as about 45 Myr. In contrast, Schneider et al. (2019) used Li abundances to estimate an age similar to that of the Beta Pictoris moving group (20-25 Myr). More recently, Booth et al. (2021) made an isochrone-based estimate of 15 Myr. We revisited the question of age with the larger sample of Booth et al. (2021), incorporating improved astrometry and photometry from Gaia EDR3 (Gaia Collaboration et al., 2021). Gaia EDR3 also allowed us to reject additional binaries based on a high value of the Renormalized Unit Weight Error (RUWE); we excluded stars with RUWE as very likely binaries, stars bluer than which are not informative for age estimation, and both 2M0632 and WISE J0808 because variable extinction might affect the -band (Silverberg et al., 2020).
Carina members lie beyond the dust-free Local Bubble and we corrected Gaia astrometry for extinction using the 3-d dust maps of Leike et al. (2020) as implemented with the DUSTMAPS routine (Green, 2018). The Leike et al. (2020) dust maps estimate extinction density in the Gaia pass-band which we converted to and then to and using Gaia EDR3 extinction laws222https://www.cosmos.esa.int/web/gaia/edr3-extinction-law.
We compare this photometry with the low-mass stellar evolution models of Baraffe et al. (2015), the SPOTS models of Somers et al. (2020), and standard and magnetic versions of the Dartmouth models (Feiden & Chaboyer, 2014; Feiden, 2016). It is now widely appreciated that magnetic fields of low-mass pre-main sequence stars can inflate the stars, making them appear younger than they actually are (Feiden, 2016). The SPOTS models attempt to account for both the magnetic and two-temperature effects of starspots with different values of spot fractional coverage. The Dartmouth models especially computed for this study assume the solar composition described by Grevesse et al. (2007). Physics included in these models are described in Feiden & Chaboyer (2014) and references therein, and are consistent with Dartmouth models used in previous studies of young stars (e.g., Malo et al., 2014; Stassun et al., 2014; Feiden, 2016). Magnetic model physics are described in Feiden & Chaboyer (2012) with subsequent modifications outlined by Feiden (2016). In addition, the Dartmouth magnetic models evolve with a surface magnetic field strength in equipartition with the photospheric gas pressure during each model time step. Photometric magnitudes were calculated using synthetic spectra from MARCS model atmospheres (Gustafsson et al., 2008) with Gaia DR2 zero-points established by Casagrande & VandenBerg (2018). The same synthetic transformations were used for standard and magnetic models.
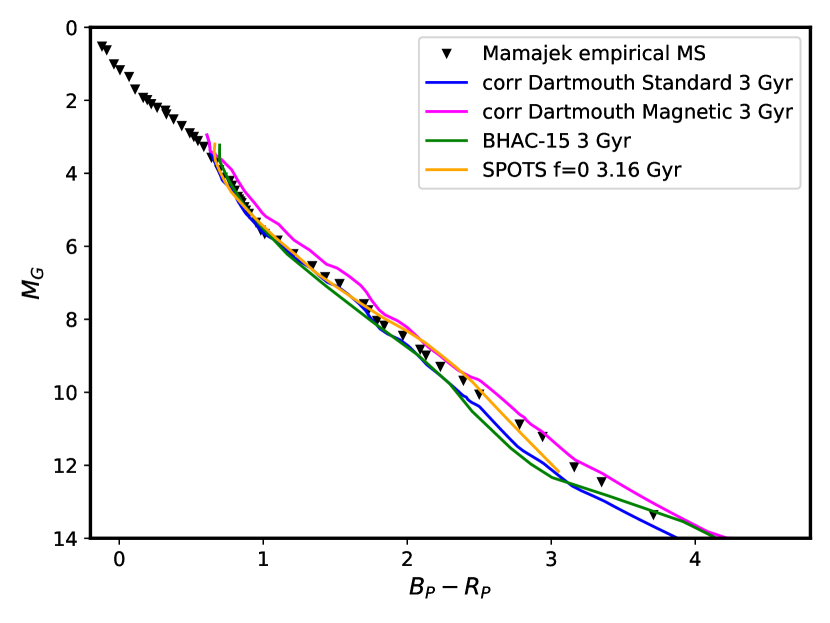
The high-precision photometry of Gaia has revealed discrepancies between model-predicted magnitudes and colors for the coolest stars. To avoid the inaccuracies of synthetic values based on model spectra, Somers et al. (2020) related to colors and bolometric corrections using the empirical values compiled by Pecaut & Mamajek (2013). We follow the same procedure with the BHAC-15 and Dartmouth models. Figure 17 compares 3 Gyr model isochrones adjusted in this way with the empirical values of Pecaut & Mamajek (2013), demonstrating generally good agreement.
Following Naylor & Jeffries (2006) and Naylor (2009) we fit isochrones by minimizing the metric, a 2-d version of the goodness-of-fit parameter that is a summation over stars:
| (4) |
where is the model-predicted distribution of stars in the color-magnitude (-) plane. Since brightness and color are single-valued functions of mass for a given (solar) metallicity, we collapsed the 2-d integral over and into a single integral with stellar mass along the isochrone. For , we adopted an initial mass function of with (Chabrier et al., 2000). Isochrone-based masses for each star are calculated as the expectation value:
| (5) |
Figure 18 plots the best-fit isochrones from the different model sets. A range of ages are found (15-63 Myr) depending on whether magnetic field effects and spots are included. The two best-fitting models are the SPOTS model for and 32 Myr age, and the Dartmouth magnetic model with 55 Myr age.
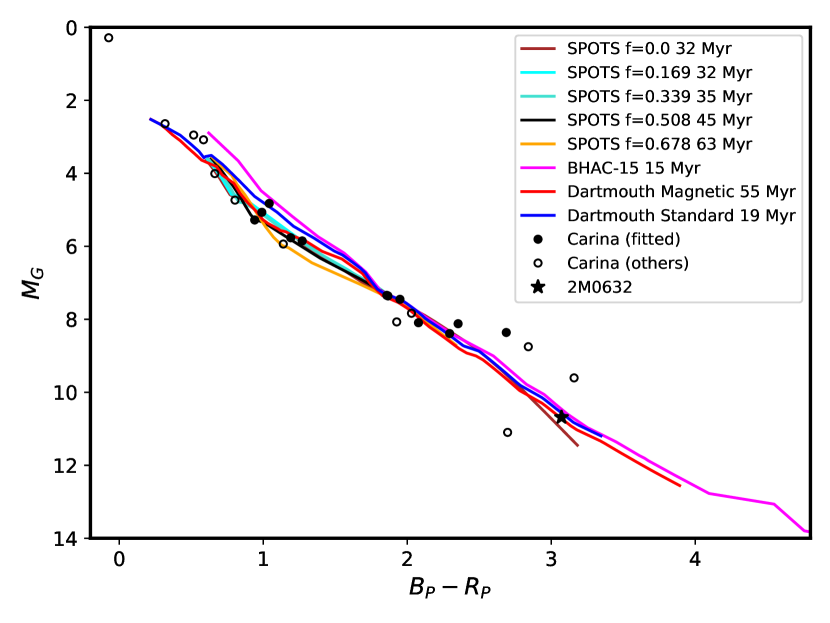
There are three systems which are significantly (1 mag) more luminous than predicted by the best-fit model isochrones. AL 442 (2MASS J06112997-7213388) does not have a published RUWE value but has been resolved into a 0″.16-separation binary by speckle imaging (Janson et al., 2012). 2MASS J09315840-6209258 has RUWE=1.3, only marginally suggestive of binarity; two measurements of RV agree (Malo et al., 2013; Schneider et al., 2019). 2MASS J09180165-5452332 (RUWE = 5.32) was also resolved in speckle imaging (Janson et al., 2012). However, binarity alone cannot explain the mag offset of these stars above the best-fit isochrones (Fig. 18). These could conceivably be higher-order systems. These could also be younger (15 Myr) interlopers but the high probability of membership disfavors this explanation.
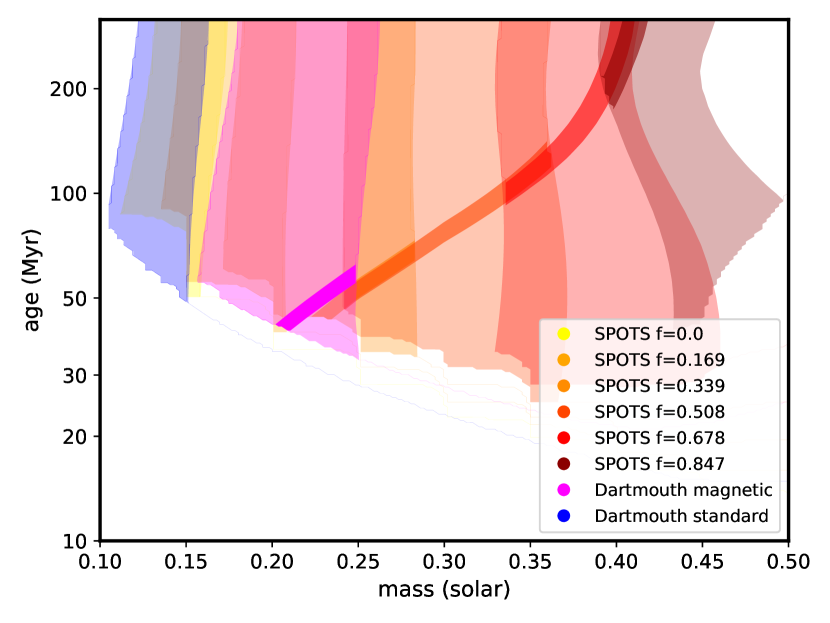
Because Li is rapidly depleted in cool star photospheres, it is a useful constraint on the age of young moving group members. The Li doublet at 6708Å was not detected in our optical spectrum of 2M0632 (Fig. 3) and this sets a minimum model age for the star. A comparison with simulated lines using the curve of growth for =3100K and of Palla et al. (2007) shows that the abundance (relative to H=12) is , or of the interstellar value. We find that SPOTS models with spot fraction coverage of 0 or 0.17 cannot simultaneous satisfy the constraints on (310075K), absolute -band magnitude () and (Fig. 19). Higher spot fractions can satisfy all three constraints, but only for model ages of at least 43 Myr. Likewise, neither the standard Dartmouth models or the models of Baraffe et al. (2015) can simultaneous reproduce the luminosity, and Li depletion, but the magnetic model can, presuming an age of 40-60 Myr (Fig. 19).
4 Summary and Discussion
4.1 What causes the dimming of 2M0632?
An unparalleled record of two years of precision TESS photometry of 2M0632 containing dimming events provides a long-term, statistical insight into the mechanism or mechanisms responsible for occultation of the star. Multiple scenarios have been proposed to explain “dipper" stars, some of which appear to be ruled out by these observations. First, the dimming behavior is persistent and the pattern is largely unchanged on time-scales of years, inconsistent with explanations involving the disruption of and dust production by a small number of disintegrating planetesimals or “exocomets". There is a possible increase in the occurrence of events (Fig. 10), reflected in an increase in the Cody et al. (2014) asymmetry parameter from 2.4 to 11.6 from Year 1 to Year 2, although is heavily biased by the few deepest events.
Second, all dips have hr and the great majority are 2 hr, and if the occulting material is similar in scale to the star, this sets an upper limit on the orbital speed and lower limit on the orbital period of the material. Assuming that the actual duration of the occultation is twice , the mass and radius of the star then imply an orbital period of , where is in days, is the stellar density in solar units, and is in hours. Since (Table 1), the implied orbital period is 1.5 days. This would suggest that the inner edge of the disk coincides with the co-rotation radius (, P=1.86 days, Sec. 3.1). The equilibrium black-body temperature at is 700K. This is consistent with the excess emission detected by WISE at 3-5m (Fig. 14) and thus this excess could be from the inner disk. But we caution that the three relevant points in the SED (at 2.2, 3.4, and 4.6 µm) only poorly constrain the temperature, and inner disk emission is probably not described by a single-temperature black body. If ISM-like reddening obtained from our LCOGT photometry precludes occultation by dust at these longer IR wavelengths as an explanation, the correlated variability at 3.4 and 4.6 m suggests that this region of the disk could have variable emission.
The stochasticity of the dimming signal () and the range of dip durations (Fig. 10) suggests that the occulting structures are not organized and long-lived, but are short-lived and occur over a region of the inner disk, in contrast with the more persistent quasi-periodic behavior of AA Tau (Bouvier et al., 2003), However, the significant clustering of dips with rotational phase and presumably the distribution of spotted regions on the star (Fig. 8) suggsts a connection with the stellar magnetic field analogous to but weaker than AA Tau-like magnetically-funneled accretion (Bouvier et al., 2003). The non-uniform distribution of rotational phase of the dips, with more dips occurring in the minimum of the light curve when the more spotted side of the star is visible (Fig. 8), could be a manifestation of dusty accretion controlled by an asymmetric stellar magnetic field. Asymmetries (skewness) in the light curve could be produced by the rotating magnetic field of the star acting on the gas (and dust) once it decouples from the disk. Structures outside (inside) the co-rotation radius will experience positive (negative) torques that accelerate gas forward (backwards) and produce leading (trailing) tails with positively (negative) skewed light curves. In this scenario, the distribution of skewness values (Fig. 10) would be the result of structures appearing over a range of radii encompassing the co-rotation radius, with a majority interior to that distance.
Following Bodman et al. (2017), we related the accretion rate in the disk to extinction in the TESS band produced by an accretion stream extending from the inner edge of the disk, assuming a vertical cylindrical geometry, and extinction coefficient (magnitudes per unit gas mass surface density) and a disk inner edge at the co-rotation radius :
| (6) |
where is the proton mass, is the velocity along the stream, is the Keplerian period at the inner edge of the disk, which we assume to be at the co-rotation radius (Stauffer et al., 2017), and the free-fall time is defined as . The final factor relates the duration of the dip to the width of the accretion stream. We related to the magnetic field pressure at the disk inner edge by assuming that at this location the vertical flow is driven by magnetic pressure such that , where is the gas density (e.g., Bessolaz et al., 2008). Assuming a pure dipole field that extends from the surface with strength , the field at the disk inner edge is . We used a value cm-2 for the ISM found by combining cm-2 from Güver & Özel (2009), from Stassun et al. (2018) and the standard ISM extinction law of :
| (7) |
Adopting the parameters from Table 1, the /He I EW-based accretion rate, =8 hr, and kG (typical for young, rapidly-rotating M dwarfs, Reiners et al., 2022), yields extinction , remarkably consistent with the distribution of dip depths (Fig. 10). We note, however, that our estimate of is sensitive to the chosen values of the stellar properties , , and .
Finally, the mechanism producing the occultations of 2M0632 are operating in a disk that is significantly older than the those of most known “dipper" stars, e.g. in the 1-5 Myr-old Taurus, 3 Myr-old Ophiucus, 3-5 Myr-old Lupus, and 10 Myr-old Upper Scorpius star-forming regions (Rodriguez et al., 2017; Roggero et al., 2021; Bredall et al., 2020; Ansdell et al., 2016). Noteworthy in this respect is the fact that WISE J080822.18-644357.3, another Carina member that hosts a long-lived disk (Murphy et al., 2018), is also a “dipper" (Silverberg et al., 2020). Either the mechanism is invariant with disk evolution, which seems inconsistent with the relative paucity of decrease in the dipper phenomenon among more evolved disks (Ansdell et al., 2016), or disk evolution was slowed or halted around 2M0632. Indeed, if the dust responsible for the variable dimming and reddening of 2M0632 is indeed ISM-like, a reservoir where this material can escape significant processing for tens of Myr is required.
4.2 The age of 2M0632 and the Carina group
2M0632 is undoubtedly a very young M dwarf star; its position and space motion support membership in the Carina young moving group and should thus be approximately the same age as the group or progenitor cluster. Our comparison with model stellar isochrones and the absence of Li suggest an age of at least 40 Myr and perhaps as much as 60 Myr for the Carina group and 2M0632, supporting earlier estimates (e.g., Bell et al., 2015) but not supporting more recent proposals for an age of 15 Myr (Booth et al., 2021).
Our work highlights three reasons why assigning a definitive age to the group is challenging. First, the group is dispersed and sparse, and relatively few faint (M dwarf) members have been confirmed with RV measurements. These M dwarfs evolve more slowly on the pre-main sequence than solar-mass stars, and are thus most informative about the age of the group. By the age of Carina, solar-mass stars are at or near the zero-age main sequence. Second, models can include the effects of magnetic fields and starspots and the degree of these effects (e.g., the spot coverage fraction) is significant but poorly constrained, and likely varies between stars. Third, the precision of Gaia photometry has revealed significant discrepancies with model predictions of colors and/or luminosities that are incompletely addressed by the empirical “bandaging" performed by Somers et al. (2020) and this work.
4.3 The nature of long-lived disks
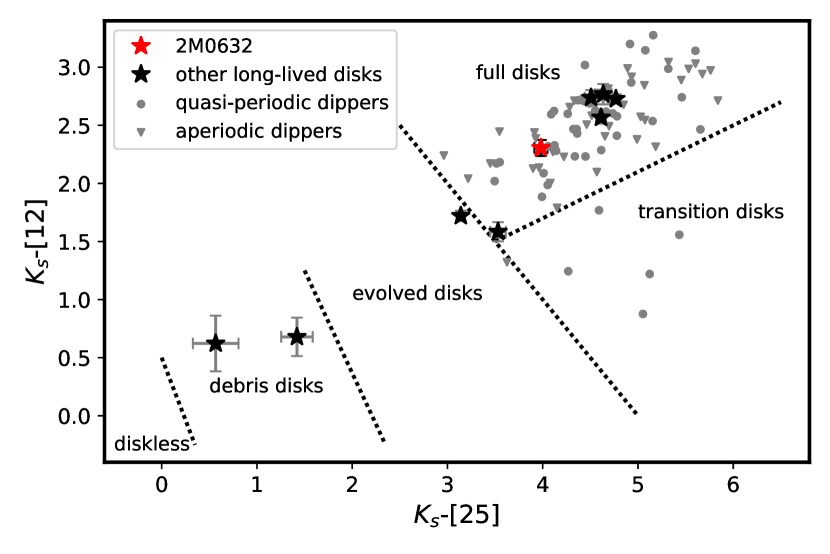
If a 40 Myr age for Carina does hold up, then 2M0632 joins several other systems (including others from Carina) with long-lived disks. We plot 2M0632 and previously recognized examples (Silverberg et al., 2020) in the WISE infrared color-color diagram (Fig. 20). 2MASS J05082729-2101444 and SCR J0103-5515, have excess infrared emission more consistent with debris disks than with primordial T Tauri-like disks and in that sense are not exceptional. 2MASS J05082729-2101444 is a confirmed M dwarf member of the 25 Myr-old Pictoris Moving Group (BPMG) and has H emission only marginally consistent with accretion (Schneider et al., 2019; Lee et al., 2020). SCR J0103-5515 is a member of the 45 Myr-old Tucana-Horologium cluster (Malo et al., 2013) and a potential debris disk candidate (Binks & Jeffries, 2017). Two other systems, 2MASS J04463413-2627559 and 2MASS J09490073-7138034, are borderline full/evolved/transition disks (Silverberg et al., 2020).
The four other long-lived disks that cluster in the “full" disk part of the infrared color-color space (fellow Carina member WISE J080822.18-644357.3, 60 Myr-old Argus member 2MASS J15460752-6258042 (Lee et al., 2020), and BPMG binary LDS 5606A+B (Rodriguez et al., 2014) all appear to be single stars or in the last case a wide (=2200 au) binary. This is consistent with considerable data that T Tauri-like disks around the individual components of binary systems (S-type disks) tend to be shorter-lived (e.g., Kraus et al., 2012). P-type disks that surround a close (1 AU) binary could be long-lived (Alexander, 2012; Ansdell et al., 2020), as well as disks shepherded between the inner and outer components of a hierarchical systems (Ronco et al., 2021), but these cases do not seem to apply here. Curiously, all four long-lived debris or transitional disks are are in close (1" binaries or candidate binaries based on RUWE (in the case of 2MASS J05082729-2101444), suggesting that the presence of a binary companion does not preclude the persistence of a partially cleared disk or substantial debris disk.
While it is possible these long-lived disks are experiencing arrested development (Silverberg et al., 2020), there is suggestive evidence of evolution away from the gas-rich state characteristic of protoplanetary disks. ALMA observations detect cold dust but no (CO) gas in the disk around WISE 0808 (Flaherty et al., 2018). This could indicate that a more debris-disk-like state, or perhaps reflect the short lifetime of CO against photodissociation over the prolonged lifetime of such disks.
4.4 What does the existence of long-lived disks imply?
Given that the phenomenon of long-lived (10 Myr) disks around very low-mass stars is increasingly secure, we must ask whether these represent the tail of an underlying distribution, a manifestation of a fundamental difference between disks around solar-type stars and poorly-studied M dwarfs, or anomalies And what are the implications for our understanding of disk evolution, planet formation, and the potential differences between M dwarfs and their planets, and solar-type stars?
Simple models of disk evolution offer insight into the parameter space in which disks may persist for 10s of Myr. Coleman & Haworth (2020) found that a combination of elevated disk mass, low radial transport (i.e, low parameter) and exceptionally low photoevaporation rates were all required for disks to persist over the observed ages. They argued that disks can only persist in low-UV environments embedded in cloud regions at the outskirts of star-forming regions. In contrast, Wilhelm & Portegies Zwart (2022) find that internal (central-driven) photoevaporation is crucial and that, because lower-mass stars have lower X-ray/EUV luminosities (which scale with bolometric luminosity, e.g., Wright et al., 2018; France et al., 2018), M⊙ stars can retain their disks for 50 Myr. The crucial parameter responsible for these divergent model outcomes is the efficiency of photoevaporation by the external FUV-field, a process which for M dwarfs could dominate over loss driven by the central star, but which could be diminished for stars formed in the low-FUV environments of clusters that are gas-rich and/or lack OB stars. These conclusions also hinge on the reliability of models of such mass loss (Haworth et al., 2018). While it is tempting to relate the existence of multiple long-lived disks in the Carina moving group to its low membership, Gagné et al. (2021) has proposed that the group is a tidally stripped fragment of the Platais 8 cluster and thus could have experienced a denser stellar environment and higher FUV irradiance in the past.
The consequences of a long-lived disk for planet formation have not been thoroughly explored, but the canonical theory offers some hypotheses. Because the timescale of the assembly of rocky cores by giant impacts scales with Keplerian orbital period, this formation channel should be little affected close (1 au) to the star (Zawadzki et al., 2021) but could be enhanced at greater separation. Provided sufficiently massive cores form, long-lived gaseous disks should permit accretion of more massive H/He envelopes (Ribas et al., 2015). Other affects arise from migration of solids through a gas disks: The slightly non-Keplerian rotation of a pressure-supported gas disk imparts aerodynamic drag on cm- to meter-size bodies, causing them to migrate and concentrate inwards and at any pressure maxima. Torques from a gas disk also cause “Type I" migration of planets, and the uninterrupted migration of multiple planets is predicted to result in compact systems of resonant “chains", with planets on highly circular, co-planar orbits starting at the disk’s inner edge (Izidoro et al., 2017). Thus a long-lived disk might be expected to produce very rich, compact systems of planets. Although the planets may have originally captured H/He from the disk into extended envelopes, their proximity to the young, active star is expected to rapidly evaporate those atmospheres (Owen, 2019). These attributes recall the exceptional system TRAPPIST-1, where 7 Earth-size planets orbit close to an ultra-low-mass M dwarf (Lienhard et al., 2020), and it is conceivable that 2M0632 is a forerunner of similar systems.
Acknowledgements
We thank Sean Points of the NSF NOIRLab for carrying out the TripleSpec-4.1 observations and data reduction. E.G. and S.N. acknowledge support by NASA grants 80NSSC19K0587 (Astrophysics Data Analysis Program) and 80NSSC19K1705 (TESS Guest Observer Cycle 2). A.W.M. was supported through NASA’s Exoplanet Research Program (XRP; 80NSSC21K0393). B.R-A acknowledges funding support from FONDECYT Iniciación grant 11181295 and ANID Basal project FB210003. This paper includes data collected by the TESS mission. Funding for the TESS mission is provided by the NASA’s Science Mission Directorate. This work has made use of data from the European Space Agency (ESA) mission Gaia (https://www.cosmos.esa.int/gaia), processed by the Gaia Data Processing and Analysis Consortium (DPAC, https://www.cosmos.esa.int/web/gaia/dpac/consortium). Funding for the DPAC has been provided by national institutions, in particular the institutions participating in the Gaia Multilateral Agreement.This work makes use of observations from the Las Cumbres Observatory global telescope network. Based in part on observations obtained at the Southern Astrophysical Research (SOAR) telescope, which is a joint project of the Ministério da Ciência, Tecnologia e Inovações (MCTI/LNA) do Brasil, the US National Science Foundation’s NOIRLab, the University of North Carolina at Chapel Hill (UNC), and Michigan State University (MSU). This research has made use of the archive of the European Southern Observatory, and the NASA/IPAC Infrared Science Archive, which is funded by the National Aeronautics and Space Administration and operated by the California Institute of Technology. This research or product makes use of public auxiliary data provided by ESA/Gaia/DPAC/CU5 and prepared by Carine Babusiaux. This publication makes use of VOSA, developed under the Spanish Virtual Observatory project supported by the Spanish MINECO through grant AyA2017-84089. VOSA has been partially updated by using funding from the European Union’s Horizon 2020 Research and Innovation Programme, under Grant Agreement no. 776403 (EXOPLANETS-A) . We used NASA’s Astrophysics Data System Bibliographic Services, the Centre de Données astronomiques de Strasbourg, Astropy (Astropy
Collaboration et al., 2013), and Scipy (Virtanen
et al., 2019).
Data Availability Statement: TESS data is publicly available through MAST archive at STScI. Gaia data is publicly available through the Centre de Données astronomiques de Strasbourg (CDS). LCOGT data are either publicly available from its archive or from the authors upon request. All ESO data are publicly available from its archive. All other photometry is available through the Virtual Observatory or the individual catalogs maintained at the CDS. The SOAR Goodman Echelle and TripleSpec-4.1 spectra are available upon request from the authors.
References
- Alencar et al. (2010) Alencar S. H. P., et al., 2010, A&A, 519, A88
- Alexander (2012) Alexander R., 2012, ApJ, 757, L29
- Ansdell et al. (2015) Ansdell M., et al., 2015, ApJ, 798, 41
- Ansdell et al. (2016) Ansdell M., et al., 2016, ApJ, 816, 69
- Ansdell et al. (2019) Ansdell M., et al., 2019, MNRAS, 483, 3579
- Ansdell et al. (2020) Ansdell M., et al., 2020, MNRAS, 492, 572
- Astropy Collaboration et al. (2013) Astropy Collaboration et al., 2013, A&A, 558, A33
- Baraffe et al. (2015) Baraffe I., Homeier D., Allard F., Chabrier G., 2015, A&A, 577, A42
- Bayo et al. (2008) Bayo A., Rodrigo C., Barrado Y Navascués D., Solano E., Gutiérrez R., Morales-Calderón M., Allard F., 2008, A&A, 492, 277
- Bell et al. (2013) Bell C. P. M., Naylor T., Mayne N. J., Jeffries R. D., Littlefair S. P., 2013, MNRAS, 434, 806
- Bell et al. (2015) Bell C. P. M., Mamajek E. E., Naylor T., 2015, MNRAS, 454, 593
- Belokurov et al. (2020) Belokurov V., et al., 2020, MNRAS, 496, 1922
- Bertin & Arnouts (1996) Bertin E., Arnouts S., 1996, A&AS, 117, 393
- Bessolaz et al. (2008) Bessolaz N., Zanni C., Ferreira J., Keppens R., Bouvier J., 2008, A&A, 478, 155
- Bianchi et al. (2017) Bianchi L., Shiao B., Thilker D., 2017, ApJS, 230, 24
- Binks & Jeffries (2017) Binks A. S., Jeffries R. D., 2017, MNRAS, 469, 579
- Bodman et al. (2017) Bodman E. H. L., et al., 2017, MNRAS, 470, 202
- Bohn et al. (2022) Bohn A. J., et al., 2022, A&A, 658, A183
- Booth et al. (2021) Booth M., del Burgo C., Hambaryan V. V., 2021, MNRAS, 500, 5552
- Bouvier et al. (1999) Bouvier J., et al., 1999, A&A, 349, 619
- Bouvier et al. (2003) Bouvier J., et al., 2003, A&A, 409, 169
- Bouvier et al. (2014) Bouvier J., Matt S. P., Mohanty S., Scholz A., Stassun K. G., Zanni C., 2014, Protostars and Planets VI, pp 433–450
- Bredall et al. (2020) Bredall J. W., et al., 2020, MNRAS, 496, 3257
- Brown et al. (2013) Brown T. M., et al., 2013, PASP, 125, 1031
- Bryson et al. (2021) Bryson S., et al., 2021, AJ, 161, 36
- Budaj et al. (2015) Budaj J., Kocifaj M., Salmeron R., Hubeny I., 2015, MNRAS, 454, 2
- Caffau et al. (2011) Caffau E., Ludwig H. G., Steffen M., Freytag B., Bonifacio P., 2011, Sol. Phys., 268, 255
- Caldwell et al. (2020) Caldwell D. A., et al., 2020, Research Notes of the American Astronomical Society, 4, 201
- Casagrande & VandenBerg (2018) Casagrande L., VandenBerg D. A., 2018, MNRAS, 479, L102
- Chabrier et al. (2000) Chabrier G., Baraffe I., Allard F., Hauschildt P., 2000, ApJ, 542, 464
- Clemens et al. (2004) Clemens J. C., Crain J. A., Anderson R., 2004, in Moorwood A. F. M., Iye M., eds, Society of Photo-Optical Instrumentation Engineers (SPIE) Conference Series Vol. 5492, Ground-based Instrumentation for Astronomy. pp 331–340, doi:10.1117/12.550069
- Cody & Hillenbrand (2018) Cody A. M., Hillenbrand L. A., 2018, AJ, 156, 71
- Cody et al. (2014) Cody A. M., et al., 2014, AJ, 147, 82
- Coleman & Haworth (2020) Coleman G. A. L., Haworth T. J., 2020, MNRAS, 496, L111
- Cross et al. (2012) Cross N. J. G., et al., 2012, A&A, 548, A119
- Curran et al. (2011) Curran R. L., Argiroffi C., Sacco G. G., Orlando S., Peres G., Reale F., Maggio A., 2011, A&A, 526, A104
- Cushing et al. (2004) Cushing M. C., Vacca W. D., Rayner J. T., 2004, PASP, 116, 362
- Cutri et al. (2013) Cutri R. M., et al., 2013, Technical report, Explanatory Supplement to the AllWISE Data Release Products. IPAC/Caltech
- Czekala et al. (2015) Czekala I., Andrews S. M., Mandel K. S., Hogg D. W., Green G. M., 2015, ApJ, 812, 128
- Denis (2005) Denis C., 2005, VizieR Online Data Catalog, p. B/denis
- Faherty et al. (2018) Faherty J. K., Bochanski J. J., Gagné J., Nelson O., Coker K., Smithka I., Desir D., Vasquez C., 2018, ApJ, 863, 91
- Feiden (2016) Feiden G. A., 2016, A&A, 593, A99
- Feiden & Chaboyer (2012) Feiden G. A., Chaboyer B., 2012, ApJ, 761, 30
- Feiden & Chaboyer (2014) Feiden G. A., Chaboyer B., 2014, ApJ, 789, 53
- Fernandes et al. (2018) Fernandes R. B., et al., 2018, ApJ, 856, 103
- Flaherty et al. (2018) Flaherty K. M., Hughes A. M., Teague R., Simon J. B., Andrews S. M., Wilner D. J., 2018, ApJ, 856, 117
- France et al. (2018) France K., Arulanantham N., Fossati L., Lanza A. F., Loyd R. O. P., Redfield S., Schneider P. C., 2018, ApJS, 239, 16
- Gaches et al. (2020) Gaches B. A. L., Walch S., Offner S. S. R., Münker C., 2020, ApJ, 898, 79
- Gagné et al. (2018) Gagné J., et al., 2018, ApJ, 856, 23
- Gagné et al. (2021) Gagné J., Faherty J. K., Moranta L., Popinchalk M., 2021, ApJ, 915, L29
- Gaia Collaboration et al. (2016) Gaia Collaboration et al., 2016, A&A, 595, A1
- Gaia Collaboration et al. (2021) Gaia Collaboration et al., 2021, A&A, 649, A1
- Gaidos (2017) Gaidos E., 2017, MNRAS, 470, L1
- Gaidos et al. (2019a) Gaidos E., Hirano T., Ansdell M., 2019a, MNRAS, 485, 3876
- Gaidos et al. (2019b) Gaidos E., et al., 2019b, MNRAS, 488, 4465
- Gómez de Castro et al. (2015) Gómez de Castro A. I., Lopez-Santiago J., López-Martínez F., Sánchez N., Sestito P., de Castro E., Cornide M., Yañez Gestoso J., 2015, ApJS, 216, 26
- Green (2018) Green G., 2018, The Journal of Open Source Software, 3, 695
- Greene et al. (2019) Greene T., et al., 2019, BAAS, 51, 61
- Grevesse et al. (2007) Grevesse N., Asplund M., Sauval A. J., 2007, Space Sci. Rev., 130, 105
- Gullbring et al. (1998) Gullbring E., Hartmann L., Briceño C., Calvet N., 1998, ApJ, 492, 323
- Gustafsson et al. (2008) Gustafsson B., Edvardsson B., Eriksson K., Jørgensen U. G., Nordlund Å., Plez B., 2008, A&A, 486, 951
- Güver & Özel (2009) Güver T., Özel F., 2009, MNRAS, 400, 2050
- Hardegree-Ullman et al. (2019) Hardegree-Ullman K. K., Cushing M. C., Muirhead P. S., Christiansen J. L., 2019, arXiv e-prints, p. arXiv:1905.05900
- Haworth et al. (2018) Haworth T. J., Clarke C. J., Rahman W., Winter A. J., Facchini S., 2018, MNRAS, 481, 452
- Herbst et al. (1994) Herbst W., Herbst D. K., Grossman E. J., Weinstein D., 1994, AJ, 108, 1906
- Herczeg & Hillenbrand (2008) Herczeg G. J., Hillenbrand L. A., 2008, ApJ, 681, 594
- Hsu et al. (2019) Hsu D. C., Ford E. B., Ragozzine D., Ashby K., 2019, AJ, 158, 109
- Husser et al. (2013) Husser T.-O., Wende-von Berg S., Dreizler S., Homeier D., Reiners A., Barman T., Hauschildt P. H., 2013, A&A, 553, A6
- Izidoro et al. (2017) Izidoro A., Ogihara M., Raymond S. N., Morbidelli A., Pierens A., Bitsch B., Cossou C., Hersant F., 2017, MNRAS, 470, 1750
- Janson et al. (2012) Janson M., et al., 2012, ApJ, 754, 44
- Jordi et al. (2010) Jordi C., et al., 2010, A&A, 523, A48
- Kastner et al. (2016) Kastner J. H., Principe D. A., Punzi K., Stelzer B., Gorti U., Pascucci I., Argiroffi C., 2016, AJ, 152, 3
- Kennedy et al. (2007) Kennedy G. M., Kenyon S. J., Bromley B. C., 2007, Ap&SS, 311, 9
- Kennedy et al. (2017) Kennedy G. M., Kenworthy M. A., Pepper J., Rodriguez J. E., Siverd R. J., Stassun K. G., Wyatt M. C., 2017, Royal Soc. Open Sci., 4, 160652
- Kipping et al. (2015) Kipping D. M., Schmitt A. R., Huang X., Torres G., Nesvorný D., Buchhave L. A., Hartman J., Bakos G. Á., 2015, ApJ, 813, 14
- Kraus et al. (2012) Kraus A. L., Ireland M. J., Hillenbrand L. A., Martinache F., 2012, ApJ, 745, 19
- Kron (1980) Kron R. G., 1980, ApJS, 43, 305
- Kwan et al. (2007) Kwan J., Edwards S., Fischer W., 2007, ApJ, 657, 897
- Lee et al. (2020) Lee J., Song I., Murphy S., 2020, MNRAS, 494, 62
- Leike et al. (2020) Leike R. H., Glatzle M., Enßlin T. A., 2020, A&A, 639, A138
- Lenzen et al. (2003) Lenzen R., et al., 2003, in Iye M., Moorwood A. F. M., eds, Society of Photo-Optical Instrumentation Engineers (SPIE) Conference Series Vol. 4841, Instrument Design and Performance for Optical/Infrared Ground-based Telescopes. pp 944–952, doi:10.1117/12.460044
- Lépine et al. (2013) Lépine S., Hilton E. J., Mann A. W., Wilde M., Rojas-Ayala B., Cruz K. L., Gaidos E., 2013, AJ, 145, 102
- Lienhard et al. (2020) Lienhard F., et al., 2020, MNRAS, 497, 3790
- Lindegren et al. (2018) Lindegren L., et al., 2018, A&A, 616, A2
- Lissauer (2007) Lissauer J. J., 2007, ApJ, 660, L149
- Luger & Barnes (2015) Luger R., Barnes R., 2015, Astrobiology, 15, 119
- Luhman & Mamajek (2012) Luhman K. L., Mamajek E. E., 2012, ApJ, 758, 31
- Lustig-Yaeger et al. (2019) Lustig-Yaeger J., Meadows V. S., Lincowski A. P., 2019, AJ, 158, 27
- Malo et al. (2013) Malo L., Doyon R., Lafrenière D., Artigau É., Gagné J., Baron F., Riedel A., 2013, ApJ, 762, 88
- Malo et al. (2014) Malo L., Doyon R., Feiden G. A., Albert L., Lafrenière D., Artigau É., Gagné J., Riedel A., 2014, ApJ, 792, 37
- Manara et al. (2022) Manara C. F., Ansdell M., Rosotti G. P., Hughes A. M., Armitage P. J., Lodato G., Williams J. P., 2022, arXiv e-prints, p. arXiv:2203.09930
- McCully et al. (2018) McCully C., et al., 2018, Lcogt/Banzai: Initial Release, doi:10.5281/zenodo.1257560
- Mohanty et al. (2005) Mohanty S., Jayawardhana R., Basri G., 2005, ApJ, 626, 498
- Morales-Calderón et al. (2011) Morales-Calderón M., et al., 2011, ApJ, 733, 50
- Mulders et al. (2015) Mulders G. D., Pascucci I., Apai D., 2015, ApJ, 798, 112
- Mulders et al. (2021) Mulders G. D., Drążkowska J., van der Marel N., Ciesla F. J., Pascucci I., 2021, ApJ, 920, L1
- Murphy et al. (2018) Murphy S. J., Mamajek E. E., Bell C. P. M., 2018, MNRAS, 476, 3290
- Muzerolle et al. (2009) Muzerolle J., et al., 2009, ApJ, 704, L15
- Natta et al. (1997) Natta A., Grinin V. P., Mannings V., Ungerechts H., 1997, ApJ, 491, 885
- Natta et al. (2004) Natta A., Testi L., Muzerolle J., Randich S., Comerón F., Persi P., 2004, A&A, 424, 603
- Naylor (2009) Naylor T., 2009, MNRAS, 399, 432
- Naylor & Jeffries (2006) Naylor T., Jeffries R. D., 2006, MNRAS, 373, 1251
- Nidever et al. (2002) Nidever D. L., Marcy G. W., Butler R. P., Fischer D. A., Vogt S. S., 2002, ApJS, 141, 503
- Owen (2019) Owen J. E., 2019, Annual Review of Earth and Planetary Sciences, 47, 67
- Palla et al. (2007) Palla F., Randich S., Pavlenko Y. V., Flaccomio E., Pallavicini R., 2007, ApJ, 659, L41
- Pascucci et al. (2016) Pascucci I., et al., 2016, ApJ, 831, 125
- Pecaut & Mamajek (2013) Pecaut M. J., Mamajek E. E., 2013, ApJS, 208, 9
- Perraut & Gravity Collaboration (2021) Perraut K., Gravity Collaboration 2021, in The 20.5th Cambridge Workshop on Cool Stars, Stellar Systems, and the Sun (CS20.5). Cambridge Workshop on Cool Stars, Stellar Systems, and the Sun. p. 334, doi:10.5281/zenodo.4749037
- Platais et al. (1998) Platais I., Kozhurina-Platais V., van Leeuwen F., 1998, AJ, 116, 2423
- Rappaport et al. (2012) Rappaport S., et al., 2012, ApJ, 752, 1
- Rappaport et al. (2018) Rappaport S., et al., 2018, MNRAS, 474, 1453
- Reiners et al. (2022) Reiners A., et al., 2022, arXiv e-prints, p. arXiv:2204.00342
- Ribas et al. (2015) Ribas Á., Bouy H., Merín B., 2015, A&A, 576, A52
- Richert et al. (2018) Richert A. J. W., Getman K. V., Feigelson E. D., Kuhn M. A., Broos P. S., Povich M. S., Bate M. R., Garmire G. P., 2018, MNRAS, 477, 5191
- Ricker et al. (2014) Ricker G. R., et al., 2014, in Proc. SPIE. p. 914320 (arXiv:1406.0151), doi:10.1117/12.2063489
- Riello et al. (2021) Riello M., et al., 2021, A&A, 649, A3
- Rodriguez et al. (2014) Rodriguez D. R., Zuckerman B., Faherty J. K., Vican L., 2014, A&A, 567, A20
- Rodriguez et al. (2017) Rodriguez J. E., et al., 2017, ApJ, 848, 97
- Roggero et al. (2021) Roggero N., Bouvier J., Rebull L. M., Cody A. M., 2021, A&A, 651, A44
- Ronco et al. (2021) Ronco M. P., Guilera O. M., Cuadra J., Miller Bertolami M. M., Cuello N., Fontecilla C., Poblete P., Bayo A., 2021, ApJ, 916, 113
- Rousset et al. (2003) Rousset G., et al., 2003, in Wizinowich P. L., Bonaccini D., eds, Society of Photo-Optical Instrumentation Engineers (SPIE) Conference Series Vol. 4839, Adaptive Optical System Technologies II. pp 140–149, doi:10.1117/12.459332
- Sanchis-Ojeda et al. (2015) Sanchis-Ojeda R., et al., 2015, ApJ, 812, 112
- Savitzky & Golay (1964) Savitzky A., Golay M. J. E., 1964, Analytical Chemistry, 36, 1627
- Scargle (1982) Scargle J. D., 1982, ApJ, 263, 835
- Schlawin et al. (2014) Schlawin E., et al., 2014, in Ramsay S. K., McLean I. S., Takami H., eds, Society of Photo-Optical Instrumentation Engineers (SPIE) Conference Series Vol. 9147, Ground-based and Airborne Instrumentation for Astronomy V. p. 91472H, doi:10.1117/12.2055233
- Schmitt et al. (2019) Schmitt A. R., Hartman J. D., Kipping D. M., 2019, arXiv e-prints, p. arXiv:1910.08034
- Schneider et al. (2019) Schneider A. C., Shkolnik E. L., Allers K. N., Kraus A. L., Liu M. C., Weinberger A. J., Flagg L., 2019, AJ, 157, 234
- Schuller et al. (2003) Schuller F., et al., 2003, A&A, 403, 955
- Silburt et al. (2015) Silburt A., Gaidos E., Wu Y., 2015, ApJ, 799, 180
- Silverberg et al. (2020) Silverberg S. M., et al., 2020, ApJ, 890, 106
- Skrutskie et al. (2006) Skrutskie M. F., et al., 2006, AJ, 131, 1163
- Somers et al. (2020) Somers G., Cao L., Pinsonneault M. H., 2020, ApJ, 891, 29
- Sorelli et al. (1996) Sorelli C., Grinin V. P., Natta A., 1996, A&A, 309, 155
- Stassun et al. (2014) Stassun K. G., Feiden G. A., Torres G., 2014, New Astron. Rev., 60, 1
- Stassun et al. (2018) Stassun K. G., et al., 2018, AJ, 156, 102
- Stauffer et al. (2015) Stauffer J., et al., 2015, AJ, 149, 130
- Stauffer et al. (2017) Stauffer J., et al., 2017, AJ, 153, 152
- Tajiri et al. (2020) Tajiri T., et al., 2020, ApJS, 251, 18
- Tang et al. (2019) Tang S.-Y., et al., 2019, ApJ, 877, 12
- Torres et al. (2008) Torres C. A. O., Quast G. R., Melo C. H. F., Sterzik M. F., 2008, Young Nearby Loose Associations. p. 757
- Tremblay et al. (2020) Tremblay L., Line M. R., Stevenson K., Kataria T., Zellem R. T., Fortney J. J., Morley C., 2020, AJ, 159, 117
- Vacca et al. (2003) Vacca W. D., Cushing M. C., Rayner J. T., 2003, PASP, 115, 389
- Varga et al. (2017) Varga J., et al., 2017, A&A, 604, A84
- Virtanen et al. (2019) Virtanen P., et al., 2019, arXiv e-prints, p. arXiv:1907.10121
- White & Basri (2003) White R. J., Basri G., 2003, ApJ, 582, 1109
- Wilhelm & Portegies Zwart (2022) Wilhelm M. J. C., Portegies Zwart S., 2022, MNRAS, 509, 44
- Wright et al. (2010) Wright E. L., et al., 2010, AJ, 140, 1868
- Wright et al. (2018) Wright N. J., Newton E. R., Williams P. K. G., Drake J. J., Yadav R. K., 2018, MNRAS, 479, 2351
- Yuan et al. (2013) Yuan H. B., Liu X. W., Xiang M. S., 2013, MNRAS, 430, 2188
- Zacharias et al. (2013) Zacharias N., Finch C. T., Girard T. M., Henden A., Bartlett J. L., Monet D. G., Zacharias M. I., 2013, AJ, 145, 44
- Zawadzki et al. (2021) Zawadzki B., Carrera D., Ford E. B., 2021, MNRAS, 503, 1390
- Zhang et al. (2015) Zhang K., Crockett N., Salyk C., Pontoppidan K., Turner N. J., Carpenter J. M., Blake G. A., 2015, ApJ, 805, 55