Aspect-based Analysis of Advertising Appeals
for Search Engine Advertising
Abstract
Writing an ad text that attracts people and persuades them to click or act is essential for the success of search engine advertising. Therefore, ad creators must consider various aspects of advertising appeals (A3) such as the price, product features, and quality. However, products and services exhibit unique effective A3 for different industries. In this work, we focus on exploring the effective A3 for different industries with the aim of assisting the ad creation process. To this end, we created a dataset of advertising appeals and used an existing model that detects various aspects for ad texts. Our experiments demonstrated that different industries have their own effective A3 and that the identification of the A3 contributes to the estimation of advertising performance.
1 Introduction
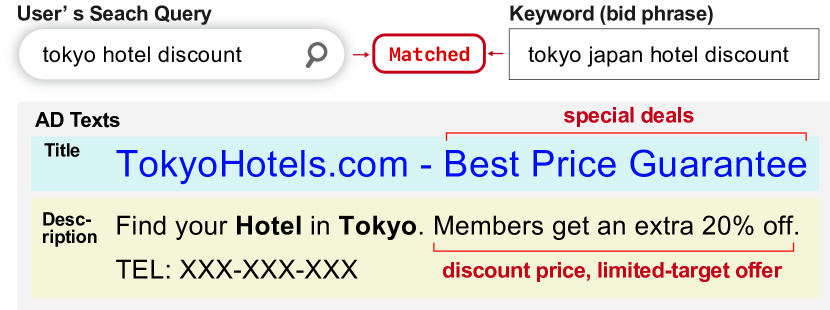
Search engine advertising (SEA) displays an ad text that consists of a title and a description that are relevant to search queries in search engines, as illustrated in Figure 1. SEA plays an important role in sales promotion and marketing as it allows advertisers to approach users who are interested in specific search queries effectively Fain and Pedersen (2006). Ad creators write an ad text that attracts the attention of users and persuades them to click or act by introducing various aspects of advertising appeals (denoted as A3 in this paper for short), such as special deals, as shown in Figure 1. However, products and services exhibit unique effective A3 for different industries. For example, limited offers may be attractive to users in the e-commerce (EC) industry, whereas the quality of products may be more important in the automobile industry.
Thus, we argue that the suggestion of effective A3 for various industries can offer assistance to ad creators.
Therefore, we need to discover the effective aspects. However, although aspect-based text analysis has attracted significant attention in the review analysis for products and services Akhtar et al. (2017); Chen et al. (2019), it has received less focus in the advertisement field.
In this work, to deal with this problem, we defined the A3 and constructed a dataset of ad texts that are annotated with A3 in various industries as a first attempt towards assisting ad creators with A3. Subsequently we developed an aspect detection model to identify different A3 and performed correlation analysis between A3 and the click-through rate (CTR), which is used for supporting ad creation, as an advertising performance metric to explore the effective aspects in different industries. Furthermore, we investigated the effectiveness of A3 in CTR prediction as a potential application for ad creation support.
Through correlation analysis in our experiments, we found that different industries exhibit unique effective A3. Furthermore, we found that the identification of the A3 contributes to the CTR prediction.
2 Related Work
Ad Creation Support
Attempts have been made to perform automatic generation of ad texts and keywords Ravi et al. (2010); Hughes et al. (2019); Kamigaito et al. (2021) as well as the estimation of advertising performance metrics such as the CTR Richardson et al. (2007); Zhang et al. (2014); Mishra et al. (2021) to support the ad creation process. In this work, we tackle the discovery of the effective A3 for various industries and apply the A3 to CTR prediction with the goal of improving the efficiency of the ad creation process.
Aspect-based Text Analysis
Although aspect-based text analysis has attracted significant attention, the majority of studies have been limited to specific domains such as hotels, restaurants, and home appliances Pontiki et al. (2016); Akhtar et al. (2017); Chen et al. (2019). Moreover, as the product review analysis focuses on the aspects of each product, the defined aspects are extremely fine grained (e.g., the modes, energy efficiency, and noise for refrigerators Li et al. (2020)). These aspects are not suitable for ad creation because ad creators must deal with ad texts for various products in multiple industries. Therefore, ad creators are required to consider numerous A3. In this study, we carefully designed labels that cover the A3 for the general purpose of exploring these in a wide range of industries. Furthermore, we explored methods for aspect detection, as in the previous work Bagheri et al. (2013), as well as the identification of the effective aspects in terms of advertising performance metrics such as the CTR.
3 Construction of A3 Dataset
3.1 Data Collection
| Labels | #spans | Labels | #spans | ||
|---|---|---|---|---|---|
| (1) | Special deals | 343 | (12) | Limited offers | 52 |
| (2) | Discount price | 120 | (13) | Limited time | 61 |
| (3) | Reward points | 85 | (14) | Limited target | 114 |
| (4) | Free | 430 | (15) | First-time limited | 25 |
| (5) | Special gift | 126 | (16) | Track record | 75 |
| (6) | Features | 1,360 | (17) | Largest/no. 1 | 141 |
| (7) | Quality | 65 | (18) | Product lineup | 258 |
| (8) | Problem solving | 17 | (19) | Trend | 99 |
| (9) | Speed | 142 | (20) | Others | 182 |
| (10) | User-friendliness | 337 | (21) | Story | 98 |
| (11) | Transportation | 89 | |||
We constructed a dataset of advertising appeals to understand the A3 in ad texts. Many A3 exist in real-world advertisements, including product features, price, and campaigns. We collected 782,158 ads from March 1, 2020 to February 28, 2021 through Google Ads,111https://ads.google.com/ which is an online advertising platform, to cover the expressions of advertising appeals in a wide range of industries. In this work, we used ads in Japanese. Each ad consists of a title, a description, and a landing page (LP), which is a web page for a specific advertising campaign. We used the meta-description222A meta-description is an HTML attribute that provides a brief summary of a web page, such as an LP. of each LP as the LP content. We sampled 5,000 ad texts for each advertiser to alleviate the bias owing to a different quantity of ad texts for the advertisers. Moreover, we excluded ad texts that comprised less than 15 characters or more than 200 characters. The aforementioned two steps yielded 34,952 ad texts. Furthermore, we excluded duplicates and highly similar texts using the normalized Levenshtein distance metric Levenshtein (1966); Greenhill (2011), because the majority of the ad texts were created from templates for the sake of cost efficiency Fujita et al. (2010). As a result, we collected 2,738 ad texts consisting of 666 titles, 1,532 descriptions, and 440 LP contents from 13 types of industries.333EC, Media, Finance, VOD&eBook, Cosmetics, Human resources, Education, Travel, Automobile, Entertainment, Real estate, and Beauty&health We provide the detailed statistics of the collected ad texts in Appendix A.
3.2 Label Types and Annotation Scheme
Owing to the existence of various A3, we believe that the systematic organization of the A3 can aid the ad creation process. We manually defined aspect labels in the following two phases. First, we conducted a preliminary analysis of the collected ad texts and found that approximately eight aspects appeared: special deals, quality, problem solving, speed, user-friendliness, limited offers, product lineup, and trend. Second, we presented these aspects and the collected ad texts to experienced ad creators and asked for their opinions on the A3 with the aim of refining the aspect labels. Consequently, the ad creators suggested that we further subdivide special deals and limited offers. For example, special deals was subdivided into discount price, reward points, free, and special gift. The reason for this is that there are differences in the strength of the aspects between free and special gift, even though they appear to be similar. Furthermore, largest/no.1 was added as another aspect label because it attracts a lot of users.
Table 1 lists the A3 that we manually defined. Detailed descriptions and examples are provided in Appendix B. Finally, we carefully designed a hierarchical scheme for A3 to help ad creators and annotators to understand the differences between the labels. The aspect hierarchy consists of five types of coarse-grained labels including special deals, which are underlined in Table 1, and 16 types of fine-grained labels such as discount price.
Because an ad text often contains multiple expressions of advertising appeals, as depicted in Figure 1, we defined an advertising expression as a span text to be annotated. For example, annotators provide the aspect label (e.g., special deals) for the span text “best price guarantee.” Each span was annotated during the annotation work. Moreover, we allowed the annotators to provide multiple labels for each span because an expression of advertising appeals may contain multiple aspects. For example, the advertising expression “members get an extra 20% off” contains two aspects discount price and limited-target offer, because it means that only users belonging to a membership program can receive an extra 20% discount.
3.3 Annotation Process
We recruited six participants who worked at an advertising agency. We separated 2,738 collected ad texts into two sets consisting of 1,100 and 1,638 texts, and assigned three participants to each set. We presented a one-hour lecture to the participants to explain the detailed definitions of the labels and to provide annotation examples. Furthermore, we asked them to annotate 30 ad texts that were separated from the collected dataset as a practice session. After the session, we answered questions from the participants. During the annotation, we answered any additional questions from them and shared information when a difficult case appeared, which was relatively rare.
3.4 Annotated Dataset Statistics
Table 1 displays the statistics of the annotated dataset. We adopted annotated spans only if at least two of the three annotators for each span text agreed with their boundaries and labels. The annotation work for the 2,738 ad texts required a total of 42 hours; thus, the average time per ad text was 55.2 seconds. A single ad text contains 1.54 spans on average. Furthermore, we calculated the Cohen’s Kappa coefficients () between the tokens annotated by different pairs of annotators to determine the inter-annotator agreement. Moreover, following the previous work Brandsen et al. (2020), we also report the scores that were calculated between the spans annotated by different pairs of annotators, where we considered one annotation as the ground truth and another as the prediction. We obtained relatively high agreement among the annotators: .
4 Aspect Detection Model
We investigate two existing models for aspect detection, i.e., the span-based Zheng et al. (2019) and document-based (doc-based) models Devlin et al. (2019). These models receive an ad text as an input and predict aspect labels , where and represent a token of an ad text and a binary label for each aspect label, respectively. As each span may contain multiple aspects, both models perform label prediction in the form of multi-label classification Kurata et al. (2016). is the number of aspect labels defined in Table 1. We consider an expression of the advertising appeals in an ad text, such as “best price guarantee” in Figure 1, to be a span. We use to represent the span from to , where . The span-based model consists of two steps: (i) extracting a span from and (ii) predicting the aspect labels for each span. In contrast, the doc-based model predicts the aspect labels for an entire ad text . We employed a pre-trained BERT Devlin et al. (2019) for both models owing to the limited amount of the annotated dataset.
4.1 Span-Based Model
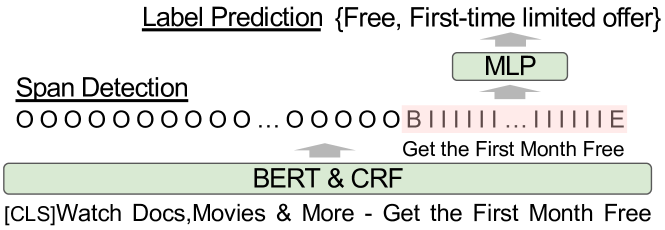
Figure 2 presents an overview of the span-based model. The task of extracting a span from an ad text can be considered as named entity recognition, and we introduce the boundary-aware neural model proposed by Zheng et al. (2019). We consider characters as a unit (token) in the span-based model. We use the BIOE scheme to create boundary labels for the input tokens . We feed into the BERT to obtain a vector for for span detection. Subseqently, we obtain the distribution of the boundary labels by applying a multilayer perceptron (MLP) , where is the number of boundary types (). We also use a linear-chain conditional random field (CRF) Lafferty et al. (2001) to model the dependencies of the boundary labels (e.g., label must appear after or ). As a result, we can obtain the boundary labels that are predicted by viterbi decoding for the input .
For label prediction, we create a vector representation for a span using the average of the output vectors of the BERT (i.e., ). Thereafter, we obtain the probability that each span belongs to the aspect labels by applying an MLP and a sigmoid function , where and . For example, in Figure 2, the expression “Get the First Month Free” is detected as a span, and the model predicts two aspect labels free and first-time limited offer for the detected span.
4.2 Doc-Based Model
Although the span-based model offers the advantage of detecting a specific expression using span detection, we are concerned that errors in span detection could affect label prediction. Therefore, we also introduce the doc-based model as an alternative to the span-based model.
The doc-based model is a BERT-based classification model. Following the original BERT-based classifier Devlin et al. (2019), the doc-based model consists of a BERT and an MLP, which take an entire ad text as an input and outputs labels . Specifically, we first input the ad text into the BERT and obtain the vector representation for a [CLS] token. Subsequently, we feed the vector into the MLP to obtain the probability that the ad text belongs to the aspect labels as a multi-label classification task , where and .
5 CTR Prediction with A3
Within the context of ad creation support, the estimation of advertising performance for an ad text (e.g., the CTR) plays a key role in both the improvement and cost efficiency of the ad creation because it helps us understand the user’s interest. Therefore, we also investigate whether the A3 contributes to the prediction of the advertising performance. For this task, we input an ad text consisting of a title and description, an industry type of the ad (e.g., EC), and keywords (e.g., tokyo and hotel). We also introduce the predicted aspect labels (e.g., features) for as additional features, which were detected by either the span-based or doc-based model. In this case, we use the CTR as the advertising performance (CTR clicks impressions).
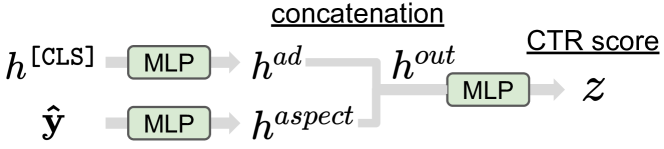
Figure 3 presents an overview of the regression model. Similarly to recent work Mishra et al. (2021), we design this regression model based on the BERT. In the model, we feed the three types of tokens , , into the BERT to obtain the vector for a [CLS] token. Subsequently, we input and the aspect labels for the ad text into the following MLP. Thereafter, we obtain the concatenated vector , where “;” is a concatenation operator. The final MLP then predicts a CTR score from as .
6 Experiments
We conducted experiments on three tasks: (1) aspect detection for the A3, (2) correlation analysis between the A3 and CTR, and (3) CTR prediction.
6.1 Experimental Settings
Dataset
We used the annotated dataset in Table 1 for the aspect detection. We separated the dataset into 1,857 samples for training, 465 for development, and 410 for testing after excluding 6 ad texts that we determined were inappropriately annotated. We collected 168,412 pairs of ad texts, keywords, and industry types from March 1, 2020 to February 28, 2021 through Google Ads for the CTR prediction. We carefully separated the dataset into 136,352, 16,084, and 15,976 samples for training, development, and testing, respectively. The detailed statistics of the dataset for the CTR prediction are presented in Appendix C. We used the training dataset for the CTR prediction for the correlation analysis between the CTR and A3. We used the campaign ID of each ad for data division to prevent leakage between the datasets.
Implementation
We used the character-level BERT444https://huggingface.co/cl-tohoku/bert-base-japanese-char for the span-based model, and the word-level BERT555https://huggingface.co/cl-tohoku/bert-base-japanese for the doc-based model and CTR prediction. We fine-tuned the models on the dataset and applied an early stopping strategy with 10 epochs. The training was stopped if there was no improvement in the validation loss for three consecutive epochs in all experiments. Further implementation details are described in Appendix D.
Evaluation Metrics
We calculated the scores of the aspect labels for the aspect detection. For the span-based model, a detected label was considered as a true positive if both its span and label were correctly detected. We used the area under the receiver operating characteristic curve (AUC) Fawcett (2006), which is a widely used metric in the field of CTR prediction Zhou et al. (2018); Xiao et al. (2020). Moreover, we used the root-mean-squared error (RMSE) and mean absolute error (MAE) to measure the differences between the ground-truth and predicted scores.
6.2 Aspect Detection
| Labels | Span-based | Doc- | |||
| Pred | Orac | based | |||
| (1) | Special deals | 0.11 | 0.19 | 0.70 | |
| (2) | Discount price | 0.00 | 0.00 | 0.57 | |
| (3) | Reward points | 0.62 | 0.74 | 0.75 | |
| (4) | Free | 0.68 | 0.88 | 0.94 | |
| (5) | Special gift | 0.28 | 0.40 | 0.65 | |
| (6) | Features | 0.50 | 0.70 | 0.72 | |
| (7) | Quality | 0.00 | 0.00 | 0.44 | |
| (8) | Problem solving | 0.00 | 0.00 | 0.00 | |
| (9) | Speed | 0.51 | 0.66 | 0.92 | |
| (10) | User-friendliness | 0.46 | 0.59 | 0.56 | |
| (11) | Transportation | 0.91 | 1.00 | 0.53 | |
| (12) | Limited offers | 0.38 | 0.53 | 0.62 | |
| (13) | Limited time | 0.00 | 0.00 | 0.47 | |
| (14) | Limited target | 0.26 | 0.57 | 0.44 | |
| (15) | First-time limited | 0.00 | 0.00 | 0.00 | |
| (16) | Performance | 0.27 | 0.50 | 0.48 | |
| (17) | Largest/no. 1 | 0.67 | 0.80 | 0.82 | |
| (18) | Product lineup | 0.42 | 0.67 | 0.67 | |
| (19) | Trend | 0.41 | 0.56 | 0.47 | |
| (20) | Others | 0.00 | 0.00 | 0.39 | |
| (21) | Story | 0.32 | 0.83 | 0.53 | |
| Macro average | 0.32 | 0.46 | 0.56 | ||
In this experiment, we evaluated two models, the span-based and doc-based models. As errors in the span prediction may affect the label prediction in the span-based model, we also introduced the Oracle model, which predicts their labels, provided with oracle spans, in addition to the Pred model, which predicts both the spans and labels.
The evaluation results for the aspect detection are presented in Table 2. The doc-based model outperformed the span-based model, including the Oracle model, for most A3. As the Pred model is required to predict both the spans and labels correctly, its task is relatively more difficult than that of other models. In fact, we found that the score for the span detection is 0.69 for the Pred model. Therefore, we conclude that it is the reason why the macro-average score of Pred was lower than those of the doc-based and Oracle models.
In the comparison between the Oracle and doc-based models, the doc-based model outperforms the Oracle model. We hypothesize that its training objective for the span-based model is more difficult as it is more fine grained than the doc-based model.
We observed that the scores for free, speed, and largest/no. 1 are high in the doc-based model. This implies that the advertising expressions for these aspects are relatively monotonous and easy to detect compared to the other aspects. For example, the advertising expression “free shipping,” which belongs to free, often occurs frequently in ad texts for a wide range of industries. The aspect detection was difficult for several aspects in which the numbers of annotated cases were limited, such as (8) and (15), as indicated from Tables 1 and 2. Hence, they exhibited an score of 0.00.
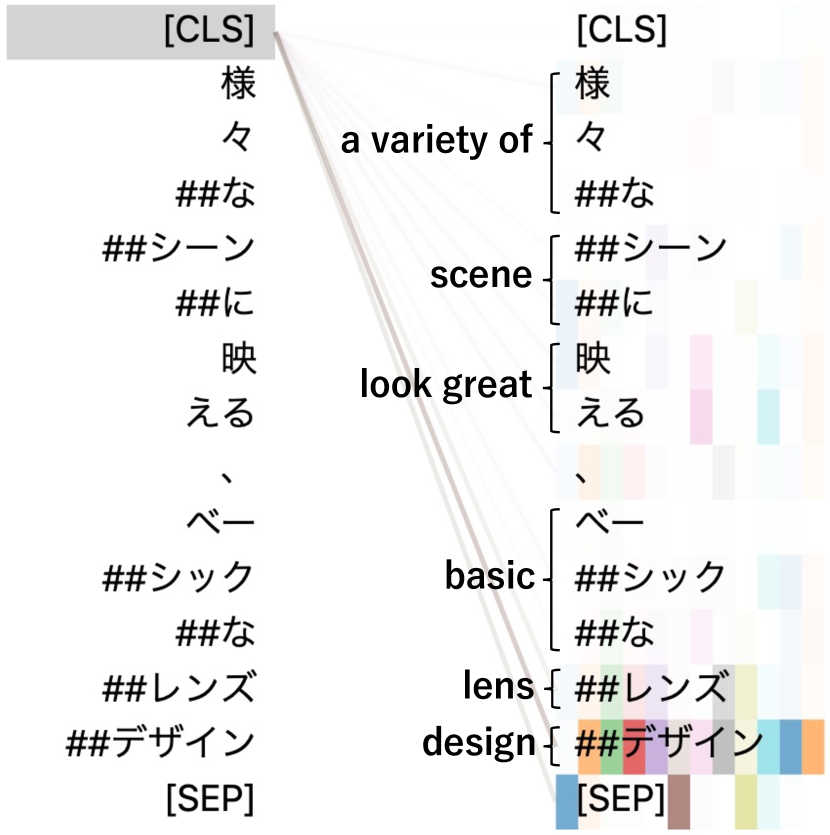
“Simple-designed eyeglass lenses that look great in a variety of scenes”
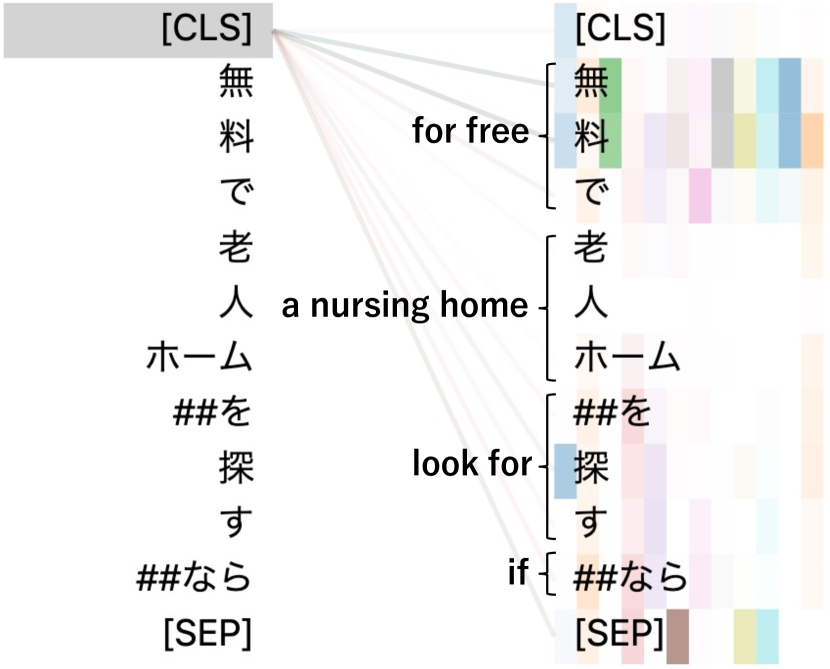
“Find a nursing home for free”
We also conducted an analysis of the attention in the doc-based model to understand to which signals the model attended in the aspect detection. Figure 4 depicts the visualized attention patterns with respect to the [CLS] token of the final layer of the BERT. We found that many of the attention heads attend to the words “design” and “for free” for the ad text (a) and (b), respectively. This suggests that the doc-based model classified the ad text (a) and (b) as features and free, respectively, because these words were related to the aspects.
6.3 Correlation between Aspects and CTR
| Labels | eBook | EC | Fin | HR | Travel |
| (1) | 0.229 | 0.011 | -0.171 | 0.017 | |
| (2) | -0.135 | -0.166 | -0.128 | -0.176 | |
| (3) | 0.183 | 0.000 | 0.443 | 0.377 | |
| (4) | -0.126 | -0.163 | -0.052 | 0.116 | |
| (5) | 0.086 | 0.122 | 0.339 | -0.024 | -0.332 |
| (6) | -0.128 | -0.121 | -0.094 | -0.040 | 0.050 |
| (7) | -0.001 | -0.081 | -0.034 | ||
| (8) | |||||
| (9) | -0.017 | 0.065 | -0.109 | 0.024 | |
| (10) | -0.236 | 0.053 | -0.252 | -0.004 | 0.205 |
| (11) | |||||
| (12) | -0.036 | -0.149 | -0.044 | 0.003 | 0.221 |
| (13) | -0.090 | 0.186 | 0.014 | -0.006 | -0.184 |
| (14) | -0.020 | -0.162 | -0.011 | 0.023 | |
| (15) | -0.165 | ||||
| (16) | 0.108 | -0.161 | -0.099 | 0.237 | -0.148 |
| (17) | 0.283 | -0.073 | 0.143 | 0.102 | |
| (18) | -0.206 | 0.044 | -0.005 | -0.159 | -0.195 |
| (19) | -0.074 | -0.007 | 0.157 | ||
| (20) | 0.022 | -0.083 | 0.134 | -0.042 | 0.268 |
| (21) | -0.093 | ||||
| #cases | 30,536 | 20,671 | 20,183 | 10,823 | 8,093 |
To realize the ad creation process considering the A3, we analyzed which A3 were effective in each industry through correlation analysis between the CTR666We used the actual CTR for each ad rather than the predicted CTR. and the aspect labels that were predicted by the doc-based model. Because the aspect labels are binary for each aspect (e.g., whether or not each aspect is included in an ad text) and the CTR is continuous, we used the point-biserial correlation coefficient for the analysis. Table 3 lists the point-biserial correlation coefficients between the aspect labels and the CTR. We investigated the correlation among the industry types VOD&eBook (eBook), EC, Finance (Fin), Human resources (HR), and Travel. As indicated in bold text in Table 3, we observed a weak correlation (0.25 < < 0.5) between the CTR and the labels, such as (3) reward points for Finance. This implies that ad texts that include effective A3 tend to attract more attention from users. However, there was no correlation with regard to the other aspects. This may be because (1) features, for example, is considered to be a general-purpose aspect and can be used in any situation.
Based on the above insights, we also investigated the expressions for the effective A3 in our annotated dataset. For example, regarding the VOD&eBook industry, we found that the expression “one of the largest websites in Japan” (国内最大級サイト) was annotated as (17) largest/no. 1. Furthermore, the expressions for Finance “get [N] points for new membership” (新規入会&利用で[N]ポイント) and “earn [N] points per [N] yen” ([N]円につき[N]ポイント貯まる) were labeled with (3) reward points.777Numbers (e.g., price, points) are masked with [N]. We believe that the presentation of these effective expressions to ad creators may provide actionable insights and aid in the ad creation process.
6.4 CTR Prediction
| AUC () | RMSE () | MAE () | |
|---|---|---|---|
| BERT | 0.683 | 0.220 | 0.142 |
| + | 0.709 | 0.218 | 0.137 |
| + | 0.713 | 0.217 | 0.136 |
We investigated whether the identification of the A3 contributes to the estimation accuracy of the CTR. Table 4 presents the results of the CTR prediction. For comparison with a baseline (BERT), that does not use A3, we introduced two models that consider A3 predicted by the span-based model (+) or the doc-based model (+). It can be observed that the aspect-aware models that leverage the A3 outperformed the baseline model in terms of all evaluation metrics. This suggests that the identification of the A3 that are included in ad texts can contribute to the improvement of CTR prediction. In the comparison between the two models, + improved the performance of the CTR prediction more than the +. This is likely because the doc-based model predicted the aspect labels more accurately than the span-based model, as indicated in Table 2. We believe that improving the aspect detection with more refined methods will lead to better correlation and prediction for the CTR.
7 Conclusions
In this work, we have explored the effective A3 by means of aspect detection and correlation analysis towards ad creation support with the A3. Our experimental results demonstrated that each industry exhibits unique effective A3 and that identification of the A3 can contributes to CTR prediction.
We demonstrate two possible directions for future studies. First, we will investigate whether introducing the effective A3 in the ad creation process can help ad creators write effective ad texts in real-world applications. Second, we will develop an aspect-aware model to automatically generate ad texts to support the ad creation process. For the latter, we will train the model with a dataset that includes pairs of ad texts and their corresponding aspect labels predicted using aspect detection.
References
- Akhtar et al. (2017) Nadeem Akhtar, Nashez Zubair, Abhishek Kumar, and Tameem Ahmad. 2017. Aspect based sentiment oriented summarization of hotel reviews. Procedia Computer Science, 115:563–571. 7th International Conference on Advances in Computing & Communications.
- Akiba et al. (2019) Takuya Akiba, Shotaro Sano, Toshihiko Yanase, Takeru Ohta, and Masanori Koyama. 2019. Optuna: A next-generation hyperparameter optimization framework. In Proceedings of the 25rd ACM SIGKDD International Conference on Knowledge Discovery and Data Mining.
- Bagheri et al. (2013) Ayoub Bagheri, Mohamad Saraee, and Franciska de Jong. 2013. An unsupervised aspect detection model for sentiment analysis of reviews. In Natural Language Processing and Information Systems, pages 140–151.
- Brandsen et al. (2020) Alex Brandsen, Suzan Verberne, Milco Wansleeben, and Karsten Lambers. 2020. Creating a dataset for named entity recognition in the archaeology domain. In Proceedings of the 12th Language Resources and Evaluation Conference, pages 4573–4577.
- Chen et al. (2019) Qibin Chen, Junyang Lin, Yichang Zhang, Hongxia Yang, Jingren Zhou, and Jie Tang. 2019. Towards knowledge-based personalized product description generation in e-commerce. In Proceedings of the 25th ACM SIGKDD International Conference on Knowledge Discovery & Data Mining, pages 3040–3050.
- Devlin et al. (2019) Jacob Devlin, Ming-Wei Chang, Kenton Lee, and Kristina Toutanova. 2019. BERT: Pre-training of deep bidirectional transformers for language understanding. In Proceedings of the 2019 Conference of the North American Chapter of the Association for Computational Linguistics: Human Language Technologies, Volume 1 (Long and Short Papers), pages 4171–4186.
- Fain and Pedersen (2006) Daniel C. Fain and Jan O. Pedersen. 2006. Sponsored search: A brief history. Bulletin of the American Society for Information Science and Technology, 32(2):12–13.
- Fawcett (2006) Tom Fawcett. 2006. An introduction to ROC analysis. Pattern Recognition Letters, 27(8):861–874.
- Fujita et al. (2010) Atsushi Fujita, Katsuhiro Ikushima, Satoshi Sato, Ryo Kamite, Ko Ishiyama, and Osamu Tamachi. 2010. Automatic generation of listing ads by reusing promotional texts. In Proceedings of the 12th International Conference on Electronic Commerce: Roadmap for the Future of Electronic Business, pages 179–188.
- Greenhill (2011) Simon J. Greenhill. 2011. Levenshtein distances fail to identify language relationships accurately. Computational Linguistics, 37(4):689–698.
- Hughes et al. (2019) J. Weston Hughes, Keng-hao Chang, and Ruofei Zhang. 2019. Generating better search engine text advertisements with deep reinforcement learning. In Proceedings of the 25th ACM SIGKDD International Conference on Knowledge Discovery & Data Mining, pages 2269–2277.
- Kamigaito et al. (2021) Hidetaka Kamigaito, Peinan Zhang, Hiroya Takamura, and Manabu Okumura. 2021. An empirical study of generating texts for search engine advertising. In Proceedings of the 2021 Conference of the North American Chapter of the Association for Computational Linguistics: Human Language Technologies: Industry Papers, pages 255–262.
- Kurata et al. (2016) Gakuto Kurata, Bing Xiang, and Bowen Zhou. 2016. Improved neural network-based multi-label classification with better initialization leveraging label co-occurrence. In Proceedings of the 2016 Conference of the North American Chapter of the Association for Computational Linguistics: Human Language Technologies, pages 521–526.
- Lafferty et al. (2001) John D. Lafferty, Andrew McCallum, and Fernando C. N. Pereira. 2001. Conditional random fields: Probabilistic models for segmenting and labeling sequence data. In Proceedings of the Eighteenth International Conference on Machine Learning, pages 282–289.
- Levenshtein (1966) Vladimir Iosifovich Levenshtein. 1966. Binary codes capable of correcting deletions, insertions and reversals. Soviet Physics Doklady, 10(8):707–710.
- Li et al. (2020) Haoran Li, Peng Yuan, Song Xu, Youzheng Wu, Xiaodong He, and Bowen Zhou. 2020. Aspect-aware multimodal summarization for chinese e-commerce products. In Proceedings of the AAAI Conference on Artificial Intelligence, volume 34, pages 8188–8195.
- Mishra et al. (2021) Shaunak Mishra, Changwei Hu, Manisha Verma, Kevin Yen, Yifan Hu, and Maxim Sviridenko. 2021. Tsi: An ad text strength indicator using text-to-ctr and semantic-ad-similarity. In Proceedings of the 30th ACM International Conference on Information & Knowledge Management, pages 4036–4045.
- Pontiki et al. (2016) Maria Pontiki, Dimitris Galanis, Haris Papageorgiou, Ion Androutsopoulos, Suresh Manandhar, Mohammad AL-Smadi, Mahmoud Al-Ayyoub, Yanyan Zhao, Bing Qin, Orphée De Clercq, Véronique Hoste, Marianna Apidianaki, Xavier Tannier, Natalia Loukachevitch, Evgeniy Kotelnikov, Nuria Bel, Salud María Jiménez-Zafra, and Gülşen Eryiğit. 2016. SemEval-2016 task 5: Aspect based sentiment analysis. In Proceedings of the 10th International Workshop on Semantic Evaluation, pages 19–30.
- Ravi et al. (2010) Sujith Ravi, Andrei Broder, Evgeniy Gabrilovich, Vanja Josifovski, Sandeep Pandey, and Bo Pang. 2010. Automatic generation of bid phrases for online advertising. In Proceedings of the Third ACM International Conference on Web Search and Data Mining, pages 341–350.
- Richardson et al. (2007) Matthew Richardson, Ewa Dominowska, and Robert Ragno. 2007. Predicting clicks: Estimating the click-through rate for new ads. In Proceedings of the 16th International Conference on World Wide Web, pages 521–530.
- Wolf et al. (2020) Thomas Wolf, Lysandre Debut, Victor Sanh, Julien Chaumond, Clement Delangue, Anthony Moi, Pierric Cistac, Tim Rault, Rémi Louf, Morgan Funtowicz, Joe Davison, Sam Shleifer, Patrick von Platen, Clara Ma, Yacine Jernite, Julien Plu, Canwen Xu, Teven Le Scao, Sylvain Gugger, Mariama Drame, Quentin Lhoest, and Alexander M. Rush. 2020. Transformers: State-of-the-art natural language processing. In Proceedings of the 2020 Conference on Empirical Methods in Natural Language Processing: System Demonstrations, pages 38–45.
- Xiao et al. (2020) Zhibo Xiao, Luwei Yang, Wen Jiang, Yi Wei, Yi Hu, and Hao Wang. 2020. Deep multi-interest network for click-through rate prediction. In Proceedings of the 29th ACM International Conference on Information & Knowledge Management, pages 2265–2268.
- Zhang et al. (2014) Yuyu Zhang, Hanjun Dai, Chang Xu, Jun Feng, Taifeng Wang, Jiang Bian, Bin Wang, and Tie-Yan Liu. 2014. Sequential click prediction for sponsored search with recurrent neural networks. In Proceedings of the Twenty-Eighth AAAI Conference on Artificial Intelligence, pages 1369–1375.
- Zheng et al. (2019) Changmeng Zheng, Yi Cai, Jingyun Xu, Ho-fung Leung, and Guandong Xu. 2019. A boundary-aware neural model for nested named entity recognition. In Proceedings of the 2019 Conference on Empirical Methods in Natural Language Processing and the 9th International Joint Conference on Natural Language Processing, pages 357–366.
- Zhou et al. (2018) Guorui Zhou, Xiaoqiang Zhu, Chenru Song, Ying Fan, Han Zhu, Xiao Ma, Yanghui Yan, Junqi Jin, Han Li, and Kun Gai. 2018. Deep interest network for click-through rate prediction. In Proceedings of the 24th ACM SIGKDD International Conference on Knowledge Discovery & Data Mining, pages 1059–1068.
| Aspect labels | Description & Example | #spans | ||
| (1) | Special deals | Expressions representing special deals (e.g., Compare hotels and save money) | 343 | |
| (2) | Discount price | Specific discount rate or amount (e.g., Buy 1 get 1 50% off) | 120 | |
| (3) | Reward points | Customers can earn points (e.g., Use our app to earn points) | 85 | |
| (4) | Free | Free offer for products or services (e.g., Enjoy free shipping) | 430 | |
| (5) | Special gift | Special gifts or presents for customers (e.g., Join today and get a free brush set) | 126 | |
| (6) | Features | Features of services or products (e.g., Ergonomically designed to protect children) | 1,360 | |
| (7) | Quality | Top-quality or high-grade services (e.g., Find premium kitchen appliances) | 65 | |
| (8) | Problem solving | Solutions to customer problems (e.g., Get bright, clear skin) | 17 | |
| (9) | Speed | Speed of delivery and services (e.g., Fast & free shipping) | 142 | |
| (10) | User friendliness | Usability of services and products (e.g., Quick, simple, and easy to use ) | 337 | |
| (11) | Transportation | Convenience of transportation (e.g., Centrally located in the heart of Tokyo) | 89 | |
| (12) | Limited offers | Limited availability of services and products (e.g., Limited to 1,000 items per day) | 52 | |
| (13) | Limited-time offer | Offers available for a limited time only (e.g., Three days only at 20% off) | 61 | |
| (14) | Limited-target offer | Offers available for target customers only (e.g., Discount for members only) | 114 | |
| (15) | First-time limited offer | Limited offers for first-time customers (e.g., Take 15% off your first order) | 25 | |
| (16) | Track record | Track records of services or companies (e.g., 45M+ users worldwide) | 75 | |
| (17) | Largest/no. 1 | Largest/No. 1 products or services (e.g., Boston’s no. 1 hair salon) | 141 | |
| (18) | Product lineup | Wide range of products or stores (e.g., Large selection of hotels) | 258 | |
| (19) | Trend | Popularity or favorable reputation (e.g., Top trending shoes and boots) | 99 | |
| (20) | Others | Other advertising appeals (e.g., An experience like no other) | 182 | |
| (21) | Story | Synopsis of a movie or drama (e.g., After Peter Parker is bitten by a ) | 98 | |
| Aspect Detection Model | CTR Prediction Model | ||
| Span-based | Doc-based | ||
| Pre-trained model | bert-base-japanese-char | bert-base-japanese | bert-base-japanese |
| Number of heads | 12 | 12 | 12 |
| Number of hidden layers | 12 | 12 | 12 |
| Hidden layer size | 768 | 768 | 768 |
| Dropout probability | 0.1 | 0.1 | 0.1 |
| Vocab size | 4,000 | 32,000 | 32,000 |
| Batch size | 10 | 10 | 30 |
| Max sequence length | 512 | 512 | 512 |
| Number of epochs | 10 | 10 | 10 |
| Learning rate | |||
| Optimizer | Adam | Adam | Adamax |
| Loss | CRF loss, BCE loss | BCE loss | MSE loss |
| Industry | Title | Desc. | LP | Sub-total |
|---|---|---|---|---|
| EC | 131 | 314 | 87 | 532 |
| Others | 137 | 272 | 123 | 532 |
| Media | 119 | 250 | 27 | 396 |
| Finance | 105 | 203 | 56 | 364 |
| VOD&eBook | 38 | 112 | 78 | 228 |
| Cosmetics | 43 | 110 | 20 | 173 |
| Human resources | 72 | 75 | 8 | 155 |
| Education | 58 | 50 | 10 | 118 |
| Travel | 23 | 62 | 18 | 103 |
| Automobile | 18 | 32 | 5 | 55 |
| Entertainment | 14 | 36 | 3 | 53 |
| Real estate | 5 | 12 | 2 | 19 |
| Beauty&Health | 3 | 4 | 3 | 10 |
| Total | 766 | 1,532 | 440 | 2,738 |
| Industry | Train | Dev | Test |
|---|---|---|---|
| VOD&eBook | 30,536 | 3,823 | 3,812 |
| EC | 20,671 | 2,584 | 2,583 |
| Finance | 20,183 | 2,521 | 2,521 |
| Others | 15,526 | 1,936 | 1,936 |
| Human resources | 10,823 | 1,348 | 1,348 |
| Media | 10,434 | 1,295 | 1,274 |
| Education | 9,592 | 1,344 | 1,228 |
| Travel | 8,093 | 1,002 | 1,042 |
| Cosmetics | 5,584 | 231 | 232 |
| Entertainment | 2,455 | 0 | 0 |
| Automobile | 1,697 | 0 | 0 |
| Beauty&Health | 445 | 0 | 0 |
| Real estate | 313 | 0 | 0 |
| Total | 136,352 | 16,084 | 15,976 |
Appendix A Collected Ad Texts for Annotation
Table 7 lists the detailed statistics of the collected ad text. We collected 2,738 ad texts comprising 666 titles , 1,532 descriptions , and 440 LP contents from 13 industries: EC, Media, Finance, VOD&eBook, Cosmetics, Human resources, Education, Travel, Automobile, Entertainment, Real estate, and Beauty&Health.
Appendix B Descriptions and Examples of A3
Table 5 lists the detailed descriptions and examples of A3 that we have defined. For example, the expression “enjoy free shipping” is labeled with (4) free, as it represents free offers for products or services. In the table, “#spans” represents the number of span texts annotated with each label.
Appendix C Dataset for CTR Prediction
Table 8 lists the detailed statistics of the datasets used for CTR prediction. We carefully separated the dataset into 136,352, 16,084, and 15,976 samples for training, development, and testing, respectively. For correlation analysis between the CTR and aspect labels of advertising appeals, we used the training dataset for CTR prediction.
Appendix D Additional Implementation Details
Table 6 lists the implementation details, e.g., hyperparameters, for the aspect detection and CTR prediction models. We developed our models using pre-trained BERT models, which are publicly available from the Transformers library Wolf et al. (2020).888https://huggingface.co/cl-tohoku The framework is available under the Apache 2.0 license. We trained the models with a Tesla V100 GPU on the Google Cloud Platform, which is the cloud computing infrastructure. Moreover, we performed a hyperparameter search, using Optuna Akiba et al. (2019) with default parameters for the aspect detection models on the validation set. In the experiment, the hyperparameter search is limited to 30 trials. Therefore, we performed our experiments in a single run.
We used CRF and binary cross-entropy (BCE) loss for span detection and label prediction in the span-based model, respectively. We used the mean squared error (MSE) as an objective function to train the CTR prediction model. Furthermore, we applied an early stopping strategy to all the models. Specifically, we stopped training if there was no improvement in the validation loss after three consecutive epochs.