The Zeeman and hyperfine interactions of a single 167Er3+ ion in Si
Abstract
Er-doped Si is a promising candidate for quantum information applications due to its telecom wavelength optical transition and its compatibility with Si nanofabrication technologies. Recent spectroscopic studies based on photoluminescence excitation have shown multiple well-defined lattice sites that Er occupies in Si. Here we report the first measurement of the Zeeman and hyperfine tensors of a single 167Er3+ ion in Si. All the obtained tensors are highly anisotropic with the largest value principal axes aligning in nearly the same direction, and the trace of the lowest crystal field level -tensor is . The results indicate that this specific Er site is likely to be a distorted cubic site that exhibits monoclinic (C1) symmetry. Finally, zero first-order-Zeeman (ZEFOZ) fields are identified for this site and could be used to reduce decoherence of hyperfine spin states in future experiments.
I introduction
Er3+ ions have been widely used in classical optical devices and networks thanks to the 4I15/2-4I13/2 optical transition at telecom wavelength. Recent studies on Er3+ ions have demonstrated new prospects for quantum optics and quantum computing with direct optical access to telecom fibre networks and Si photonic cavities. Er3+ is particularly attractive for quantum applications because of the long coherence time available on hyperfine states. For example, hyperfine coherence time can exceed for Er3+ ions in Y2SiO5 [1]. Further enhancement can be achieved by utilising hyperfine transitions at a zero first-order-Zeeman (ZEFOZ) field that are protected from magnetic field fluctuations[2]. In addition, strong cavity coupling and coherent control of a single Er3+ ion have been demonstrated by combining a Si cavity with an Er-doped Y2SiO5 crystal[3, 4].
Si would be an obvious choice of host materials for Er3+ ions due to the well-established Si nanofabrication technologies. Also, the nuclear-spin free environment provided by isotopically purified 28Si can significantly suppress decoherence due to nuclear spins in the host crystal. One challenge is that Er3+ ions can form a range of sites in Si in contrast to only two crystallographic sites that Er3+ ions occupy in Y2SiO5 [5]. By choosing a suitable annealing condition and Er concentration, a cubic Er site can become the dominant site in float-zone (FZ) Si with low impurity levels[6]. The typical structure of its photoluminescence (PL) spectra includes an optical transition at between its lowest levels of the 4I15/2 and 4I13/2 states. While complex spectra appear in Er-doped Si under different annealing conditions or in the presence of other dopants or implantation induced defects[7], the spectral structure of this cubic site is still observable. Analysis of the fine structure suggests the Er3+ ion sees a tetrahedral crystal field[8, 6]. Also, existence of a tetrahedral interstitial Er site in Si was confirmed by emission channelling studies[9], although there was no direct experimental link between this result and the earlier measurements. These findings are in agreement with several theoretical studies that the tetrahedral interstitial site is the most stable site for Er in Si[10, 11, 12, 13], but other studies found a tetrahedral substitutional site[14, 15] to be more stable or a hexagonal interstitial site when oxygen is involved[14, 11].
The most direct evidence of a cubic site would be an isotropic Zeeman -tensor, but the -tensor of the cubic Er site in Si has not been determined due to the complex spectra and limited resolution from PL or electron paramagnetic resonance (EPR) measurements. Another characteristic property is the trace of the Z1 -tensor, where Z1 represents the lowest crystal field level of the 4I15/2 ground state. Crystal field levels of a cubic site can be either quartet states or doublet states of or , but only and Z1 levels have been experimentally identified in Er-doped crystals[16]. The trace of the Z1 -tensor for and is calculated to be and based on crystal field theory, and the measured values in two cubic crystals are on average and , respectively[16]. The small deviation from the calculated value is usually explained by interactions with higher-lying energy levels or the effects of covalency[17, 18]. Er3+ ions can also occupy a slightly distorted cubic site where the crystal field distortion is small compared to the cubic crystal field. As a result, the distortion on the trace of the Z1 -tensor is expected to be smaller than [18] and the cubic crystal field approximation is still valid[19].
| Device | Transitions (THz) | Note |
|---|---|---|
| 1 | 194.05, 195.03, 195.07, 196.02 | |
| 2 | 195.03 | |
| 3 | 195.04, 195.94 | |
| 4 | 195.04, 195.99 | The present work |
| 5 | 195.07 | |
| 6 | 195.12 | |
| 7 | 195.15 | |
| 8 | 195.35 | Ref.[20] |
Recent high-resolution photoluminescence excitation (PLE) measurements on Si waveguides[21, 22] and bulk Si[23] have both shown multiple well-defined Er sites. The inhomogeneous linewidths are of the order of , which is comparable to that of Er:Y2SiO5 3+, and some sites show homogeneous linewidths below . These studies reinforce the promise of Er in Si, but for applications where long coherence times are required, extensive studies of the Zeeman and hyperfine interactions of the Er sites in Si are also required. The Zeeman interaction defines the preferred magnetic field direction to suppress electron spin relaxation due to spin-lattice coupling. Further, hyperfine transitions at a ZEFOZ field are protected from magnetic field fluctuations and thus allow extended spin coherence times[24]. The Zeeman splitting can be observed for some Er sites using PLE, but the resolution is limited by the inhomogeneous linewidth and may be further limited by multiple site orientations[23].
The inhomogeneous broadening can be avoided by looking at only one ion. The hybrid electrical/optical single ion detection enables the high spectral resolution study of the Zeeman and hyperfine interactions on a single ion level[25, 26]. Recently, a time-resolved single ion detection technique was demonstrated[20] by detecting the ionisation of a single trap, as opposed to multiple traps in the previously used time-averaged measurements[25, 27]. The time-resolved detection has the advantage of allowing a wider range of experimental conditions and faster repetition of the single ion detection than the time-averaged detection[20]. While the earlier studies with time-averaged detection revealed a large number of optical transitions from [23], optical transitions at approximately are frequently observed in devices showing single trap ionisation, as shown in Table 1.
Here we investigate the Zeeman and hyperfine interactions of a single 167Er3+ ion in Si. This Er site has a zero field optical transition frequency of () which closely matches the previously reported cubic site in Si[6]. A spin Hamiltonian model is used to fit the spectra from field rotation measurements. The fitting gives the Zeeman interaction -tensors and the hyperfine interaction -tensors for the lowest crystal field level in the 4I15/2 manifold and a crystal field level in the 4I13/2 manifold of the 167Er3+ ion.
II Spin Hamiltonian model
Er forms a trivalent state in most semiconductors with a 4f11 electronic configuration. The telecom wavelength optical transitions arise from the 4I15/2 ground state multiplet and the 4I13/2 first optically excited state. Under the action of a crystal field, the degeneracy in these levels is partially or wholly lifted. For example, the 4I15/2 state splits into five levels for the special case of the cubic site and eight levels for low symmetry sites.
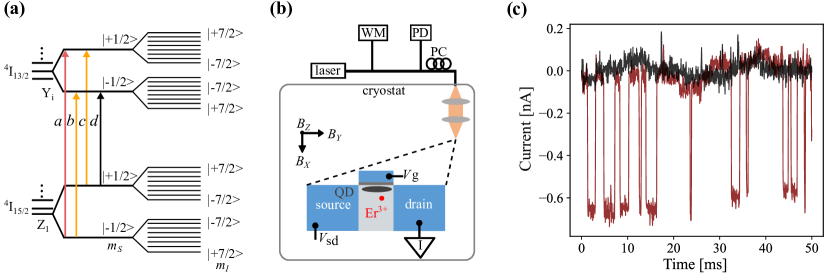
Figure 1(a) shows a generic energy level diagram of the low symmetry Er site investigated in this work. The crystal field levels of 4I15/2 (4I13/2) are labelled as Z1 up to Z8 (Y1 up to Y7) in order from the lowest energy to the highest. Each crystal field level has a two-fold electron spin degeneracy (Kramers doublet) which can be lifted by a magnetic field. For a 167Er3+ ion with a nuclear spin of , each crystal field doublet splits into 16 hyperfine sublevels. The Zeeman and hyperfine splittings of a crystal field level can typically be described in low field by a spin Hamiltonian, [28, 29, 5]
| (1) |
where is the external magnetic field, is an effective spin vector with , is a nuclear spin vector with a value of , , and are the Zeeman, hyperfine and quadrupole tensors, and are the Bohr and nuclear magneton, respectively, and 0.1618 is the nuclear factor.
At liquid helium temperatures, only the lowest crystal field level Z1 is populated, and optical transitions between Z1 and multiple crystal field levels Yi can be observed. When the electronic Zeeman splitting is much larger than the hyperfine splitting, the transitions between Z1 and Yi can be split into four transition groups a,b,c,d as shown in Fig. 1(a). The four transition groups are well separated in transition frequency, and each group contains eight hyperfine spin preserving peaks with . When the Zeeman splitting and hyperfine splitting become comparable, hyperfine sublevels from different Zeeman branches start to mix.
III setup and spectroscopy
The experimental setup and the device used in this work are illustrated in Fig. 1(b). The device was a Si fin-field-effect transistor (FinFET) consisting of three terminals and a nanowire channel ( width length height). 167Er and O were implanted into the device followed by a annealing to repair the implantation damage. The estimated concentration of Er and O in the channel is and , respectively. Additionally, the p-type channel had a B doping concentration of . The device was installed on the cold stage of a liquid helium-free cryostat operating at a base temperature of . The cryostat is equipped with a 6-1-1 superconducting vector magnet, which can provide a magnetic field up to in any direction. The device was placed at the centre of the magnet, and the field homogeneity is for the X and Y axes and 0.1% for the Z axis over a diameter of spherical volume.
A fibre-coupled frequency-tunable laser (Pure Photonics PPLC550) was used to excite the optical transitions. The laser light was split into two beams. One beam was sent to a photodetector (PD) and a wavemeter (WM) for power and wavelength monitoring. The specified repeatability of the wavemeter (Bristol 621A-NIR) is . The other beam went through a polarisation controller (PC) and optical fibres and reached the cold stage. The light was focused onto the device surface by a two-lens objective[30], and the spot size was approximately .
Single Er3+ ion spectra were measured with an optical-electrical hybrid method[25, 20]. The FinFET was biased under a sub-threshold gate voltage[31] so that single quantum dots (QDs) form in the device channel. These QDs can work as sensitive charge sensors and detect the loss or gain of a single electron in its vicinity. After the Er3+ ion was excited into the 4I13/2 excited state by resonant light, it would relax back to the 4I15/2 ground state via either a radiative process by photon emission or non-radiative processes.
Our previous studies have demonstrated that a non-radiative relaxation of an Er3+ ion can cause a nearby trap to ionise[20], and afterwards, the trap resets by capturing an electron. These processes can be seen from a typical current-time trace (red) in Fig. 1(c) measured under resonant illumination. The current through the QD switches between two discrete levels due to ionisation and reset events. In contrast, the black current-time trace was measured with a non-resonant laser frequency, and the current stays at the background level. The spectra presented in this work were measured under continuous wave laser excitation, and the spectral signal was defined as the number of ionisation events per unit time per unit power in a long current-time trace. In principle, a longer current-time trace gives a more accurate spectral signal at each frequency, and a finer frequency step size leads to more data points for the peak fitting, but both will lead to longer measurement times. Therefore, a trade-off was made between these two parameters, and a frequency step size of and a trace length of were used in this study.
IV Field rotation measurement
In order to determine the anisotropic spin Hamiltonian tensors, we used the vector magnet to apply fields along different directions while holding the field magnitude fixed at . For a low symmetry site, high anisotropy is expected for the -tensors, and resonant frequencies of the four transition groups vary considerably as the field rotates. Therefore, we started with a preliminary measurement to determine a simplified spin Hamiltonian with only the electronic Zeeman term, which can be used to identify a suitable laser frequency scanning range for each field direction. Firstly, the four transition groups were measured by rotating the field in a circle within the three orthogonal planes (,,) of the laboratory frame. Secondly, spectral scans were performed in high magnetic fields along the axis to identify the ground electron spin level of Z1 and to assign the a,b,c,d optical transition groups to the corresponding Z1 and Yi electron spin levels. Finally, the fitting results gave the Z1 and Yi -tensors, and both turned out to be highly anisotropic with similar orientation.
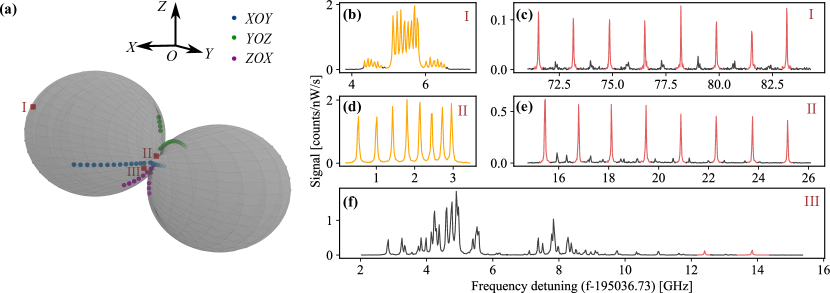
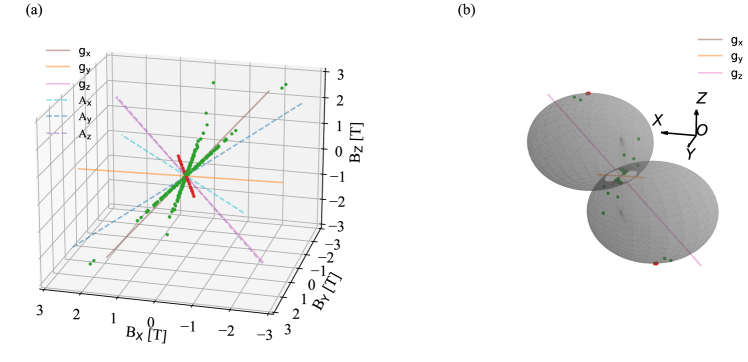
The preliminary -tensors were then used to select the directions for the field rotation measurement. The peanut shape contour in Fig. 2(a) shows the Zeeman splitting amplitudes of the Z1 level when the magnetic field is along different directions, and the coloured dots on the contour surface denote a subset of the selected field directions while the full set can be found in the supplemental Figure 1. Each dot indicates a magnetic field vector direction from the origin to the dot, and its colour is used to highlight different groups of directions and its brightness comes from the 3D lighting effect.
To help the understanding of the field direction selection strategy, three sets of spectra are shown as examples in Figs. 2(b)-(f). Only the spectral peaks that can be properly assigned to energy levels and show good peak contrast were used for the final spin Hamiltonian fitting, such as the orange and red spectral peaks in Figs. 2(b)-(f). Multi-peak fitting with Lorentzian functions was used to determine the peak positions. The full width at half maximum (FWHM) of the isolated peaks was approximately [32]. Since the spectra were measure with a finite step size of , the apparent peak heights in Figs. 2(b)-(f) show arbitrary fluctuations and the highest points do not necessarily correspond to the fitted peak heights or centre frequencies.
The two ends of the peanut shape contour in Fig. 2a correspond to the principal axis of the -tensor with the largest value, defined as . A typical set of spectra in this region is shown in Figs. 2(b),(c), and its field direction is denoted by the red square I in Fig. 2(a). Specifically, Fig. 2(b) shows the transition group b which comprises eight strong hyperfine peaks corresponding to =0 in the central region and two sets of seven weaker hyperfine peaks corresponding to in the two side regions. Figure. 2(c) shows the transition group a with a lower overall signal than group b. Group a also consists of eight stronger =0 peaks, but the weaker peaks distribute between the =0 peaks. These features show up similarly when the magnetic field points in most directions except the waist region of the peanut shape contour, where the two transverse principal axes lie, with smaller values, defined as and . In this “transverse” field region, the Zeeman splitting becomes comparable to the hyperfine splitting. Some and =0 hyperfine peaks start to overlap, and some peaks become stronger due to the mixing of spin states. These phenomena can be seen from the spectra II and III in Fig. 2(d)-(f), and the field directions are denoted by the red squares II and III in Fig. 2(a), respectively.
In total, 181 different field directions were selected into two categories. One category covers the entire space as the magnetic field follows a three-dimensional (3D) spiral path. These field directions can be seen in the supplemental Figure 1, and three of them are denoted by the red squares in Fig. 2(a). The other category focuses on the transverse field region with three field rotational scans within the three orthogonal planes (,,) of the laboratory frame, as indicated by the blue, green, and purple dots in Fig. 2(a). The spectral information in this region is critical for improving the fitting accuracy of the smaller values in the Zeeman and hyperfine tensors. Due to the level mixing and anti-crossing in this region, intensities of transitions become equivalent and hyperfine peaks are unevenly spaced, as can be seen in spectra II, III[28].
V Spin Hamiltonian fitting
Using the method described above, 5788 hyperfine transition peaks were identified from the 181 spectral scans and were used for the spin Hamiltonian fitting. For a low symmetry Er site, the principal axes of the - and -tensors of different crystal field levels may deviate from each other. Therefore, each tensor has six independent variables, i.e., three principal values and three Euler angles. Euler rotations followed a sequence. A diagonal matrix defined in the coordinate system of the principal axes can be transformed to a matrix defined in the laboratory frame by the following relation:
| (2) |
where , and represents a rotation matrix of an angle (, or ) about the axis . Here are the new axes after the first and second rotations.
In principle, the quadrupole interaction term can be determined by the field rotation Zeeman experiment. However, its most significant impact on the identifiable spectral peaks was found to be smaller than . This impact could not be measured accurately due to the repeatability of the wavemeter. Therefore, the quadrupole interaction term was not included in the fitting. The final spin Hamiltonian model includes 12 free parameters for each of the Z1 and Yi levels and another free parameter for the optical transition frequency. The Hamiltonian fitting used a global optimisation technique, basin-hopping, to minimise the root-mean-square deviation () calculated from the residuals as follows:
| (3) |
where and are the simulated and measured centre frequency of spectral peak , and is the total number of peaks in the fitting.
| Principal values | Euler angles | |
|---|---|---|
| 6.86 | ||
| 47 | ||
| 0.11 | ||
| 0.11 | ||
| 25 | ||
| 0.023 | 6.57 | |
| 7.5 | ||
| 55 |
The fitting gives a value of and the fitting parameters are listed in Table 2. All four tensors are highly anisotropic, with one principal value () much larger than the other two ( and ), consistent with low site symmetry. The misalignment between the Z1 and Yi -tensors indicates that the Er site has monoclinic (C1) symmetry.
The previously reported cubic Er site in Si has an optical transition frequency of [6], which closely matches the C1 Er site in the present work. Also, the trace of Z1 -tensor is , which matches the expected value for a Z1 state. This match reveals that the cubic crystal field approximation holds for this C1 Er site in Si[18, 19]. Overall, these properties suggest that this C1 Er site is likely to be a distorted cubic site.
Parameter uncertainties in Table 2 are calculated using the Markov chain Monte Carlo sampling method. The four tensors’ largest principal values (, ) have smaller uncertainties than the transverse principal values (, , , ) due to the challenges associated with the high anisotropy of the tensors. Firstly, the electron spin quantization axis remains close to the direction for a wide range of field directions as a result of the high anisotropy of the -tensor, except in the transverse field region. This means that the transverse field region is critical for determining the transverse principal values, and ; however, only a limited number of spectral peaks can be identified in this region due to spin mixing. Secondly, the hyperfine splitting is similarly impacted by the high anisotropy of both and -tensors, as it is primarily determined by [5]. Overall, the uncertainties may be underestimated because of the large number of fitting parameters[5]. In addition, the final position of the device may change slightly during cool-down due to thermal expansion and contraction, and consequently, the actual magnetic field at the Er3+ ion might deviate from the set field especially for and axes because of the field inhomogeneity.
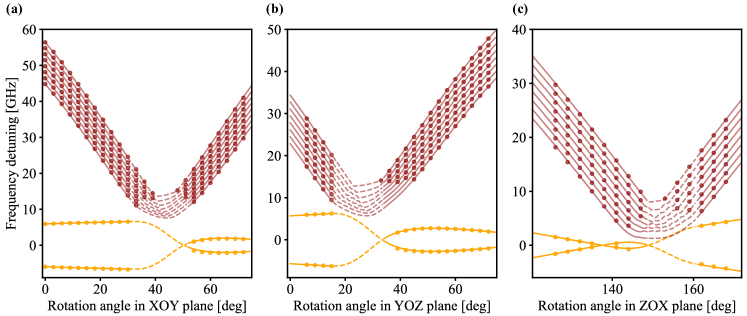
To evaluate the fitting in the transverse field region, measured and calculated spectral peak positions of groups a,b,c from the three in-plane field rotation scans are presented in Fig. 3. The eight red spectral lines in the upper sections of Figs. 3(a)-(c) correspond to the eight calculated hyperfine transitions of group a, and the red dots represent the measured peaks that can be identified and were used for fitting. The spacing between adjacent hyperfine peaks in groups b and c is much smaller than group a. For clarity, then, only the fourth lowest energy transition among the eight hyperfine transitions of group b (and c) is plotted in Fig. 3, and the orange dots and lines represent the measured and calculated peak positions, respectively.
In the region where electronic and hyperfine spins are highly mixed, spectral peaks are generated between sorted hyperfine levels in the Z1 and Yi states similar to hyperfine transitions outside this region. Due to state mixing, these calculated transitions may become weaker in the anti-crossing region, so dashed lines are used in this region.
The four tensors have very similar and Euler angles, which determine the direction of the principal axes of the four tensors. The similarly orientated - and -tensors lead to nearly identical hyperfine spectra outside the transverse field region, similar to spectrum I in Fig. 2(b). This phenomenon can also be seen from the left parts of Figs. 3(a),(c), even though the three scans in Fig. 3 focus on the transverse field region.
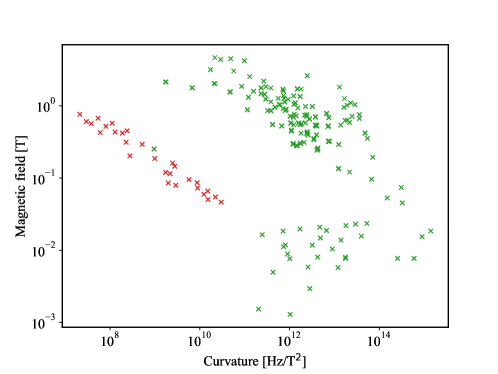
In order to locate the ZEFOZ fields for the 167Er3+ ion, we follow the calculation procedures described in Ref.[24] using the fitting results. The hyperfine spin transitions between any any two of the sixteen hyperfine sublevels of Z1 are considered in the calculation. The curvatures at all ZEFOZ fields are calculated and plotted into two groups (red and green) in Fig. 4. The red group contains field directions close to the largest value principal axis of the Z1 tensor. This is a weakly mixed regime, where the electronic Zeeman term dominates, and the electron spin is close to a good quantum number. ZEFOZ fields of the green group are either in the transverse field region of the peanut shape contour or so weak that the electronic Zeeman splitting is smaller than or comparable to the hyperfine splittings. Due to the state mixing, ZEFOZ transitions in this strongly mixed regime tend to have stronger transition strengths than those in the weakly mixed regime. Furthermore, these ZEFOZ fields cluster around particular directions, as shown in Fig. 5.
The decoherence rate induced by magnetic noise at ZEFOZ fields can be estimated as , where is the curvature of ZEFOZ transition and is the magnetic field fluctuation. To give an estimation on the decoherence, we consider an experimental condition of sub-Kelvin temperatures and magnetic fields, which can be provided in commercial vector magnet cryogenic systems. The magnetic field fluctuations experienced by 167Er3+ ions in natural Si are dominantly due to the flipping of nearby 29Si nuclear spins and other Er3+ electron spins. From Monte Carlo simulations[33], for an Er doping concentration of in natural Si is dominated by the flipping of 29Si nuclear spins and is estimated to be . The results suggest that 167Er3+ spin coherence times in ZEFOZ fields of about in natural Si can potentially reach in the strongly mixed regime and in the weakly mixed regime. The estimation is indicative, and decoherence suppression is also expected from the frozen core effect[34, 35, 1], as the moderate field and low temperature considered here can freeze most electron spins in the crystal.
VI Conclusion
We investigated the Zeeman and hyperfine interactions of the lowest crystal field level Z1 in the 4I15/2 manifold and a crystal field level Yi in the 4I13/2 manifold for a single 167Er3+ ion in Si. The hyperfine spectra were measured in different magnetic field directions, and the identified peak frequencies were used to fit both the Z1 and Yi spin Hamiltonians. All four tensors in the spin Hamiltonians are highly anisotropic, with the largest value principal axes in nearly the same direction. The results suggest that the Er3+ ion occupies a distorted cubic site with monoclinic (C1) symmetry. The ZEFOZ fields calculations for this site suggests 167Er3+ spin coherence times above could be achieved at ZEFOZ fields of about in natural Si.
The accuracy of the spin Hamiltonian parameters could be improved by introducing an on-chip magnetic field sensor. On the other hand, the high anisotropy of the specific Er site leads to larger uncertainties in the transverse properties of the tensors and, consequently, in the transverse ZEFOZ fields. Smaller fitting uncertainties are expected on cubic or other higher symmetry sites, which can be investigated using the field rotation Zeeman method presented in this work.
Acknowledgements.
The numerical calculations for locating the ZEFOZ fields were performed on the supercomputing system in the Supercomputing Center of University of Science and Technology of China. This work was supported by the National Key R&D Program of China (Grant No. 2018YFA0306600), Anhui Initiative in Quantum Information Technologies (Grant No. AHY050000), and Anhui Provincial Natural Science Foundation (Grant No. 2108085MA15). We acknowledge the AFAiiR node of the NCRIS Heavy Ion Capability for access to ion-implantation facilities.Data Availability
The data that support the findings of this study are available from the corresponding author upon reasonable request.
References
- Rančić et al. [2018] M. Rančić, M. P. Hedges, R. L. Ahlefeldt, and M. J. Sellars, Coherence time of over a second in a telecom-compatible quantum memory storage material, Nature Physics 14, 50 (2018).
- Zhong et al. [2015] M. Zhong, M. P. Hedges, R. L. Ahlefeldt, J. G. Bartholomew, S. E. Beavan, S. M. Wittig, J. J. Longdell, and M. J. Sellars, Optically addressable nuclear spins in a solid with a six-hour coherence time, Nature 517, 177 (2015).
- Dibos et al. [2018] A. M. Dibos, M. Raha, C. M. Phenicie, and J. D. Thompson, Atomic Source of Single Photons in the Telecom Band, Physical Review Letters 120, 243601 (2018).
- Chen et al. [2020] S. Chen, M. Raha, C. M. Phenicie, S. Ourari, and J. D. Thompson, Parallel single-shot measurement and coherent control of solid-state spins below the diffraction limit, Science 370, 592 (2020).
- Chen et al. [2018] Y.-H. Chen, X. Fernandez-Gonzalvo, S. P. Horvath, J. V. Rakonjac, and J. J. Longdell, Hyperfine interactions of ions in : Electron paramagnetic resonance in a tunable microwave cavity, Physical Review B 97, 024419 (2018).
- Przybylinska et al. [1996] H. Przybylinska, W. Jantsch, Y. Suprun-Belevitch, M. Stepikhova, L. Palmetshofer, G. Hendorfer, A. Kozanecki, R. J. Wilson, and B. J. Sealy, Optically active erbium centers in silicon, Physical Review B 54, 2532 (1996).
- Przybylinska et al. [1995] H. Przybylinska, G. Hendorfer, M. Bruckner, L. Palmetshofer, and W. Jantsch, On the local structure of optically active Er centers in Si, Applied Physics Letters 66, 490 (1995).
- Tang et al. [1989] Y. S. Tang, K. C. Heasman, W. P. Gillin, and B. J. Sealy, Characteristics of rare‐earth element erbium implanted in silicon, Applied Physics Letters 55, 432 (1989).
- Wahl et al. [1997] U. Wahl, A. Vantomme, J. De Wachter, R. Moons, G. Langouche, J. G. Marques, J. G. Correia, and ISOLDE collaboration, Direct evidence for tetrahedral interstitial Er in Si, Physical Review Letters 79, 2069 (1997).
- Needels et al. [1993] M. Needels, M. Schlüter, and M. Lannoo, Erbium point defects in silicon, Physical Review B 47, 15533 (1993).
- Wan et al. [1998] J. Wan, Y. Ling, Q. Sun, and X. Wang, Role of codopant oxygen in erbium-doped silicon, Physical Review B 58, 10415 (1998).
- Hashimoto et al. [2001] M. Hashimoto, A. Yanase, H. Harima, and H. Katayama-Yoshida, Detemination of the atomic configuration of Er–O complexes in silicon by the super-cell FLAPW method, Physica B: Condensed Matter 308-310, 378 (2001).
- Prezzi et al. [2005] D. Prezzi, T. A. G. Eberlein, R. Jones, J. S. Filhol, J. Coutinho, M. J. Shaw, and P. R. Briddon, Electrical activity of Er and Er-O centers in silicon, Physical Review B 71, 245203 (2005).
- Raffa and Ballone [2002] A. G. Raffa and P. Ballone, Equilibrium structure of erbium-oxygen complexes in crystalline silicon, Physical Review B 65, 121309(R) (2002).
- Delerue and Lannoo [1991] C. Delerue and M. Lannoo, Description of the trends for rare-earth impurities in semiconductors, Physical Review Letters 67, 3006 (1991).
- Ammerlaan and de Maat-Gersdorf [2001] C. A. J. Ammerlaan and I. de Maat-Gersdorf, Zeeman splitting factor of the ion in a crystal field, Applied Magnetic Resonance 21, 13 (2001).
- Watts and Holton [1968] R. K. Watts and W. C. Holton, Paramagnetic-Resonance Studies of Rare-Earth Impurities in II-VI Compounds, Physical Review 173, 417 (1968).
- Carey et al. [1999] J. D. Carey, R. C. Barklie, J. F. Donegan, F. Priolo, G. Franzò, and S. Coffa, Electron paramagnetic resonance and photoluminescence study of Er-impurity complexes in Si, Phys. Rev. B 59, 2773 (1999).
- Carey [2009] J. D. Carey, State mixing and the cubic crystal field approximation for rare earth ions: the case of the Er ion in axial crystal fields, Journal of Physics: Condensed Matter 21, 175601 (2009).
- Hu et al. [2022] G. Hu, G. G. de Boo, B. C. Johnson, J. C. McCallum, M. J. Sellars, C. Yin, and S. Rogge, Time-Resolved Photoionization Detection of a Single Er Ion in Silicon, Nano Lett. 22, 396 (2022).
- Weiss et al. [2021] L. Weiss, A. Gritsch, B. Merkel, and A. Reiserer, Erbium dopants in nanophotonic silicon waveguides, Optica 8, 40 (2021).
- Gritsch et al. [2021] A. Gritsch, L. Weiss, J. Früh, S. Rinner, and A. Reiserer, Narrow optical transitions in erbium-implanted silicon waveguides, arXiv:2108.05120 (2021).
- Berkman et al. [2021] I. Berkman, A. Lyasota, G. de Boo, J. Bartholomew, B. Johnson, J. Mccallum, B.-B. Xu, S. Xie, R. Ahlefeldt, M. Sellars, C. Yin, and S. Rogge, Sub-megahertz homogeneous linewidth for er in si via in situ single photon detection, arXiv:2108.07090 (2021).
- McAuslan et al. [2012] D. L. McAuslan, J. G. Bartholomew, M. J. Sellars, and J. J. Longdell, Reducing decoherence in optical and spin transitions in rare-earth-metal-ion–doped materials, Phys. Rev. A 85, 032339 (2012).
- Yin et al. [2013] C. Yin, M. Rancic, G. G. de Boo, N. Stavrias, J. C. McCallum, M. J. Sellars, and S. Rogge, Optical addressing of an individual erbium ion in silicon, Nature 497, 91 (2013).
- de Boo et al. [2020] G. G. de Boo, C. Yin, M. Rančić, B. C. Johnson, J. C. McCallum, M. J. Sellars, and S. Rogge, High-resolution spectroscopy of individual erbium ions in strong magnetic fields, Physical Review B 102, 155309 (2020).
- Zhang et al. [2019] Q. Zhang, G. Hu, G. G. de Boo, M. Rančić, B. C. Johnson, J. C. McCallum, J. Du, M. J. Sellars, C. Yin, and S. Rogge, Single Rare-Earth Ions as Atomic-Scale Probes in Ultrascaled Transistors, Nano Letters 19, 5025 (2019).
- Guillot-Noël et al. [2006] O. Guillot-Noël, P. Goldner, Y. L. Du, E. Baldit, P. Monnier, and K. Bencheikh, Hyperfine interaction of ions in : An electron paramagnetic resonance spectroscopy study, Physical Review B 74, 214409 (2006).
- Horvath et al. [2019] S. P. Horvath, J. V. Rakonjac, Y.-H. Chen, J. J. Longdell, P. Goldner, J.-P. R. Wells, and M. F. Reid, Extending phenomenological crystal-field methods to point-group symmetry: Characterization of the optically excited hyperfine structure of , Phys. Rev. Lett. 123, 057401 (2019).
- Högele et al. [2008] A. Högele, S. Seidl, M. Kroner, K. Karrai, C. Schulhauser, O. Sqalli, J. Scrimgeour, and R. J. Warburton, Fiber-based confocal microscope for cryogenic spectroscopy, Review of Scientific Instruments 79, 023709 (2008).
- Sellier et al. [2007] H. Sellier, G. P. Lansbergen, J. Caro, S. Rogge, N. Collaert, I. Ferain, M. Jurczak, and S. Biesemans, Subthreshold channels at the edges of nanoscale triple-gate silicon transistors, Applied Physics Letters 90, 073502 (2007).
- Yang et al. [2022] J. Yang, J. Wang, W. Fan, Y. Zhang, C. Duan, G. Hu, G. G. de Boo, B. C. Johnson, J. C. McCallum, S. Rogge, C. Yin, and J. Du, Spectral broadening of a single ion in a Si nano-transistor, arXiv:2201.11472 (2022).
- Fraval [2005] E. Fraval, Minimising the Decoherence of Rare Earth Ion Solid State Spin Qubits, Ph.D. thesis, Research School of Physical Sciences and Engineering and The Australian National University (2005).
- Bottger et al. [2006] T. Bottger, C. W. Thiel, Y. Sun, and R. L. Cone, Optical decoherence and spectral diffusion at m in Er3+:Y2SiO5 versus magnetic field, temperature, and Er3+ concentration, Phys. Rev. B 73, 075101 (2006).
- Guillot-Noël et al. [2007] O. Guillot-Noël, H. Vezin, P. Goldner, F. Beaudoux, J. Vincent, J. Lejay, and I. Lorgeré, Direct observation of rare-earth-host interactions in , Physical Review B 76, 180408(R) (2007).