Subscriptions and external links help drive resentful users to alternative and extremist YouTube channels
Abstract
Do online platforms facilitate the consumption of potentially harmful content? Using paired behavioral and survey data provided by participants recruited from a representative sample in 2020 (n=1,181), we show that exposure to alternative and extremist channel videos on YouTube is heavily concentrated among a small group of people with high prior levels of gender and racial resentment. These viewers often subscribe to these channels (prompting recommendations to their videos) and follow external links to them. In contrast, non-subscribers rarely see or follow recommendations to videos from these channels. Our findings suggest YouTube’s algorithms were not sending people down “rabbit holes” during our observation window in 2020, possibly due to changes that the company made to its recommender system in 2019. However, the platform continues to play a key role in facilitating exposure to content from alternative and extremist channels among dedicated audiences.
125-character teaser
Exposure to extremist YouTube channels is driven by resentful users seeking out this content, not algorithmic recommendations
Introduction
What role do technology platforms play in exposing people to dubious and hateful information and enabling its spread? Concerns have grown in recent years that online communication is exacerbating the human tendency to engage in preferential exposure to congenial information (1, 2, 3). Such concerns are particularly acute on social media, where people may be especially likely to view content about topics such as politics and health that is false, extremist, or otherwise potentially harmful. The use of algorithmic recommendations and platform affordances such as following and subscribing features may enable this process by helping people to find potentially harmful content and helping content creators build and monetize an audience for it.
These concerns are particularly pronounced for YouTube, the most widely used social media platform in the U.S. (4). Critics highlight the popularity of extreme and harmful content such as videos by white nationalists on YouTube, which they often attribute to the recommendation system that the company itself says is responsible for 70 percent of user watch time (5). Many fear that these algorithmic recommendations are an engine for radicalization. For instance, the sociologist Zeynep Tufecki wrote that the YouTube recommendation system “may be one of the most powerful radicalizing instruments of the 21st century” (6). These claims seem to be supported by reports that feature descriptions of recommendations to potentially harmful videos and accounts of people whose lives were upended by content they encountered online (7, 8, 9).
YouTube subsequently announced changes in 2019 to “reduce the spread of content that comes close to—but doesn’t quite cross the line of—violating our Community Guidelines” (10). It claimed that these interventions resulted in a 50% drop in watch time from recommendations for “borderline content and harmful misinformation” (11) and a 70% decline in watch time from non-subscribed recommendations (12). However, these claims have not been independently evaluated using behavioral data, nor have the implications or caveats of “non-subscribed recommendations” been sufficiently explored.
In general, questions remain about the size and composition of the audience for potentially harmful videos on YouTube following these changes, the manner in which people reach those videos, and the role of the recommendation system in that process. Studies show that sites like Twitter and Facebook can amplify tendencies toward extreme opinions or spread false information (13, 14), though the extent of these effects and the prevalence of exposure is often overstated (15, 16, 17). YouTube may operate differently, though, given its focus on video and the central role of its recommendation system (18, 19). Browsing data has documented the existence of a sizeable audience of dedicated far-right news consumers on YouTube who often reach extremist videos via external links (20), but these data lack information on the recommendations shown to users by YouTube or the channels the users follow (a key source of recommendations). Random walk simulations conducted during and after 2019 found that problematic content was reachable, but its prevalence in recommendations fell during this period (21). Research conducted after 2019 found that watching videos promoting misinformation still led to recommendations of similar videos on some topics, though their overall prevalence among recommendations was low (22, 23, 24, 25). We build on these studies, seeking to determine the extent to which YouTube’s goal of “reduc[ing] recommendations of borderline content and harmful misinformation” has been met using a novel measurement approach (12).
This study advances scientific understanding of the audience for potentially harmful content on YouTube and the manner in which people are exposed to it. We pair individual-level viewer histories and the associated video recommendations shown with survey data from a sample of 1,181 US respondents who were weighted to resemble the US adult population on key demographic traits. This research design allows us to examine the association between demographic and attitudinal variables, especially gender and racial resentment, and YouTube consumption behavior. Using these data, we address three limitations of prior research in the field. First, prior work has not taken YouTube users’ channel subscriptions into account, a key indicator of user demand for specific types of content as well as a major factor in what recommendations are shown to users. We address this point by inferring the channels that our participants subscribe to and stratifying our analysis of recommendations along this axis. Second, existing work has either relied on data from controlled experiments and random walks—which lack ecological validity—or browsing histories that lack data on video recommendations. Our dataset offers the ecological validity that comes from directly observing user behavior on YouTube, providing the first direct evidence of the extent to which real-world algorithmic recommendations push people toward potentially harmful content. Third, prior fears about the frequency of “rabbit holes” are based on anecdotes and lack a precise definition. We address this problem by constructing a specific set of rules to define a “rabbit hole” event. This definition builds on and reaffirms prior work (26, 21, 24, 25), and we applied it to our dataset to measure the prevalence of radicalization rabbit holes among U.S. YouTube users in 2020.
Our sample of 1,181 participants is recruited from a sample of 4,000 YouGov panelists, including oversamples of two groups who we identified as especially likely to be exposed to potentially harmful video content: (1) people who previously expressed high levels of gender and/or racial resentment and (2) those who indicated they used YouTube frequently. Participants voluntarily agreed to install a custom browser extension in Chrome or Firefox that monitored their web browsing behavior. The study was conducted from July 21–December 31, 2020 (i.e., after the 2019 changes to YouTube’s algorithm); respondents were enrolled in data collection for a median of 133 days. (See Methods below for further details on measurement. We provide descriptive statistics on study participants and their browser activity data availability and aggregate consumption patterns in the Supplementary Material [SM].)
We report two key findings. First, we replicate findings from Hosseinmardi et al. (20) concerning the overall size of the audience for alternative and extreme content and enhance their validity by examining participant’s attitudinal variables. Though almost all participants use YouTube, videos from alternative and extremist channels are overwhelmingly watched by a small minority of participants with high levels of gender and racial resentment. Within this group, total viewership is heavily concentrated among a few individuals, a common finding among studies examining potentially harmful online content (27). Like prior work (20), we observe that viewers often reach these videos via external links (e.g., from other social media platforms). Additionally, we find that viewers are often subscribers to the channels in question. These findings relative to existing work demonstrate the robustness of our study. They also highlight that YouTube remains a key hosting provider for alternative and extremist channels, which reinforces concerns about lax content moderation on the platform (28) and enables these content creators to continue profiting from their audience (29, 30).
Second, we investigate the prevalence of “rabbit holes” in YouTube’s recommendations during Fall 2020. We rarely observe recommendations to alternative or extremist channel videos being shown to, or followed by, non-subscribers. During our study period, only 3% of participants who were not already subscribed to alternative or extremist channels viewed a video from one of these channels based on a recommendation. On one hand, this finding suggests that unsolicited exposure to potentially harmful content on YouTube in the post-2019 era is rare, in line with findings from prior work (24, 25). On the other hand, even low levels of algorithmic amplification can have damaging consequences when extrapolated over YouTube’s vast user base and across time (20). Further, it may be the case that the susceptible population was already radicalized during YouTube’s pre-2019 era. Finally, given the limitations of our study, our results must be interpreted as a lower bound on “rabbit hole” events, which suggests that YouTube may still need to do more to remove “borderline” content from recommendations.
Materials and Methods
Study participants
Study participants completed a public opinion survey and installed a browser extension that recorded their browser activity (=1,181). Specifically, we contracted with the survey company YouGov to conduct a public opinion survey with 4,000 respondents from three distinct populations: a nationally representative sample of 2,000 respondents who previously took part in the 2018 Cooperative Congressional Election Survey (CCES) when it was fielded by YouGov; an oversample of 1,000 respondents who expressed high levels of racial resentment (31), hostile sexism (32), and denial of institutional racism (33) in their responses to the 2018 CCES; and an oversample of 1,000 respondents who did not take part in the 2018 CCES but indicated that they use YouTube “several times per day” or “almost constantly” in their survey response. (The prior measures of racial resentment and hostile sexism, which were collected as part of the 2018 CCES for 3,000 of our 4,000 respondents, are also used as independent variables in our analysis; see below for details on question wording.)
While completing the survey, participants who used an eligible browser (Chrome or Firefox) were offered the opportunity to download a browser extension that would record their browser activity in exchange for additional compensation. A total of 1,181 respondents did so (778 from the nationally representative sample, 97 from the high resentment oversample, and 306 from the high YouTube user oversample).
All analyses we report below use survey weights created by YouGov to account for the fact that, in addition to a national sample, we have also specifically recruited participants who fall into one of two oversample groups: (1) those who previously expressed gender and/or racial resentment, or (2) those who are frequent YouTube users. When we apply these weights to all three samples, the total sample is weighted to be nationally representative. Applying these weights to the subset of participants who installed the browser extension helps us to best approximate the characteristics of a nationally representative sample, though the sample is of course not fully representative of the US adult population. We therefore report weighted estimates of the number of users or cases of a behavior as well as weighted percentages or proportions for maximum clarity. Additional details about respondent demographics and other characteristics are provided in the SM.
Ethics and privacy
Our study methods were approved by the Institutional Review Boards (IRBs) at the authors’ respective institutions (Dartmouth CPHS STUDY00032001, Northeastern IRB #20-03-04, and University of Exeter Social Sciences and International Studies Ethics Committee #201920-111).
All participants were asked to consent to data collection before completing our survey and again when they installed our browser extension. Participants were fully informed about the data collected by our extension when they were invited to install it and again during installation of the extension. The extension did not collect any data until consent was provided and participants were free to opt out at any time by uninstalling our extension. The extension automatically uninstalled itself from participants’ browsers at the end of the study period. (See the SM for the full text of our informed consent notices.)
To protect participants’ security and privacy, we adopted a number of best practices. Our participants are indexed by pseudonymous identifiers. Our browser extension used TLS to encrypt collected data while it was in transit. All participant data is stored on servers that are physically secured by key cards. We use standard remote access tools like SSH to access participant data securely.
We have posted data and code on Dataverse that allows for the replication of all results in this article (linked in the "Data availability" section). All analysis code has also been posted. However, raw behavior data cannot be posted publicly to protect the privacy of respondents.
Data collection and measurement
The browser extension passively logged user page views, including the full URL and a timestamp, and collected HTML snapshots when users viewed YouTube videos, allowing us to examine the video recommendations that participants received. This combination of passive monitoring and HTML snapshots provides us with the ability to measure not just what respondents watched but also what YouTube showed them prior to that action. To account for duplicate data, we dropped additional page views of the same URL within one second of the prior page view on the assumption that the user refreshed the page (34).
Our data collection approach focuses on browser activity data, which provides important advantages relative to the history data that is provided by the web browser’s WebExtension API. The browser APIs report the time when a given web page was first opened and the time when a user makes a transition from that page to another page (e.g., by clicking a link). However, the APIs do not report the total dwell time on a given web page taking into account changes in the active browser tab. For example, if someone opens web page in a tab, then opens web page in another tab, and then switches their browser tab back to , the browser history APIs will not register this shift in attention, making it difficult to obtain accurate estimates of time spent on a given web page. Our passive monitoring records all changes in the active tab, allowing us to overcome this issue. (In the SM, we validate our browser activity data against browser history data from the extension.)
In this article, we describe YouTube “views,” “consumption,” and “exposure” using the browser activity data described above. As with any passive behavioral data, we cannot verify that every user saw the content that appeared on their device in every instance.
We measured the amount of time a user spent on a given web page by calculating the difference between the timestamp of the page in question and the next one they viewed. This measure is imperfect because we do not have a measure of eye gaze or a proxy for active viewing. Though some participants might rewind and rewatch videos more than once, we are more concerned about our measure overstating watch time due to users leaving their browser idling. We therefore refine this measure by capping our measure of time spent at the length of the video in question (obtained from the YouTube API).
We measure which channels users subscribed to by extracting additional information from the HTML snapshots of the videos they watched. Specifically, we parsed the subscribe button from each HTML snapshot, which reads “Subscribe” when the participant was not subscribed to the video channel at the time the video was watched and “Subscribed” when they were already subscribed. Because we must use this indirect method to infer channel subscriptions, we do not know the full set of channels to which participants subscribe. In particular, not all recommended videos in our dataset were viewed by participants. As a result, we could not determine the subscription status for all recommended videos.
We denote the web page that a participant viewed immediately prior to viewing a YouTube video as the “referrer.” We are unable to measure HTTP Referrer headers using our browser extension, so instead we rely on browser activity data to identify referrers to YouTube videos. Using prior browsing history is a common proxy used to analyze people’s behavior on the web (35, 36).
All analyses of the percentage of recommendations seen or followed are based on the full set of recommendations that we could extract from each video. The mean number of recommended videos captured was 17.9 and the median was 20, which aligns with the default number of recommendations shown on a YouTube video (20) at the time our study was conducted.
Channel definitions and measurement
Following studies of information consumption online that rely on ratings of content quality at the domain level (37, 35), we construct a typology of YouTube channel types to measure participant exposure. Given that YouTube has tens of millions of channels and that the types of content we are interested in a relatively rare, it is necessary to rely on the judgement of experts to help us identify alternative, extremist, and mainstream media channels. We use the resulting channel lists to classify all videos to which our participants are exposed as coming from an alternative channel, an extremist channel, a mainstream media channel, or some other type of channel (“other”). The process by which these channel lists are described further below; the SM provides more detail on the procedures used by these experts to label channels.
In our typology, alternative channels discuss controversial topics through a lens that attempts to legitimize discredited views by casting them as marginalized viewpoints (despite the channel owners often identifying as White and/or male). Our list combines the 223 channels classified by Ledwich and Zaitsev (26) as Men’s Rights Activists or Anti-Social Justice Warriors, the 141 Intellectual Dark Web and Alt-lite channels from Ribeiro et al. (24), and the 24 channels from Lewis’ Alternative Influence Network (38). After removing duplicates, our alternative channel list contains 322 channels, of which 68 appeared on two source lists, and nine appeared on three. Example alternative channels in our typology include those hosted by Steven Crowder, Tim Pool, Laura Loomer, and Candace Owens. Joe Rogan’s is the most prominent alternative channel in our typology (it appears on all three source lists), accounting for 11.8% of all visits and 21.8% of all time spent on alternative channel videos.
Our list of extremist channels consists of those labelled as white identitarian by Ledwich and Zaitsev (30 channels) (26), white supremacist by Charles (23 channels) (39), alt-right by Ribeiro et al. (37 channels) (24), extremist or hateful by the Center on Extremism at the Anti-Defamation League (16 channels), and those compiled by journalist Aaron Sankin from lists curated by the Southern Poverty Law Center, the Canadian Anti-Hate Network, the Counter Extremism Project, and the white supremacist website Stormfront (157 channels) (40). After removing duplicates, our extremist channel list contains 290 channels, of which 36.2% appeared on two or more source lists. Example extremist channels include those hosted by Stefan Molyneux, David Duke, Mike Cernovich, and Faith J. Goldy.
As the examples above suggest, the potentially harmful alternative and extremist channels identified by scholarly and subject matter experts are predominantly from the (far) right in the U.S. Other forms of extremism exist, of course, especially outside the U.S. (e.g., Islamic extremism).
Following prior research, we define both alternative and extremist channels as potentially harmful (26, 24, 38, 39). Of the 302 alternative and 213 extremist channels that were still available on YouTube as of January 2021 (i.e., they had not been taken down by the owner or by YouTube), videos from 208 alternative and 55 extremist channels were viewed by at least one participant in our sample. We are not making these lists publicly available to avoid directing attention to them but are willing to privately share them with researchers and journalists upon request.
To create our list of mainstream media channels, we collected news channels from Buntain et al. (41) (65 mainstream news sources), Ledwich et al. (26) (75 mainstream media channels), Stocking et al. (42) (81 news channels), Ribeiro et al. (24) (68 popular media channels), Eady et al. (43) (219 national news domains), and Zannettou et al. (44) (45 news domains). We manually found the corresponding YouTube channels via YouTube search when authors only provided websites (24, 43, 45). In cases where news organizations have multiple YouTube channels (e.g., Fox News and Fox Business), all YouTube channels under the parent organization were included. Any channels appearing in fewer than three of these sources were omitted. Finally, we also included channels that were featured on YouTube’s News hub from February 10–March 5, 2021.
The resulting list of mainstream media channels was then checked to identify those that meet all of the following criteria:
-
1.
They must publish credible information, which we define as having a NewsGuard score greater than 60 (https://www.newsguardtech.com) and not being associated with any “black” or “red” fake news websites listed in Grinberg et al. (37).
-
2.
They must meet at least one criteria for mainstream media recognition or distribution, which we define as having national print circulation, having a cable TV network, being part of the White House press pool, or having won or been nominated for a prestigious journalism award (e.g., Pulitzer Prize, Peabody Award, Emmy, George Polk Award, or Online Journalism Award).
-
3.
They must be a US-based organization with national news coverage.
Our final mainstream media list consists of 127 YouTube channels.
We then placed all YouTube channels in our dataset that did not fall into one of these three categories (alternative, extremist, or mainstream media) into a residual category that we call “other.” (These may include alternative, extremist, or mainstream media that were missed by the processes described above.)
Survey measures of racial resentment and hostile sexism
We measure anti-Black animus with a standard four-item scale intended to measure racial resentment (31). For example, respondents were asked whether they agree or disagree with the statement “It’s really a matter of some people just not trying hard enough: if blacks would only try harder they could be just as well off as whites.” Responses are provided on a five-point agree/disagree scale and coded such that higher numbers represent more resentful attitudes. Respondents’ racial resentment score is the average of these four questions. Responses to these questions are taken from respondent answers to the 2018 Cooperative Congressional Election Survey (as noted above, participants were largely recruited from the pool of previous CCES respondents).
We operationalized hostile sexism using two items from a larger scale that was also asked on the 2018 Cooperative Congressional Election Survey (CCES) (32). For example, one of the questions asks if respondents agree or disagree with the statement “When women lose to men in a fair competition, they typically complain about being discriminated against.” Responses are provided on a five-point agree/disagree scale and coded such that higher numbers represent more hostile attitudes.
All other question wording is provided in the survey codebook in the SM. Racial resentment and hostile sexism measures were also included in our 2020 survey; responses showed a high degree of persistence over time ( for racial resentment, for hostile sexism). The two measures, which we refer to as measuring “resentment” or identifying “resentful” users per, e.g., Banda and Cassese (46) and Schaffner (47), were highly correlated with each other as well ().
Results
Exposure levels
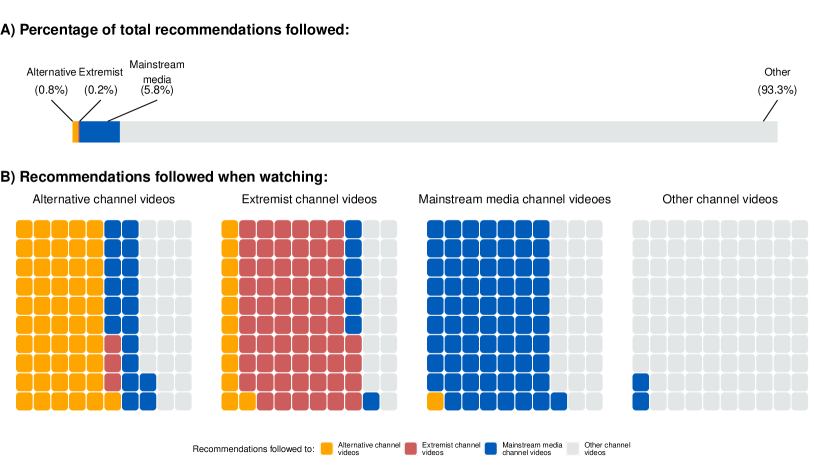
Though 91% of participants visited YouTube, the vast majority of participants did not view any alternative or extremist channel videos. Just 15% of the sample for whom we have browser activity data (=1,181) viewed any video from an alternative channel and only 6% viewed any video from an extremist channel. By comparison, 44% viewed at least one video from a mainstream media channel. (See Methods for how channel types were defined and how view history and watch time were defined.) Videos from mainstream media channels account for 3.6% of videos watched in our sample—a figure that falls between recent estimates that 2.9–11% of videos watched on YouTube are news (48, 20). The corresponding numbers for videos from alternative and extremist channels are 3.0% and 0.5%, respectively (similar to estimates from 2019 (20)).
The audience for alternative and extremist channels is skewed toward people who subscribe to the channel in question or one like it, which we determine by inspecting whether the subscription button is activated when a participant views a video from that channel (see Methods for more details). Among the set of people who saw at least one extremist channel video during the study period, for instance, 52% watched a video from an extremist channel to which they subscribed. Similarly, 39% of alternative channel viewers watched at least one video from an alternative channel to which they subscribed.
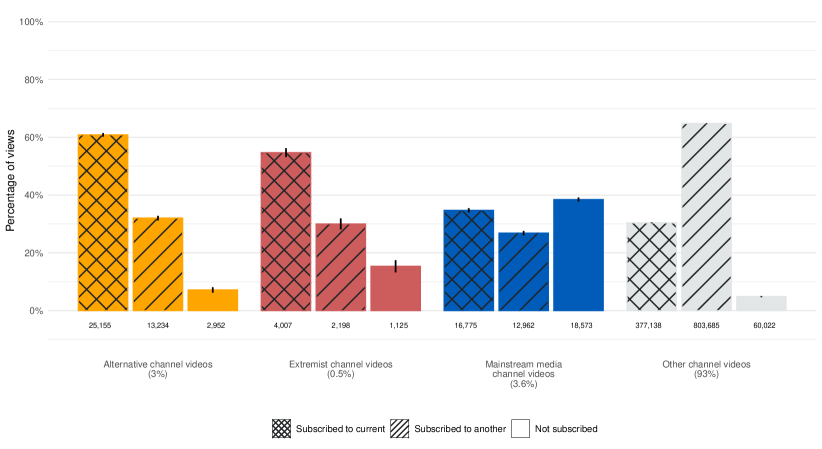
Weighted percentages of views for videos from each type of channel that come from people who are subscribed to that channel (crosshatches), who subscribe to one or more different channels of the same type but not the channel currently being viewed (hatches), and who do not subscribe to any channel of that type (no hatches). Each estimate includes the corresponding 95% confidence interval. Total view counts are displayed at bottom of each bar. Total views for videos of that type as a percentage of all views are displayed under the channel labels.
Figure 1 illustrates this point in a different way by disaggregating video views according to both channel type and subscription status. We observe that 60.8% of views for videos from alternative channels and 54.7% of views for videos from extremist channels come from subscribers to the channel in question. If we instead define subscribers to include all people who subscribe to at least one channel of the type in question, the proportion of views from subscribers increases to 92.9% for alternative channels and 84.7% for extremist channels. These patterns for alternative and extremist channels are distinct from mainstream media channels, which receive 38% of their views from people who do not subscribe to any channel in the category.
Among the participants who viewed at least one video from an alternative or extremist channel, the time spent watching them was relatively low (and concentrated among subscribers): an overall mean of 26 minutes per week for alternative channel videos (62 minutes per week for subscribers to one or more alternative channels [6%] versus 0.2 minutes per week for non-subscribers [9%]) and 8 minutes for extremist channel videos (15 minutes per week for subscribers [3%] versus 0.04 minutes per week for non-subscribers [3%]). The comparison statistics are 12 minutes per week for mainstream media channel videos and 214 minutes per week for videos from other channels. As noted above, however, these data are highly skewed: the median time spent watching among participants who viewed at least one video from an alternative or extremist channel was 1.1 minutes for alternative channel videos and 0.6 minutes for extremist channel videos. That said, these results mirror those from Hosseinmardi et al. (20), who observed the same partial ordering, in terms of video watch time, for anti-woke (i.e., alternative), far right (i.e., extreme), and mainstream news sources, from most to least watched.
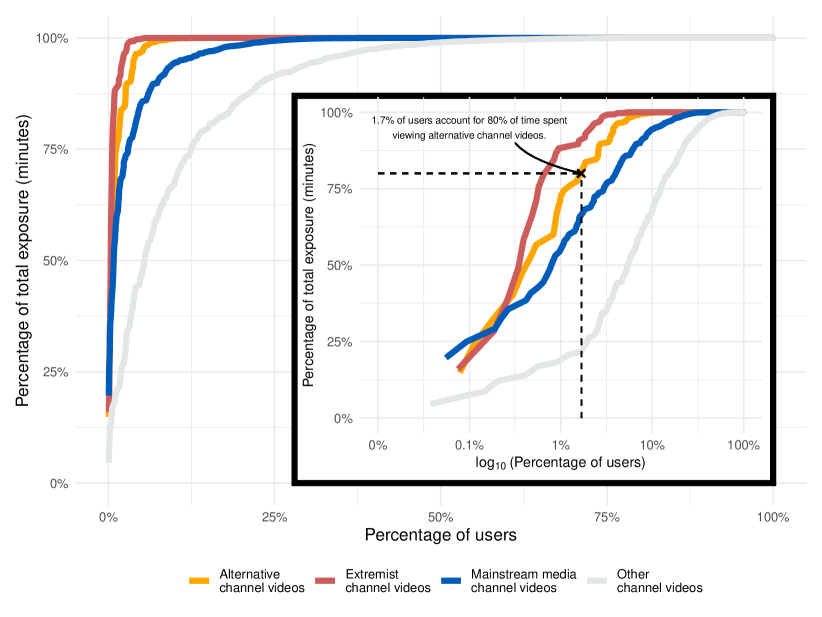
Weighted empirical cumulative distribution function (eCDF) showing the percentage of participants responsible for a given level of total observed video viewership of alternative and extremist channels on YouTube (in minutes). Inset graph shows the same data using a log scale for the weighted eCDF.
Viewership of potentially harmful videos on YouTube is heavily concentrated among a few participants, mirroring patterns observed on YouTube over the 2016–2019 time frame (20), Twitter and untrustworthy websites (37, 35), and news content generally (49, 48). As Figure 2 indicates, 1.7% of participants account for 80% of total time spent on videos from alternative channels. This imbalance is even more severe for extremist channels, where 0.6% of participants were responsible for 80% of total time spent on these videos. Skew is similar when we examine view counts (Figure S16) rather than time spent on videos—1.9% and 1.1% of participants were responsible for 80% of alternative and extremist channel viewership, respectively. We observe a similar pattern of concentration for mainstream media consumption—just 3.8% of participants account for 80% of the total views. (We provide a more detailed analysis of the viewership patterns of these “superconsumers” in the SM.)
Correlates of exposure
We next evaluate demographic and attitudinal factors that are potentially correlated with time spent watching videos from alternative, extremist, and mainstream media channels. We focus specifically on hostile sexism, racial resentment, and negative feelings toward Jews—three factors that may make people vulnerable to the types of messages offered by alternative and extremist channels, which often target women, racial and ethnic minorities, and Jews (38, 45). Negative attitudes towards these out groups may make people vulnerable to the types of messages offered by alternative and extremist channels. We therefore estimate the statistical models reported below on the subset of 851 respondents for whom prior scale measures of hostile sexism and racial resentment are available from the 2018 Cooperative Congressional Election Study. (Details on survey wording and measurement, including the wording for these scales, are provided in Methods below; feelings toward Jews are measured using a feeling thermometer.)
We estimate models measuring the association between the average time per week that respondents spent on videos from alternative, extremist, or mainstream media channels and the measures listed above as well as relevant demographic characteristics: age, sex (male/not male), race (white/non-white), and indicators for different levels of education above high school (some college/bachelor’s/post-grad). Results of the quasipoisson models we estimate, which account for the skew in video watch time, are shown in Figure 3. (See Figure S9 for equivalent results for the number of views of videos from alternative and extremist channels.)
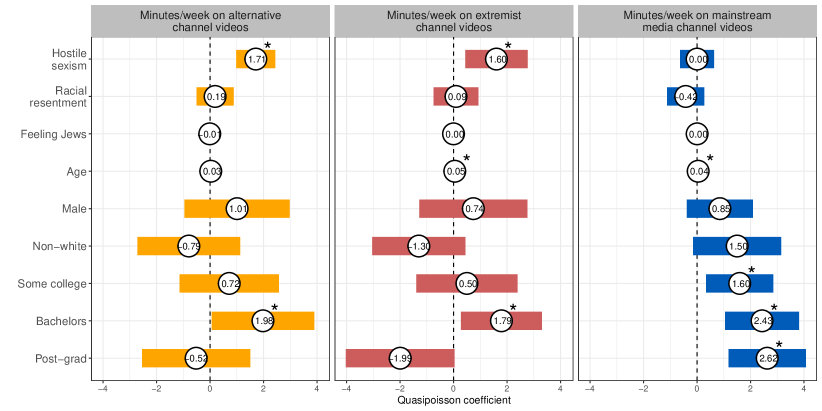
Quasipoisson regression coefficients for correlates of the amount of time respondents spent on videos from alternative, extremist, and mainstream media channels in minutes per week. Figure includes 95% confidence intervals calculated from robust standard errors. All results incorporate survey weights. Stars indicate coefficients that are significant at the level. See Table S2 for regression table.
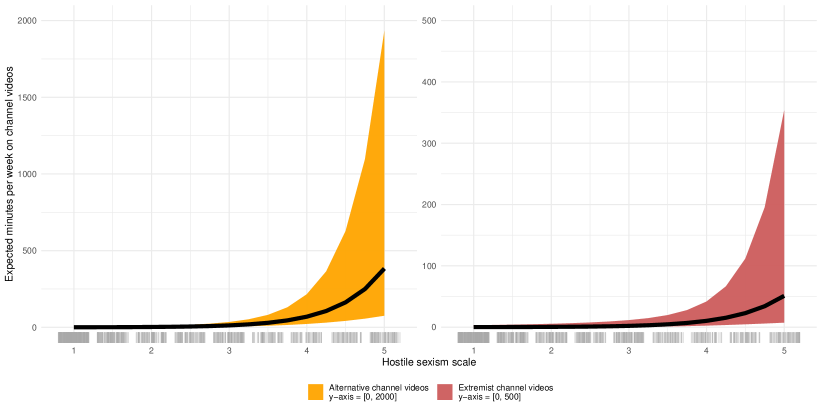
Predictions are estimated from the models in Figure 3 holding other covariates at their median (continuous variables) and modal (categorical variables) values. Colored bands represent 95% robust confidence intervals. All results incorporate survey weights.
The results indicate that prior levels of hostile sexism are significantly associated with time spent on videos from alternative channels and time spent on videos from extremist channels but not time spent watching mainstream media channels. This relationship, which is consistent with the commenter overlap observed between men’s rights/anti-feminist channels and alt-right channels on YouTube (50), is not observed for prior levels of racial resentment when controlling for hostile sexism. However, both hostile sexism and racial resentment are positively associated with time spent on videos and number of views of videos from alternative and extremist channels when entered into statistical models separately (see Tables S6 and S7). Finally, we find no association between feelings toward Jews and viewership of any of these types of channels.
Figure 4 illustrates the relationship between prior levels of hostile sexism and time spent per week watching videos from alternative or extremist channels using the model results described above. When hostile sexism is at its minimum value of 1, expected levels are 0.4 minutes per week spent watching alternative channel videos and 0.08 minutes for extremist channel videos. These predicted values increase to 383 and 51 minutes, respectively, when hostile sexism is at its maximum value of 5 (with the greatest marginal increases as hostile sexism reaches its highest levels).
Recommendations and YouTube “rabbit holes”
Critics of YouTube have emphasized the role of its algorithmic recommendations in leading people to potentially harmful content. We therefore measure which types of videos YouTube recommended to participants and how often those recommendations were followed. Next, we specifically count how often people follow recommendations to more extreme channels to which they don’t subscribe in a manner that is consistent with the “rabbit hole” narrative. Finally, we disaggregate YouTube recommendations and following behavior based on subscription status. In general, we find that recommendations to alternative and extremist channel videos are rare and frequently shown to and followed by people who already subscribe to those channels.
We disaggregate the recommendations shown to participants by the type of video on which the recommendation appears, which appears to play a large role in determining what YouTube recommends. As Panel A of Figure 5 shows, there are relatively few recommendations to alternative and extremist videos. As Panel B shows, recommendations to alternative and extremist channel videos are very rare when watching videos from mainstream media or other types of channels, which together make up 97% of views in our sample. Recommendations to alternative and extremist channel videos are much more common, however, when people are already viewing videos from alternative and extremist channels, which make up 3% and 0.5% of views, respectively. Just under half (47.9%) of recommendations when viewing an alternative channel video point to another alternative channel video, while 41.1% of recommendations follow the same pattern for extremist channel videos. Substantively similar patterns of recommendations have been observed in random walk studies on YouTube (26, 24).
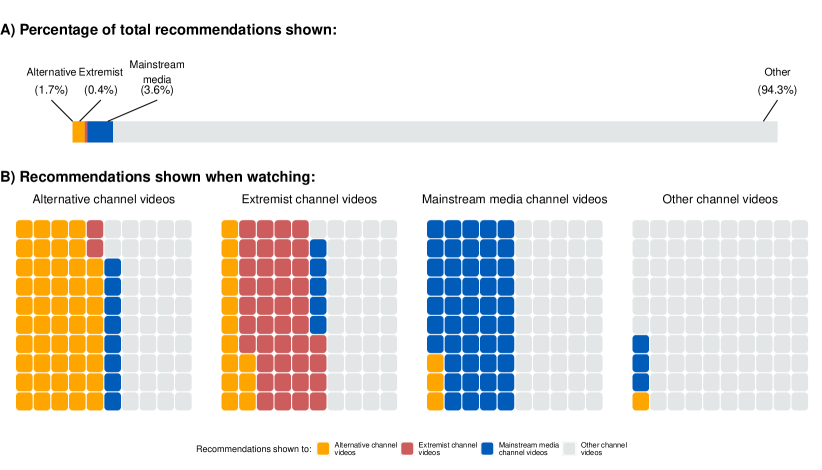
Number of colored tiles shown are proportional to the proportion of recommendations shown for each type of video when watching videos from alternative, extremist, mainstream media, or other channels. Results are based on the full set of recommendations that we could extract from each video and incorporate survey weights.
Figure S6 in the SM provides corresponding statistics for the proportion of recommendations followed by channel type. As expected, the people who are already watching alternative and extremist channel videos are especially likely to follow recommendations to other alternative or extremist channel videos. Among people who were watching alternative channel videos, 53.7% of recommendations followed were to alternative or extremist channel videos (compared to 50.3% of recommendations shown). Correspondingly, 73.8% of recommendations followed from extremist channel videos were to other extremist or alternative channel videos (versus 54.3% of recommendations shown). The probability of following a recommendation to such a video by people not already watching an alternative or extremist channel video was negligible. (We disaggregate recommendations and follows by recommendation rank in Figures S17–S18.)
Next, we more directly test how often YouTube video recommendations create “rabbit holes” in which people are shown more extreme content than they would otherwise encounter. Specifically, we define four conditions that must be met to constitute a “rabbit hole” and report the number of views, sessions, and users that meet these criteria when sequentially applied:
-
1.
A participant followed a recommendation to an alternative or extremist channel video: 0.17% of all video visits among 7.3% of participants;
-
2.
The recommendation that the participant followed moved them to a more extreme channel type (i.e., {mainstream media, other} {alternative} or {mainstream media, other, alternative} {extreme}): 0.07% of all video visits among 5.4% of participants;
-
3.
The participant does not subscribe to the channel of the recommended video: 0.02% of all video visits among 4.7% of participants;
-
4.
The participant does not subscribe to any channels of the same type (i.e., alternative or extremist) as the recommended video: 0.01% of all video visits among only 3.0% of participants.
Based on these strict criteria, we observe very few cases of “rabbit hole” events. As noted above, the set of events that meet all four criteria for alternative and extremist channel videos represent only 0.01% of all video visits and were observed among just 3.0% of participants. The set of such sequences that specifically ended in exposure to an extremist channel video represented just 0.002% of all visits and were only observed among 1.0% of participants. (We provide qualitative accounts of three such sequences in the SM as well as an analysis showing no trend toward greater exposure to alternative or extremist channel videos in longer YouTube sessions.)
We observe that recommendations to videos from alternative and extremist channels are frequently shown to channel subscribers—the same group that is most likely to follow those recommendations. As Figure 6 demonstrates, people who subscribe to at least one alternative channel received 53.1% of all alternative channel video recommendations and represented 67.2% of the cases in which a participant followed a recommendation to an alternative channel video. This skew was somewhat smaller for extremist channel videos—subscribers to one or more extremist channels saw 44.7% of recommendations to videos from extremist channels and made up 49.0% of the cases in which respondents followed a recommendation to watch such a video. These figures are generally larger than those observed for mainstream media channels or other types of channels.
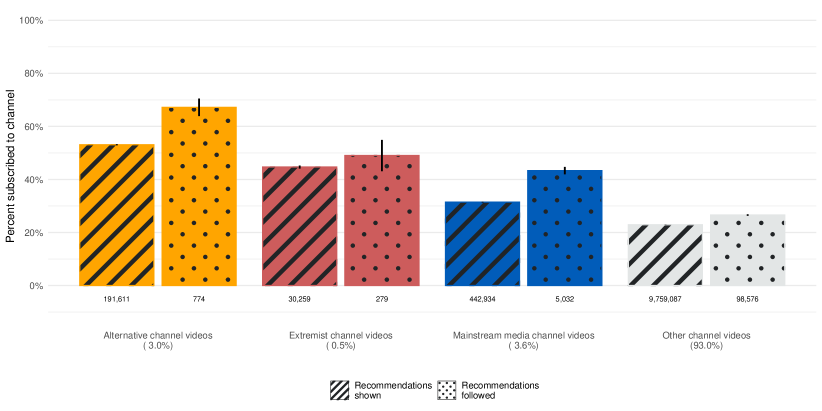
The weighted percentage of recommendations shown and followed to people who subscribe to one or more channels of each type (including 95% confidence intervals for both, though these are sometimes not visible due to the sample size of the recommendations shown data). The weighted percentage of views of each type of video are shown in parentheses under the labels.
Internal and external referrers
Finally, we replicate and expand an analysis conducted by Hosseinmardi et al. (20) that measures the process by which people come to watch alternative and extremist videos on YouTube. As in prior work, we denote the page that people viewed immediately prior to a video being opened (within an existing browser tab or within a new tab) as the “referrer” and distinguish between “on-platform” referrers (a YouTube channel page, the YouTube homepage, a YouTube search page, or another YouTube video) and “off-platform” referrers that are not part of the YouTube domain such as search engines, webmail sites, mainstream social media sites (e.g., Facebook, Twitter, Reddit), or alternative social media sites (e.g., Parler, Gab, 4chan). The complete list of external referrers in each category can be found in Table S10. Details on how we identify referrers are provided in Methods below.
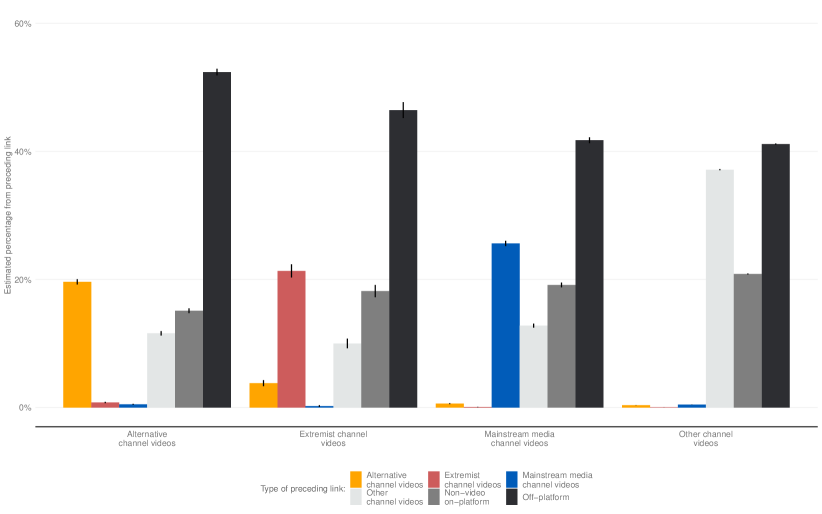
We find that off-platform referrers are responsible for approximately half of all views of alternative and extremist channel videos, a finding that is roughly consistent with YouTube’s statement that “borderline content gets most of its views from other platforms that link to YouTube” (51). Our finding is slightly higher than the 36–41% external referrers for alternative and extreme videos observed by Hosseinmardi et al. (20), but we include referrals from non-YouTube search engines in our total while Hosseinmardi et al. (20) do not. That said, as we show in Figure S7, 52.4% and 46.6% of referrals to alternative and extremist channel videos, respectively, were off-platform sources, which is only somewhat higher than off-platform referrals for videos from mainstream media (41.7%) or other channels (41.1%).
With respect to on-platform referrers, we observe frequent within-category referrals by video type, with 19.6% of referrals to alternative channel videos coming from other alternative channel videos, 21.3% of referrals to extremist channel videos coming from other extremist channel videos, and 25.6% of referrals to mainstream media channel videos coming from other mainstream media channel videos. This is broadly consistent with results from random walk studies on YouTube that have examined recommendations between different types of videos (26, 24). Interestingly, we observe 3.8% of referrals to extremist channel videos coming from alternative channel videos, but only 0.8% of referrals to alternative channel videos coming from extremist channel videos, which suggests that it is rare for our participants to move from more to less extreme content in this manner. Lastly, we observe that alternative, extremist, and mainstream media channel videos all receive roughly equal referrals from videos in other channels (10.0–12.8%) and other on-platform sources (15.1–19.1%). Overall, these results also broadly similar to those Hosseinmardi et al. (20), who found that 36–39% of referrals to alternative and extreme videos came from other videos, while 21–23% of referrals came from other on-platform sources.
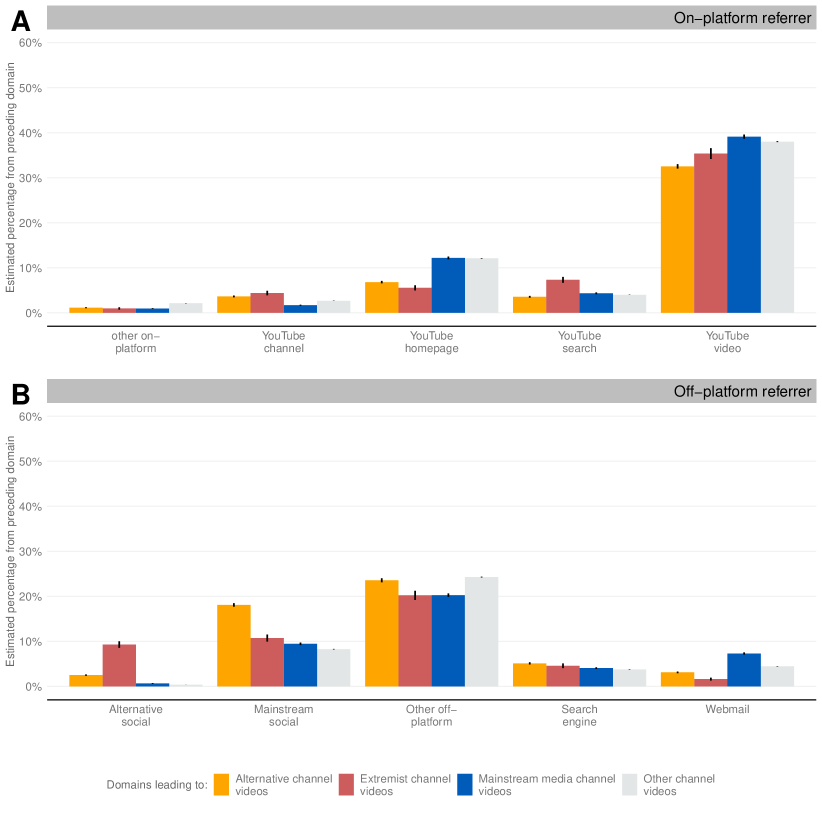
Weighted proportion of referrals to YouTube videos of each channel type by referrer type. Other on-platform platform referrals such as YouTube playlists and personal user pages were grouped into a separate category. Similarly, off-platform domains that do not fit into any of the labeled categories in panel B are grouped together. A list of all domains included in each group can be found in the SM.
Figure 7 reports the proportion of views to each type of YouTube channel video (alternative, extremist, mainstream media, and other) from each type of referrer. This analysis allows us to determine which types of referrers are unusually (un)common across channel types. On-platform, we note that the YouTube homepage, YouTube search, and other YouTube videos are relatively less frequent sources of referrals to alternative and extremist channel videos than videos from mainstream media channels and other channels. In contrast, channel pages are a more common referral source to alternative and extremist channel videos. Like quantitatively similar findings by Hosseinmardi et al. (20), this highlights that participants arrive at alternative and extremist videos from a variety of referrers, not just YouTube recommendations.
Among off-platform referrers, social media platforms stand out as playing an especially important role in referring people to alternative and extremist channel videos. Participants are disproportionately more likely to reach alternative channel videos via mainstream social media sites and to reach extremist channel videos via alternative social media sites compared with videos from other types of channels. For instance, 9.3% of extremist channel video views were preceded by a visit to an alternative social media site despite their limited reach. Platforms like Gab and 4chan may attract extremist users in part due to their lax content moderation policies. These results supplement those from Hosseinmardi et al. (20), who found that alternative and extreme news websites generated many of the off-platform referrals to the corresponding types of videos on YouTube.
Discussion
Using web browsing data collected in 2020, we provide behavioral measures of exposure to videos from alternative and extremist channels on YouTube. These data enable us to measure exposure to potentially harmful content on the platform and to analyze the role of YouTube’s algorithms in facilitating exposure to that content after reported changes to the recommendation system in 2019.
Our data indicate that many alternative and extremist channels remain on the platform and attract a small but active audience of individuals who expressed high levels of hostile sexism and racial resentment in survey data collected in 2018. These participants frequently subscribe to the channels in question, generating more frequent recommendations. By continuing to host these channels, YouTube facilitates the growth of problematic communities (many channel views originate in referrals from alternative social media platforms where users with high levels of gender and racial resentment may congregate) and enables creators of alternative and extreme content to profit from shared YouTube advertising revenue or indirectly via affiliated stores and donation campaigns (29, 30).
In the data we collected in 2020, YouTube’s recommendation algorithm plays a secondary role in facilitating exposure to potentially harmful content. We observe that recommendations to videos from alternative and extreme channels are far more common when people are already watching those videos or subscribed to those channels relative to videos from mainstream news and non-news channels. We also observe that people rarely follow recommendations to videos from alternative and extreme channels when they are watching videos from mainstream news and non-news channels.
While these results complicate the narrative of pervasive radicalization via “rabbit holes” on YouTube, our study does not imply that there never was a radicalization problem on YouTube or that the status quo is normatively unproblematic. Our data do not allow us to evaluate the previous state of the platform; YouTube’s algorithms may have recommended videos from alternative and extremist channels more frequently prior to the changes made in 2019. Furthermore, given the limitations of our study (see below), our findings should be interpreted as estimating lower bounds on “rabbit hole” exposures in 2020 on YouTube. In addition, even very low rates of “rabbit hole” recommendations may be enough to expose large numbers of vulnerable people to harm, especially when extrapolated over YouTube’s entire viewership and over the course of years.
It is important to note several other limitations of the study:
-
•
Though our browser extension sample is large and diverse and we weight our results to national benchmarks, it is not fully representative and does not capture YouTube consumption among users of browsers other than Chrome and Firefox or on mobile devices. Any outside study of a platform also faces challenges in recruiting large numbers of heavy consumers of fringe content.
-
•
YouTube users who were susceptible to potentially harmful content may have already suffered from its effects prior to changes to the platform’s algorithms in 2019. We are therefore unable to make causal claims based on our data—participant’s preexisting gender and racial resentment may have caused them to seek out congruent content on YouTube, but in some cases YouTube’s algorithmic recommendations may have introduced them to such content and increased feelings of resentment even before our prior survey measures of hostile sexism and racial resentment were recorded (November/December 2018). Exposure to YouTube’s algorithms before the changes in 2019 could also reduce our ability to detect new “rabbit hole” events during the study period in 2020 as some people who are likely to follow problematic recommendations might already be subscribed to these types of channels.
-
•
Our results only cover U.S. users; they should be replicated outside the U.S. in contexts including Europe and the global South (and non-English language content).
-
•
Our results depend on channel-level classifications from scholars and subject matter experts; further research should examine whether the patterns we observe are robust to alternate measures at the channel and (if possible) video level.
-
•
Our measures of views, referrals, and subscriptions contain some degree of error. In particular, as with most passive behavioral data, we cannot verify that every user paid attention to the content that appeared on their device in every instance.
Nonetheless, these results underscore the need to apply the tools of behavioral science to measure exposure to extremist content across social media platforms and to determine how these platforms may reinforce (or hinder) those patterns of behavior individually and collectively. As our findings suggest, these problems often center on the way social media platforms enable the distribution of potentially harmful content to vulnerable audiences rather than algorithmic exposure itself.
Acknowledgments
We are grateful to the Russell Sage Foundation, Anti-Defamation League, Carnegie Corporation of New York, the National Science Foundation, John Smith Guggenheim Memorial Foundation, and the European Research Council (ERC) for financial support; to Samantha Luks at YouGov for survey assistance; to Kasey Rhee for research assistance; to Andy Guess for helping design this project in its initial stages; and to Tanushree Mitra, Joseph B. Phillips, David Rothschild, Gianluca Stringhini, and Savvas Zannettou for comments and feedback. We also thank Virgílio A.F. Almeida, Stephen Ansolabehere, Manoel Horta Ribeiro, Aaron Sankin, Brian Schaffner, Robert West, and Anna Zaitsev for sharing their data with us or making it publicly available. This research utilized equipment funded by NSF grant IIS-1910064. Any opinions, findings, and conclusions or recommendations expressed in this material are those of the authors and do not necessarily reflect the views of the funders. In general, all conclusions and errors are our own.
Funding
This study was supported by the Russell Sage Foundation, Anti-Defamation League, Carnegie Corporation of New York, and the National Science Foundation (grant IIS-1910064). This project (J.R.) received funding from the European Research Council (ERC) under the European Union’s Horizon 2020 research and innovation programme (grant agreement No. 682758).
Data availability
Data and code necessary to replicate the results in this study have been posted on Github (https://github.com/aychen5/youtube-extremism-replication and Dataverse (https://dataverse.harvard.edu/dataset.xhtml?persistentId=doi:10.7910/DVN/UC1XM1).
Author contributions
B.N., J.R., and C.W. designed the study. All the authors wrote the original manuscript. B.N., J.R., and C.W. revised the manuscript. R.E.R. collected the browser data. A.Y.C. and R.E.R. analyzed the data.
Competing interests
The authors declare that they have no competing interests.
References
- Sunstein (2001) Cass Sunstein. Republic.com. Princeton University Press, 2001.
- Stroud (2010) Natalie Jomini Stroud. Polarization and partisan selective exposure. Journal of Communication, 60(3):556–576, 2010.
- Gentzkow and Shapiro (2011) Matthew Gentzkow and Jesse M Shapiro. Ideological segregation online and offline. Quarterly Journal of Economics, 126(4):1799–1839, 2011.
- Auxier and Anderson (2021) Brooke Auxier and Monica Anderson. Social media use in 2021. Pew Research Center, https://www.pewresearch.org/internet/2021/04/07/social-media-use-in-2021/, April 2021.
- Solsman (2018) Joan E. Solsman. YouTube’s AI is the puppet master over most of what you watch. CNET, https://www.cnet.com/news/youtube-ces-2018-neal-mohan/, January 2018.
- Tufekci (2018) Zeynep Tufekci. YouTube, the great radicalizer. New York Times, https://www.nytimes.com/2018/03/10/opinion/sunday/youtube-politics-radical.html, March 2018.
- Nicas (2018) Jack Nicas. How YouTube drives people to the internet’s darkest corners. Wall Street Journal, https://www.wsj.com/articles/how-youtube-drives-viewers-to-the-internets-darkest-corners-1518020478, February 2018.
- Roose (2019) Kevin Roose. The making of a YouTube radical. New York Times, https://www.nytimes.com/interactive/2019/06/08/technology/youtube-radical.html, June 2019.
- McCrosky and Geurkink (2021) Jesse McCrosky and Brandi Geurkink. YouTube regrets: A crowdsourced investigation into YouTube’s recommendation algorithm. Mozilla Foundation, https://assets.mofoprod.net/network/documents/Mozilla_YouTube_Regrets_Report.pdf, July 2021.
- YouTube (2019a) YouTube. Continuing our work to improve recommendations on YouTube. YouTube, https://blog.youtube/news-and-events/continuing-our-work-to-improve/, January 2019a.
- YouTube (2019b) YouTube. Our ongoing work to tackle hate. YouTube, https://blog.youtube/news-and-events/our-ongoing-work-to-tackle-hate/, June 2019b.
- YouTube (2019c) YouTube. The four Rs of responsibility, part 2: Raising authoritative content and reducing borderline content and harmful misinformation. YouTube, https://blog.youtube/inside-youtube/the-four-rs-of-responsibility-raise-and-reduce, December 2019c.
- Bail et al. (2018) Christopher A Bail, Lisa P Argyle, Taylor W Brown, John P Bumpus, Haohan Chen, MB Fallin Hunzaker, Jaemin Lee, Marcus Mann, Friedolin Merhout, and Alexander Volfovsky. Exposure to opposing views on social media can increase political polarization. Proceedings of the National Academy of Sciences, 115(37):9216–9221, 2018.
- Vosoughi et al. (2018) Soroush Vosoughi, Deb Roy, and Sinan Aral. The spread of true and false news online. Science, 359(6380):1146–1151, 2018.
- Bakshy et al. (2015) Eytan Bakshy, Solomon Messing, and Lada A Adamic. Exposure to ideologically diverse news and opinion on Facebook. Science, 348(6239):1130–1132, 2015.
- Lazer et al. (2018) David MJ Lazer, Matthew A Baum, Yochai Benkler, Adam J Berinsky, Kelly M Greenhill, Filippo Menczer, Miriam J Metzger, Brendan Nyhan, Gordon Pennycook, David Rothschild, et al. The science of fake news. Science, 359(6380):1094–1096, 2018.
- Guess et al. (2019) Andrew Guess, Jonathan Nagler, and Joshua Tucker. Less than you think: Prevalence and predictors of fake news dissemination on Facebook. Science Advances, 5(1):eaau4586, 2019.
- Munger and Phillips (2020) Kevin Munger and Joseph Phillips. Right-wing YouTube: A supply and demand perspective. The International Journal of Press/Politics, 2020.
- Yesilada and Lewandowsky (2022) Muhsin Yesilada and Stephan Lewandowsky. Systematic review: YouTube recommendations and problematic content. Internet Policy Review, 11(1), 2022.
- Hosseinmardi et al. (2021) Homa Hosseinmardi, Amir Ghasemian, Aaron Clauset, David M Rothschild, Markus Mobius, and Duncan J Watts. Examining the consumption of radical content on YouTube. Proceedings of the National Academy of Sciences, 32(e2101967118), 2021.
- Faddoul et al. (2020) Marc Faddoul, Guillaume Chaslot, and Hany Farid. A longitudinal analysis of YouTube’s promotion of conspiracy videos. arXiv preprint arXiv:2003.03318, 2020.
- Hussein et al. (2020) Eslam Hussein, Prerna Juneja, and Tanushree Mitra. Measuring misinformation in video search platforms: An audit study on YouTube. Proceedings of the ACM on Human-Computer Interaction, 4(CSCW1):1–27, 2020.
- Papadamou et al. (2022) Kostantinos Papadamou, Savvas Zannettou, Jeremy Blackburn, Emiliano De Cristofaro, Gianluca Stringhini, and Michael Sirivianos. “It is just a flu”: Assessing the effect of watch history on YouTube’s pseudoscientific video recommendations. In Proceedings of the International AAAI Conference on Web and Social Media, May 2022.
- Ribeiro et al. (2020) Manoel Horta Ribeiro, Raphael Ottoni, Robert West, Virgílio AF Almeida, and Wagner Meira Jr. Auditing radicalization pathways on YouTube. In Proceedings of the 2020 Conference on Fairness, Accountability, and Transparency, pages 131–141, 2020.
- Bisbee et al. (2022) James Bisbee, Megan A. Brown, Angela Lai, Richard Bonneau, Joshua A. Tucker, and Jonathan Nagler. Election fraud, YouTube, and public perception of the legitimacy of President Biden. Journal of Online Trust and Safety, 1(3):1–65, 2022.
- Ledwich and Zaitsev (2020) Mark Ledwich and Anna Zaitsev. Algorithmic extremism: Examining YouTube’s rabbit hole of radicalization. First Monday, 25(3), 2020.
- Robertson (2022) Ronald E. Robertson. Uncommon yet consequential online harms. Journal of Online Trust and Safety, 1(3), August 2022. ISSN 2770-3142. doi: 10.54501/jots.v1i3.87.
- Locatelli et al. (2022) Marcelo Sartori Locatelli, Josemar Caetano, Wagner Meira Jr., and Virgilio Almeida. Characterizing vaccination movements on YouTube in the United States and Brazil. In Proceedings of the ACM Conference on Hypertext and Social Media, 2022.
- Ballard et al. (2022) Cameron Ballard, Ian Goldstein, Pulak Mehta, Genesis Smothers, Kejsi Take, Victoria Zhong, Rachel Greenstadt, Tobias Lauinger, and Damon McCoy. Conspiracy brokers: Understanding the monetization of YouTube conspiracy theories. In Proceedings of the ACM Web Conference 2022, pages 2707–2718, April 2022.
- Network (2022) The International Fact-Checking Network. An open letter to YouTube’s CEO from the world’s fact-checkers. https://www.poynter.org/fact-checking/2022/an-open-letter-to-youtubes-ceo-from-the-worlds-fact-checkers/, January 2022.
- Kinder and Sanders (1996) Donald R Kinder and Lynn M Sanders. Divided by color: Racial politics and democratic ideals. University of Chicago Press, 1996.
- Glick and Fiske (1997) Peter Glick and Susan T Fiske. Hostile and benevolent sexism: Measuring ambivalent sexist attitudes toward women. Psychology of women quarterly, 21(1):119–135, 1997.
- DeSante and Watts Smith (2020) Christopher D DeSante and Candis Watts Smith. Less is more: A cross-generational analysis of the nature and role of racial attitudes in the twenty-first century. The Journal of Politics, 82(3):967–980, 2020.
- Guess (2021) Andrew M Guess. (Almost) everything in moderation: New evidence on Americans’ online media diets. American Journal of Political Science, 2021.
- Guess et al. (2020) Andrew M Guess, Brendan Nyhan, and Jason Reifler. Exposure to untrustworthy websites in the 2016 US election. Nature Human Behaviour, 4(5):472–480, 2020.
- Wojcieszak et al. (2021) Magdalena Wojcieszak, Ericka Menchen-Trevino, Joao FF Goncalves, and Brian Weeks. Avenues to news and diverse news exposure online: Comparing direct navigation, social media, news aggregators, search queries, and article hyperlinks. The International Journal of Press/Politics, page 19401612211009160, 2021.
- Grinberg et al. (2019) Nir Grinberg, Kenneth Joseph, Lisa Friedland, Briony Swire-Thompson, and David Lazer. Fake news on Twitter during the 2016 US Presidential election. Science, 363(6425):374–378, 2019.
- Lewis (2018) Becca Lewis. Alternative influence: Broadcasting the reactionary right on YouTube. Data & Society, https://datasociety.net/library/alternative-influence/, September 2018.
- Charles (2020) Christopher Charles. (Main)streaming hate: Analyzing white supremacist content and framing devices on YouTube. University of Central Florida, https://stars.library.ucf.edu/etd2020/27/, 2020.
- Sankin (2019) Aaron Sankin. YouTube said it was getting serious about hate speech. why is it still full of extremists? Gizmodo, https://gizmodo.com/youtube-said-it-was-getting-serious-about-hate-speech-1836596239, July 2019.
- Buntain et al. (2021) Cody Buntain, Richard Bonneau, Jonathan Nagler, and Joshua A Tucker. YouTube recommendations and effects on sharing across online social platforms. Proceedings of the ACM on Human-Computer Interaction, 5(CSCW1):1–26, 2021.
- Stocking et al. (2020) Galen Stocking, Patrick Van Kessel, Michael Barthel, Katerina Eva Matsa, and Maya Khuzam. Many Americans get news on YouTube, where news organizations and independent producers thrive side by side. Pew Research Center, https://www.pewresearch.org/journalism/2020/09/28/many-americans-get-news-on-youtube-where-news-organizations-and-independent-producers-thrive-side-by-side/, September 2020.
- Eady et al. (2020) Gregory Eady, Richard Bonneau, Joshua A Tucker, and Jonathan Nagler. News sharing on social media: Mapping the ideology of news media content, citizens, and politicians. OSF, https://osf.io/preprints/ch8gj/, 2020.
- Zannettou et al. (2017) Savvas Zannettou, Tristan Caulfield, Emiliano De Cristofaro, Nicolas Kourtelris, Ilias Leontiadis, Michael Sirivianos, Gianluca Stringhini, and Jeremy Blackburn. The web centipede: Understanding how web communities influence each other through the lens of mainstream and alternative news sources. In Proceedings of the 2017 Internet Measurement Conference, pages 405–417, 2017.
- Zannettou et al. (2020) Savvas Zannettou, Joel Finkelstein, Barry Bradlyn, and Jeremy Blackburn. A quantitative approach to understanding online antisemitism. In Proceedings of the International AAAI Conference on Web and Social Media, volume 14, pages 786–797, 2020.
- Banda and Cassese (2022) Kevin K Banda and Erin C Cassese. Hostile sexism, racial resentment, and political mobilization. Political Behavior, 44(3):1317–1335, 2022.
- Schaffner (2021) Brian F Schaffner. Optimizing the measurement of sexism in political surveys. Political Analysis, pages 1–17, 2021.
- Yang and González-Bailón (2021) Tian Yang and Sandra González-Bailón. Online media boosts exposure to news but only for a small minority of hyper-consumers. SSRN, https://papers.ssrn.com/sol3/papers.cfm?abstract_id=3954565, 2021.
- Allen et al. (2020) Jennifer Allen, Baird Howland, Markus Mobius, David Rothschild, and Duncan J Watts. Evaluating the fake news problem at the scale of the information ecosystem. Science Advances, 6(14):eaay3539, 2020.
- Mamié et al. (2021) Robin Mamié, Manoel Horta Ribeiro, and Robert West. Are anti-feminist communities gateways to the far right? Evidence from Reddit and YouTube. In Proceedings of the 13th ACM Web Science Conference 2021, pages 139–147, 2021.
- Goodrow (2021) Cristos Goodrow. On YouTube’s recommendation system. YouTube, https://blog.youtube/inside-youtube/on-youtubes-recommendation-system/, September 2021.
Supplementary Materials:
Subscriptions and external links help drive resentful users to alternative and extremist YouTube channels
Sample details and additional results
Demographic statistics by sample
| Full sample | Extension sample | |||
| weighted | unweighted | weighted | unweighted | |
| Gender | ||||
| Female | 0.48 | 0.46 | 0.49 | 0.49 |
| (0.01) | (0.01) | (0.02) | (0.01) | |
| Male | 0.52 | 0.54 | 0.51 | 0.51 |
| (0.01) | (0.01) | (0.02) | (0.01) | |
| Race | ||||
| White | 0.68 | 0.76 | 0.69 | 0.75 |
| (0.01) | (0.01) | (0.02) | (0.01) | |
| Black | 0.12 | 0.08 | 0.14 | 0.08 |
| (0.01) | (0.00) | (0.02) | (0.01) | |
| Hispanic | 0.10 | 0.07 | 0.10 | 0.07 |
| (0.01) | (0.00) | (0.02) | (0.01) | |
| Asian | 0.04 | 0.04 | 0.04 | 0.04 |
| (0.01) | (0.00) | (0.01) | (0.01) | |
| 2016 presidential vote | ||||
| Donald Trump | 0.33 | 0.40 | 0.19 | 0.20 |
| (0.01) | (0.01) | (0.02) | (0.01) | |
| Hillary Clinton | 0.28 | 0.31 | 0.40 | 0.49 |
| (0.01) | (0.01) | (0.02) | (0.01) | |
| Employment status | ||||
| Employed | 0.46 | 0.49 | 0.48 | 0.51 |
| (0.01) | (0.01) | (0.02) | (0.01) | |
| Unemployed | 0.12 | 0.10 | 0.12 | 0.10 |
| (0.01) | (0.00) | (0.02) | (0.01) | |
| Education | ||||
| High school graduate | 0.35 | 0.19 | 0.26 | 0.14 |
| (0.01) | (0.01) | (0.02) | (0.01) | |
| Some college | 0.35 | 0.37 | 0.37 | 0.35 |
| (0.01) | (0.01) | (0.02) | (0.01) | |
| 4-year | 0.19 | 0.26 | 0.24 | 0.28 |
| (0.01) | (0.01) | (0.02) | (0.01) | |
| Post-grad | 0.11 | 0.18 | 0.13 | 0.23 |
| (0.01) | (0.01) | (0.01) | (0.01) | |
| Religion | ||||
| Atheist/Agnostic | 0.37 | 0.35 | 0.47 | 0.46 |
| (0.01) | (0.01) | (0.02) | (0.01) | |
| Protestant | 0.32 | 0.34 | 0.26 | 0.27 |
| (0.01) | (0.01) | (0.02) | (0.01) | |
| Roman Catholic | 0.18 | 0.18 | 0.15 | 0.14 |
| (0.01) | (0.01) | (0.02) | (0.01) | |
| Marital status | ||||
| Divorced | 0.11 | 0.12 | 0.10 | 0.12 |
| (0.01) | (0.01) | (0.01) | (0.01) | |
| Married | 0.43 | 0.53 | 0.39 | 0.48 |
| (0.01) | (0.01) | (0.02) | (0.01) | |
| Never married | 0.35 | 0.26 | 0.39 | 0.30 |
| (0.01) | (0.01) | (0.02) | (0.01) | |
| Party identification | ||||
| Democrat | 0.37 | 0.35 | 0.51 | 0.54 |
| (0.01) | (0.01) | (0.02) | (0.01) | |
| Independent | 0.32 | 0.32 | 0.29 | 0.28 |
| (0.01) | (0.01) | (0.02) | (0.01) | |
| Republican | 0.31 | 0.33 | 0.20 | 0.18 |
| (0.01) | (0.01) | (0.02) | (0.01) | |
| Age | ||||
| 18-34 | 0.27 | 0.16 | 0.33 | 0.21 |
| (0.01) | (0.01) | (0.02) | (0.01) | |
| 35-54 | 0.33 | 0.34 | 0.31 | 0.37 |
| (0.01) | (0.01) | (0.02) | (0.01) | |
| 55-64 | 0.18 | 0.23 | 0.18 | 0.24 |
| (0.01) | (0.01) | (0.01) | (0.01) | |
| 65+ | 0.21 | 0.27 | 0.18 | 0.19 |
| (0.01) | (0.01) | (0.02) | (0.01) | |
| Sample size | ||||
| N | 4000 | 4000 | 1236 | 1236 |
| Weighted estimates use YouGov survey weights. Standard errors are in parentheses. | ||||
Enrollment and consumption over time
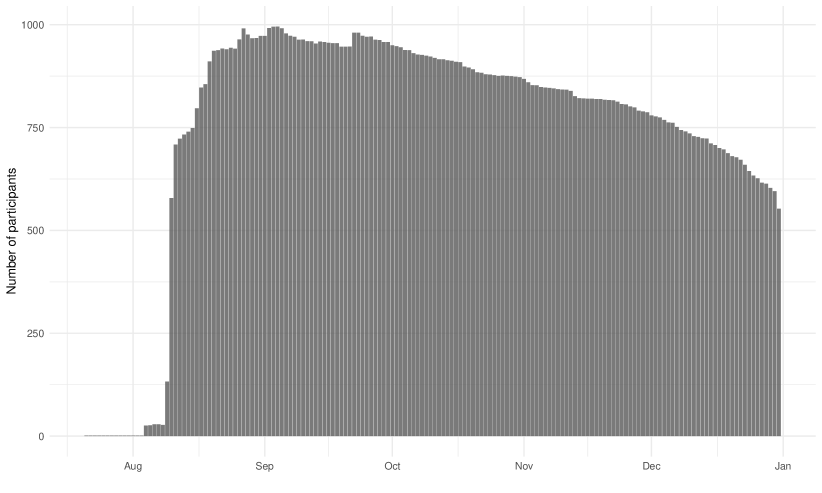
Day-level totals of the number of study participants with browser activity data. All results incorporate survey weights.
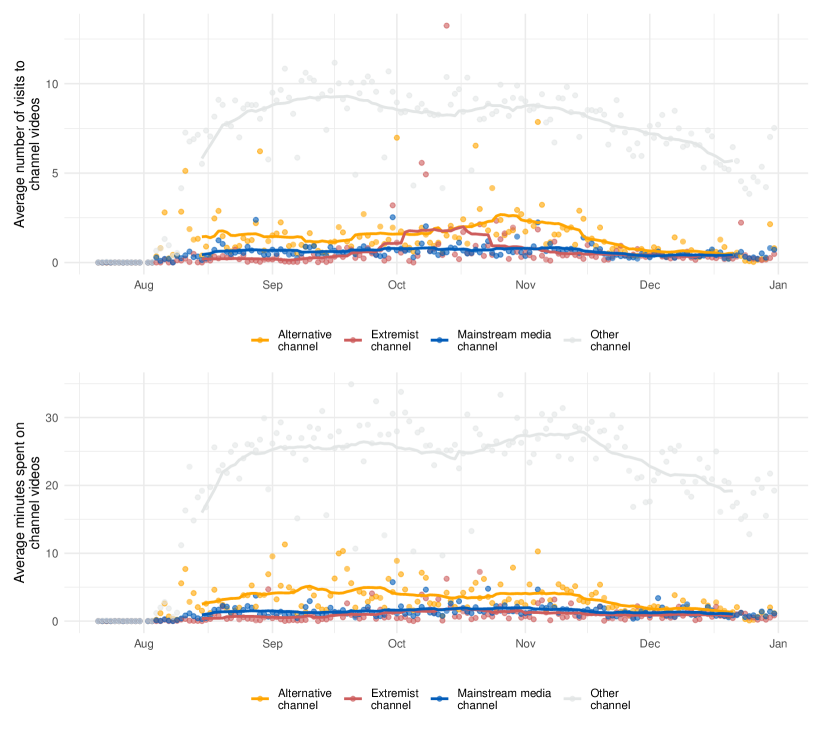
Each point represents the weighted mean number of views (top panel) or minutes spent (bottom panel) on videos from each channel type per day. Trend lines are three-week moving averages. All results incorporate survey weights.
All results incorporate survey weights.
All results incorporate survey weights.
Alternative and extremist superconsumers
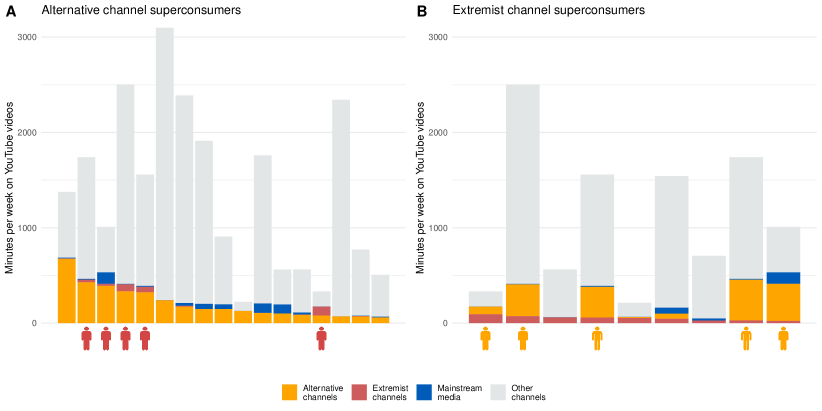
Total YouTube behavior of alternative (panel A) and extremist (panel B) superconsumers measured in minutes per week of video watch time. Each bar represents one individual and the height of the bar represents total view time of YouTube videos by channel type. The alternative superconsumers are ordered left to right by time spent on videos from alternative channels (orange portions of bars); the extremist superconsumers in the right panel are ordered left to right by time spent on videos from extremist channels (red portions of the bars). Red icons under bars in the left panel represent individuals who are also extremist superconsumers; orange icons under bars in the right panel represent individuals who are also alternative content superconsumers. All results incorporate survey weights.
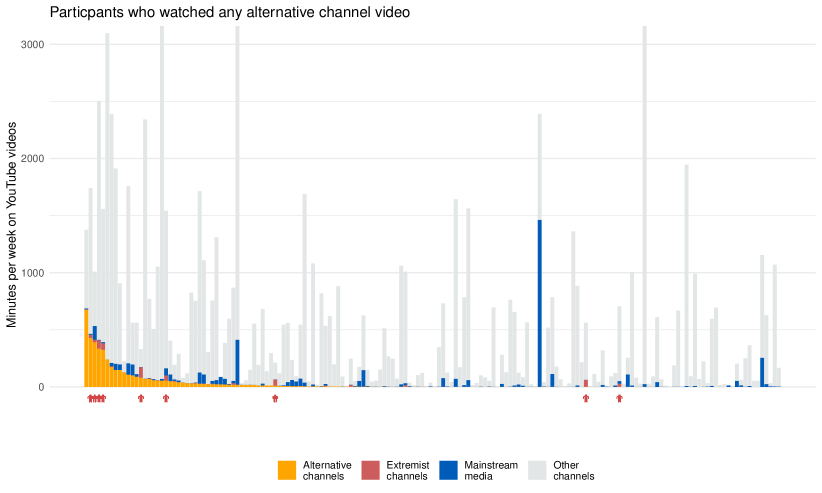
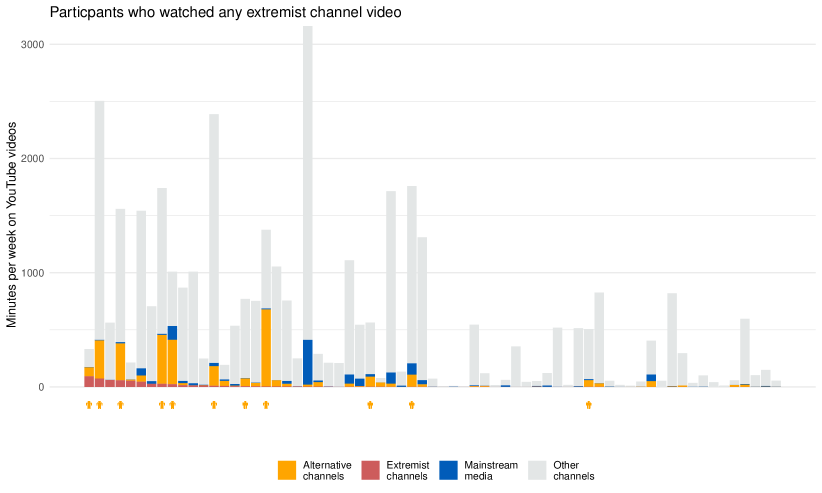
Figure S5 presents watch time totals for the people responsible for 80% of the viewership of videos from alternative and extremist channels in our sample. We note two facts about superconsumers. First, they often watch a great deal of YouTube. Alternative channel superconsumers spend a median of 29 hours each week watching YouTube, while the median time that extremist channel superconsumers spend watching is 16 hours per week. By comparison, the median time per week across all participants is 0.2 hours. Second, there is substantial overlap between the two sets of superconsumers, who represent just 2% of all participants. Figures S3 and S4 show the YouTube video diets by channel type for individuals who viewed any alternative or extremist channel video during the study.
Additional data on recommendations and referrers
Number of colored tiles shown are proportional to the proportion of recommendations followed to each type of video when watching videos from alternative, extremist, mainstream media, or other channels. Results are based on the full set of recommendations that we could extract from each video and incorporate survey weights.
Weighted proportion of each type of URL recorded immediately before viewing a YouTube video of a given channel type. Observations where the preceding link was not a YouTube video are shown in the “non-video, on-platform” and “off-platform” bars. (“Non-video, on-platform” referrers combines YouTube channel pages, YouTube homepage, and YouTube search.)
Additional regressions
The Poisson GLM for rates takes the form:
Let be either the expected number of minutes or the expected number of views of alternative, extremist, or mainstream media channel videos. is the total number of weeks we have activity data for user . indexes the predictors (racial resentment, hostile sexism, feelings toward Jews, age, gender, education, and race). Due to overdispersion in the data, we relax the mean-variance equivalence assumption () of Poisson models in which (dispersion) is restricted to 1 and estimate directly from the data through quasi-MLE.
Figure 3 in the main text and Table S2 below report quasipoisson estimates using this estimation approach for time spent on videos from alternative and extremist channels. Figure S8 and Table S3 report corresponding results from zero-inflated Poisson models in which the zero component is modelled with a Binomial regression and a secondary process generating the counts including zeros is governed by a Poisson model.
| Dependent variable: Time elapsed | |||
| Alternative | Extremist | Mainstream | |
| channel videos | channel videos | channel videos | |
| (1) | (2) | (3) | |
| Hostile sexism | |||
| Racial resentment | |||
| Feeling Jews | |||
| Age | |||
| Male | |||
| Non-white | |||
| Some college | |||
| Bachelor’s degree | |||
| Post-grad | |||
| Intercept | |||
| N | |||
| ; ; | |||
Quasipoisson coefficients for correlates of time per week spent on videos from alternative, extremist, and mainstream media channels. Robust standard errors are in parentheses.
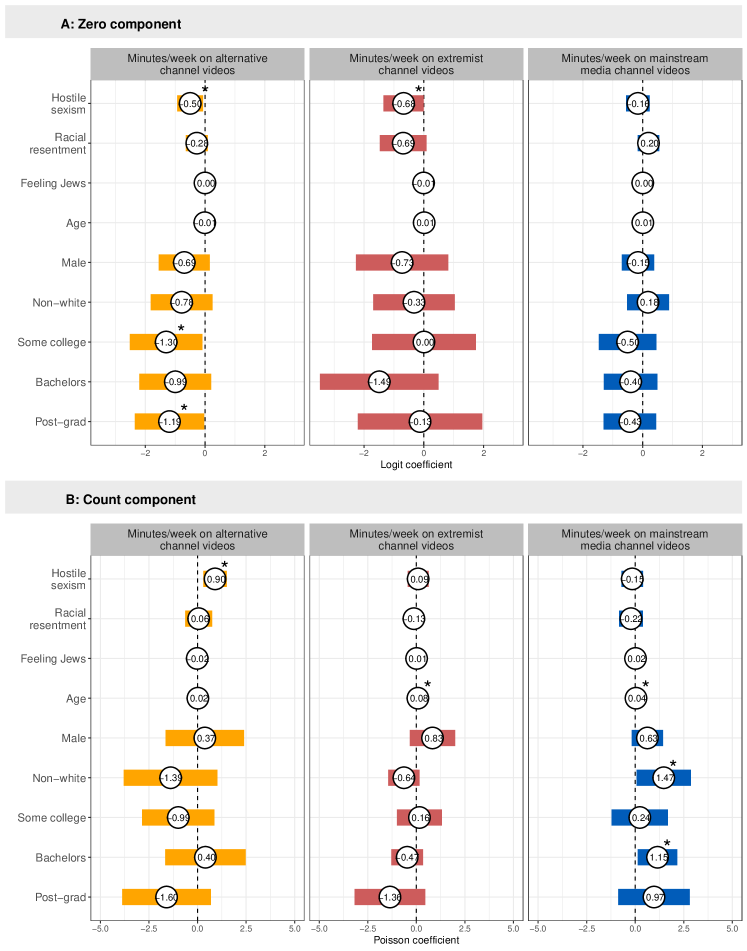
Zero-inflated Poisson coefficients for correlates of the time per week spent on videos from alternative, extremist, and mainstream media channels. Figure includes 95% confidence intervals calculated from robust standard errors. All results incorporate survey weights. Stars indicate coefficients that are significant at the level. See Table S3 for the regression table.
| Dependent variable: Time elapsed | |||
| Alternative | Extremist | Mainstream | |
| channel videos | channel videos | channel videos | |
| (1) | (2) | (3) | |
| Zero component | |||
| Hostile sexism | |||
| Racial resentment | |||
| Feeling Jews | |||
| Age | |||
| Male | |||
| Non-white | |||
| Some college | |||
| Bachelor’s degree | |||
| Post-grad | |||
| Intercept | |||
| Count component | |||
| Hostile sexism | |||
| Racial resentment | |||
| Feeling Jews | |||
| Age | |||
| Male | |||
| Non-white | |||
| Some college | |||
| Bachelor’s degree | |||
| Post-grad | |||
| Intercept | |||
| N | |||
Zero-inflated Poisson coefficients for correlates of the time per week spent on videos from alternative, extremist, and mainstream media channels. Robust standard errors are in parentheses.; ;
Figure S9 and Table S4 instead report quasipoisson estimates for the number of views of videos from alternative, extremist, and mainstream media channels (rather than time spent).
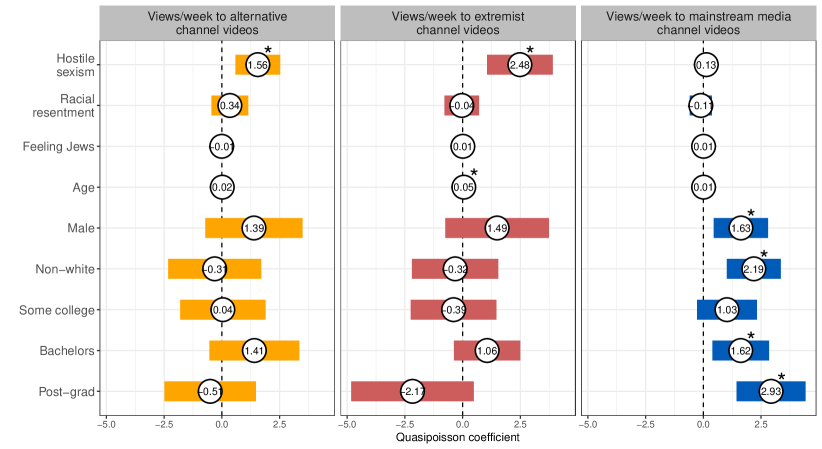
Quasipoisson regression coefficients for correlates of the number of respondent views per week of videos from alternative, extremist, and mainstream media channels. Figure includes 95% confidence intervals calculated from robust standard errors. All results incorporate survey weights. Stars indicate coefficients that are significant at the level. See Table S4 for the regression table.
| Dependent variable: Views | |||
| Alternative | Extremist | Mainstream | |
| (1) | (2) | (3) | |
| Hostile sexism | |||
| Racial resentment | |||
| Feeling Jews | |||
| Age | |||
| Male | |||
| Non-white | |||
| Some college | |||
| Bachelor’s degree | |||
| Post-grad | |||
| Intercept | |||
| N | |||
| ; ; | |||
Quasipoisson coefficients for correlates of views per week spent on videos from alternative, extremist, and mainstream media channels. Robust standard errors are in parentheses.
Due to concerns about post-treatment bias, we omit controls for party identification from the models reported in the main text. However, Figure S10 (Table S5) reports quasipoisson results mirroring those in Figure 3 (Table S2) and Figure S9 (Table S4) but which additionally control for Democratic and Republican self-identification (including leaners).
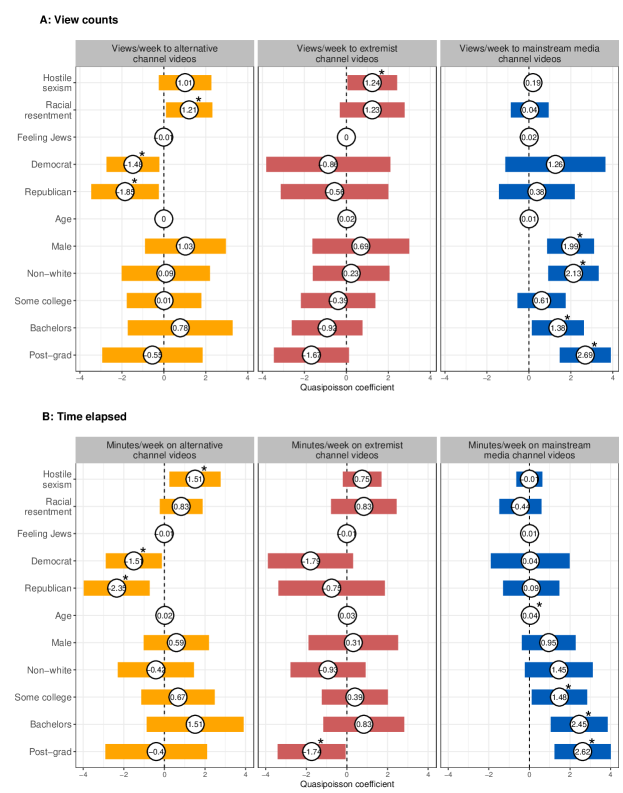
Quasipoisson regression coefficients for correlates of the number of respondent video views per week (panel A) and time spent (panel B) per week on videos from alternative, extremist, and mainstream media channels. Figure includes 95% confidence intervals calculated from robust standard errors. All results incorporate survey weights. See Table S5 for the regression table.
| Dependent variable: Views | Dependent variable: Time elapsed | |||||
| Alternative | Extremist | Mainstream | Alternative | Extremist | Mainstream | |
| (1) | (2) | (3) | (4) | (5) | (6) | |
| Hostile sexism | ||||||
| Racial resentment | ||||||
| Feeling Jews | ||||||
| Democrat | ||||||
| Republican | ||||||
| Age | ||||||
| Male | ||||||
| Non-white | ||||||
| Some college | ||||||
| Bachelor’s degree | ||||||
| Post-grad | ||||||
| Intercept | ||||||
| N | ||||||
| ; ; | ||||||
Quasipoisson models for correlates of views and time per week spent on videos from alternative, extremist, and mainstream media channels. Robust standard errors are in parentheses. All results incorporate survey weights.
Tables S6 and S7 report quasipoisson estimates in which racial resentment and hostile sexism are entered into separate models rather than jointly as presented above.
| Dependent variable: Time elapsed | ||||||
| Alternative | Extremist | Mainstream | ||||
| channel videos | channel videos | channel videos | ||||
| (1) | (2) | (3) | (4) | (5) | (6) | |
| Hostile sexism | ||||||
| Racial resentment | ||||||
| Feeling Jews | ||||||
| Age | ||||||
| Male | ||||||
| Non-white | ||||||
| Some college | ||||||
| Bachelor’s degree | ||||||
| Post-grad | ||||||
| Intercept | ||||||
| N | ||||||
| ; ; | ||||||
Quasipoisson coefficients for correlates of time per week spent on videos from alternative, extremist, and mainstream media channels. Robust standard errors are in parentheses. All results incorporate survey weights.
| Dependent variable: Views | ||||||
| Alternative | Extremist | Mainstream | ||||
| channel videos | channel videos | channel videos | ||||
| (1) | (2) | (3) | (4) | (5) | (6) | |
| Hostile sexism | ||||||
| Racial resentment | ||||||
| Feeling Jews | ||||||
| Age | ||||||
| Male | ||||||
| Non-white | ||||||
| Some college | ||||||
| Bachelor’s degree | ||||||
| Post-grad | ||||||
| Intercept | ||||||
| N | ||||||
| ; ; | ||||||
Quasipoisson coefficients for correlates of visits per week on videos from alternative, extremist, and mainstream media channels. Robust standard errors are in parentheses. All results incorporate survey weights.
Finally, we provide results in Figure S11 and Table S8 below in which we use survey respondents’ prior responses to two questions measuring denial of institutional racism (33) in the 2018 Cooperative Congressional Survey as an alternate measure of racial attitudes. Our findings are similar to those reported above using prior levels of racial resentment instead.
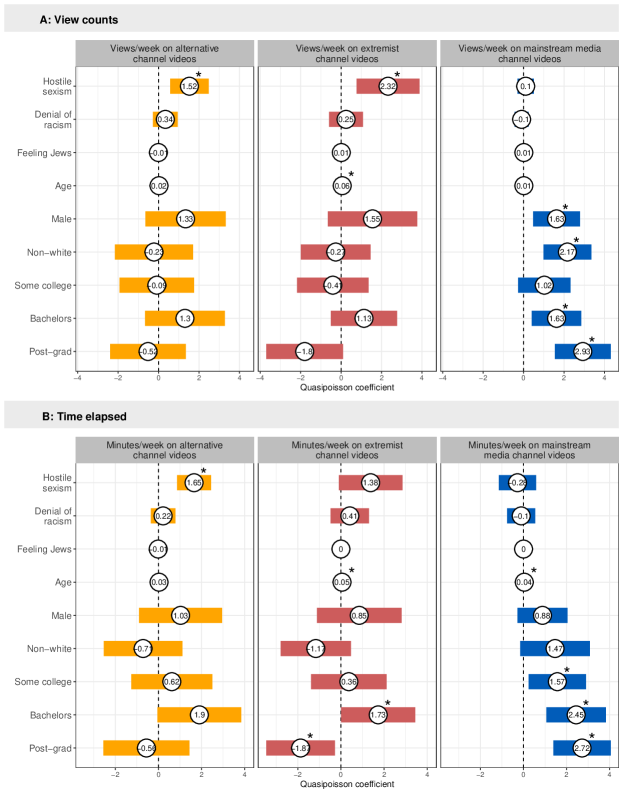
Quasipoisson regression coefficients for correlates of the number of respondent views and time spent per week on videos from alternative, extremist, and mainstream media channels. Figure includes 95% confidence intervals calculated from robust standard errors. All results incorporate survey weights. See Table S8 for regression table.
| Dependent variable: Views | Dependent variable: Time elapsed | |||||
| Alternative | Extremist | Mainstream | Alternative | Extremist | Mainstream | |
| (1) | (2) | (3) | (4) | (5) | (6) | |
| Hostile sexism | ||||||
| Denial of racism | ||||||
| Feeling Jews | ||||||
| Age | ||||||
| Male | ||||||
| Non-white | ||||||
| Some college | ||||||
| Bachelor’s degree | ||||||
| Post-grad | ||||||
| Intercept | ||||||
| N | ||||||
| ; ; | ||||||
Quasipoisson coefficients for correlates of of views and time per week spent on videos from alternative, extremist, and mainstream media channels. Robust standard errors are in parentheses.
Browser extension validation
Browser activity statistics are reported throughout the paper. Below, we evaluate the validity of browser activity by comparing it to browser history data. The browser extension also recorded participants’ browser history (URLs with timestamps that are recorded each time a participant loads a new web page). For comparability, we limit browser history data to the period for which both browser history and activity data are available.
Figure S12 shows the Pearson correlation coefficients between browser history and activity data across five variables for alternative, extremist, mainstream media, and other YouTube channels: a binary measure of viewing any video from that type of channel, the total number of views of videos from that type of channel, the total number of views of videos from subscribed channels of that type, the number of seconds elapsed on all YouTube videos from channels of that type, and the number of seconds elapsed on all YouTube videos from channels of that type. Correlations range from to and are consistently high for alternative channel videos () and extremist channel videos ().
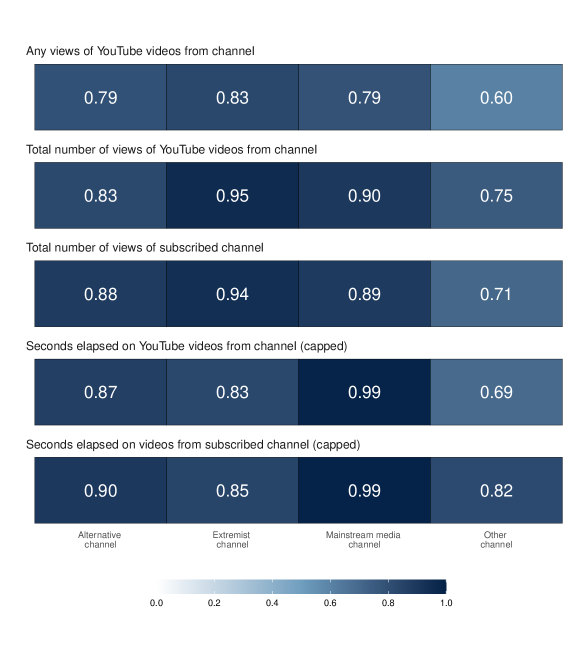
All results incorporate survey weights.
Differential browsing behavior after install
As shown in Table S9 below, we find no discernible change in the proportion of time that participants spent on alternative or extremist channels after installing the extension. We performed this analysis to verify that participants did not modify their web browsing behavior after installation, an important consideration in validating our measurement approach. Leveraging browser history data, which captures three months of web activity prior to the installation of the extension, we test if the proportion of time participants spend on alternative and extremist channels changes after installation in levels or slopes. Using OLS with robust standard errors clustered by participant, we estimate the two-way fixed effects model in Equation 1 where is a participant-level fixed effect (for each = 1, …, 1098), is a day-level fixed effect (for = Apr. 22, 2020, …, Dec. 31, 2020), and is a binary variable testing whether the mean proportion of time participants spend on alternative and extremist channels changes after installation. We also estimate the model in Equation 2 which adds the term to test for a linear time trend in alternative and extremist channel viewership after installation. The dependent variable in both models is the proportion of seconds spent on either alternative or extremist channel videos per day.
| (1) |
| (2) |
| (1) | (2) | |
| Installed | 0.00660 | 0.00627 |
| (0.00778) | (0.00789) | |
| Days after install | -0.00013 | |
| (0.00210) | ||
| Day fixed effects | ||
| User fixed effects | ||
| N | 63,216 | 63,216 |
OLS model results with robust standard errors clustered by participant in parentheses. Estimates include survey weights. ∗p0.1; ∗∗p0.05; ∗∗∗p0.01.
Attitudes toward YouTube
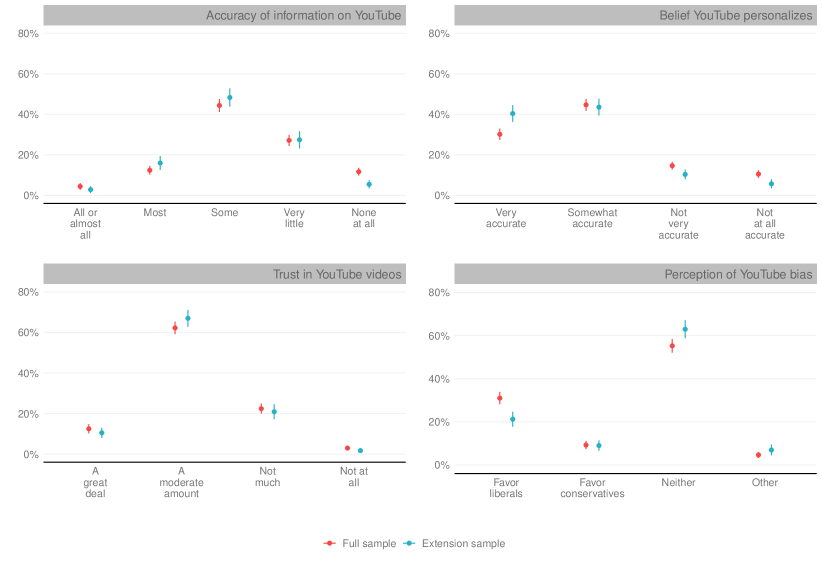
All results incorporate survey weights.
Session trajectories
We provide three examples of participant viewing paths that led to extremist channel videos in a manner consistent with the rabbit hole narrative below:
-
•
A participant conducted a search for an alternative channel’s name (Dinesh D’Souza), viewed a video from that channel, and then followed a recommendation to an extremist channel video (PragerU).
-
•
In another session, a participant visited the YouTube homepage, viewed a video from an “other” channel (English Heritage), then viewed a video from the alternative channel Carpe Donktum titled “Stop The Steal.us,” and then followed a recommendation to a video from the extremist channel Styxhexenhammer666 titled “MSM Hopes You’ll Just Accept the Election Despite Outstanding Evidence of Fraud.” Following that, the participant viewed a video from an “other” channel that is now private titled “Target Smart Early Voting Data Gives President Trump the Eventual Victory After Recounts.”
-
•
A participant viewed an other channel video (WIRED; “Every Race In Middle-Earth Explained”) and then followed a recommendation to an extremist channel video (Survive the Jive, “Ancient History of Ireland, Newgrange, Celts, Vikings”).
To test for “rabbit hole”-style patterns of exposure, we also consider whether YouTube users are more likely to encounter potentially harmful content in longer sessions (20). We construct sessions by separating a sorted timeline of respondents’ YouTube activity at each point at which they (1) dwell on a non-video URL (e.g., the YouTube homepage) for greater than 10 minutes, (2) spend longer than the duration of the video in question plus 30 minutes before interacting with the page, or (3) spend longer than four hours on a video. We call the number of YouTube videos between these breakpoints a session and define each session by its length (number of videos viewed).
First, we note several descriptive findings about YouTube sessions. They are relatively numerous—the median number of sessions for a participant is 19.4 during the study period—and frequently short. In total, 18.6% of sessions on YouTube do not include a video view, 15% are singletons in which respondents view just one video, and 42.1% include 2–10 videos. Just 24.3% of sessions have length 11 or longer. However, due to skewness in the distribution of YouTube consumption by session length, 77% of videos are watched in these sessions of length eleven or greater.
Figure S14 considers how the probability of viewing an alternative or extremist channel video varies by the point in a session over sessions of length 1–319 (the range of lengths that capture 99% of the sessions in our data). Each point in the graph represents the estimated probability of viewing a particular type of video at a particular session length. We find no clear evidence that the probability of viewing an alternative or extremist channel video increases as sessions lengthen; the probabilities are generally stable. The equivalent probability for mainstream media channel videos, which we provide for comparison, is also relatively stable.
Figure S15 instead examines whether the total proportion of videos watched from alternative and extremist channels by session is greater in longer sessions. A point represents the percentage of videos of a particular type that were watched in sessions of a given total length. We find no evidence that longer sessions have higher proportions of alternative or extremist channel videos.
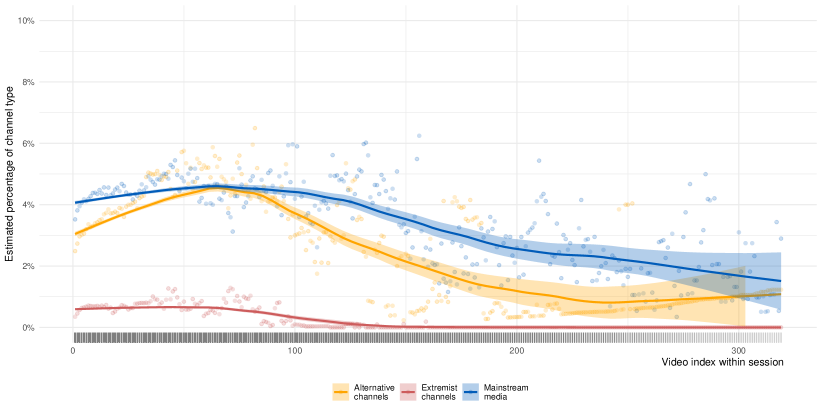
Each point represents the average percentage of videos from a channel type at a given session length. Lines are loess curves fit with a linear function and a 0.5 span. All results incorporate survey weights.
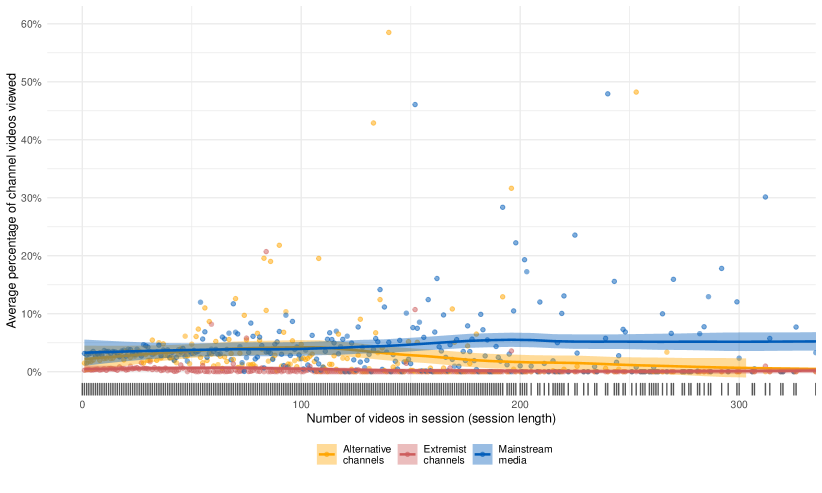
Each point represents the average percentage of videos from a channel type of all videos viewed in sessions of a fixed session length. Lines are loess curves fit with a linear function and a 0.5 span. All results incorporate survey weights.
External referrers
| Referrer type | Preceding domain | % to extremist channel | % to alternative channel |
|---|---|---|---|
| Alternative social | 4chan.org | 0.000 | 0.000 |
| banned.video | 0.000 | 0.008 | |
| parler.com | 0.159 | 0.556 | |
| gab.com | 0.384 | 0.476 | |
| boards.4chan.org | 1.524 | 1.400 | |
| boards.4channel.org | 5.007 | 2.116 | |
| twitchy.com | 14.154 | 0.479 | |
| Mainstream social | bumble.com | 0.000 | 0.035 |
| discord.com | 0.000 | 0.050 | |
| pinterest.com | 0.000 | 0.017 | |
| tumblr.com | 0.000 | 0.155 | |
| twitch.tv | 0.000 | 1.040 | |
| tinder.com | 0.030 | 0.245 | |
| apps.facebook.com | 0.160 | 0.345 | |
| instagram.com | 0.238 | 1.045 | |
| messenger.com | 0.506 | 1.166 | |
| linkedin.com | 0.515 | 0.069 | |
| reddit.com | 0.760 | 3.555 | |
| old.reddit.com | 2.861 | 3.497 | |
| facebook.com | 6.394 | 8.527 | |
| twitter.com | 12.095 | 14.975 | |
| Search engine social | search.yahoo.com | 0.000 | 0.050 |
| yahoo.com | 0.085 | 0.076 | |
| duckduckgo.com | 0.402 | 0.823 | |
| bing.com | 0.948 | 0.700 | |
| google.com | 8.237 | 8.033 | |
| Webmail | mail.com | 0.000 | 0.064 |
| outlook.office.com | 0.000 | 0.010 | |
| outlook.office365.com | 0.000 | 0.014 | |
| mail.aol.com | 0.088 | 0.217 | |
| outlook.live.com | 0.125 | 0.285 | |
| mail.yahoo.com | 0.863 | 1.444 | |
| mail.google.com | 2.289 | 3.926 |
All results incorporate survey weights.
Exposure concentration by views
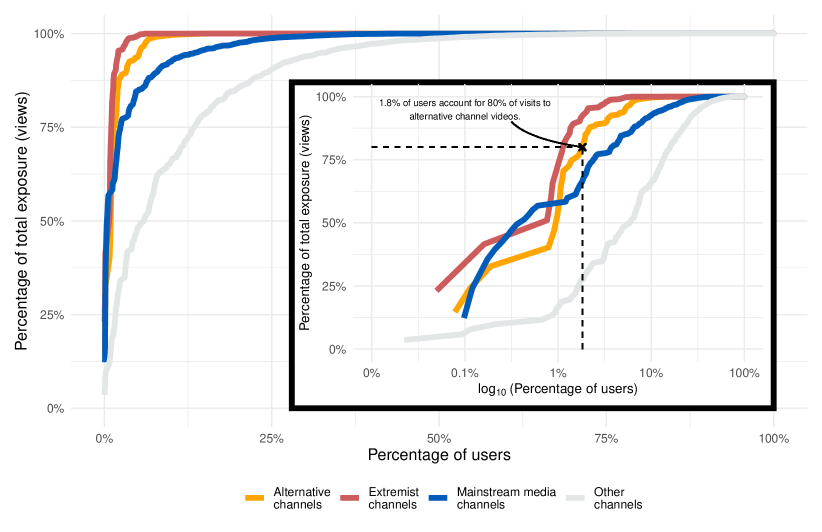
Weighted empirical cumulative distribution function showing the percentage of participants responsible for a given level of total observed video viewership of alternative and extremist channels on YouTube (by view count). All results incorporate survey weights.
Recommendations seen and followed by rank
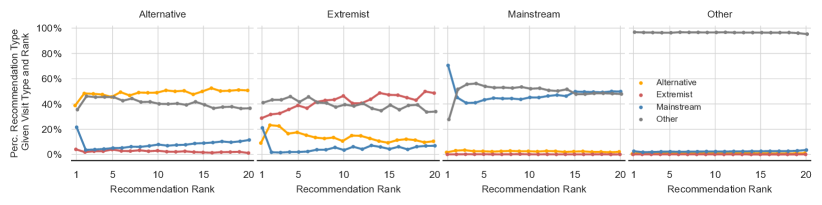
Video type recommended by rank when visiting a video of the channel type named at the top of the panel. The results incorporate survey weights.
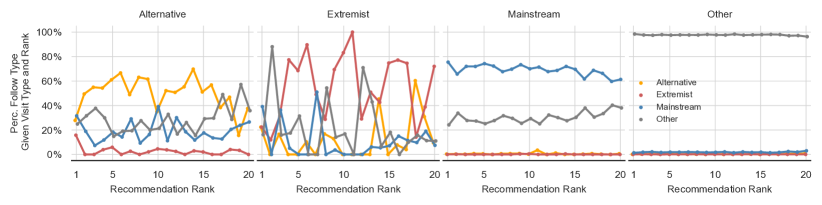
Video type recommendation follows by rank when visiting a video of the channel type named at the top of the panel. The results incorporate survey weights.
Channel labeling criteria
In this appendix, we aggregate the methods used by the authors of prior work to identify and label specific YouTube channels.
Ribeiro et al. (24)
Ribeiro et al. (24) used the following process to identify a set of channels:
(1) We choose a set of seed channels. Seeds were extracted from the I.D.W. unofficial website [7], Anti Defamation League’s report on the Alt-lite/the Alt-right [3] and Data & Society’s report on YouTube Radicalization [24]. We pick popular channels that are representative of the community we are interested in. Each seed was independently annotated two times and discarded in case there was any disagreement.
(2) We choose a set of keywords related to the sub-communities. For each keyword, we use YouTube’s search functionality and consider the first 200 results in English. We then add channels that broadly relate in topic to the community in question. For example, for the Alt-right, keywords included both terms associated with their narratives, such as The Jewish Question and White Genocide, as well as the names or nicknames of famous Alt-righters, such as weev and Christopher Cantwell.
(3) We iteratively search the related and featured channels collected in steps (1) and (2), adding relevant channels (as defined in 2). Note that these are two ways channel can link to each other. Featured channels may be chosen by YouTube content creators: if your friend has a channel and you want to support it, you can put it on your "Featured Channels" tab. Related channels are created by YouTube’s recommender system.
(4) We repeat step (3), iteratively collecting another hop of featured/recommended channels from those obtained in (3). The annotation process done here followed the same instructions as the one explained in detail for data collection step (c). Steps (2)–(4), were done by a co-author with more than 50 hours of watch-time of the communities of interest. Notice that, in steps (2)–(4), we are not labeling the channels, but creating a pool of channels to be further inspected and labeled in subsequent steps. The complete list of seeds obtained from (1) and of keywords used in (2) may be found in Appendix A. A clear distinction between featured and recommended channels may be found in Appendix B.
Ribeiro et al. used the following process to label and validate channels.
(c) Channel labeling was done in multiple steps. All channels are either seeds (Type 1) or obtained through YouTube’s recommendation/search engine (Types 2 and 3). Notice that Type 1 channels were assigned labels at the time of their collection. For the others, we had 2 of the authors annotate them carefully. They both had significant experience with the communities being studied, and were given the following instructions:
Carefully inspect each one of the channels in this table, taking a look at the most popular videos, and watching, altogether, at least 5 minutes of content from that channel. Then you should decide if the channel belongs to the Alt-right, the Alt-lite, the Intellectual Dark Web (I.D.W.), or whether you think it doesn’t fit any of the communities. To get a grasp on who belongs to the I.D.W., read [42], and check out the website with some of the alleged members of the group [7]. Yet, we ask you to consider the label holistically, including channels that have content from these creators and with a similar spirit to also belong in this category. To distinguish between the Alt-right and the Alt-lite, read [3] and [28]. It is important to stress the difference between civic nationalism and racial nationalism in that case. Please consider the Alt-right label only to the most extreme content. You are encouraged to search on the internet for the name of the content creator to help you make your decision.
The annotation process lasted for 3 weeks. In case they disagreed, they had to discuss the cases individually until a conclusion was reached. Interanotator agreement was of 75.57
Ledwich and Zaitsev (26)
Ledwich and Zaitsev (26) explain how they labeled YouTube channels:
The tagging process allowed each channel to be characterized by a maximum of four different tags to create meaningful and fair categories for the content. In addition to labeling created by the two authors, we recruited an additional volunteer labeler, who was well versed in the YouTube political sphere, and whom we trusted to label channels by their existing content accurately. When two or more labelers defined a channel by the same label, that label was assigned to the channel. When the labelers disagreed and ended in a draw situation, the tag was not assigned. The majority was needed for a tag to be applied.
…
To assign a label, we investigated which topics the channels discussed and from which perspective…The only way to conduct this labeling was to watch the content on the channels until the labelers found enough evidence for assigning specific labels. For some channels, this was relatively straightforward: the channels had introductory videos that stated their political perspectives …In other cases, the labelers could not assign a label based on introduction or description but had to watch several videos on the channel to determine the political leanings. On average, every labeler watched over 60 hours of YouTube videos to define the political leanings without miscategorizing the channel and thus misrepresenting the views of the content creators.
In their study, they label the following types of channels using the quoted criteria.
-
•
Anti-SJW: “Channel has to have a significant focus on criticizing “Social Justice” (see next category) with a positive view of the marketplace of ideas and discussing controversial topics. To tag a channel, this should be a common focus in their content.” Raters had 74% agreement on channels of this type.
-
•
MRA: “Focus on advocating for rights for men. See men as the oppressed sex and will focus on examples where men are currently oppressed. Incels, who identify as victims of sex inequality, would also be included in this category.” Raters had 97% agreement on channels of this type.
-
•
White Identitarian: “Identifies-with/is-proud-of the superiority of “whites” and Western Civilization.” Raters had 94% agreement on channels of this type.
Lewis (38)
Lewis (38) describes the following process for identifying and validating channels:
To understand the AIN in-depth, I analyzed both the content of YouTube influencers (that is, what they are saying) as well as their collaborations (who they are broadcasting with). The latter presented a significant research challenge, as YouTube does not provide metadata about guest appearances. To get around this, I manually collected data from each influencer’s video titles, and at times, video content, to determine each of the guests they hosted in their content between January 1, 2017 and April 1, 2018. I found new influencers through a snowball approach: for each guest on an influencer’s channel, I would visit their own channel (if one existed) to see who they, in turn, hosted.
Overall, I collected data for approximately 65 influencers across 81 channels …I watched content from each of these channels and performed an in-depth content analysis on the transcripts for two of them. Overall, I watched hundreds of hours of content from these 65 content creators.
At the time of data collection, this group of influencers was as close as I could get to a snapshot of the Alternative Influence Network. However, the boundaries of this network are loose and constantly changing. Since the time of my data collection, newly popular influencers have begun to collaborate with others in the network, and some of those I tracked in April have since deleted their channels or removed their content. The data also does not represent the full extent of networking and collaboration that occurs between influencers. Many of them, for example, comment on each other’s videos; they reference each other’s ideas in their content; and they interact on platforms like Twitter and Instagram in addition to YouTube. In other words, the data I collected is illustrative, not comprehensive.
Charles (39)
Charles (39) describes the following process for identifying and labeling channels:
The first step was to identify a network of channels containing white supremacist content on YouTube, and then to analyze a representative sample of the themes, rhetoric, messaging, presentation in the videos uploaded to those channels. In the first stage, I gathered channels via user interface snowball sampling, using the ‘related channel’ feature on each channel—as well as any cross-channel appearances by content creators. Channels were tagged and categorized, then ranked by subscriber count within those categories.
…
The first stage of this study used a modified style of snowball sampling, called user interface snowball sampling (UISS), to build a repository of YouTube channels for stage two’s analysis …Rather than using recommendations from gatekeepers, this study uses the ‘related channels’ bar to find similar channels, as well as channels whose content creators appear in the videos of that channel. As more channels were found, I stopped periodically to analyze each channel for white supremacist themes (see Table 1). In order to be considered for analysis, the channel had to include at least one of the themes from Table 1.
The initial categorization was performed using six sampled videos: the two most viewed, the two most recently uploaded, and two randomly selected from the hundred most recent uploads (using a random number generator). This approach aimed to represent the nature of the content on that channel, determining whether it contains any of the white supremacist themes described in the literature. Channel samples that did not contain any of these themes were excluded from analysis and their related channels were not snowballed. The process was repeated until the point of data saturation (Schensul & LeCompte, 2010). This was apparent by generation four when already-sampled channels began to dominate the related channels sections and when the few, new channels were so low in subscribers that they would not make the final cut in stage two.
…
[T]he study started with avowed white nationalist Richard Spencer’s YouTube channel, AltRight.com and proceeded from there, using YouTube’s related channel feature and cross-channel appearances to approximate the size and composition of white supremacist communities on YouTube.
Charles used the following themes to identify channels (drawn from Table 1 in (39)): Neo-Nazi, Nationalism, Genocide, Christian Identity/Racist Asatru, Opposition to Interracial Marriage, White Pro-nationalism, Islamophobia, Anti-Feminism, Non-white Criminality, Anti-Immigrant, White Supremacy, Anti-Semitism, Conspiracies, Apocalypticism.
Aaron Sankin (40)
Journalist Aaron Sankin (40) describes the following process for curating and validating a list of extremist channels:
[W]e used lists of organizations promoting hate from the Southern Poverty Law Center, Hope Not Hate, the Canadian Anti-Hate Network, and the Counter Extremism Project, in addition to channels recommended on the white supremacist forum Stormfront, to create a compendium of 226 extremist YouTube channels earlier this year.
While less than scientific (and suffering from a definite selection bias), this list of channels provided a hazy window to watch what YouTube’s promises to counteract hate looked like in practice. And since June 5th, just 31 channels from our list of more than 200 have been terminated for hate speech. (Eight others were either banned before this date or went offline for unspecified reasons.)
Before publishing this story, we shared our list with Google, which told us almost 60 percent of the channels on it have had at least one video removed, with more than 3,000 individual videos removed from them in total. The company also emphasized it was still ramping up enforcement. These numbers, however, suggest YouTube is aware of many of the hate speech issues concerning the remaining 187 channels—and has allowed them to stay active.
Ethics and consent language
Survey informed consent
This research project is being conducted by Andrew Guess from Princeton University, Brendan Nyhan from Dartmouth College, and Christo Wilson from Northeastern University. It is a study to learn more about public opinion on issues in the news. Your participation is voluntary. Participation involves completion of a short survey as well as the option to participate in additional components of the study that would collect confidential data on your online behavior. This would entail confidential tracking data of your online website visits which you have already agreed to as part of your YouGov Pulse participation, and could include up to 1 year of data already collected prior to this survey. You may choose to not answer any or all questions and to not participate in any portion of the study that you choose. The researchers will not store information that could identify you with your survey responses. Identifying information will not be used in any presentation or publication written about this project. You must be age 18 or older to participate. Questions about this project may be directed to Brendan Nyhan, Professor of Government, at Brendan.J.Nyhan@dartmouth.edu.
If you agree to participate in this survey, click “I agree” below.
-I agree to participate
-I do not agree to participate
Browser extension informed consent (invitation)
This extension implements a user study being conducted by researchers at Northeastern University, Dartmouth, Princeton, and University of Exeter. If you choose to participate, this browser extension will confidentially collect four types of data from your browser.
1. Metadata for web browsing (e.g. URL visited with time of visit), exposure to embedded URLs on websites (e.g. YouTube videos), and interactions with websites (e.g. clicks and video viewing time). This data is collected until the study is completed.
2. Copies of the HTML seen on specific sites: Google Search, Google News, YouTube, Facebook Newsfeed, and Twitter Feed. We remove all identifying information before it leaves the browser. This confidential data is collected until the study is completed.
3. Browsing history, Google and YouTube account histories (e.g. searches, comments, clicks), and online advertising preferences (Google, Bluekai, Facebook). This data is initially collected for the year prior to the installation of our browser extension, and we then check these sources once every two weeks to collect updates until the study is completed.
4. Snapshots of selected URLs from your browser. For each URL, the extension saves a copy of the HTML that renders, effectively capturing what you would have seen had you visited that website yourself. Once per week we conduct searches on Google Search, Google News, Youtube, and Twitter, and collect the current frontpage of Google News, YouTube, and Twitter. These web page visits will occur in the background and will not affect the normal functioning of your browser.
Additionally, if you choose to participate, you will be asked to take a survey in which we ask you several questions about your demographics, web usage, and media preferences. These data, as well as those mentioned above, will be used to analyze the correlations between your online behavior and your interest profiles.
After the study is complete on December 31, 2020, the extension will uninstall itself. All data collected will be kept strictly confidential and used for research purposes only. We will not share your responses with anyone who is not involved in this research.
Minimizing risks: None of the raw data collected through our browser extension during this study will be publicly released, and the survey data will not be given or sold to a third party without the panelist’s consent. All raw data will be stored on a secure server at Northeastern University, and access to that server will be limited to members of the research group. Only aggregated data will be released, which minimizes the possibility of reidentification. All data that is collected from our survey and from participants’ browsers will be stripped of personally identifiable information to the best of our ability.
The decision to participate in this research project is voluntary. You do not have to participate, and there is no penalty if you choose not to participate in this research or if you choose to stop participating. You may choose to stop participating at any time, and you may request that we delete all data collected from your browser.
Browser extension informed consent (installation page)
Welcome to the study!
This extension implements a user study being conducted by researchers at Northeastern University, Dartmouth, Princeton, and the University of Exeter. If you choose to participate, this browser extension will confidentially collect four types of data from your browser.
1. Metadata for web browsing (e.g. URL visited with time of visit), exposure to embedded URLs on websites (e.g. YouTube videos), and interactions with websites (e.g. clicks and video viewing time). This data is collected until the study is completed.
2. Copies of the HTML seen on specific sites: Google Search, Google News, YouTube, Facebook Newsfeed, and Twitter Feed. We remove all identifying information before it leaves the browser. This confidential data is collected until the study is completed.
3. Browsing history, Google and YouTube account histories (e.g. searches, comments, clicks), and online advertising preferences (Google, Bluekai, Facebook). This data is initially collected for the year prior to the installation of our browser extension, and we then check these sources once every two weeks to collect updates until the study is completed.
4. Snapshots of selected URLs from your browser. For each URL, the extension saves a copy of the HTML that renders, effectively capturing what you would have seen had you visited that website yourself. Once per week we conduct searches on Google Search, Google News, YouTube, and Twitter, and collect the current frontpage of Google News, YouTube, and Twitter. These web page visits will occur in the background and will not affect the normal functioning of your browser. There is a theoretical risk of “profile pollution” – that this extension will impact your online profiles, i.e., “pollute” them with actions that you did not take. To mitigate this risk, the extension will only visit content that is benign and will only execute searches for general terms. Our previous work has found that historical information of this kind has minimal impact on online services.
Additionally, if you choose to participate, you will be asked to take a survey in which we ask you several questions about your demographics, web usage, and media preferences. These data, as well as those mentioned above, will be used to analyze the correlations between your online behavior and your interest profiles.
After the study is complete on December 31, 2020, the extension will uninstall itself. All data collected will be kept strictly confidential and used for research purposes only. We will not share your responses with anyone who is not involved in this research.
You must be at least 18 years old to take part in this study. The decision to participate in this research project is voluntary. You do not have to participant and you can refuse to participate. Even if you begin our experiment, you can stop at any time. You may request that we delete all data collected from your web browser at any time.
We have minimized the risks. We are collecting basic demographic information, information about your internet habits, and copies of web pages that you visit. To the greatest extent possible, information that identifies you will be removed from all collected web data.
Your role in this study is confidential. However, because of the nature of electronic systems, it is possible, though unlikely, that respondents could be identified by some electronic record associated with the response. Neither the researchers nor anyone involved with this study will be collecting those data. Any reports or publications based on this research will use only aggregate data and will not identify you or any individual as being affiliated with this project.
Survey codebook
See pages - of DART0034_codebook.pdf