Temperature induced modulation of resonant Raman scattering in bilayer 2H-MoS2
Abstract
The temperature evolution of the resonant Raman scattering from high-quality bilayer 2H-MoS2 encapsulated in hexagonal BN flakes is presented. The observed resonant Raman scattering spectrum as initiated by the laser energy of 1.96 eV, close to the A excitonic resonance, shows rich and distinct vibrational features that are otherwise not observed in non-resonant scattering. The appearance of 1st and 2nd order phonon modes is unambiguously observed in a broad range of temperatures from 5 K to 320 K. The spectrum includes the Raman-active modes, E() and A() along with their Davydov-split counterparts, E() and B(). The temperature evolution of the Raman scattering spectrum brings forward key observations, as the integrated intensity profiles of different phonon modes show diverse trends. The Raman-active A1g() mode, which dominates the Raman scattering spectrum at =5 K quenches with increasing temperature. Surprisingly, at room temperature the B() mode, which is infrared-active in the bilayer, is substantially stronger than its nominally Raman-active A() counterpart.
I Introduction
Two-dimensional (2D) semiconducting transition metal dichalcogenides (S-TMDs) have attracted significant attention in the last decade due to the thickness dependent electronic band structure that allows for at-will manipulation of optical and opto-electronic properties Lopez-Sanchez et al. (2013); Jo et al. (2014); Mak and Shan (2016); Zhu et al. (2016); Yan et al. (2017). Novel configurations employing monolayers and van der Waals (vdW) heterostructures Yu et al. (2015); Deng et al. (2016); Liao et al. (2019) have emerged as promising platforms for the development of cutting-edge technology spanning across a broad spectrum that include but is not limited to quantum information processing He et al. (2015); Schaibley et al. (2016) spintronics, Cortés et al. (2019); Ciorciaro et al. (2020), nanophotonics Bhatnagar et al. (2020); Mennucci et al. (2021); Bhatnagar et al. (2021) and twistronics Carr et al. (2017); Chendong et al. (2017). From the perspective to study lattice dynamics, non-invasive Raman scattering (RS) spectroscopy has emerged as a pivotal tool to uncover the physics of vibrational and electronic properties of 2D S-TMDs Lee et al. (2010); Tonndorf et al. (2013); Placidi et al. (2015); Grzeszczyk et al. (2016); Zhang et al. (2018); van Baren et al. (2019); Kipczak et al. (2020). In particular, the RS spectrum of the bilayer (BL) MoS2, which is one of the simplest prototypes of a multilayer van der Waals structure, uncovers several intriguing features Huang et al. (2016); Yang et al. (2016); Park et al. (2016); Lee et al. (2017); Lin et al. (2018); Sarkar et al. (2019); Debnath et al. (2020); Kim et al. (2020, 2021); Grzeszczyk et al. (2021). The RS spectrum becomes especially rich under resonant excitation conditions. The resonant RS was extensively used to study the characteristics of phonon modes in MoS2. The corresponding RS spectrum comprises in particular double resonance Raman bands, second-order scattering features and Davydov-split pairs Sekine et al. (1984); Gołasa et al. (2014, 2014); Na et al. (2018); Shinde and Eswaran (2021). The application of electric field Lu et al. (2017); Klein et al. (2021) or a variation of temperature Gontijo et al. (2019); Livneh and Sterer (2010); Kumar et al. (2021) become key factors to modulate the electron-phonon coupling within the active 2D layer. The latter studies, however, usually do not employ temperatures below those of liquid nitrogen. To our knowledge, there are no reports on the temperature-dependent resonant RS for BL 2H-MoS2 at temperature down to =5 K. To fill the gap, we report on the effects observed through temperature-dependent resonant RS in high-quality BL 2H-MoS2 encapsulated in hexagonal BN (hBN) flakes. It well known in the literature that hBN encapsulation of MoS2 bilayers results in a substantial increase in their quality, manifested in , observation of interlayer excitons, see Refs. 45; 46; 34. The evolution of the exciton emission energy on temperature as obtained through photoluminescence (PL) measurements allowed us to extract the relative energy difference between the dominant A exciton and the excitation source. This facilitates studies of the effect of the energy difference on the RS spectrum. The phonon dispersion, calculated using Density Functional Theory (DFT) reveals the presence of both the Raman- and infrared-active modes that corroborate well with the experiment. We demonstrate a temperature-dependent tuning of the integrated intensity profile of the lattice vibrations. The interplay between the intensity of the Raman-active out-of-plane A mode and its Davydov-split B counterpart is observed. Surprisingly, the temperature-activated quenching of the A mode with respect to the B mode results in the intensity crossover at 220 K. The observed results also point to the diverse trends for scattering from different phonon modes from the same points in the Brillouin zone (BZ).
II Results and Discussion
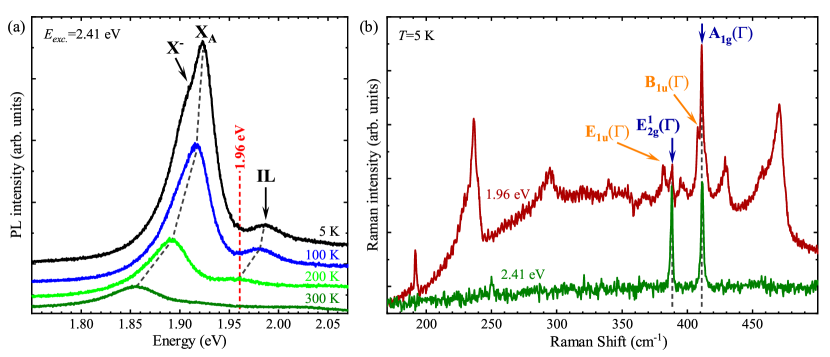
It has been well established in the literature that the RS in thin S-TMD layers can be significantly enhanced due to an electron-phonon coupling in the vicinity of excitonic resonances, particularly the so-called A exciton Carvalho et al. (2015); Molas et al. (2017); Zinkiewicz et al. (2019); Shinde and Eswaran (2021). In order to study the effect of resonant conditions on the RS in the MoS2 BL, the temperature evolution of the PL spectra is measured in a broad range of temperature from =5 K to 320 K. Note that the Raman measurements were carried out on the flat regions of the investigated sample (bubble-free and wrinkles free), see Fig. S1 in the Supplementary Information (SI) for optical and atomic force microscope (AFM) images. The PL spectra measured at selected temperatures are shown in Fig. 1(a), while the full set of the measured PL spectra is presented in Fig. S2(a) of the SI. The low temperature (=5 K) PL spectrum comprises of three distinct emission lines. They are ascribed to the negatively charged (X-), neutral (XA), and interlayer excitons (IL) formed in the vicinity of the A exciton Kümmell et al. (2015); Niehues et al. (2019); Leisgang et al. (2020); Grzeszczyk et al. (2021). It can be seen that the temperature increase from 5 K to 300 K leads to the red shift of their emission energies, accompanied by the reduction in the corresponding intensities. In particular, the XA line remains dominant of all three resonances up to 300 K, while the X- and IL lines can be resolved only up to about 100 K and 230 K, respectively. It is interesting to note that the IL emission energy shifts across the excitation energy (1.96 eV) used for resonant excitation of RS. To study the effect of temperature on resonant excitation, we analyse the temperature evolution of the relative energy, E, defined as the difference between the energy of the resonant excitation (1.96 eV) and of the XA line. Fig. S2(a) in the SI shows the temperature dependence of the XA energy that has been extracted from the PL measurements accompanied by its fitting using the Varshni equation Varshni (1967).
The group theory formalism reveals rich information on crystal symmetry that can be decoded by studying lattice vibrational modes in 2D materials Scheuschner et al. (2015a); Molina-Sánchez et al. (2015). The crystal structure for BL belongs to the space group P m1, 164 (point group D) Scheuschner et al. (2015b); Kumar et al. (2021) and the normal modes of lattice vibrations at the point can be expressed by the following irreducible representation: 3A + 3E + 3A + 3E. The normal modes in BL correspond to those of the bulk 2H-MoS2, although the point groups in both cases are different. The main rotation axis is sixfold in bulk and not threefold as in BL Scheuschner et al. (2015a). As a result, restricting to optical modes, the normal modes of lattice vibrations at the point in bulk can be expressed by the following irreducible representation Cai et al. (2014): 2B(A)+A(A)+E(E)+A(A)+B(A)+ E(E)+E(E)+2E(E). The corresponding notation for the BL symmetry is shown in parentheses. For example, one of the results of the connection between the BL and the bulk is the brightening of bulk-inactive Raman modes in the BL limit previously observed in thin layers of 2H-MoTe2 Grzeszczyk et al. (2018). Therefore, in the following we will refer to the observed Raman modes using the bulk-related representations, as is usually done in the literature.
The non-resonant and resonant RS spectra measured on BL MoS2 at =5 K are shown in Fig. 1(b). The increased intensity of phonon scattering at non-standard energies in resonant RS and its complexity compared to non-resonant RS can be related to the proximity of the excitation energy (1.96 eV) to the energy of the A exciton, as was reported earlier Carvalho et al. (2015); Scheuschner et al. (2015a). At =5 K, the resonant excitation energy (1.96 eV) is larger by about 34 meV than the XA energy, which corresponds to E of about 276 cm-1. Consequently, the resonant RS spectrum is superimposed over a background due to the XA emission, which is not present for the non-resonant case. The temperature dependence of the observed RS modes will be discussed in the following section.
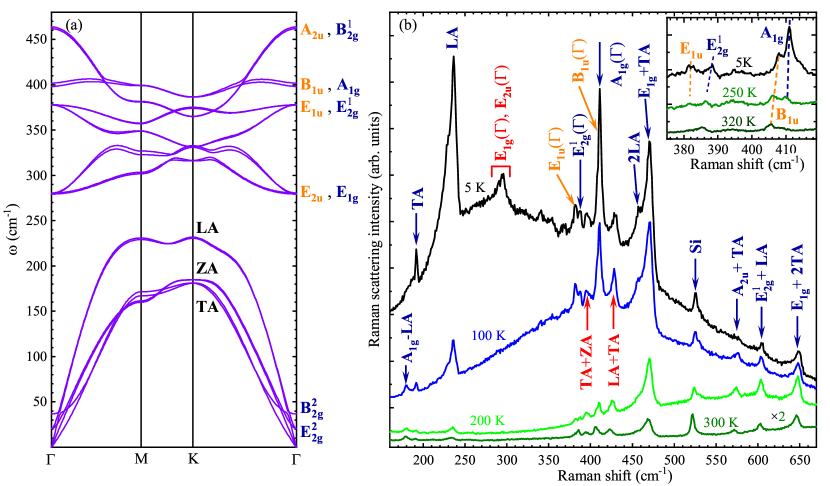
The calculated phonon dispersion for 2H-MoS2 BL is presented in Fig. 2(a), while the density of phonon states with division into sulfur and molybdenum contributions are shown in Fig. S3 of the SI. The phonon modes at the point of the BZ marked with blue represent Raman active modes, while infrared active lattice vibrations are denoted by orange color. The phonon dispersion is used to investigate in detail the Raman peaks observed in the RS spectra measured as a function of temperature. Fig. 2(b) presents the RS spectra at selected temperatures under resonant excitation of 1.96 eV. Let us focus first on the low-temperature (=5 K) RS spectrum. The assignment of most of the Raman peaks, denoted by blue and orange colors, is clear and can be made in reference to the literature Gołasa et al. (2014); Chakraborty et al. (2013); Lee et al. (2015); Shinde and Eswaran (2021). The spectrum includes the aforementioned peaks related to both the Raman-active modes, E() and A(), as well as their infrared-active counterparts, E() and B(). The energy difference between the two out-of-plane modes A() and B() is approximately 3 cm-1, corresponding well to the Davydov splitting of the modes reported earlier Na et al. (2018); Shinde and Eswaran (2021), which supports its attribution. The observation of the infrared-active peaks in the RS spectrum is ascribed to the resonant conditions of the laser excitation. The A(M)-LA(M) mode at 180 cm-1 is only observed at a temperature higher than 100 K, which corresponds to its differential character Gołasa et al. (2014). As can be appreciated in 2(a), there are no zone-center modes in the energy range below 280 cm-1 except for the low-energy shear and breathing modes. This points out to the zone-edge TA or ZA acoustic phonons most likely around the K point of the BZ as a possible origin of the mode observed at 191 cm-1 Shinde and Eswaran (2021). Similarly, the mode at 231 cm-1 is most likely related to the LA mode at the M and/or K points of the BZ. The presence of the zone-edge modes in the RS spectrum is usually related to the disorder in the structure, which leads to the phonon localization and the breaking of Raman momentum conservation in the scattering processGołasa et al. (2015). However, their temperature-induced quenching suggests a more complicated process involving the modification of the electron-phonon coupling, which modifies momentum conservation in the resonant RS. The inspection of the phonon dispersion (see Fig. 2 (a)) also allows us to propose the attribution of the mode at 290 cm-1 to the E/E zone-centre modes. The calculations also allow us to propose the assignment of the TA+ZA mode at 397 cm-1 and the TA+LA mode at 429 cm-1. The 2LA branch observed at 462 cm-1 is coupled with E(M)+TA(M) at 470 cm-1 Gołasa et al. (2014); Lee et al. (2015); Kumar et al. (2021). In the frequency range of 570 cm-1 to 650 cm-1, the series of Raman-active modes due to two-phonon scattering processes can be distinguished: A(M)+TA(M) at 577 cm-1, E(M)+LA(M) at 604 cm-1, A(M)+LA(M) at 640 cm-1, and E(M) + 2TA(M) at 650 cm-1, which is consistent with previous reports Gołasa et al. (2014); Lee et al. (2015); Kumar et al. (2021). The temperature-dependent Raman spectrum under non-resonant conditions is composed only of the two characteristic A and E modes throughout the measured energy range (see Fig. S4(a) of the SI), while Fig. S4(b) presents the variation in the intensity of these two modes with the change in temperature.
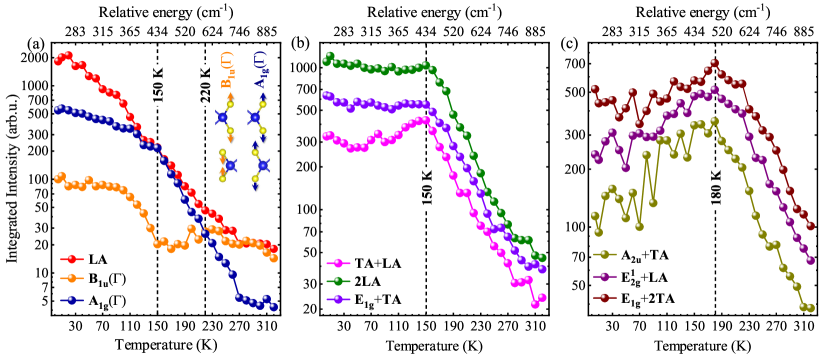
To gain further insight into the temperature evolution of the observed phonon modes, we performed a detailed analysis of their integrated intensity profiles. The specific peaks were fitted with Gaussian functions combined with a linear function to take into account the variation in the background intensity. The obtained intensity profiles of 9 peaks are presented in Fig. 3 as a function of temperature (bottom axis) and relative E energy (top axis). The conversion of the relative energy (eV) into cm-1 further facilitates to understand the role of exciton influence on to the vibration energy of the observed Raman modes. The profiles are grouped into three panels according to the observed temperature evolution. Let us focus on the temperature dependence of the intensity of the LA mode, shown in Fig. 3(a). Its intensity reveals a quick exponential decay of about 2 orders of magnitude in the temperature range from 5 K to 320 K (note logarithmic scale of the vertical axis). A similar exponential decay is observed for the A() mode with a decrease of about 2 orders of magnitude from 5 K to 320 K. The analogous temperature evolution was reported for the A mode in monolayer MoS2 Molas et al. (2019). The temperature evolution of the infrared B() counterpart warrants attention as it displays a unique temperature dependence. A decrease in the intensity of the B() mode is observed up to about 150 K, which is followed by an almost constant intensity at higher temperatures. Surprisingly, the A() intensity is of about 5 times larger as compared to the B() one at =5 K, then both intensities are almost equal at =220 K, ending with about 3 times smaller intensity of A() mode as compared to the B() one. One can conclude that at low temperature the main contribution for that Davydov pair originates from the Raman-active A() peak, while at room temperature the corresponding RS peak is dominated by the infrared-active B() mode. The latter effect is different from the room temperature results on the flakes deposited on SiO2/Si substrates, as the B() is hardly observed in the RS spectra for BLs at room temperature Chakraborty et al. (2013); Gołasa et al. (2014). This intensity switching between the A() and B() intensities is similar to the observation made from electric-field dependent RS in BL 2H-MoS2 Klein et al. (2021). It was observed that the applied electric field provided enhanced electronic transitions from the dark Q valley to the bright K valley in the BZ due to breaking of crystal symmetry. This was because there is a strong delocalisation of the electron population in the conduction band at the high symmetry Q valley in both the layers and on application of an electric field, the formation of intralayer and interlayer excitons is facilitated by modifying the exciton population that leads to changes in the electron-phonon coupling. In our case, similarly, the strength of the electron-phonon coupling is modified by the variation of the temperature, which is discussed in the following.
In order to understand the effect of temperature on the phonon intensities, we investigate the intensity profiles of 6 other phonon modes, see Fig. 3(b) and (c). The temperature evolutions of the intensity profiles of TA+LA, 2LA, and E + TA peaks are very similar (see Fig. 3(b)). For the TA+LA mode, we observe a small increase in its intensity to about 150 K, which is followed by a quick exponential decay of almost 20 times in the temperature range from 150 K to 320 K. In the case of the 2LA and E+TA modes, their intensities are almost constant to around 150 K and then they experience an analogous quick exponential decrease of about 15-20 times with increasing temperature to 320 K. It should be noted that =150 K corresponds to a relative energy of about 430 cm-1, which is reasonably close to the energy of the TA+LA mode (429 cm-1), while 2LA and E+TA are at about 462 cm-1 and 470 cm-1, respectively. In our opinion, the similarity of the TA+LA energy and the relative energy of the 150 K is coincidental. We also analyse the intensity evolution of the A+TA, E+LA and E+2TA peaks as a function of temperature, shown in Fig. 3(c). The intensities of those three lines follow the same pattern. An increase in their intensities is observed up to about 180 K, which is followed by exponential decay at higher temperatures. The temperature 180 K, corresponding to the relative energy of about 500 cm-1, does not match the energies of the three peaks analyzed, which are in the range from 550 cm-1 to 650 cm-1. This suggests that the effect of temperature on the resonant conditions of RS is more complex compared to the results of the RS excitation technique, where the laser energy is tuned in reference to the excitonic emission Molas et al. (2017); Chow et al. (2017); Shree et al. (2018); Zinkiewicz et al. (2019).
Summarising, the observed temperature effect on the intensity of the phonon modes is complicated and cannot be understood in terms of simple incoming or outgoing resonance conditions of the RS Wu et al. (2018). In the presented experiment, the strength of the electron-phonon coupling is not only affected by the adjustment of the relative energy between the excitation and the emission (E). The variation in the temperature also alters the linewidth of the XA line, which is observed to broaden with increasing temperature, and hence the XA lifetime is changed Palummo et al. (2015); Wang et al. (2016). The broadening of the A exciton line at higher temperatures results from the occupation by both electron and hole states characterised by larger -vectors away from the K valleys. As reported in Ref. 68 for thin MoTe2 layers, the contributions to the Raman susceptibility from different BZ regions (individual points) are added with particular signs (plus or minus). Consequently, the strength of the electron-phonon coupling can be significantly modified as a function of temperature. This allows us to perform a quantitative analysis of the observed temperature dependent evolution of the phonon intensities but without direct attribution of resonant conditions of Raman scattering.
III Conclusion
Temperature dependent resonant Raman spectroscopy for BL 2H-MoS2 has been performed. It has been clearly observed that temperature plays a significant role in altering the band structure of the material, ultimately leading to a unique vibrational response from the active 2D layer, where different phonon modes at the and M points of the BZ are sensitive to temperature in an independent manner. The unambiguous switching of the intensity strength from A() at 5 K to B() at 300 K points to the fact that, in addition to the application of electric field, temperature is a crucial parameter to tune the resonance of the phonon modes in 2D materials. We also note the effect of the flake environment on the Raman scattering. We believe that our work will motivate further investigation from both an experimental and theoretical perspective on exciton-phonon coupling in S-TMD under resonant conditions of excitation.
IV Methods
Bilayer MoS2 encapsulated in hBN flakes was fabricated by a two-stage PDMS-based mechanical exfoliation of the bulk 2H-MoS2 crystal. An unoxidised silicon wafer was used as a substrate. To ensure the best quality, the substrate was annealed at 200 oC and kept on a hot plate until the first non-deterministic transfer of hBN flakes. Subsequent layers were transferred deterministically to reduce inhomogeneity between each layer. The complete structure was annealed at 160 oC for 1.5 h to ensure the best layer-to-layer and layer-to-substrate adhesion and to eliminate air pockets at the interfaces between the constituent layers.
A high resolution image of the sample was taken at 100x magnification using a Huvitz HRM-300 optical microscope. AFM experiments were conducted using Dimension Icon (Bruker Corporation, Billerica, MA, USA) with ScanAsyst connected to Nanoscope VI controller. The images were collected in ScanAsyst mode using SCANASYST-AIR probes (Bruker Corporation) across an area of 5 m x 5 m. with nominal spring constant of 0.4 N/m and a resonance frequency of 70 kHz. AFM topography images were recorded in air at the temperature of ∘C.
The PL and RS measurements were performed using = 632.8 nm (1.96 eV) and = 514.5 nm (2.41 eV) radiations from He-Ne and diode lasers, respectively. The laser beam, cleaned through Bragg filters in excitation, was focused through a 50x long-working-distance objective with a 0.55 numerical aperture producing a spot of about 1 m diameter. The signal was collected via the same microscope objective, sent through a 1 m monochromator, and then detected by using a liquid nitrogen-cooled charge-coupled device (CCD) camera. The temperature-dependent PL and Raman measurements were performed by placing the sample on a cold finger in a continuous flow cryostat mounted on x–y motorised positioners. The temperature was varied from 5 K to 320 K in steps of 10 K with the signal collected from the sample after the stabilisation of the temperature. The excitation power focused on the sample was kept fixed at 300 W during all measurements to obtain a strong signal and avoid local heating.
DFT calculations were conducted in Vienna Ab initio Simulation Package Kresse and Furthmüller (1996) with Projector Augmented Wave method Kresse and Joubert (1999). Perdew–Burke–Ernzerhof parametrization Perdew et al. (1996) of general gradients approximation to the exchange-correlation functional was used. The plane waves basis cutoff energy was set to 500 eV and a 12121 -centered Monkhorst-Pack k-grid sampling was applied. The geometric structure was optimized with eV/Åand 0.01 kbar criteria for the interatomic forces and stress tensor components, respectively. Grimme’s D3 correction was applied to describe the interlayer vdW interactions Grimme et al. (2010). The phonon band structure of BL MoS2 was calculated within Parliński-Li-Kawazoe method Parlinski et al. (1997), as implemented in Phonopy software Togo and Tanaka (2015). The 331 supercells were found sufficient to converge the interatomic force constants within the harmonic approximation.
Acknowledgements
The work has been supported by the National Science Centre, Poland (grant no. 2017/27/B/ST3/00205 and 2018/31/B/ST3/02111) and the CNRS via IRP "2DM" project. K. W. and T. T. acknowledge support from the Elemental Strategy Initiative conducted by the MEXT, Japan, (grant no. JPMXP0112101001), JSPS KAKENHI (grant no. JP20H00354), and the CREST (JPMJCR15F3), JST. DFT calculations were performed with the support of the Interdisciplinary Centre for Mathematical and Computational Modelling (ICM) University of Warsaw and Center for Information Services and High Performance Computing (ZIH) at TU Dresden.
Conflicts of interest
There are no conflicts to declare.
Availability of Data and Materials
The datasets obtained during the experiments and analysed for the current study are available from the corresponding authors on reasonable request.
References
- Lopez-Sanchez et al. (2013) O. Lopez-Sanchez, D. Lembke, M. Kayci, A. Radenovic, and A. Kis, Nature Nanotechnology 8, 497 (2013).
- Jo et al. (2014) S. Jo, N. Ubrig, H. Berger, A. B. Kuzmenko, and A. F. Morpurgo, Nano Letters 14, 2019 (2014).
- Mak and Shan (2016) K. F. Mak and J. Shan, Nature Photonics 10, 216 (2016).
- Zhu et al. (2016) J. Zhu, J. Wu, Y. Sun, J. Huang, Y. Xia, H. Wang, H. Wang, Y. Wang, Q. Yi, and G. Zou, RSC Adv. 6, 110604 (2016).
- Yan et al. (2017) P. Yan, H. Chen, J. Yin, Z. Xu, J. Li, Z. Jiang, W. Zhang, J. Wang, I. L. Li, Z. Sun, and S. Ruan, Nanoscale 9, 1871 (2017).
- Yu et al. (2015) Y. Yu, S. Hu, L. Su, L. Huang, Y. Liu, Z. Jin, A. A. Purezky, D. B. Geohegan, K. W. Kim, Y. Zhang, and L. Cao, Nano Letters 15, 486 (2015).
- Deng et al. (2016) D. Deng, K. S. Novoselov, Q. Fu, N. Zheng, Z. Tian, and X. Bao, Nature Nanotechnology 11, 218 (2016).
- Liao et al. (2019) W. Liao, Y. Huang, H. Wang, and H. Zhang, Applied Materials Today 16, 435 (2019).
- He et al. (2015) Y.-M. He, G. Clark, J. R. Schaibley, Y. He, M.-C. Chen, Y.-J. Wei, X. Ding, Q. Zhang, W. Yao, X. Xu, C.-Y. Lu, and J.-W. Pan, Nature Nanotechnology 10, 497 (2015).
- Schaibley et al. (2016) J. R. Schaibley, H. Yu, G. Clark, P. Rivera, J. S. Ross, K. L. Seyler, W. Yao, and X. Xu, Nature Reviews Materials 1, 16055 (2016).
- Cortés et al. (2019) N. Cortés, O. Ávalos-Ovando, L. Rosales, P. A. Orellana, and S. E. Ulloa, Phys. Rev. Lett. 122, 086401 (2019).
- Ciorciaro et al. (2020) L. Ciorciaro, M. Kroner, K. Watanabe, T. Taniguchi, and A. Imamoglu, Phys. Rev. Lett. 124, 197401 (2020).
- Bhatnagar et al. (2020) M. Bhatnagar, M. C. Giordano, C. Mennucci, D. Chowdhury, A. Mazzanti, G. Della Valle, C. Martella, P. Tummala, A. Lamperti, A. Molle, and F. Buatier de Mongeot, Nanoscale 12, 24385 (2020).
- Mennucci et al. (2021) C. Mennucci, A. Mazzanti, C. Martella, A. Lamperti, M. Bhatnagar, R. Lo Savio, L. Repetto, A. Camellini, M. Zavelani-Rossi, A. Molle, F. Buatier de Mongeot, and G. Della Valle, Advanced Optical Materials 9, 2001408 (2021).
- Bhatnagar et al. (2021) M. Bhatnagar, M. Gardella, M. C. Giordano, D. Chowdhury, C. Mennucci, A. Mazzanti, G. D. Valle, C. Martella, P. Tummala, A. Lamperti, A. Molle, and F. Buatier de Mongeot, ACS Applied Materials & Interfaces 13, 13508 (2021).
- Carr et al. (2017) S. Carr, D. Massatt, S. Fang, P. Cazeaux, M. Luskin, and E. Kaxiras, Phys. Rev. B 95, 075420 (2017).
- Chendong et al. (2017) Z. Chendong, C. Chih-Piao, R. Xibiao, L. Ming-Yang, L. Lain-Jong, J. Chuanhong, C. Mei-Yin, and S. Chih-Kang, Science Advances 3, e1601459 (2017).
- Lee et al. (2010) C. Lee, H. Yan, L. E. Brus, T. F. Heinz, J. Hone, and S. Ryu, ACS Nano 4, 2695 (2010), pMID: 20392077.
- Tonndorf et al. (2013) P. Tonndorf, R. Schmidt, P. Böttger, X. Zhang, J. Börner, A. Liebig, M. Albrecht, C. Kloc, O. Gordan, D. R. T. Zahn, S. M. de Vasconcellos, and R. Bratschitsch, Opt. Express 21, 4908 (2013).
- Placidi et al. (2015) M. Placidi, M. Dimitrievska, V. Izquierdo-Roca, X. Fontané, A. Castellanos-Gomez, A. Pérez-Tomás, N. Mestres, M. Espindola-Rodriguez, S. López-Marino, M. Neuschitzer, V. Bermudez, A. Yaremko, and A. Pérez-Rodríguez, 2D Materials 2, 035006 (2015).
- Grzeszczyk et al. (2016) M. Grzeszczyk, K. Gołasa, M. Zinkiewicz, K. Nogajewski, M. R. Molas, M. Potemski, A. Wysmołek, and A. Babiński, 2D Materials 3, 025010 (2016).
- Zhang et al. (2018) S. Zhang, N. Zhang, Y. Zhao, T. Cheng, X. Li, R. Feng, H. Xu, Z. Liu, J. Zhang, and L. Tong, Chem. Soc. Rev. 47, 3217 (2018).
- van Baren et al. (2019) J. van Baren, G. Ye, J.-A. Yan, Z. Ye, P. Rezaie, P. Yu, Z. Liu, R. He, and C. H. Lui, 2D Materials 6, 025022 (2019).
- Kipczak et al. (2020) Ł. Kipczak, M. Grzeszczyk, K. Olkowska-Pucko, A. Babiński, and M. Molas, Journal of Applied Physics 128, 044302 (2020).
- Huang et al. (2016) S. Huang, L. Liang, X. Ling, A. A. Puretzky, D. B. Geohegan, B. G. Sumpter, J. Kong, V. Meunier, and M. S. Dresselhaus, Nano Letters 16, 1435 (2016).
- Yang et al. (2016) T. Yang, X. Huang, H. Zhou, G. Wu, and T. Lai, Opt. Express 24, 12281 (2016).
- Park et al. (2016) S. Park, H. Kim, M. S. Kim, G. H. Han, and J. Kim, Opt. Express 24, 21551 (2016).
- Lee et al. (2017) J.-U. Lee, S. Woo, J. Park, H. C. Park, Y.-W. Son, and H. Cheong, Nature Communications 8, 1370 (2017).
- Lin et al. (2018) M.-L. Lin, Q.-H. Tan, J.-B. Wu, X.-S. Chen, J.-H. Wang, Y.-H. Pan, X. Zhang, X. Cong, J. Zhang, W. Ji, P.-A. Hu, K.-H. Liu, and P.-H. Tan, ACS Nano 12, 8770 (2018).
- Sarkar et al. (2019) S. Sarkar, H. L. Pradeepa, G. Nayak, L. Marty, J. Renard, J. Coraux, N. Bendiab, V. Bouchiat, J. K. Basu, and A. Bid, Nanoscale Adv. 1, 4398 (2019).
- Debnath et al. (2020) R. Debnath, I. Maity, R. Biswas, V. Raghunathan, M. Jain, and A. Ghosh, Nanoscale 12, 17272 (2020).
- Kim et al. (2020) H. Kim, H. Ko, S. M. Kim, and H. Rho, Journal of Raman Spectroscopy 51, 774 (2020).
- Kim et al. (2021) H. Kim, H. Ko, S. M. Kim, and H. Rho, Current Applied Physics 25, 41 (2021).
- Grzeszczyk et al. (2021) M. Grzeszczyk, J. Szpakowski, A. O. Slobodeniuk, T. Kazimierczuk, M. Bhatnagar, T. Taniguchi, K. Watanabe, P. Kossacki, M. Potemski, A. Babiński, and M. R. Molas, Scientific Reports 11, 17037 (2021).
- Sekine et al. (1984) T. Sekine, K. Uchinokura, T. Nakashizu, E. Matsuura, and R. Yoshizaki, Journal of the Physical Society of Japan 53, 811 (1984).
- Gołasa et al. (2014) K. Gołasa, M. Grzeszczyk, P. Leszczyński, C. Faugeras, A. A. L. Nicolet, A. Wysmołek, M. Potemski, and A. Babiński, Appl. Phys. Lett. 104, 092106 (2014).
- Gołasa et al. (2014) K. Gołasa, M. Grzeszczyk, R. Bożek, P. Leszczyński, A. Wysmołek, M. Potemski, and A. Babiński, Solid state communications 197, 53 (2014).
- Na et al. (2018) W. Na, K. Kim, J.-U. Lee, and H. Cheong, 2D Materials 6, 015004 (2018).
- Shinde and Eswaran (2021) N. B. Shinde and S. K. Eswaran, The Journal of Physical Chemistry Letters 12, 6197 (2021).
- Lu et al. (2017) X. Lu, M. I. B. Utama, X. Wang, W. Xu, W. Zhao, M. H. S. Owen, and Q. Xiong, Small 13, 1701039 (2017).
- Klein et al. (2021) J. Klein, J. Wierzbowski, P. Soubelet, T. Brumme, L. Maschio, A. Kuc, K. Müller, A. V. Stier, and J. J. Finley, “Electrical control of orbital and vibrational interlayer coupling in bi- and trilayer 2h-mos2,” (2021), arXiv:2106.11839 [cond-mat.mes-hall] .
- Gontijo et al. (2019) R. N. Gontijo, A. Gadelha, O. J. Silveira, B. R. Carvalho, R. W. Nunes, L. C. Campos, M. A. Pimenta, A. Righi, and C. Fantini, Journal of Raman Spectroscopy 50, 1867 (2019).
- Livneh and Sterer (2010) T. Livneh and E. Sterer, Phys. Rev. B 81, 195209 (2010).
- Kumar et al. (2021) D. Kumar, B. Singh, R. Kumar, M. Kumar, and P. Kumar, Nanotechnology 32, 285705 (2021).
- Slobodeniuk et al. (2019) A. O. Slobodeniuk, Ł. Bala, M. Koperski, M. R. Molas, P. Kossacki, K. Nogajewski, M. Bartos, K. Watanabe, T. Taniguchi, C. Faugeras, and M. Potemski, 2D Materials 6, 025026 (2019).
- Paradisanos et al. (2020) I. Paradisanos, S. Shree, A. George, N. Leisgang, C. Robert, K. Watanabe, T. Taniguchi, R. J. Warburton, A. Turchanin, X. Marie, I. C. Gerber, and B. Urbaszek, Nature Communications 11, 2391 (2020).
- Carvalho et al. (2015) B. R. Carvalho, L. M. Malard, J. M. Alves, C. Fantini, and M. A. Pimenta, Phys. Rev. Lett. 114, 136403 (2015).
- Molas et al. (2017) M. R. Molas, K. Nogajewski, M. Potemski, and A. Babiński, Scientific Reports 7, 5036 (2017).
- Zinkiewicz et al. (2019) M. Zinkiewicz, K. Nogajewski, M. Bartos, K. Watanabe, T. Taniguchi, M. Potemski, A. Babinski, and M. R. Molas, Acta Physica Polonica A 136, 624 (2019).
- Kümmell et al. (2015) T. Kümmell, W. Quitsch, S. Matthis, T. Litwin, and G. Bacher, Phys. Rev. B 91, 125305 (2015).
- Niehues et al. (2019) I. Niehues, A. Blob, T. Stiehm, S. Michaelis de Vasconcellos, and R. Bratschitsch, Nanoscale 11, 12788 (2019).
- Leisgang et al. (2020) N. Leisgang, S. Shree, I. Paradisanos, L. Sponfeldner, C. Robert, D. Lagarde, A. Balocchi, K. Watanabe, T. Taniguchi, X. Marie, R. J. Warburton, I. C. Gerber, and B. Urbaszek, Nature Nanotechnology 15, 901 (2020).
- Varshni (1967) Y. Varshni, Physica 34, 149 (1967).
- Scheuschner et al. (2015a) N. Scheuschner, R. Gillen, M. Staiger, and J. Maultzsch, Phys. Rev. B 91, 235409 (2015a).
- Molina-Sánchez et al. (2015) A. Molina-Sánchez, K. Hummer, and L. Wirtz, Surface Science Reports 70, 554 (2015).
- Scheuschner et al. (2015b) N. Scheuschner, R. Gillen, M. Staiger, and J. Maultzsch, Phys. Rev. B 91, 235409 (2015b).
- Cai et al. (2014) Y. Cai, J. Lan, and G. Zhang, Phys. Rev. B 89, 035438 (2014).
- Grzeszczyk et al. (2018) M. Grzeszczyk, K. Gołasa, M. R. Molas, K. Nogajewski, M. Zinkiewicz, M. Potemski, W. A., and A. Babiński, Scientific Reports 8, 17745 (2018).
- Chakraborty et al. (2013) B. Chakraborty, H. S. S. R. Matte, A. K. Sood, and C. N. R. Rao, Journal of Raman Spectroscopy 44, 92 (2013).
- Lee et al. (2015) J.-U. Lee, J. Park, Y.-W. Son, and H. Cheong, Nanoscale 7, 3229 (2015).
- Gołasa et al. (2015) K. Gołasa, M. Grzeszczyk, J. Binder, R. Bożek, A. Wysmołek, and A. Babiński, AIP Advances 5, 077120 (2015), https://doi.org/10.1063/1.4926670 .
- Molas et al. (2019) M. R. Molas, K. Gołasa, Ł. Bala, K. Nogajewski, M. Bartos, M. Potemski, and A. Babiński, Scientific Reports 9, 1989 (2019).
- Chow et al. (2017) C. M. Chow, H. Yu, A. M. Jones, J. R. Schaibley, M. Koehler, D. G. Mandrus, R. Merlin, W. Yao, and X. Xu, npj 2D Materials and Applications 1, 33 (2017).
- Shree et al. (2018) S. Shree, M. Semina, C. Robert, B. Han, T. Amand, A. Balocchi, M. Manca, E. Courtade, X. Marie, T. Taniguchi, K. Watanabe, M. M. Glazov, and B. Urbaszek, Phys. Rev. B 98, 035302 (2018).
- Wu et al. (2018) J.-B. Wu, M.-L. Lin, X. Cong, H.-N. Liu, and P.-H. Tan, Chem. Soc. Rev. 47, 1822 (2018).
- Palummo et al. (2015) M. Palummo, M. Bernardi, and J. C. Grossman, Nano Letters 15, 2794 (2015).
- Wang et al. (2016) H. Wang, C. Zhang, W. Chan, C. Manolatou, S. Tiwari, and F. Rana, Phys. Rev. B 93, 045407 (2016).
- Miranda et al. (2017) H. P. C. Miranda, S. Reichardt, G. Froehlicher, A. Molina-Sánchez, S. Berciaud, and L. Wirtz, Nano Letters 17, 2381 (2017).
- Kresse and Furthmüller (1996) G. Kresse and J. Furthmüller, Physical Review B 54, 11169 (1996).
- Kresse and Joubert (1999) G. Kresse and D. Joubert, Physical Review B 59, 1758 (1999).
- Perdew et al. (1996) J. P. Perdew, K. Burke, and M. Ernzerhof, Physical Review Letters 77, 3865 (1996).
- Grimme et al. (2010) S. Grimme, J. Antony, S. Ehrlich, and H. Krieg, The Journal of Chemical Physics 132, 154104 (2010).
- Parlinski et al. (1997) K. Parlinski, Z. Q. Li, and Y. Kawazoe, Physical Review Letters 78, 4063 (1997).
- Togo and Tanaka (2015) A. Togo and I. Tanaka, Scripta Materialia 108, 1 (2015), 1506.08498 .