Steepest growth re-examined: repercussions for primordial black hole formation
Abstract
Primordial black holes (PBHs) can be produced by a range of mechanisms in the early universe. A particular formation channel that connects PBHs with inflationary phenomenology invokes enhanced primordial curvature perturbations at small scales. In this paper, we re-examine the impact of the growth of the primordial power spectrum on PBH formation in terms of its implications for the PBH mass function. We elaborate on how rapidly the background can transition between different values of the parameters of the Hubble hierarchy, which must ultimately derive from a consistent derivative expansion for the background inflaton field. We discuss artefacts associated with matching calculations, and highlight the robustness of the steepest growth previously found for single-field inflation with conservatively smoothed transitions and limits on how much the amplitude of the power spectrum can grow. We show that the mass function is relatively insensitive to the steepness of the growth of the power spectrum and subsequent decay, depending primarily on the peak amplitude and the presence of any plateaus that last more than an e-fold. The shape of the power spectrum can of course be constrained by other tracers, and so understanding the physical limitations on its shape remains a pertinent question.
I Introduction
Primordial black holes (PBHs) could teach us a lot about the initial conditions of the universe. Large overdensities must have been left over at the end of inflation for PBHs to have formed during radiation domination, when pressure forces strongly oppose gravitational collapse, see [1, 2, 3, 4] for recent reviews. Assuming that PBH formation occurs via the direct collapse of these large amplitude perturbations shortly after they re-enter the horizon post-inflation, and that the perturbations follow a Gaussian distribution, the primordial power spectrum needs to be around seven orders of magnitude larger than the amplitude observed on large scales [5]. This raises questions of how quickly the power spectrum can grow by this amount and how the shape of a peak in the power spectrum could be observed.
Since the publication of [6], where it was observed that the fastest the primordial power spectrum can grow under certain assumptions in single-field inflation is , examples have been found of inflationary potentials that enable the primordial power spectrum to grow slightly faster in single-field inflation [7, 8, 9, 10], and substantially faster in multi-field inflation [11, 12, 13]. Many models that are able to produce enough growth for PBH production employ sharp transitions in the inflationary parameters. While these transitions make calculating the primordial power spectrum feasible analytically, they can also lead to unphysical features. We study various properties of enhancements to the power spectrum with the aim of understanding which of them are artefacts of calculational approximations, and which are physical. We show that features such as oscillations in the power spectrum that arise from unrealistic instant transitions in the evolution of the inflationary parameters disappear if the transitions instead occur over the duration of approximately an e-fold. Instantaneous in the context of inflationary cosmology should mean an order one fraction of an e-fold (a distinction that for instance, the authors of [14, 15] were keenly aware of in their definition of ‘instantaneous’ in the context of pre-heating). We also show that the appearance of an over-optimistic growth in amplitude of the power spectrum can be produced, which goes away when transitions are realistically smoothed. In a follow-up paper we will study the fine-tuning associated with building inflationary models capable of generating PBHs.
We use these results to further demonstrate the importance of using a realistically smoothed primordial power spectrum to calculate the resulting PBH abundance. For a power-law growth in the power spectrum, the resultant distribution or abundance of primordial black holes is largely insensitive to changes in the slope of the power spectrum peak. In particular, we find that there is essentially no dependence on the steepness of the power spectrum once it is steeper than , not even compared to the unrealistic (but frequently studied) delta-function power spectrum. However, we show that there can be large differences to the resulting distribution of PBHs between the unsmoothed and smoothed power spectra that we calculate in section II, due to the fact that power spectrum peaks can broaden substantially and even lead to multi-modal PBH mass distributions. We note that regardless of the PBH mass function, observational constraints on primordial density fluctuations themselves, for example via observations of the stochastic gravitational wave background or CMB spectral distortions, depending on the relevant comoving scales, may be sensitive to changes in the shape of the power spectrum and can provide extra information about the underlying mechanism that generated the enhanced power. Hence, the shape of an enhancement to the power spectrum is an important factor if we are to constrain it with other probes, and yet more reason to ensure a realistic form for the power spectrum is used when calculating constraints.
For simplicity, we do not include the impact of non-Gaussianity of the perturbations in this paper, despite PBH formation taking place in the tail of the probability distribution which implies that PBH formation is sensitive to non-Gaussianity. Many studies of non-Gaussianity in ultra-slow-roll (USR) inflation have been made, see e.g. [16, 17, 18, 19], as well as on PBH formation in this and related scenarios [20, 21, 9, 22, 23, 24] but the impact this has on PBH formation remains uncertain. Issues include whether the (order unity) non-Gaussianity has a physical impact or not (related to its value in Conformal Fermi Coordinates) [25, 26, 27, 28] and the impact of quantum diffusion during ultra-slow-roll inflation [29, 30, 31, 32, 33, 34].
In section II we demonstrate the important impact of smoothing the inflationary potential, going beyond the instantaneous transitions assumed for analytic simplicity in matching calculations. In section III we study the impact of the shape of the power spectrum peak on PBH mass distributions, including the impact of the smoothed transitions from section II. We conclude in section IV.
II Steepest growth: matching calculation artefacts
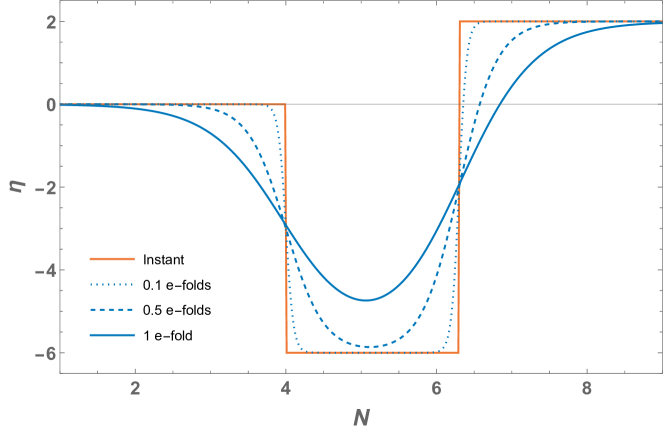
Perhaps the strongest motivation for considering a significant growth in the power spectrum is the production of primordial black holes, which can contribute to early- and late-universe physics in a number of ways, most notably as a dark matter candidate. Many PBH-motivated models exhibit artefacts in the resultant power spectrum such as rapid oscillations in -space, usually around the peak111Note that this scenario is distinct from the perturbative oscillations generated on CMB scales in models where the power spectrum amplitude remains close to constant, see e.g. [35, 36].. These are consequences of the fact that they are calculated by stitching together the solutions for the curvature perturbation that are each valid for a constant value of the second slow-roll parameter . The slow-roll parameters are defined as and , and it is the latter which tracks the acceleration of the inflaton and determines the slope of the resulting power spectrum. For a summary of the literature, see for instance [20]. The solutions (and their derivatives) are ‘matched’ at transition times between phases of constant , resulting in an evolution of that has instant transitions between constant values. The details of such matching calculations are laid out in [6]. See for example figure 1, where the solid orange line shows the evolution which corresponds to instant transitions between slow-roll, followed by ultra-slow-roll and then a period of (which induces a decay in the power spectrum on small scales). Whilst one can imagine that stitching together a large number of these solutions for constant will eventually approach the limit of a smoothly evolving function of , the instant transitions are unrealistic for large changes in the value of at the transition times. This is because and are obtained from perturbing around a time dependent background derived from an underlying effective action for the background inflaton, and are thus subject to the usual requirements of deriving from a controlled derivative expansion.
Instantaneous transitions correspond to arbitrarily sharp changes in certain parameters of the effective action (i.e. the potential and its derivatives in the context of canonical inflation), which are unphysical. Concretely, although one might try to engineer an arbitrarily sharp transition at the classical level, this will not be possible at the quantum corrected level. In addition, one must take care to distinguish between being able to engineer arbitrarily sharp transitions in coordinate time, and in terms of e-folds. Large gradients source expansion, and transitions between different values of the parameters of the Hubble hierarchy always end up costing an order one fraction of an e-fold even if one were to suspend disbelief and try to arrange for them to occur arbitrarily fast in coordinate time (this is discussed in appendix C2 of [6] in the context of how quickly inflation can end, but the argument can be generalized). We should therefore instead consider smoothed transitions. We model the smoothing phenomenologically by multiplying each phase of constant by
| (1) |
where denotes e-folds, and are the e-fold values at the transition times in and out of the phase of constant , and is the duration of the smoothing. The effect on the evolution of is demonstrated by the dotted, dashed and solid blue lines of figure 1 which correspond to e-fold transition durations respectively. There are 2.3 e-folds of ultra-slow-roll in the case of instant transitions.
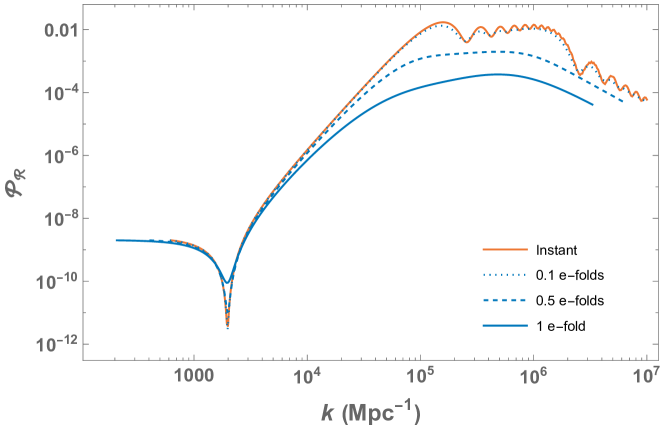
The corresponding power spectra are shown in figure 2. The spectrum calculated from matching instantaneously between constant phases of (solid orange line) exhibits oscillations around the peak of the spectrum. Given that these alter the peak amplitude, they could have a noticeable effect on the PBH mass distribution and abundance, and they would certainly impact observations which directly constrain the scalar perturbations. When we instead smooth the transitions, the oscillations disappear. The dotted, dashed and solid blue lines in figures 2 correspond to 0.1, 0.5 and 1 e-fold durations of smoothing of the evolution respectively. For 0.1 e-folds of smoothing, the oscillations survive, but for 0.5 and 1 e-folds, they disappear entirely. Furthermore, the peak amplitude decreases too, which will have an exponentially large effect on the abundance of PBHs produced. However, this is in part due to the fact that when smoothing the transitions, the duration of non-slow-roll is decreased, so one would expect less growth in the power spectrum.
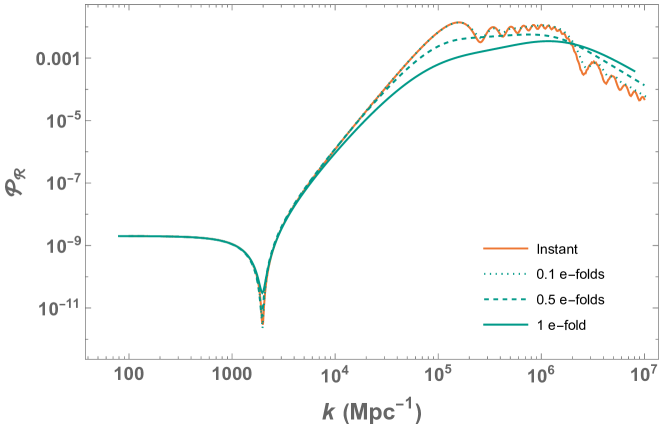
We therefore show for comparison the same matching calculation power spectrum in figure 3 in orange, smooth the transitions by the same amount as in figure 2, but increase the duration of the ultra-slow-roll phase such that the integrated value of (i.e. where for ) is equal in each case. This means that the overall growth of the power spectrum is approximately the same, even though the amount of “true” ultra-slow-roll where varies in each case. We now see that the oscillations disappear, and the peak height is still decreased but less significantly.
It is important to note here that the process of smoothing the instant transitions causes the peak of the power spectrum to decrease and shift to larger values of , and also flattens the slope in the vicinity of the peak. These changes will have a significant effect on the PBH mass distribution, since this is only sensitive to the region close to the peak. We will address this effect in section III (see figure 8).
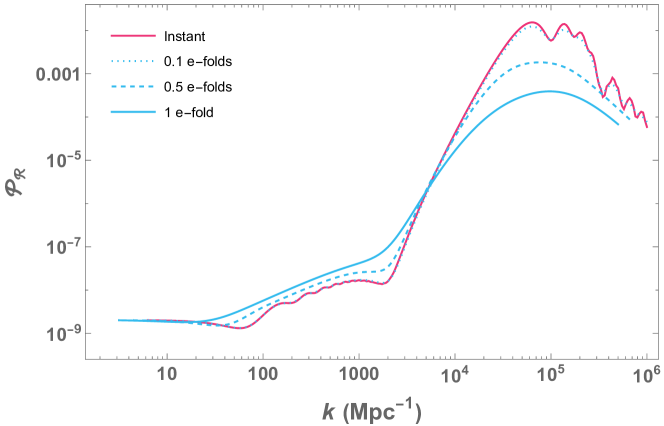
Finally we also demonstrate that models which exhibit super- growth with instant transitions between constant phases of suffer from similar oscillation, slope and amplitude depletion when instant transitions are smoothed. For example, it was shown in [7] that an extra phase of in between phases of slow-roll and ultra-slow-roll produces an enhancement of the slope in the power spectrum proportional to . By smoothing the transitions and limiting the amplitude increase in the primordial power spectrum to no more than seven orders of magnitude so as to comply with both large scale CMB constraints and the envelope of PBH non-detection constraints, we find that the super- growth is effectively lost, as shown in figure 4. This happens for exactly the same reason as the growth depletion shown in figures 2 and 3. However, because just one matching is required between slow-roll and ultra-slow-roll, some growth does survive. In cases where other constant phases of are required with a strong sensitivity on the duration of that phase, for example the extra phase of in this model, the impact of super- power spectrum growth is overruled by the need to smooth transitions222We note in closing that our arguments only apply to sustained growth – that is, growth which can be achieved for multiple e-folds. There are transients where the growth index is evidently much higher (such as in the immediate vicinity of the dip before the sustained growth). One can imagine positing classical inflationary backgrounds where transients of a specific nature can be arranged to occur regularly enough so that the growth can have periods of super growth that last more than a few e-folds, as was shown in [8, 9], although whether these persist at the quantum corrected level is to be verified..
We will now review the effect of the total slope of the power spectrum, as well as whether it plateaus or decays, on the PBH mass distribution. We will then go on to show that spurious features close to the peak of the power spectrum, which we have shown in this section should be smoothed, can lead to unrealistically large effects on the PBH mass distribution which will not manifest from a reasonable power spectrum.
III PBH mass distribution: effects of growth and decay of the power spectrum
A key observable for the study of PBHs is their mass distribution, which can be sensitive to the details of the power spectrum of the perturbations from which they form. However, it is known that the effects of critical collapse become significant for narrow power spectra [37, 38, 39], and it has recently been shown that if the power spectrum peak is sufficiently narrow, the resulting PBH mass distribution is described entirely by the critical collapse physics and becomes insensitive to the detailed shape of the power spectrum [40]. It is therefore sensible to ask the question of whether any growth steeper than is distinguishable from growth when considering the PBH mass distribution.
We calculate the PBH mass distribution using the formalism described in [5]. There is considerable discussion about which method to use when calculating the PBH mass distribution, with many recent papers utilising a peaks theory method. It was shown in [5] that the mass distribution shape is mostly independent of the calculation method once normalised to a fixed . As there is no community consensus about the correct way to apply peaks theory [41, 42, 43, 44], we choose to use the Press–Schechter method for simplicity. We use the modified Gaussian window function from [5]. Additionally, we neglect the effect of the non-linear relationship between and [45, 46, 47, 48]. This is expected to have some impact on the mass distribution shape, but will not affect the conclusions presented in this section. We consider the mass distribution
| (2) |
which is normalised to unity over the PBH mass , where is the fraction of the total energy density of the universe in PBHs today333We neglect the impact of PBH accretion, mergers, and evaporation in this paper.. This is related to another commonly used definition for the PBH mass function, , by
| (3) |
where satisfies the normalisation condition
| (4) |
with the fraction of dark matter in the form of PBHs.
For the shape of the primordial power spectrum, we consider a symmetric peak with a power-law growth and decay of a constant slope, and for simplicity we begin by assuming that the growth and decay rates of the peak are equal,
| (5) |
where is the peak scale and the amplitude is fixed to produce a PBH abundance .
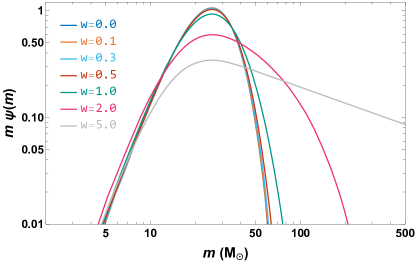
In figure 5 we show the PBH mass distributions calculated from these symmetric power spectrum peaks, for a range of slopes. It is clear that a slope of is already steep enough that the PBH mass distribution is extremely close to the distribution resulting from a delta function in the power spectrum. This means that, by extension, the PBH mass distribution resulting from any power spectrum slope steeper than will be even less distinguishable from the mass function produced by a delta function power spectrum.
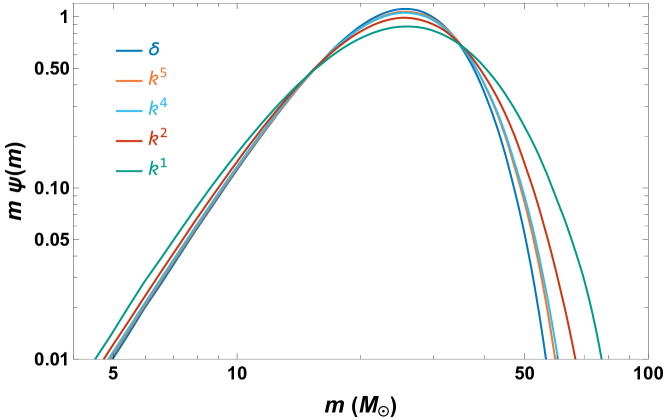
However, the assumption that the power spectrum will fall off with the same slope as its rising edge is not normally valid in practice. For example, in inflationary models with an inflection point, the growth is usually whilst the decrease in all known cases is less steep and related to the value of the second slow-roll parameter after the inflection point. Therefore, it is necessary to consider the case of an asymmetric power spectrum peak, given by
| (6) |
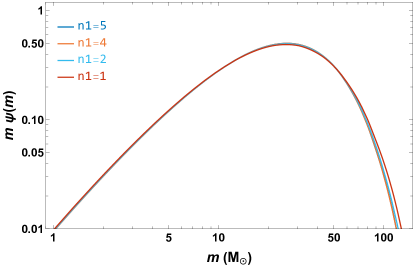
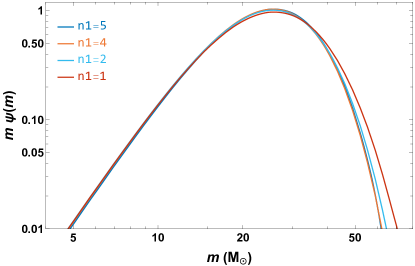
with the amplitude again normalised to give . For the rising edge, we will consider the same range of indices as for the symmetric case. For the falling slope, we choose the bounding values given in [20] for the selection of models they considered, . In figure 6 we show the mass distributions for these two cases. It is clear that the conclusion stated above for symmetric peaks also holds for asymmetric power spectra.
Another possibility is that the power spectrum does not decay immediately, but remains enhanced over some range of values. This is the case for the example of a simple USR phase (), in which the negative period grows the power spectrum, after which it remains at its enhanced value. This simple case is not possible to realise in many inflationary models, since the end of inflation normally requires , and so a positive phase must exist to drive back to larger values, which will also cause the power spectrum to reduce. However, it may be possible to maintain an enhanced power spectrum for a small number of e-folds before it decays again, or to end inflation by an alternative mechanism to the growth of , such as a waterfall field in hybrid inflation. Therefore, we consider the case of a power spectrum that grows and decays as , but with a plateau at the top,
| (7) |
where is defined in terms of the width of the plateau in log-space,
| (8) |
and the amplitude is fixed such that .
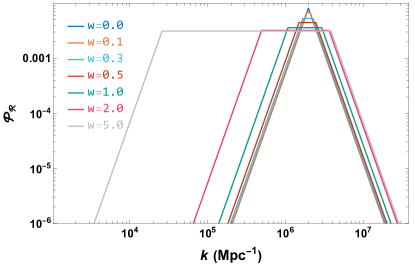
In figure 7 we show a range of plateau power spectra with different widths , ranging from no plateau to one that lasts for five e-folds (where e-folds relate to comoving scales as ), and the corresponding PBH mass distributions. The power spectrum positions are chosen such that the mass distributions peak at the same mass. We can see that for plateau widths smaller than one e-fold (i.e. ), the mass distribution is virtually unchanged. For broader plateaus, an enhancement to the high-mass tail is observed.
Why is the PBH mass function so insensitive to substantial changes in the shape of the power spectrum peak? There are two key reasons. Firstly, the density perturbations are due to the curvature power spectrum smoothed with a window function, which smears out features on the scale of the PBH (see e.g. figure 5 of [6] to see the visual impact of the smoothing, or [48]). While there has been some discussion as to the correct choice of window function, it now seems clear that the effect on the PBH mass distribution is sufficiently small to be indistinguishable with current data [49, 50, 5]. The second reason is that the critical collapse phenomenon implies a minimum width to the PBH mass distribution even if the power spectrum is a delta function (meaning that it only has perturbations on a single scale). This ensures that a monochromatic mass distribution is impossible, and a lognormal shape is frequently used instead. However, for sufficiently narrow power spectra, the shape is controlled by the critical collapse effect, leading to a non-lognormal distribution, and an insensitivity to the power spectrum shape [37, 38, 40]. The combination of these two effects means that features in the power spectrum with a width corresponding to less than about one e-fold are unlikely to be visible to any realistic future measurement of the PBH mass function.
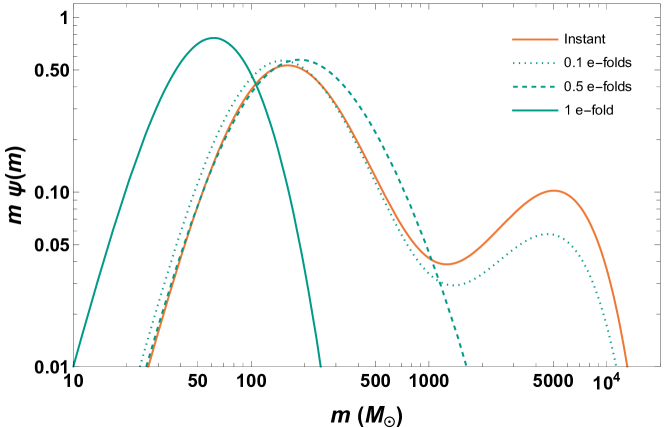
It is also important to stress that the PBH formation rate is only sensitive to the power spectrum amplitude very close to the peak, because the collapse rate into PBHs is exponentially sensitive to the amplitude. Hence, the PBH mass function can (at best) only be a function of the power spectrum shape close to the peak. An example of this is shown by calculating the PBH mass distributions corresponding to the power spectra shown in figure 3. While the unsmoothed power spectrum in figure 3 exhibits oscillations, these are removed by the window function. However, the unsmoothed power spectrum still gives a mass distribution with a unique double peak structure (solid orange line in figure 8), corresponding to the primary maximum and the broader oscillatory second peak in the power spectrum. However, it can be seen that smoothing the transitions quickly suppresses the second peak, before removing it entirely. For 0.5 e-folds of smoothing (dashed teal line in figure 8), the power spectrum has a plateau, producing a broad mass distribution, and for one e-fold (solid teal line in figure 8), the low- peak in the power spectrum no longer contributes to the PBH mass distribution, leaving just a single narrow peak shifted to lower masses. Therefore, we can see that any search for a bimodal mass distribution, see e.g. [51, 52, 53, 54, 55], is not motivated by ultra-slow-roll inflation once realistic transitions are assumed.
Alternative probes will be needed to constrain or detect the power spectrum on amplitudes between the value seen on the largest scales and the required for PBH formation. On scales at most a few orders of magnitude smaller than the smallest scales detectable with the CMB or LSS (relevant for the formation of PBHs massive enough to be detected with LIGO–Virgo–KAGRA), one can use spectral distortions of the CMB [56, 57, 58, 59, 60] or, in a more model dependent way, ultracompact minihaloes [61, 62, 63, 64, 65] or gravitational lensing of small scale structures [66, 67, 68]. One weakness of these alternative constraints is that the -distortions measure an integrated value of the small scale power, while the other two techniques only apply for certain dark matter models, and we note that a mixed dark matter model with a combination of WIMPs and PBHs is incompatible over a large range of parameter space [69, 70, 71, 72].
An important method to detect the primordial perturbations on small scales is via the primordial stochastic gravitational wave background, generated by the large amplitude scalar perturbations sourcing second-order tensor perturbations, see [73, 74] for reviews. There is an approximate one-to-one relation between the PBH mass and the peak of the gravitational wave frequency. At the time of writing the stochastic gravitational wave background constraint is only competitive with the PBH constraint on the power spectrum amplitude on scales around one parsec, with the corresponding frequency probed by pulsar timing arrays (PTAs), see e.g. [75]. Interestingly, this constraint is almost exactly equal to the PBH constraint on the mass range in which LIGO–Virgo–KAGRA can detect black holes, so if that experiment does detect (or has already detected) PBHs then there should be a corresponding signal detectable by PTAs. In the future, other experiments including SKA, LISA and the Einstein Telescope will be able to probe the stochastic gravitational wave background with sufficient sensitivity over such a large range of scales that a non-detection by all of these experiments would potentially be able to rule out the existence of almost any (non-evaporated) PBHs assuming that they form from the direct collapse of Gaussian distributed density perturbations. For the current and forecast constraint plots see figures 5 and 6 of [5] (see also [76]). However, if any of these experiments detect a primordial stochastic gravitational wave background, then measurements of its frequency dependence over a wide range of frequencies could provide a measurement of the shape of the power spectrum peak, e.g. [77, 9, 78, 74].
IV Conclusions
We have shown that transitions between different periods of inflation have a large effect on the resulting primordial power spectrum. Analytic work usually focuses on studying instantaneous transitions between periods with different growth rates of , because this allows an analytic solution to be found using a matching calculation. Whilst this technique is valuable for learning about the analytic behaviour of the power spectrum, we caution that instant transitions are unphysical and that realistic power spectra, based on physically realisable smooth transitions, have somewhat different behaviour. The “steepest” growth of in most ultra-slow-roll scenarios persists [6], but the oscillations after the peak are damped into something close to a plateau and the amplitude of the peak is also reduced. In at least one scenario capable of getting a steeper than growth [7], we have shown that this steeper growth is erased upon smoothing the transitions to reasonable durations.
We have also studied the implications of the shape of a large peak in the primordial power spectrum on the primordial black hole mass function. We have shown that changes in the steepness of the peak, provided the steepness is significantly greater than before the peak, or after the peak, have a negligible impact on the PBH mass function. As a corollary, we can also see that growth rates faster than the “common” limit of will not have any measurable impact on the PBH mass function, and even assuming an unrealistic delta-function power spectrum is adequate for this purpose. Although the conclusion that the PBH mass function has a minimum width (due to critical collapse and the impact of the smoothing when going from the curvature perturbation to the density contrast) is not new, our detailed study builds upon previous investigations. We have studied peaks with an equal power law growth and decay, peaks with an unequal growth and decay rate (as motivated by single-field models of ultra-slow-roll inflation) and also peaks including a plateau of variable width. In the case of a peak with a plateau, we have shown that plateau widths which correspond to scales exiting over less than about one e-fold () have a minimal impact on the PBH mass function, but a plateau width corresponding to scales exiting over two e-folds has a significant impact on boosting the large mass tail.
In light of this in-depth review of the limited effect of different power spectrum slopes on the mass function, we go on to show that power spectra from realistically smoothed inflationary transitions produce significantly different PBH mass distributions than those from instant transitions, thereby demonstrating the importance of calculating PBH mass distributions from initial conditions with smooth trajectories for the inflationary slow-roll parameters.
Acknowledgements
PC acknowledges support from the Institute of Physics at the University of Amsterdam. AG acknowledges support from the Science and Technology Facilities Council [grant numbers ST/S000550/1 and ST/W001225/1]. CB acknowledges support from the Science and Technology Facilities Council [grant number ST/T000473/1]. For the purpose of open access, the authors have applied a Creative Commons Attribution (CC BY) licence to any Author Accepted Manuscript version arising. We thank Sam Young for useful discussions. No new raw data were generated or analysed in support of this research.
References
- [1] M. Sasaki, T. Suyama, T. Tanaka and S. Yokoyama, Primordial black holes—perspectives in gravitational wave astronomy, Classical and Quantum Gravity 35(6) (2018) 063001 [1801.05235].
- [2] B. Carr, K. Kohri, Y. Sendouda and J. Yokoyama, Constraints on primordial black holes, Reports on Progress in Physics 84(11) (2021) 116902 [2002.12778].
- [3] B. Carr and F. Kühnel, Primordial Black Holes as Dark Matter: Recent Developments, Annual Review of Nuclear and Particle Science 70 (2020) 355 [2006.02838].
- [4] A. M. Green and B. J. Kavanagh, Primordial black holes as a dark matter candidate, Journal of Physics G 48(4) (2021) 043001 [2007.10722].
- [5] A. D. Gow, C. T. Byrnes, P. S. Cole and S. Young, The power spectrum on small scales: robust constraints and comparing PBH methodologies, Journal of Cosmology and Astroparticle Physics 2021(02) (2021) 002 [2008.03289].
- [6] C. T. Byrnes, P. S. Cole and S. P. Patil, Steepest growth of the power spectrum and primordial black holes, Journal of Cosmology and Astroparticle Physics 2019(06) (2019) 028 [1811.11158].
- [7] P. Carrilho, K. A. Malik and D. J. Mulryne, Dissecting the growth of the power spectrum for primordial black holes, Physical Review D 100(10) (2019) 103529 [1907.05237].
- [8] O. Özsoy and G. Tasinato, On the slope of the curvature power spectrum in non-attractor inflation, Journal of Cosmology and Astroparticle Physics 2020(04) (2020) 048 [1912.01061].
- [9] H. V. Ragavendra, P. Saha, L. Sriramkumar and J. Silk, Primordial black holes and secondary gravitational waves from ultraslow roll and punctuated inflation, Physical Review D 103(8) (2021) 083510 [2008.12202].
- [10] G. Tasinato, Analytic approach to non-slow-roll inflation, Physical Review D 103(2) (2021) 023535 [2012.02518].
- [11] G. A. Palma, S. Sypsas and C. Zenteno, Seeding Primordial Black Holes in Multifield Inflation, Physical Review Letters 125(12) (2020) 121301 [2004.06106].
- [12] J. Fumagalli, S. Renaux-Petel, J. W. Ronayne and L. T. Witkowski, Turning in the landscape: a new mechanism for generating Primordial Black Holes, (2020) [2004.08369].
- [13] M. Braglia, X. Chen and D. K. Hazra, Probing primordial features with the stochastic gravitational wave background, Journal of Cosmology and Astroparticle Physics 2021(03) (2021) 005 [2012.05821].
- [14] G. Felder, L. Kofman and A. Linde, Instant preheating, Physical Review D 59(12) (1999) 123523 [hep-ph/9812289].
- [15] G. Felder, L. Kofman and A. Linde, Inflation and preheating in nonoscillatory models, Physical Review D 60(10) (1999) 103505 [hep-ph/9903350].
- [16] M. H. Namjoo, H. Firouzjahi and M. Sasaki, Violation of non-Gaussianity consistency relation in a single-field inflationary model, Europhysics Letters 101(3) (2013) 39001 [1210.3692].
- [17] Y.-F. Cai et al., Revisiting non-Gaussianity from non-attractor inflation models, Journal of Cosmology and Astroparticle Physics 2018(05) (2018) 012 [1712.09998].
- [18] O. Özsoy and G. Tasinato, Consistency conditions and primordial black holes in single field inflation, Physical Review D 105(2) (2022) 023524 [2111.02432].
- [19] S. Passaglia, W. Hu and H. Motohashi, Primordial black holes and local non-Gaussianity in canonical inflation, Physical Review D 99(4) (2019) 043536 [1812.08243].
- [20] V. Atal and C. Germani, The role of non-gaussianities in primordial black hole formation, Physics of the Dark Universe 24 (2019) 100275 [1811.07857].
- [21] V. Atal, J. Cid, A. Escrivà and J. Garriga, PBH in single field inflation: the effect of shape dispersion and non-Gaussianities, Journal of Cosmology and Astroparticle Physics 2020(05) (2020) 022 [1908.11357].
- [22] M. W. Davies, P. Carrilho and D. J. Mulryne, Non-Gaussianity in inflationary scenarios for primordial black holes, Journal of Cosmology and Astroparticle Physics 2022(06) (2022) 019 [2110.08189].
- [23] D. G. Figueroa, S. Raatikainen, S. Räsänen and E. Tomberg, Implications of stochastic effects for primordial black hole production in ultra-slow-roll inflation, Journal of Cosmology and Astroparticle Physics 2022(05) (2022) 027 [2111.07437].
- [24] K. Inomata, E. McDonough and W. Hu, Amplification of primordial perturbations from the rise or fall of the inflaton, Journal of Cosmology and Astroparticle Physics 2022(02) (2022) 031 [2110.14641].
- [25] R. Bravo, S. Mooij, G. A. Palma and B. Pradenas, Vanishing of local non-Gaussianity in canonical single field inflation, Journal of Cosmology and Astroparticle Physics 2018(05) (2018) 025 [1711.05290].
- [26] R. Bravo, S. Mooij, G. A. Palma and B. Pradenas, A generalized non-Gaussian consistency relation for single field inflation, Journal of Cosmology and Astroparticle Physics 2018(05) (2018) 024 [1711.02680].
- [27] S. Matarrese, L. Pilo and R. Rollo, Resilience of long modes in cosmological observables, Journal of Cosmology and Astroparticle Physics 2021(01) (2021) 062 [2007.08877].
- [28] T. Suyama, Y. Tada and M. Yamaguchi, Revisiting non-Gaussianity in non-attractor inflation models in the light of the cosmological soft theorem, Progress of Theoretical and Experimental Physics 2021(7) (2021) 073E02 [2101.10682].
- [29] C. Pattison, V. Vennin, H. Assadullahi and D. Wands, Quantum diffusion during inflation and primordial black holes, Journal of Cosmology and Astroparticle Physics 2017(10) (2017) 046 [1707.00537].
- [30] C. Pattison, V. Vennin, H. Assadullahi and D. Wands, Stochastic inflation beyond slow roll, Journal of Cosmology and Astroparticle Physics 2019(07) (2019) 031 [1905.06300].
- [31] J. M. Ezquiaga, J. García-Bellido and V. Vennin, The exponential tail of inflationary fluctuations: consequences for primordial black holes, Journal of Cosmology and Astroparticle Physics 2020(03) (2020) 029 [1912.05399].
- [32] C. Pattison, V. Vennin, D. Wands and H. Assadullahi, Ultra-slow-roll inflation with quantum diffusion, Journal of Cosmology and Astroparticle Physics 2021(04) (2021) 080 [2101.05741].
- [33] M. Biagetti et al., The formation probability of primordial black holes, Physics Letters B 820 (2021) 136602 [2105.07810].
- [34] G. Ballesteros, J. Rey, M. Taoso and A. Urbano, Stochastic inflationary dynamics beyond slow-roll and consequences for primordial black hole formation, Journal of Cosmology and Astroparticle Physics 2020(08) (2020) 043 [2006.14597].
- [35] E. D. Stewart, Spectrum of density perturbations produced during inflation to leading order in a general slow-roll approximation, Physical Review D 65(10) (2002) 103508 [astro-ph/0110322].
- [36] F. Arroja, A. E. Romano and M. Sasaki, Large and strong scale dependent bispectrum in single field inflation from a sharp feature in the mass, Physical Review D 84(12) (2011) 123503 [1106.5384].
- [37] J. C. Niemeyer and K. Jedamzik, Near-Critical Gravitational Collapse and the Initial Mass Function of Primordial Black Holes, Physical Review Letters 80(25) (1998) 5481 [astro-ph/9709072].
- [38] J. Yokoyama, Cosmological constraints on primordial black holes produced in the near-critical gravitational collapse, Physical Review D 58(10) (1998) 107502 [gr-qc/9804041].
- [39] F. Kühnel, C. Rampf and M. Sandstad, Effects of critical collapse on primordial black-hole mass spectra, The European Physical Journal C 76(2) (2016) 93 [1512.00488].
- [40] A. D. Gow, C. T. Byrnes and A. Hall, Accurate model for the primordial black hole mass distribution from a peak in the power spectrum, Physical Review D 105(2) (2022) 023503 [2009.03204].
- [41] C.-M. Yoo, T. Harada, J. Garriga and K. Kohri, Primordial black hole abundance from random Gaussian curvature perturbations and a local density threshold, Progress of Theoretical and Experimental Physics 2018(12) (2018) 123E01 [1805.03946].
- [42] C.-M. Yoo, J.-O. Gong and S. Yokoyama, Abundance of primordial black holes with local non-Gaussianity in peak theory, Journal of Cosmology and Astroparticle Physics 2019(09) (2019) 033 [1906.06790].
- [43] C. Germani and R. K. Sheth, Nonlinear statistics of primordial black holes from Gaussian curvature perturbations, Physical Review D 101(6) (2020) 063520 [1912.07072].
- [44] S. Young and M. Musso, Application of peaks theory to the abundance of primordial black holes, Journal of Cosmology and Astroparticle Physics 2020(11) (2020) 022 [2001.06469].
- [45] M. Kawasaki and H. Nakatsuka, Effect of nonlinearity between density and curvature perturbations on the primordial black hole formation, Physical Review D 99(12) (2019) 123501 [1903.02994].
- [46] S. Young, I. Musco and C. T. Byrnes, Primordial black hole formation and abundance: contribution from the non-linear relation between the density and curvature perturbation, Journal of Cosmology and Astroparticle Physics 2019(11) (2019) 012 [1904.00984].
- [47] V. De Luca et al., The ineludible non-Gaussianity of the primordial black hole abundance, Journal of Cosmology and Astroparticle Physics 2019(07) (2019) 048 [1904.00970].
- [48] A. Kalaja et al., From primordial black holes abundance to primordial curvature power spectrum (and back), Journal of Cosmology and Astroparticle Physics 2019(10) (2019) 031 [1908.03596].
- [49] K. Ando, K. Inomata and M. Kawasaki, Primordial black holes and uncertainties in the choice of the window function, Physical Review D 97(10) (2018) 103528 [1802.06393].
- [50] S. Young, The primordial black hole formation criterion re-examined: Parametrisation, timing and the choice of window function, International Journal of Modern Physics D 29(02) (2020) 2030002 [1905.01230].
- [51] Y.-F. Cai, X. Tong, D.-G. Wang and S.-F. Yan, Primordial Black Holes from Sound Speed Resonance during Inflation, Physical Review Letters 121(8) (2018) 081306 [1805.03639].
- [52] B. Carr and F. Kühnel, Primordial black holes with multimodal mass spectra, Physical Review D 99(10) (2019) 103535 [1811.06532].
- [53] A. Hall, A. D. Gow and C. T. Byrnes, Bayesian analysis of LIGO-Virgo mergers: Primordial versus astrophysical black hole populations, Physical Review D 102(12) (2020) 123524 [2008.13704].
- [54] R. Zheng, J. Shi and T. Qiu, On primordial black holes and secondary gravitational waves generated from inflation with solo/multi-bumpy potential, Chinese Physics C 46(4) (2022) 045103 [2106.04303].
- [55] K. Inomata, M. Kawasaki, K. Mukaida and T. T. Yanagida, Double inflation as a single origin of primordial black holes for all dark matter and LIGO observations, Physical Review D 97(4) (2018) 043514 [1711.06129].
- [56] r. Y. B. Zeldovich and R. A. Sunyaev, The interaction of matter and radiation in a hot-model universe, Astrophysics and Space Science 4(3) (1969) 301.
- [57] R. A. Sunyaev and r. Y. B. Zeldovich, The interaction of matter and radiation in the hot model of the universe, II, Astrophysics and Space Science 7(1) (1970) 20.
- [58] W. Hu and J. Silk, Thermalization and spectral distortions of the cosmic background radiation, Physical Review D 48(2) (1993) 485.
- [59] J. Chluba and R. A. Sunyaev, The evolution of CMB spectral distortions in the early Universe, Monthly Notices of the Royal Astronomical Society 419(2) (2012) 1294 [1109.6552].
- [60] R. Khatri and R. A. Sunyaev, Beyond and : the shape of the CMB spectral distortions in the intermediate epoch, , Journal of Cosmology and Astroparticle Physics 2012(09) (2012) 016 [1207.6654].
- [61] T. Bringmann, P. Scott and Y. Akrami, Improved constraints on the primordial power spectrum at small scales from ultracompact minihalos, Physical Review D 85(12) (2012) 125027 [1110.2484].
- [62] M. Gosenca, J. Adamek, C. T. Byrnes and S. Hotchkiss, 3D simulations with boosted primordial power spectra and ultracompact minihalos, Physical Review D 96(12) (2017) 123519 [1710.02055].
- [63] M. Sten Delos, A. L. Erickcek, A. P. Bailey and M. A. Alvarez, Are ultracompact minihalos really ultracompact?, Physical Review D 97(4) (2018) 041303(R) [1712.05421].
- [64] M. Sten Delos, A. L. Erickcek, A. P. Bailey and M. A. Alvarez, Density profiles of ultracompact minihalos: Implications for constraining the primordial power spectrum, Physical Review D 98(6) (2018) 063527 [1806.07389].
- [65] T. Nakama, K. Kohri and J. Silk, Ultracompact minihalos associated with stellar-mass primordial black holes, Physical Review D 99(12) (2019) 123530 [1905.04477].
- [66] M. Karami, N. Afshordi and J. Zavala, Forward modelling of quasar light curves and the cosmological matter power spectrum on milliparsec scales, (2018) [1805.06984].
- [67] V. S. H. Lee, A. Mitridate, T. Trickle and K. M. Zurek, Probing small-scale power spectra with pulsar timing arrays, Journal of High Energy Physics 2021(06) (2021) 028 [2012.09857].
- [68] S. Wagner-Carena et al., From Images to Dark Matter: End-To-End Inference of Substructure From Hundreds of Strong Gravitational Lenses, (2022) [2203.00690].
- [69] B. C. Lacki and J. F. Beacom, PRIMORDIAL BLACK HOLES AS DARK MATTER: ALMOST ALL OR ALMOST NOTHING, The Astrophysical Journal Letters 720(1) (2010) L67 [1003.3466].
- [70] J. Adamek, C. T. Byrnes, M. Gosenca and S. Hotchkiss, WIMPs and stellar-mass primordial black holes are incompatible, Physical Review D 100(2) (2019) 023506 [1901.08528].
- [71] B. Carr, F. Kühnel and L. Visinelli, Black holes and WIMPs: all or nothing or something else, Monthly Notices of the Royal Astronomical Society 506(3) (2021) 3648 [2011.01930].
- [72] M. Boudaud et al., In-depth analysis of the clustering of dark matter particles around primordial black holes. Part I. Density profiles, Journal of Cosmology and Astroparticle Physics 2021(08) (2021) 053 [2106.07480].
- [73] C. Yuan and Q.-G. Huang, A topic review on probing primordial black hole dark matter with scalar induced gravitational waves, iScience 24(8) (2021) 102860 [2103.04739].
- [74] G. Domenech, Scalar Induced Gravitational Waves Review, Universe 7(11) (2021) 398 [2109.01398].
- [75] NANOGrav collaboration, The NANOGrav 12.5 yr Data Set: Search for an Isotropic Stochastic Gravitational-wave Background, The Astrophysical Journal Letters 905(2) (2020) L34 [2009.04496].
- [76] S. Wang, T. Terada and K. Kohri, Prospective constraints on the primordial black hole abundance from the stochastic gravitational-wave backgrounds produced by coalescing events and curvature perturbations, Physical Review D 99(10) (2019) 103531 [1903.05924].
- [77] S. Pi and M. Sasaki, Gravitational waves induced by scalar perturbations with a lognormal peak, Journal of Cosmology and Astroparticle Physics 2020(09) (2020) 037 [2005.12306].
- [78] I. Dalianis and K. Kritos, Exploring the spectral shape of gravitational waves induced by primordial scalar perturbations and connection with the primordial black hole scenarios, Physical Review D 103(2) (2021) 023505 [2007.07915].