A dusty compact object bridging galaxies and quasars at cosmic dawn
Abstract
Understanding how super-massive black holes form and grow in the early Universe has become a major challenge[1, 2] since the discovery of luminous quasars only 700 million years after the Big Bang[3, 4]. Simulations indicate an evolutionary sequence of dust-reddened quasars emerging from heavily dust-obscured starbursts that then transition to unobscured luminous quasars by expelling gas and dust[5]. Although the last phase has been identified out to a redshift of 7.6,[6] a transitioning quasar has not been found at similar redshifts owing to their faintness at optical and near-infrared wavelengths. Here we report observations of an ultraviolet compact object, GNz7q, associated with a dust-enshrouded starburst at a redshift of . The host galaxy is more luminous in dust emission than any other known object at this epoch, forming 1,600 solar masses of stars per year within a central radius of 480 parsec. A red point source in the far-ultraviolet is identified in deep, high-resolution imaging and slitless spectroscopy. GNz7q is extremely faint in X-rays, which indicates the emergence of a uniquely ultraviolet compact star-forming region or a Compton-thick super-Eddington black-hole accretion disk at the dusty starburst core. In the latter case, the observed properties are consistent with predictions from cosmological simulations[7] and suggest that GNz7q is an antecedent to unobscured luminous quasars at later epochs.
Cosmic Dawn Center (DAWN), Copenhagen, Denmark
Niels Bohr Institute, University of Copenhagen, Jagtvej 128, DK-2200 Copenhagen N, Denmark
DTU-Space, Technical University of Denmark, Elektrovej 327, DK-2800 Kgs. Lyngby, Denmark
Max Planck Institute for Astronomy, Konigstuhl 17, 69117 Heidelberg, Germany
National Radio Astronomy Observatory, Pete V. Domenici Array Science Center, P.O. Box O, Socorro, NM 87801, USA
INAF-Osservatorio Astronomico di Roma, via di Frascati 33, I-00040, Monteporzio Catone, Italy
European Southern Observatory, Karl Schwarzschild Str. 2, D-85748 Garching, Germany
Dipartimento di Fisica, Universitá di Roma La Sapienza P.le Aldo Moro 2, I-00185 Roma, Italy
Centro de Astrobiología (CAB, CSIC-INTA), Carretera de Ajalvir, 28850 Torrejón de Ardoz, Madrid, Spain
Steward Observatory, University of Arizona, 933 N Cherry Avenue, Tucson AZ, 85718, USA
Geneva Observatory, University of Geneva, Chemin Pegasi 51, 1290 Versoix, Switzerland
IRAM, Domaine Universitaire, 300 rue de la Piscine, 38406 Saint-Martin-d’Hères, France
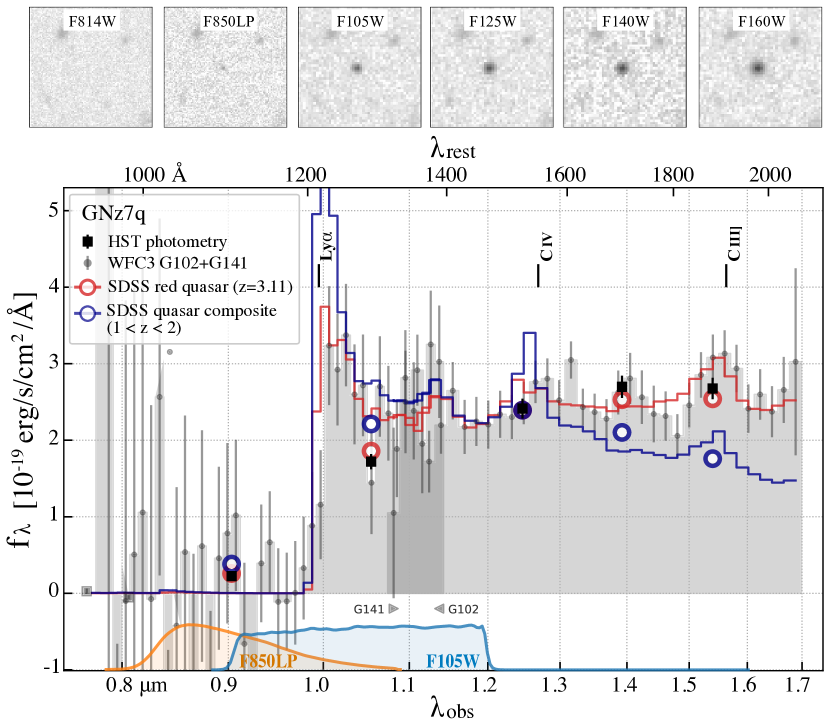
In recent uniform reprocessing of all archival Hubble Space Telescope (HST) imaging and slitless spectroscopy (see Methods), GNz7q was identified in the GOODS-North extra-galactic field as a luminous galaxy candidate at a redshift with the F160W band AB magnitude of 23.09 0.05. Although the source was detected and highlighted as a potential high-redshift galaxy by previous authors, it was never spectroscopically confirmed[8]. However, the full suite of HST data reveals an unambiguous continuum break at m which is best explained by a Lyman 1216- break at (Fig. 1).
GNz7q is distinct in the rest-frame UV when compared to any other object currently known at similar redshifts (). Its luminosity falls between typical quasars and galaxies and it is quite red in colour (Extended Data Fig. 1), with a rest-frame 1450 luminosity, , of mag and continuum slope, , of (see Methods). This is the reddest continuum slope found among objects at similar redshifts, (,[9, 10]) but is comparable to lower-redshift red quasars identified in the Sloan Digital Sky Survey (SDSS)[11] (Fig. 1). GNz7q is also spatially unresolved in all HST bands (Extended Data Fig. 2) and is bright at rest-frame 3 m, detected with Spitzer/MIPS. These characteristics suggest that GNz7q is a distant, red quasar.
However, GNz7q is not detected in the extremely deep 2 Ms X-ray map of the Chandra Deep Field North[12]. Even accounting for obscuration, we obtain an upper limit (99% confidence level) on the X-ray luminosity of erg s-1 (see Methods). This is several orders of magnitude lower than what would be predicted by assuming the correlation between and optical luminosity observed for other quasars (Extended Data Fig. 3). GNz7q is therefore strikingly faint in 2–10 keV X-rays, apparently in tension with its being a quasar. The absence of strong, broad UV emission lines (Fig. 1) in addition to this unique X-ray faintness raises the possibility that GNz7q could instead be an extreme UV-compact star-forming object.
1- and 3-millimeter (mm) observations were carried out with the NOrthern Extended Millimeter Array (NOEMA) between June 2020 and February 2021 (see Methods). The [C ii] 158 m line was robustly detected at 17 peak intensity at a redshift of , consistent with the Lyman-break redshift. The underlying 1 mm and 3 mm continua are also detected at 16 and 3.9 respectively. The sky positions of the 1 and 3 mm continua and emission line are consistent with the HST source. The [C ii] line is spatially resolved with an effective radius of kpc. The 1 mm continuum is unresolved with an upper limit of kpc, suggesting that the majority of the far-infrared (IR) emission is arising from a compact region of kpc2. No close neighbors are detected in the mm line or continuum maps. However, a second source (“ND1”) is seen in the 1 mm continuum map that is undetected in the deep HST images and can be best explained as a dusty companion 16 kpc from GNz7q (see Methods).
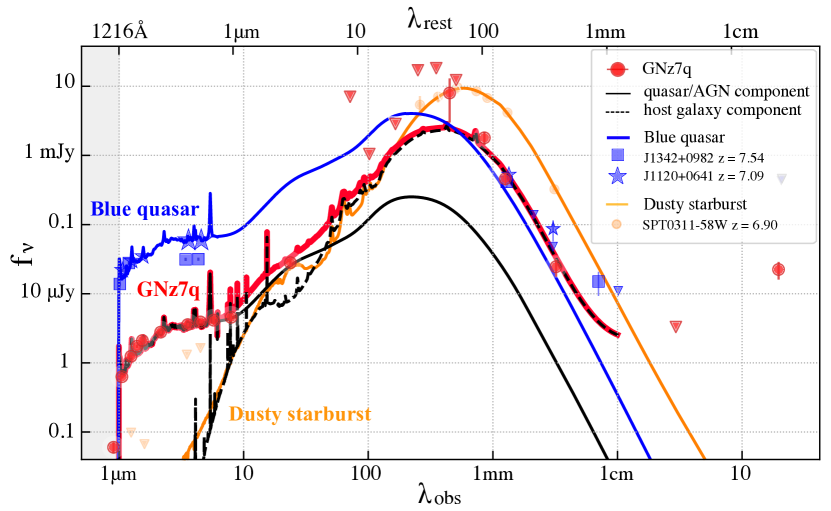
The precise redshift determination and the rich multi-wavelength datasets in the GOODS-North field provide a unique opportunity to constrain the host galaxy properties separate from the UV-luminous core. Fits to the optical-to-mm spectral energy distribution (SED) yield an IR luminosity (rest-frame 8–1,000 m) of (where is the luminosity of the Sun) (Fig. 2). This corresponds to a star-formation rate (SFR) of yr-1 after removing the potential contribution of the emission associated with the active galactic nucleus (AGN). Regardless of the interpretation, the host of GNz7q is the most vigorously star-forming galaxy at found to date[6]. It has a SFR surface density of yrkpc-2, which is at the Eddington limit for star-forming galaxies[13]. Treating GNz7q as a UV-compact star-forming object instead of an AGN would increase the SFR estimate. The dust in the host has a peak temperature of K, warmer than typical high-redshift quasar hosts by a factor of .[14] The ratio also shows one of the lowest values so far seen. The high dust temperature and relatively faint [C ii] emission may be due to the maximal SFR surface density, as the strong radiation field produced by the intense starburst increases and decreases the abundance of singly-ionized carbon. Dust and gas masses are estimated at and making GNz7q one of the most dust- and gas-rich systems known at (see Methods). The presence of the proximate ND1 galaxy is consistent with the high abundance of companion galaxies reported around luminous quasars at .[15]
The shape of the NIR–MIR SED of GNz7q—especially the excess emission at rest-frame 3 m—cannot easily be explained by emission from stars and ionized gas associated with star-formation activity alone (Fig. 2 and Extended Data Fig. 8). Moreover, fitting a profile to the HST images provides a stringent upper limit for the effective radius of only 60 pc for the UV emission (see Methods). If this compact emission were attributed to star-formation, the SFR surface density from the UV alone would reach 5,000 yr-1 kpc-2, two orders of magnitude higher than the UV-luminous compact galaxies reported at –3 (Extended Data Fig. 7)[16]. Taken together, the properties of GNz7q favor the interpretation of the UV source as a red quasar. Its properties are in excellent agreement with the transition phase of the evolutionary paradigm of super-massive black holes (SMBHs): a low-luminosity, dust-obscured quasar emerging in a vigorously star-bursting host. The detection of dust-obscured, super-Eddington accretion objects hosted by starburst galaxies has so far been reported up to .[17] GNz7q at is found at a cosmic time that is 500 million years earlier, close to the earliest SMBH known at .[6] The AGN in GNz7q is two orders of magnitude fainter than its lower- analog at , but with a host SFR 3 times higher, suggesting that GNz7q is experiencing an early stage of its transition phase.
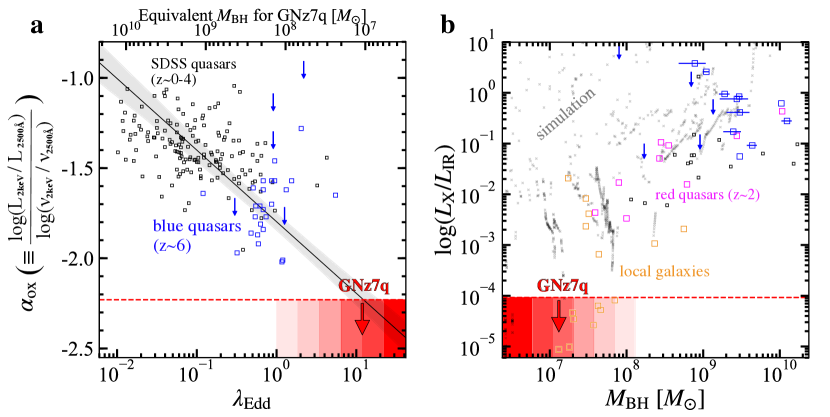
GNz7q’s extreme X-ray faintness is a strong indicator of the young age of the quasar. Extrapolating the anti-correlation[18] between X-ray luminosity and AGN Eddington ratio () to the X-ray upper limit of GNz7q, we obtain an Eddington ratio significantly (5.5) greater than unity and a black hole mass of only (Fig. 3a, see also Methods). X-ray-weak quasars are found to be abundant among weak emission line quasars (rest-frame equivalent width of C iv EW(CIV) )[19, 20] with more powerful nuclear winds[21]. These trends can be explained by a scenario where the inner region of the accretion disk is strongly inflated to a substantial height due to the unusually high accretion, which blocks the nuclear ionizing continuum and the X-rays from reaching the broad line region and external observers[19]. GNz7q is indeed lacking the C iv line in our spectroscopy (EW(CIV) 10), consistent with this scenario.
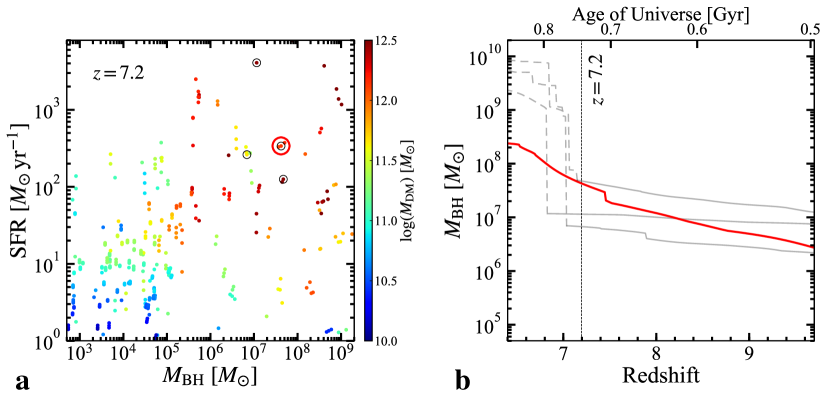
These observational results can be compared with cosmological semi-analytic models for progenitors of high- quasars [22, 7]. Among simulated merger histories, several progenitors with multi-wavelength properties similar to GNz7q indeed have relatively low mass SMBHs (), but still reside in the most massive halos of at (Fig. 4). These simulations show that all of these progenitors will evolve into optically-luminous blue quasars harboring a SMBH with at . This indicates that GNz7q could be the direct progenitor of an optically-luminous quasar, although models do not rule out the possibility that GNz7q will fail to finalize its transition at later epochs because of possible mergers with other halos hosting more massive BHs. The simulations and recent observations also predict a tight correlation between and the X-ray luminosity normalized by infrared luminosity , confirming that the unique X-ray faintness of GNz7q corresponds to the regime of (Fig. 3b).
Given the short-lived nature of a transitioning red quasar and the intrinsically low sky density of the quasar population[23], it is remarkable to find GNz7q within the 170 arcmin2 GOODS-North field. Assuming instead a total survey area of the entire HST archive of nearly 3 deg2, the identification of GNz7q suggests a sky density of 0.33 deg-1 and a lower limit of 3.3 deg-1 based on the Poisson uncertainty at the 99% single-sided confidence level[24]. However, the quasar luminosity function (QLF) and the red quasar fraction at suggest a much lower predicted sky density of 6.8 deg-1, even for less luminous red quasars similar to GNz7q[26, 25]. A recent HST study also reports a potentially higher density of less-luminous quasars at than the QLF at .[27] Together, these results may imply that the red and/or less-luminous quasar population is more common at than our understanding to date up to .[28] We note in passing that classical colour selections for high- quasars in ground-based surveys would recover the identification of GNz7q (see Methods). This implies that these quasar populations could have been missed in previous surveys due to their faint nature in the mid-IR (MIR) and X-rays and in their rest-frame UV lines, that are here overcome by the uniquely deep and rich multi-wavelength datasets of the GOODS-North field. A systematic high-resolution, deep imaging survey in the optical–MIR bands may discover additional objects similar to GNz7q. Furthermore, follow-up spectroscopy of broad Balmer lines for objects will become possible with the launch of the James Webb Space Telescope. This will have the power to decisively determine whether the quasar classification is correct as well as determine how common such quasars truly are. Even a non-detection of broad lines would imply intriguing conclusions, i.e. the existence of extraordinarily luminous and compact star-forming regions or stark differences between the first quasars and their descendants.
References
References
- [1] Volonteri, M. The Formation and Evolution of Massive Black Holes Science 337, 6094, 544–547 (2012).
- [2] Inayoshi, K. et al. The Assembly of the First Massive Black Holes Annual Review of Astronomy and Astrophysics 58, 27–97 (2020).
- [3] Mortlock, D. et al. A luminous quasar at a redshift of z = 7.085 Nature 474, 7353, 616–619 (2011).
- [4] Bañados, E. et al. An 800-million-solar-mass black hole in a significantly neutral Universe at a redshift of 7.5 Nature 553, 473, 473–476 (2018).
- [5] Hopkins, P et al. A Cosmological Framework for the Co-Evolution of Quasars, Supermassive Black Holes, and Elliptical Galaxies. II. Formation of Red Ellipticals Astrophsical Journal Supplement Series 175, 2, 390–422 (2008).
- [6] Wang, F. et al. A Luminous Quasar at Redshift 7.642 Astrophysical Journal Letter 907, 1, L1 (2021).
- [7] Ginolfi, M. et al. The infrared-luminous progenitors of high-z quasars Montly Notices of the Royal Astronomical Society 483, 1, 1256–1264 (2019).
- [8] Hathi, N. et al. Near-infrared Survey of the GOODS-North Field: Search for Luminous Galaxy Candidates at Astrophsical Journal 757, 1 (2012)
- [9] Bouwens, R. et al. UV-continuum Slopes of 4,000 Galaxies from the HUDF/XDF, HUDF09, ERS, CANDELS-South, and CANDELS-North Fields Astrophysical Journal 793, 115 (2014)
- [10] Selsing, J. et al. An X-Shooter composite of bright quasars from UV to infrared Astronomy & Astrophysics 585, A87 (2016)
- [11] Alam, S. et al. The Eleventh and Twelfth Data Releases of the Sloan Digital Sky Survey: Final Data from SDSS-III Astrophysical Journal Supplements Series 219, 1, 12 (2015)
- [12] Xue, Y. et al. The 2 Ms Chandra Deep Field-North Survey and the 250 ks Extended Chandra Deep Field-South Survey: Improved Point-source Catalogs Astrophysical Journal Supplementary 224, 2, 15 (2016)
- [13] Andrews, B. et al. Assessing Radiation Pressure as a Feedback Mechanism in Star-forming Galaxies Astrophysical Journal 727, 97 (2011)
- [14] Beelen, A. et al. 350 m Dust Emission from High-Redshift Quasars Astrophysical Journal 642, 2 (2006)
- [15] Decarli, R. et al. Rapidly star-forming galaxies adjacent to quasars at redshifts exceeding 6 Nature 545, 457–461 (2017)
- [16] Barro, G. et al. CANDELS+3D-HST: Compact SFGs at 2–3, the Progenitors of the First Quiescent Galaxies Astrophysical Journal 791, 1 (2014)
- [17] Tsai, C. et al. Super-Eddington Accretion in the WISE-selected Extremely Luminous Infrared Galaxy W2246-0526 Astrophysical Journal 819, 2 (2018)
- [18] Lusso, E. et al. The X-ray to optical-UV luminosity ratio of X-ray selected type 1 AGN in XMM-COSMOS Astronomy & Astrophysics 512, A34 (2010)
- [19] Luo, B. et al. X-ray Insights into the Nature of PHL 1811 Analogs and Weak Emission-line Quasars: Unification with a Geometrically Thick Accretion Disk Astrophysical Journal 805, 2 (2015)
- [20] Pu, X. et al. On the Fraction of X-ray-weak Quasars from the Sloan Digital Sky Survey Astrophysical Journal 900, 2 (2020)
- [21] Wu, J. et al. A Population of X-Ray Weak Quasars: PHL 1811 Analogs at High Redshift Astrophysical Journal 736, 1 (2011)
- [22] Valiante, R. et al. From the first stars to the first black holes Monthly Notices of the Royal Astronomical Society 457, 3, 3356–3371 (2016)
- [23] Glickman, E. et al. FIRST-2MASS Red Quasars: Transitional Objects Emerging from the Dust Astrophysical Journal 757, 1 (2012)
- [24] Gehrels, N. Confidence limits for small numbers of events in astrophysical data Astrophysical Journal 303, 336–346 (1986)
- [25] Kato, N. et al. Subaru High- Exploration of Low-Luminosity Quasars (SHELLQs). IX. Identification of two red quasars at Publications of the Astronomical Society of Japan 528, 35 (2020)
- [26] Matsuoka, Y. et al. Subaru High-z Exploration of Low-luminosity Quasars (SHELLQs). IV. Discovery of 41 Quasars and Luminous Galaxies at Astrophysical Journal Supplement Series 237, 5 (2018)
- [27] Morishita, T. et al. SuperBoRG: Exploration of Point Sources at in HST Parallel Fields Astrophysical Journal 904, 1 (2020)
- [28] Ni, Y. et al. QSO obscuration at high redshift (z 7): predictions from the BLUETIDES simulation Monthly Notices of the Royal Astronomical Society 495, 2, 2135–2151 (2020)
- [29] Marrone, D. et al. Galaxy growth in a massive halo in the first billion years of cosmic history Nature 553, 51–54 (2018)
0.1 Acknowledgements
We thank M. Onoue, K. Ichikawa, Y. Harikane, and Y. Ono for discussions on the physical properties of GNz7q and the AGN fraction among the brightest Lyman-break galaxies at ; E. Murphy and F. Owen for sharing their VLA data; D. Marrone for sharing the best-fit SED model of SPT0311-58W; K. Whitaker for a helpful advise on writing the manuscript. This work is based on the archival data of Hubble Space Telescope, Spitzer, Chandra, Subaru, Herschel, James Clerk Maxwell Telescope, and The Karl G. Jansky Very Large Array, and the observations of IRAM/NOEMA interferometer (program ID: E19AD and W20EO). We acknowledge support from: the Danish National Research Foundation under grant No. 140; the European Research Council (ERC) Consolidator Grant funding scheme (project ConTExt, grant No. 648179); Independent Research Fund Denmark grants DFF–7014-00017; DFF-8021-00130; the Villum Fonden research grant 37440, “The Hidden Cosmos”; the European Union’s Horizon 2020 research and innovation program under the Marie Sklodowska-Curie grant agreement No. 847523 “INTERACTIONS”.
0.2 Author contributions
G.B. reduced and analyzed the optical–NIR data of HST and Spitzer and discovered GNz7q. S.F., G.B., S.T., G.M., D.W., F.V., C.S., J.F., L.C., R.M. M.V., and F.W. discussed and planned the follow-up observing strategy and the data analysis. G.B., G.M., and V.K. conducted the SED analysis and wrote the relevant Methods section. G.B. produced Figs. 1, 2, and Extended Data Figs. 2 and 8. D.W. analyzed the X-ray properties from the Chandra data and wrote the relevant Methods section, T.G. reduced and analyzed the SCUBA2 data, and M.K. and I.C. reduced the NOEMA data. R.V., M.G., and R.S. performed the cosmological semi-analytical simulation GAMETE/QSOdust and wrote the relevant Methods section. F.R. worked on the 3D modeling for the NOEMA [C ii]-line data cube. P.O. investigate the properties of the dust-continuum object identified near GNz7q. All authors discussed the results and commented on the manuscript. S.F. led the team, being Principal Investigator of the follow-up NOEMA programs, analyzed the NOEMA data, wrote the main text and the Methods section, produced Figs. 3 and 4, Extended Data Tables, and Figs. 1, 3–7, 9–11.
0.3 Competing interests
The authors declare no competing interests.
0.4 Corresponding Author
Seiji Fujimoto (fujimoto@nbi.ku.dk)
Figures
In this paper, error values represent the uncertainty, where denotes the root-mean-square or standard deviation; upper limits are indicated at the 3 level; red symbols in figures denote GNz7q, unless otherwise specified.
0.5 1. Cosmology
We adopt cosmological parameters measured by the Planck mission[1], i.e. a cold dark matter (CDM) model with total matter, vacuum and baryonic densities in units of the critical density, 0.76, = 0.24, 0.04, and Hubble constant, km Mpc-1, with 0.73 Based on these parameters, we adopt the angular size distance of 5.32 kpc/arcsec at the source redshift of in this paper.
0.6 2. Definition of quasar categories
In this paper, we make a distinction between a reddened Type 1 quasar and a Type 2 quasar, where we refer to the former as the red quasar. A Type 1 quasar is defined to have at least one broad emission line (FWHM 1,000–2,000 km s-1) in the spectrum, while Type 2 quasars are defined by those that do not satisfy it, but has too bright narrow UV-optical or IR emission lines, X-ray, or radio continuum for a galaxy[2]. In the classical AGN unification models, this difference is generally explained by different viewing angles toward the central accretion disk[3, 4], where the observer’s line of sight in Type 2 quasars penetrates through optically-thick dusty material due to the nearly edge-on view of the dust torus that blocks the nuclear broad emission lines. In this context, red quasars are generally defined to have at least one broad emission line in the spectrum, distinguishing them from Type 2 quasars, but to be substantially reddened by dust. The extent of the dust reddening has been estimated a number of ways in the literature based on optical[5, 23, 25], optical-MIR[6, 7], NIR-radio[8, 9], and MIR[10, 11]. For example, the red quasar is characterized by the optical colour excess of in the optical colour selection[5, 23, 25]. Following these definitions, the SDSS quasar at (Fig. 1, SDSS spec-6839-56425-146) is classified as a red quasar with = 0.13.[12] W2246-0526 is also classified as a red quasar that is a super-Eddington, extremely luminous, and dust-obscured quasar at with broad Mgii and Civ emission lines and = 5. [17, 13, 14] Because several sub-millimeter galaxies (SMGs; flux density at 850 a few mJy) at are reported to have broad emission lines and , we regard these SMGs also as red quasars[16] in this paper. Local (ultra) luminous infrared galaxies ((U)LIRGs) and high-redshift SMGs that are not confirmed to have broad emission lines are referred to as dusty starbursts, while we refer to the hot dust-obscured quasars confirmed with the broad emission lines[15] as red quasars in this paper. We refer to Type 1 quasars from the literature that do not exceed the red colour threshold of as blue quasars in this paper.
0.7 3. Uniform processing of archival HST and Spitzer data
GNz7q was identified in a project nicknamed the Complete Hubble Archive for Galaxy Evolution (CHArGE). CHArGE aims to perform uniform processing and analysis of all archival HST and Spitzer data taken away from the Galactic midplane. HST Advanced Camera for Surveys (ACS) optical and the Wide Field Camera 3 (WFC3) near-infrared and Spitzer/Infrared Array Camera (IRAC) observations covering GNz7q were carried out by a variety of large extra-galactic surveys and individual programs. HST images were obtained in the F435W (6 exposures; 7.2 ks integration), F606W (23 exp.; 9.3 ks), F775W (35 exp.; 19 ks), F814W (42 exp.; 24 ks), F850LP (82 exp.; 37 ks), F105W (6 exp.; 3.3 ks), F125W (8 exp.; 4.4 ks), F140W (6 exp.; 1.2 ks), and F160W (8 exp.; 5.4 ks) filters. The IRAC channel 1 () and channel 2 () integrations are 345 ks and 330 ks, respectively. We aligned all of the HST exposures to sources in the GAIA DR2 catalog[17] and created final mosaics in a common pixel frame with 50 mas and 100 mas pixels for the ACS/WFC and WFC3/IR filters, respectively. We aligned the individual Spitzer exposures to the same astrometric frame as the HST frame and generated final drizzled IRAC mosaics with pixels. Further details of the HST (Spitzer) image processing with the grizli (golfir) software will be presented in Kokorev (in prep.). In Fig. 1, we present the HST images of GNz7q.
Archival HST slitless spectroscopy of GNz7q is available with integration times 8.8 ks (12.7 ks) in the G102 (G141) grisms from HST General Observer (GO) program 13420 (11600). Together the two grisms cover m without any gaps (Fig. 1). The slitless spectra are reduced and extracted with the grizli software[18].
The HST broad-band images and slitless spectroscopy show an unambiguous continuum break at m. By using a SDSS red quasar template at (SDSS spec-6839-56425-146)[11, 12], we obtain the rest-frame UV redshift at . This is consistent with the [C ii] 158-m line redshift of within the uncertainties (Section 4). We fit a power-law () model to the rest-frame UV continuum of the G141 slitless spectrum at 1.10–1.66 m, excluding 1.50–1.60 mto avoid potential contribution from a C iii]1909 line and the noisy edge of the spectrum (Fig. 1), and measure a best-fit UV continuum slope . By subtracting the best-fit power-law continuum and optimizing the integration range of the spectrum, the broad Ly and C iii] lines are tentatively detected at 3.7 and 3.4 levels, respectively. Assuming a C iv line width of full-width-half-maximum (FWHM) 3,000 km s-1 typical among quasars from the literature[19], we derive a 3 upper limit of EW from the grism spectrum.
In Extended Data Fig. 1, we compare the rest-frame UV properties of GNz7q with other populations at similar redshifts. The absolute UV luminosity at 1450 () is estimated from the best-fit power-law model. We find that the UV luminosity of GNz7q falls between typical quasars and galaxies in the literature[19, 2, 20, 6], being 10 times fainter and brighter than typical quasars and galaxies, respectively, where several faint quasars and luminous galaxies have been reported[21, 28, 22, 23, 24, 25, 26, 27]. The UV continuum slope of GNz7q is redder than that of any other object in either comparison population.
Extended Data Fig. 2 shows the rest-frame UV morphology in all HST WFC3/IR bands and the radial profile of GNz7q observed with HST/F125W. The instrumental point spread function (PSF) model can fully explain the rest-frame UV morphology / radial profile in all bands. The Sérsic profile fitting with galfit[29] provides almost the same profile as the PSF model in all bands. Based on the F125W band, we measure an effective radius of pixel (pixel scale = ) and adopt a 2 upper limit of pix pc. We obtain similar results in the Sérsic profile fitting to the other bands.
0.8 3. NOEMA observations, data reduction, and measurements
We observed [C ii] with band 3 (1 mm), and CO(7–6), CO(6-5), and [C i](2-1) lines with band 1 (3 mm) of Institute Radio Astronomie Millimétrique (IRAM) NOrthern Extended Millimeter Array (NOEMA). The observations were carried out between 2020 June 17 and 2021 February 24 in various visits with the AC and D array configurations for the 1 mm and 3 mm observations, respectively, using 9–10 antennas. The data were processed in the standard manner with the pipeline using the latest version of the GILDAS software. We used CASA version 5.6 for the imaging[30].
For the [C ii] observations, the upper side band (USB) of the 1 mm band receiver was tuned to 231.8 GHz in the first execution with the C configuration to cover the [C ii] line at the source redshift estimated from the FUV Lyman continuum break (Fig. 1). After confirming the [C ii] line detection, we tuned lower side band (LSB) with the A configuration to cover a wide frequency range for the continuum emission. For the 3 mm observations, the 3 mm band receiver was tuned to 97.7 GHz to cover CO(7-6) and [C i](2-1) in the USB and CO(6-5) in the LSB. In both observations, 0851+202 served as band-pass phase calibrator. Additional targets 1300+580 and 1044+719 were used for the phase and amplitude calibrations. We calibrated the absolute flux scale against MWC349 whose flux is regularly monitored at NOEMA. We adopt conservative uncertainties on the absolute scale of 20% and 10% in the 1 mm and 3 mm observations, respectively. The total integration time on-source was 6.8 and 13.5 hours in the 1 mm and 3 mm bands, respectively.
To maximize sensitivity, we used natural weighting for the imaging. The resulting 1 mm and 3 mm maps have synthesized beam FWHM of and , with 1 sensitivities of 21 and 6.3 for the continuum, and 0.28 and 0.17 for the line per 60 channel, respectively. We produce the 1 mm and 3 mm continuum map from the all line-free channels, except for noisy channels around the central frequency channels of LSB and USB, and the line cubes with several velocity bins in the range of 40–60 . The central wavelengths of the 1 mm and 3 mm continuum maps are 1.284 mm and 3.276 mm, respectively.
The continuum is detected both from the 1 mm and 3 mm maps with the peak intensity at 16 and 3.9, respectively. The [C ii] line is robustly detected at GHz with FWHM= km s-1 and 17 peak intensity in the velocity-integrated map. This provides a precise determination of the source redshift of . At this source redshift, the CO(7-6) line is also detected at 5.7 peak intensity in the velocity integrated map with FWHM of km s-1. While the velocity-integrated CO(7-6) line shows a signal at a marginal significance level, we regard it as a tentative detection due to the difference in its line width from that of the [C ii] line beyond the 1 uncertainties. With optimised apertures, we estimate emission line luminosities of and . For area-integrated line intensities, we measure K km s-1 pc2 and K km s-1 pc2, respectively. CO(6-5) and [C i](2-1) lines are not detected with 5 upper limits of and . In Extended Data Fig. 3 and 4, we summarize the continuum, velocity-integrated maps, and the line spectra. We do not identify a clear velocity gradient in the [C ii] line. We list the continuum flux densities and the line luminosities in Extended Data Table 1 and 2, which includes statistical errors based on the optimized apertures and the absolute flux uncertainty of 10–20%, as discussed above.
We measure the effective radius of the 1.3 mm continuum () and the [C ii] line () emission from GNz7q (Extended Data Fig. 5) using the visibility-based fitting CASA task uvmodelfit. We adopt the 2-dimensional elliptical Gaussian model and leave all parameters free in the fitting routine. We obtain a best-fit major axis radius of ( kpc). On the other hand, the continuum fit did not converge and indicates that the continuum is not spatially resolved. The image-based fitting CASA task imfit provides consistent results for the spatially resolved [C ii] line and unresolved continuum. We estimate an upper limit to the continuum size based on an approximate formula for the smallest resolvable scale () sampled by the interferometric data [31]:
| (1) |
where is a coefficient, taking a range of 0.5–1.0, is a probability cutoff, and is a synthesized beam FWHM. Based on the 2 cutoff in the same manner as previous studies[32, 33, 34] and , we obtain the upper limit in FWHM of ( in effective radius) for the 1.3 mm continuum, corresponding to ). In Extended Data Fig. 5, we present the observed and residual maps and the best-fit visibility plot for the continuum and [C ii] line emission.
A nearby object is detected (9.4) in the 1.3 mm continuum map northeast of GNz7q, corresponding to a projected separation of 16 kpc if the two sources are at the same redshift. We obtain the 1.3 mm band photometry of 247 65 Jy for this object within a radius aperture. We do not identify any line features in either the 1 mm or 3 mm band spectra extracted at the position of the nearby object, nor do we identify any counterpart in the deep multi-wavelength imaging data from HST and Spitzer. We refer to this NIR-dark nearby object as “ND1” and consider two interpretations for it being either a chance projection of a foreground galaxy or a companion object associated with GNz7q. Such a population of NIR-dark galaxies has been recently reported, perhaps representing the most massive galaxies at 3–5.[35] However, given the low surface density of such galaxies, there is a very low probability to identify a ND1-like galaxy by chance within a small radius () from another particularly unique object like GNz7q. In fact, similarly NIR-dark galaxies have been recently identified at the same redshift as nearby massive galaxies at .[36] Therefore, we speculate that ND1 is a companion system associated with GNz7q which could eventually merge into a single system. Note that if we assume a typical modified blackbody (MBB) with 35 K and for the FIR SED of ND1 and a typical ratio of 10-3, the expected [C ii] line luminosity agrees with the non-detection of the [C ii] line from ND1 based on the current 1 mm data. This FIR SED for ND1 is also consistent with the non-detection in the 3 mm continuum due to its faintness and the cosmic microwave background (CMB) effect[39, 38, 37]. ND1 was subtracted before the uvmodelfit analysis, and thus the presence of ND1 does not affect our size measurements of the primary target.
0.9 4. Multi-band photometry
The optical and NIR photometry are mainly obtained from the CHArGE data sets. We further obtain multi-band photometry of GNz7q from X-ray to radio from the literature. Given the spatial resolution of each instrument, we adopt the cross-match radii in the range from to with the public catalogs in the literature. We identify that GNz7q is robustly detected also at 2.2 m (Subaru/Multi-Object InfraRed Camera and Spectrograph (MOIRCS)), 24 m (Spitzer/MIPS), 850 m ((Submillimetre Common-User Bolometer Array 2 (SCUBA2)), and 20 cm (JVLA) [40, 41, 42, 43]. For other data at 100–500 m (Herschel/Photodetector Array Camera and Spectrometer (PACS) and the Spectral and Photometric Imaging Receiver(SPIRE)) and 3 cm (JVLA)[44, 45, 46], we do not identify any counterparts. We measure the actual value at the source position in the JVLA 3 cm map, while we conservatively adopt upper limits for the Herchel maps from the instrumental and confusion sensitivities. We summarize the multi-band photometry and the literature in Extended Data Table 1. Note that we identify three nearby objects in multiple HST maps within a radius of (see top panels of Fig. 1). They are all detected in the F814W band and thus regarded as lower- objects, instead of companion galaxies at . Their contribution to the Spitzer photometry of GNz7q is subtracted or negligible in our analysis. They are resolved in the IRAC images with de-blended 4.5m flux densities of , and Jy, clockwise from the lower left. Besides, they are bluer than GNz7q, where galaxy templates that include re-emitted dust emission in the MIR have 24m / 4.5 m ratios between 0.5 and 10. Thus, the faint neighboring sources together could contribute a maximum of 10%, likely much less, of the unresolved 24-m source at the position of GNz7q.
For the SCUBA2 450 m photometry, we produced the continuum map by utilizing the all archive data existing in this field. We reduced the data and performed the imaging in the standard manner with the pipeline based on the starlink software. We identify a tentative (2.6) detection in the 450 m map including the flux-boosting correction based on the previous studies[47]. Because we identify the nearby object of ND1 in the NOEMA 1 mm map whose offset is smaller than the SCUBA2 beam, we subtract the potential contribution from ND1 in the 450 m photometry. We estimate the expected 450-m flux density of ND1 by assuming the typical MBB ( 35 K and ) at . In the same manner, we also subtract the contribution from ND1 in the 850 m photometry. We then obtain the 450 and 850 m photometry of and mJy, respectively, that are also listed in Extended Data Table 1. Note that we confirm the consistency between the results with and without the tentative detection at the 450 m band in the following analysis. Note that the contribution of the nearby faint HST objects to these FIR band photometry should be negligible due to the absence of the detection in the deep NOEMA 1 mm map. Although ND1 is detected in the deep NOEMA 1 mm map, a higher resolution 3 mm map with the briggs weighting (robust ) whose beam size is smaller than the offset of ND1 from GNz7q shows Jy at the position of ND1. Thus, the 3 mm photometry of GNz7q is not affected by ND1.
In X-rays, there are zero events in the relevant pixel of GNz7q, even with the Chandra 2 Ms integration, some of the deepest X-ray data ever taken[12]. The Chandra 2 Ms data have 0.171 mean background counts in the full band. Based on the continuous Poisson distribution with the mean of 0.171, we compute an upper limit on the net counts of 1.1 at the 99% confidence level. Assuming an average photon index obtained among high-redshift quasars up to ,[48, 4, 49] we use the online Portable Interactive Multi-Mission Simulator (see code availability) and estimate upper limits for the X-ray luminosity to be erg s-1 Hz-1 at 2 keV and erg s-1 at 2–10 keV, including a correction for the Galactic absorption in this direction with the hydrogen column density of cm-2.[50] Note that the upper limit estimate depends on the choice of . The typical range of spectral indices for X-ray AGN at this redshift is 1.7–2.3.[51] Assuming even an extremely soft spectrum of increases the luminosity upper limit by , still well below the expected value.
Following the definition of the optical to X-ray spectral index
| (2) |
we then obtain the upper limit of . Note that here we use the dust corrected value for . In Extended Data Fig. 6, we show the tight correlation between and previously observed for local and high- quasars[56, 18, 52, 48, 53]. The stringent upper limit of the X-ray luminosity makes GNz7q deviate from this correlation by more than 5. In Fig. 3a, we show another tight correlation between and known to exist among local and high- quasars[18, 52, 48, 53, 54, 55]. The black line shows the best-fit relation estimated in Lusso et al. (2010), and the gray shaded region represents the 68th percentile of the relation evaluated by propagation from the 1 uncertainties of the parameters that define the best-fit relation. This best-fit relation yields at the upper limit of . This indicates that GNz7q has at the level, and if is much smaller than , the significance level could be much increased. In Fig. 3b, the values of and for other populations are taken from the literature[48, 53, 57, 58, 59, 16]. We list the upper limits of the X-ray luminosity and in the Extended Data Table 2.
Note that it is difficult to explain the weak X-ray flux with selective absorption. This is because the redshift being so great means that we are observing very hard X-rays in the rest-frame. To extinguish the X-rays by a factor of 10 in the 2–10 keV observed frame requires a column density that is Compton-thick. This corresponds to a typical dust column of , which is orders of magnitude larger than our estimate of based on the rest-frame UV, optical, and NIR emission (Section 6). Furthermore, even if we were to assume that all of the gas was highly-ionised and the dust sublimated, so as to have no effect at optical wavelengths, the electron scattering depth would still be substantial, extinguishing the UV light by the same factor. Therefore, the uniquely faint X-ray limits of GNz7q suggests either intrinsically weak X-ray emission, or Compton-thick material that covers only the inner part of the accretion disk and causes different extinction between the X-ray and the UV–NIR emission. The latter is aligned with the scenario that the inner region of the accretion disk is strongly inflated to a substantial height due to the high accretion, a so-called slim disk scenario[19, 60].
0.10 5. Interpretations for GNz7q
Based on the multi-wavelength observation results, there are two possible interpretations for GNz7q: a Type 1 red quasar or a very compact UV-luminous starburst region. The quasar interpretation is supported by the compact and luminous UV emission and the bright detection at rest-frame 3 m (MIPS 24 m). The starburst interpretation is motivated by the stringent upper limit on the X-ray luminosity and the absence of the clear detection of broad FUV emission lines between Ly and C iii]1909.
In Extended Data Fig. 7, we compare the rest-frame UV size and luminosity of GNz7q with those of galaxies at and UV-compact galaxies at [62, 21, 16, 61]. For a more direct comparison, we show the observed UV luminosity without any dust correction. If the UV emission of GNz7q is interpreted as arising from hot, recently-formed stars, we find that the implied SFR surface density reaches 5,000 yr-1 kpc-2, exceeding that of even the UV-compact galaxies by two orders of magnitude; any dust correction will make this more extreme still. Such a luminous and compact object can more reasonably be explained by emission from a hot accretion disk in an active nucleus. In this case, the prominent FUV emission and its red continuum slope suggest that GNz7q is a Type 1 red quasar. The full SED analysis (Section 6) indicates an optical colour excess , which would satisfy the colour threshold for red quasars used in the literature[5, 23, 25].
Extended Data Fig. 8 shows NIR–MIR SED and colour properties of GNz7q, galaxies, and both local and high-redshift quasars. The most striking feature of the GNz7q SED is the red color between the observed Spitzer IRAC 8 m and MIPS 24 m band-passes, which probe rest-frame 1 and 3 m, respectively, at . A galaxy stellar population[63, 64] fit to the GNz7q photometry at is shown in the dark blue curve in Extended Data Fig. 8, along with additional stellar population templates that generally span the galaxy color space[65] and that include highly obscured starbursts[66]. Also shown is the average MIR spectrum of local quasars[67] and a collection of broad-band SEDs of quasars at [68]. The flux enhancement in the the MIPS 24 m band cannot be explained by reasonable galaxy stellar population models, which are relatively blue between rest-frame wavelengths 1–3 m largely independent of star formation history and dust attenuation (i.e., the “1.6 m” bump feature). However, the MIR colors of GNz7q are exactly consistent with the typical SEDs of quasars and active nuclei, where the rest-frame 3 m emission is thought to arise from hot dust associated with the nucleus[69, 70].
Although the broad UV emission lines are not clearly detected (Fig. 1), a notable group of quasars with exceptionally weak UV broad emission lines have been identified at lower redshifts[71, 72]. Moreover, the X-ray observations show that these weak emission line quasars also have weak X-ray emission with harder X-ray spectra and high-ionization lines that are more blue-shifted than those of normal quasars[21, 73, 74]. This suggests that the X-ray absorption is due to Compton-thick material covering the inner part of the accretion disk, consistent with the slim disk scenario (Section 4). A similar implication of the small, Compton-thick absorber has also been obtained from the weak X-ray emission in one of the nearest quasars embedded in the ULIRG-class dusty starburst Mrk 231,[75, 76] which also shows weak high-ionization lines and a very high nuclear outflow velocity of 8,000 km s-1.[77, 78] Therefore, the extremely faint X-ray luminosity and the lack of broad UV emission lines do not necessarily contradict the quasar interpretation. In summary, the combined multi-wavelength properties favor the quasar interpretation of GNz7q, although we cannot rule out the possibility that we are witnessing an emergence of the extremely compact and luminous star-forming region that is without precedent in either the local or distant universe.
0.11 6. UV–millimeter SED fitting
We fit the available photometry from UV to mm wavelengths with the SED-fitting code Stardust[79], which models the emission from stars, active galactic nucleus (AGN), and infrared emission arising from dust heated by star formation. The method does not rely on energy balance assumptions, and rather fits an independent linear combination of templates. To produce a fit we utilise the Draine & Li (2007)[80] (hereafter DL07) models to fit the dust reprocessed stellar light, the AGN templates of Mullaney et al (2012)[81] as well as stellar and a quasar UV to NIR templates adopted from EAZY and Shen et al. (2016)[82], respectively. For the quasar component, we include the SMC dust attenuation law to reproduce the red colours of GNz7q in the UV and NIR.
The SED-fitting yields the basic global UV–IR properties of the source: the observed () and dust-corrected () monochromatic rest-frame optical luminosity, the dust attenuation for the quasar () and the host galaxy (), the total infrared luminosity () along with the relative contribution of the AGN () and of the star formation () in the IR output of our target, the dust mass (), and the intensity of the mean radiation field ( /) of the source. The , and are estimated by integrating the corresponding best-fit components over 8–1,000 . The bolometric luminosity of the AGN components that dominate the rest-frame FUV–NIR (observed 1–24 ) is , where the small uncertainty is the random normalization uncertainty of the fixed templates constrained by the high S/N HST and 24 detections. The systematic uncertainty due to the relatively unconstrained MIR SED shape is somewhat larger. For example, if we rather adopt the “high luminosity” MIR AGN template from Mullaney et al (2012)[81] as opposed to the “low luminosity” template favored by the full fit, we obtain .
For completeness and to facilitate comparison with the literature, we also fit the 50 m data points with a MBB fit with a fixed =1.8 in order to infer a luminosity-weighted dust temperature () and . We obtain the consistent estimates from both fitting approaches. We use the average value of the estimates and evaluate its uncertainty from the difference of the both estimates from the average. During the fitting process of both the multi-component analysis and of the MBB modeling, we have taken into account CMB effects that could be non-negligible at this redshift, especially in the mm regime[39, 38, 37]. The AGN/SF decomposition of the IR emission allows for an independent estimate of the obscured star-formation rate of the source. Using the conversion of Murphy et al. (2011)[83] based on the Kroupa initial mass function (IMF)[84], the inferred corresponds to an SFR of of 1,600 700 yr-1, where the uncertainty of is propagated to the uncertainty. Note that if we assume that GNz7q is rather a compact star-forming region, the obscured and un-obscured SFRs can be derived from and the observed UV luminosity, respectively. Using the same conversion, we obtain an even higher estimate of 1,900 900 yr-1, but we adopt the former estimate throughout this paper based on the discussion in Section 5. With the upper limit of the rest-frame FIR emitting region from the NOEMA 1 mm data, we also obtain a lower limit of the SFR density at 1,100 yr-1 kpc-2, which is comparable to its maximal value predicted from the balance between the radiation pressure from the star-formation and the self gravitation[13, 85]. Note that DL07 and MBB models assume the optically thin dust emission, while the compactness of the FIR-emitting region in GNz7q could in fact require an optically-thick treatment. With the optically-thick assumption, and subsequently the SFR estimate will be increased by % [37].
Note that the uniquely deep X-ray data and general and SFR relations[86] expect the X-ray detection from such an enormous SFR of the host galaxy, while the non-detection of X-ray could be explained by the metallicity dependence of the and SFR relation: at a given SFR decreases in high-metallicity systems[87]. Based on the recent calibration of Fornasini et al. (2020)[88], we find that at least the solar value is required for the gas-phase metallicity of the host galaxy to meet the X-ray upper limit (Section 4). Since the SFR estimate for the host galaxy of GNz7q is not much changed regardless of its interpretation, the non-detection of X-ray thus suggests that the host galaxy has experienced a rapid metal enrichment and reached the solar metallicity even at . This is consistent with recent ALMA results for a similarly distant quasar at that the ISM gas-phase metallicity of the host galaxy is comparable to the solar value via FIR line diagnostics[89].
0.12 7. Mgas and Mdyn estimates
We obtain molecular gas mass estimates from five empirical calibrations; the metallicity-dependent method[90] (), the monochromatic Rayleigh-Jeans (RJ) dust continuum approach[91] (), the CO line luminosity, the [C ii] line luminosity[93] (), and the [C i](2-1) line luminosity[96] (). First, following the method in the previous studies [90], we convert the inferred to adopting a typical gas-to-dust ratio at solar metallicity, =92. This yields = (1.4 1.0) which agrees well with the estimate inferred from the RJ approach, = (2.0 1.2) . For the latter we adopted a RJ luminosity-to-mass ratio calibrated with star-forming galaxies including local spirals and SMGs following Scoville et al. (2016)[91]. Moving to the line tracers, we first estimate the area-integrated CO(1-0) intensity of Jy km s-1 pc2 from the CO(7-6) line detection, assuming 1.5 estimated in dusty starburst galaxies at in the literature[94, 95]. We then estimated = (5.0 3.0) assuming (K km s-1 pc2)-1 [92]. To convert the [C ii] line to , we use the conversion factor, as calibrated on starburst galaxies at by [93] and, adopting a 0.2 dex uncertainty, we estimate . Finally, we consider the measured 3 upper limit of the [C i](2-1) line that for (K km s-1 pc2)-1 and a 0.32-dex uncertainty[96, 97], we obtain an upper limit of . These independent estimates are in excellent agreement with each other within the uncertainties. For the purposes of this work, we determine (2.0 1.2) by adopting the median value among , and . Note that the and estimates could be decreased by factors of several based on another assumptions of and in the super-solar metallicity case.
We estimate the dynamical mass of the system from the [C ii] line results. Given the absence of the clear velocity gradient in GNz7q, we interpret GNz7q’s host as a dispersion-dominated system and assume a virialized body with a radius kpc and one-dimensional velocity dispersion km s-1, which yields[98]
| (3) |
For consistency with previous studies[99, 100, 101], we use for after applying a correction factor of 1.5 to recover the contribution of the diffuse emission. We then obtain (4.5 0.9) which satisfies the requirement that it should be larger than the estimate. Because of the negligible dark matter contribution to within a compact scale of 1.5, we subtract from and derive of (2.5 1.4) . If we apply a typical dust-to-stellar mass ratio of 0.01 to , we obtain another estimate of of (1.6 1.1) which is consistent with the above estimate within the uncertainties.
0.13 8. Comparison with other populations
Compared to Type 2 quasars that are almost completely obscured in the UV/optical due to the nearly edge-on view of the dust torus, the reddening of red quasars is more moderate than that of Type 2 quasars, where the sight lines to red quasars may graze the dusty material surrounding the accretion disk. In this context, red quasars are thought to represent an early phase of the quasar life cycle: an obscured phase before the energy output from radiation, winds, and/or jets from the AGN and central star formation expels the obscuring material and transitions to an unobscured blue quasar. This is consistent with hydrodynamical simulations of galaxy mergers and quasar feeding[5], and supportive observational results have been also reported at .[102, 23, 104, 103] To investigate whether GNz7q at is also consistent with this scenario, we compare its physical properties with those of dusty starbursts, red quasars, and blue quasars in the literature.
In Extended Data Fig. 9, we compare and properties. We find that GNz7q has a relatively low / ratio among all populations, while we confirm that there are two cases whose ratios are comparable in a similar composite system of the AGN and starburst population identified in the local universe. We also find that the red quasars at , including super-Eddington accretion red quasar W2246-0526 at ,[17] have similarly low /[14]. These results suggest that the interstellar medium (ISM) conditions of GNz7q are unique compared to similar systems in the local universe and could resemble the super-Eddington accretion red quasars. The / ratio is known to have a strong anti-correlation with , where the decrease of the [C ii] emissivity is explained by the strong radiation field in the high regions[105, 106, 107]. Based on the upper limit of the effective radius of the 1.3 mm continuum (Section 4), we find that GNz7q has a lower limit of , aligned with the highest-end of the anti-correlation. This indicates that the host of GNz7q is one of the most vigorously star-forming systems, which produces the intense radiation field and induces the high of 80 21 K.
In Extended Data Fig. 10, we compare SFR (a), (b), (c), and the depletion time scale (d) between GNz7q and other populations at , including the dusty starburst (orange diamond), the blue quasar (blue squares), the red quasar (magenta circle and shaded region), and Lyman-break galaxies (green triangle) from the literature[95, 29, 57, 110, 108, 113, 109, 114, 25, 111, 20, 6, 89, 112, 14]. For dusty starburst and quasar populations, we estimate SFR in the same manner as GNz7q (i.e., conversion from ). The values are systematically calculated by assuming a single MBB with K and in the same manner as previous studies[57, 113] when the source has been observed only with a single submm or mm band, otherwise taken from the literature[95, 115, 114]. Because we show GNz7q with after subtracting the AGN contribution of 8%, we also subtract the same fraction in the estimates for the quasar populations. For the dusty starburst at [95, 29], the AGN contribution is estimated to be 0–50% with nearly equal probability in the literature, where we assume it to be 25% and evaluate the error with the cases of 0% and 50%. For the galaxy population, we use SFR estimates compiled in the literature[116] applying corrections for the different IMF assumptions. estimates are taken from CO line spectroscopy results in the literature, while we also derive from with [93] for the sources that have not been observed with the CO lines. For , we systematically calculate by using the equation:
| (4) |
where is the flux density at a frequency of , is the luminosity distance, is the Planck function. The dust opacity coefficient is given by cm2 g-1, which is used in the DL07 model. We assume K and when the source has been observed only with a single submm or mm band, otherwise we use the longest wavelength measurements available and adopt the and estimates in the literature[95, 115, 114, 110]. Because a 10 K change in the assumption produces a –0.3 dex difference in the SFR and estimates for the sources whose and are assumed to be 47 K and 1.6, respectively, we add a 0.2 dex uncertainty to the 1 measurement uncertainty in their error bars in Extended Data Fig. 10. We find that the and values of GNz7q fall in the range probed by blue quasars at the same epoch, while the implied SFR is the highest among objects so far observed.
This indicates that the intense starburst is taking place in the host galaxy of GNz7q with a very short depletion time scale of 10 Myr, which is consistent with the scenario that the red quasar is forming in the dusty starburst. The higher SFR of GNz7q’s host galaxy than the hosts of lower-redshift red quasars may indicate that GNz7q is experiencing an early stage of its transition phase from the dusty starburst to the blue quasar. In fact, the values of the lower- red quasars are estimated to fall in the super-massive regime of = 9.3–9.6[17, 25]. This may suggest that these lower- red quasars are found at the end phase of the SMBH evolution and that the super-Eddington accretion in W2246-0526 is caused by an active quasar duty cycle even at the end phase. Although there is a possibility that the SFR values in the blue quasars are also increased if their values are as high as GNz7q, previous studies of blue quasars at with multi-band FIR photometry in ALMA Bands 6 and 8 generally show the FIR SED with 40–50 K[115, 114, 89]. Furthermore, the rest-frame IR regime of the blue line in Fig. 2 implies that the AGN contribution to could be much larger in these luminous quasars than that of GNz7q, which reduces their SFR estimates.
In Extended Data Fig. 11, we present and properties. For GNz7q, we show the Eddington-limited estimate in the red circle and the potential range indicated by its extremely faint X-ray property in the red shaded regions whose colour scale and vertical range of each red shade region correspond to those of Fig. 3. For blue quasars at 6–7, we show measurements based on a systematic kinematic modeling with the ALMA data[117, 118]. We include measurements for quasars based on the assumption of the rotating disc geometry and the axial ratio of [C ii] flux map as proxy of the disc inclination angle[99, 119, 120, 121, 100, 101, 122]. We also show 1) the best-fit relation between the stellar mass in the bulge and obtained in local quiescent galaxies[123], where we use as , and 2) the and relation for red quasars at that generally fall below the local relation[104]. We find a relatively low fraction of that falls below the local relation[123], similar to the general relation of the red quasars at . In contrast to ideas of an “over-massive” SMBH relative to the host galaxy reported in previous optically-luminous quasars at [99, 100, 117, 118], the “under-massive” SMBH of GNz7q at offers an intriguing path to the co-evolution between the SMBH and its host in the early universe: the host galaxies grow earlier than the SMBHs, which is aligned with the predictions of the merger-driven SMBH evolution models[5]. The “under-massive” SMBH is also argued in recent reports of less luminous quasars[119, 101], but generally their central BHs are already massive with low –0.2[27, 57], and thus could be placed at the end-phase of the SMBH evolution after the blue-quasar phase[57]. We note that it is unclear whether the quasar host galaxies at are the bulge-dominated systems similar to the local quiescent galaxies. We thus also show another best-fit relation between the stellar mass of the entire system and among local AGNs[124], where the range of GNz7q still falls below or on the best-fit relation.
0.14 9. The IR/Radio correlation
The correlation between the IR luminosity and the radio emission has been empirically known for several decades. Based on the radio detection of GNz7q at 20 cm/1.5 GHz[43], we evaluate the IR and radio correlation. From previous studies, the IR and radio correlation is typically evaluated with the parameter given by
| (5) |
where is the observed flux density at 1.4 GHz, and is the radio spectral index which is defined by . Due to the non-detection in a deep 10-GHz map[46], we obtain a constraint of . Given the large uncertainty for the constraint, we adopt a typical value of [125, 46], convert the observed 1.5 GHz flux density to the 1.4 GHz flux density, and estimate the value of . This is consistent with typical value range of local starburst galaxies and high-redshift SMGs[126, 127] and a recent report of the redshift trend among high-redshift star-forming galaxies[128]. We thus conclude that the majority of the radio emission of GNz7q is caused by the star-formation and classify the GNz7q as a radio-quiet object. This property agrees with the young quasar interpretation of GNz7q, because the radio loudness is a strong function of and the radio-loud quasars generally have massive [129].
0.15 10. Comparison with simulations
We compare our observational results with predictions from a data-constrained, semi-analytic model GAMETE/QSOdust (GQd) aimed at studying the formation and evolution of high-redshift quasars and their host galaxies in a cosmological framework[130, 131, 22, 7]. Here we have analysed the hierarchical merger histories of 10 massive dark matter (DM) halos with at , designed to reproduced the observed properties of the optically-luminous quasar SDSSJ1148 at to investigate if we could identify—among its progenitors at —systems with physical properties similar to GNz7q.
We first produce the 10 merger trees for a 1013 dark matter halo, decomposing it into its lower mass progenitors backward in time from to using a Monte Carlo algorithm based on the Extended Press-Schechter formalism. Then GQd follows the evolution of the baryonic component within each progenitor halo along a merger tree, from down to . At each redshift, in each halo, we follow the formation of stars and BHs (light and heavy seed formation channels are simultaneously implemented in the model) according to the environmental properties (i.e. metallicity of the interstellar medium and the level of illuminating external ionizing and H2 photo-dissociating radiation field). BHs in the centre of galaxies can then grow via gas accretion and mergers with other BHs during major halo-halo mergers (DM halos pair mass ratio 1:4) while in minor ( 1:4) halo-halo mergers the least massive of the two BHs is “ejected”, it is considered as a “satellite”, and we do not further follow its evolution. We account for the effect of stellar- and AGN-driven feedback in the form of energy-driven winds and include calculations for the IR luminosity from the host galaxy and the X-ray luminosity from accreting BHs, considering the primary component of the hot corona and the reflection component of the surrounding neutral medium.
For each 1013 halo merger tree GQd generates a catalog of progenitor galaxies. Each catalog contains the properties (e.g., the mass of BH, gas, stars, dust, SFR, , ) of all the progenitor systems (galaxy+BHs). In Figure 4a, we show all the progenitors at redshift slices of , 7.2, and 7.3 in the catalog. We mark four progenitors with black circles whose X-ray, optical, and host galaxy properties are close to GNz7q with criteria of erg s-1, , and SFR 100 yr-1. The assembly histories of the nuclear BHs for these four progenitors are shown in Figure 4b. We find that one of the four progenitors is a direct progenitor which evolves into a luminous quasar harbouring a SMBH with at . We also confirm that this progenitor resides in one of the most massive dark matter halos at with the dark matter halo mass of . In the assembly histories, the remaining three progenitors are subsequently ejected from the centre or become satellites of more massive BHs as a consequence of a minor merger experienced by their host galaxies. Therefore, these BHs are not the direct progenitors of the final SMBHs, although their entire systems also form the SMBHs with at .
0.16 11. Classical colour selection for high- quasar search
A remarkable aspect is that GNz7q is discovered in a relatively small area coverage of the entire HST archive ( deg2), compared with previous wide-area surveys used in the high-redshift quasar search. Mazzucchelli et al. (2017) use Pan-STARRS1[134] and UKIDSS[135] data and select the quasar candidates at with the optical colour criteria of[133]
| (6) | |||||
| (7) |
Integrating the best-fit SED of GNz7q through the Pan-STARRS1 and UKIRT and filter bandpasses, we find it has and , which comfortably satisfies the optical–NIR quasar selection criterion. This indicates that the quasar population similar to GNz7q could be identified in previous high- quasar surveys if the data are sufficiently deep, such as The Canada–France High- Quasar Survey[136] and Subaru High- Exploration of Low-luminosity Quasars[22, 23, 24, 26]. GNz7q also meets the optical–NIR colour criteria used in recent discoveries of the luminous quasars at [4, 20, 6], although the optical–NIR data of the wide-area surveys used in these discoveries is almost 2 orders magnitude shallower than that of the GOODS-North field. These colour selection results indicate that the identification of GNz7q at in the relatively small area of the entire HST archive might be just explained by chance, although the expected probability is less than 1% from the quasar luminosity function[26] and the red quasar fraction at .[25] There are two other possibilities. The first is that the transitioning young quasar more frequently emerges at than at . The second is that the quasar population similar to GNz7q has been identified in the previous surveys, but not regarded or classified as a quasar due to its faintness in the rest-frame UV, MIR, X-ray, and radio continuum in the follow-up spectroscopy and/or multi-wavelength analyses. In fact, the presence of the deep HST and MIPS data is crucial for the interpretation for GNz7q (Section 5). Without them, the uniquely-faint properties of GNz7q in the rest-frame UV emission lines and X-ray generally conclude its classification as a luminous galaxy. Recent studies have also suggested, both observationally and theoretically, a potential high abundance of the dust-rich quasar population at [141, 28]. A systematic deep, high-resolution optical–MIR imaging campaign for all luminous high- galaxy candidates could lead to additional discoveries similar to GNz7q. Given the relatively robust calibration[137] and lesser effects from the slim disk, detecting broad Balmer emission lines could provide a decisive conclusion for the quasar classification, which will soon become possible even at with the launch of the James Webb Space Telescope. Moreover, even if we do not detect the broad lines with JWST, the results will suggest further exciting possibilities: the existence of an extraordinary UV luminous and compact star-forming region (Extended Data Fig. 7), or that is exactly what the first quasars look like.
0.17 Code availability.
The HST and Spitzer data were processed with grizli and golfir, available at https://github.com/gbrammer/grizli and https://github.com/gbrammer/golfir, respectively. The HST F125W image is analyzed with galfit which is available at https://users.obs.carnegiescience.edu/peng/work/galfit/galfit.html. The NOEMA data were reduced using the GILDAS software. The CASA pipeline version of 5.6 is also used for imaging the NOEMA interferometric data. These are available at https://casa.nrao.edu/casa_obtaining.shtml. https://www.oso.nordic-alma.se/software-tools.php. The online Portable Interactive Multi-Mission Simulator is available at https://heasarc.gsfc.nasa.gov/cgi-bin/Tools/w3pimms/w3pimms.pl.
0.18 Data availability.
This paper makes use of the following HST data from programs 9583, 9727, 9728, 10189, 10339, 11600, 12442, 12443, 12444, 12445, 13063, 13420, 13779, available at https://archive.stsci.edu/. The reduced HST and Spitzer image mosaics are available at https://doi.org/10.5281/zenodo.4469734. Other products from the CHArGE project are avilable at https://gbrammer.github.io/projects/charge/. The NOEMA data that supports our finding consists of ED19AD and W20EO that are available at https://www.iram-institute.org/EN/content-page-386-7-386-0-0-0.html. The SED of the SDSS quasar at used in Fig. 1 is available from the SDSS DR12 website https://dr12.sdss.org/spectrumDetail?plateid=6839&mjd=56425&fiber=146. The SEDs of local quasar and starburst are available from the SWIRE template website http://www.iasf-milano.inaf.it/$∼$polletta/templates/swire_templates.html. The datasets generated and/or analyzed during the current study are available from the corresponding author on reasonable request.
References
- [1] Planck Collaboration. Planck 2013 results. XVI. Cosmological parameters. Astronomy & Astrophysics 571, A16 (2014).
- [2] Onoue, M. et al. Subaru High-z Exploration of Low-luminosity Quasars (SHELLQs). XIV. A Candidate Type II Quasar at Astrophysical Journal 919, 1 (2021)
- [3] Antonucci, R. Unified Models for Active Galactic Nuclei and Quasars Annual Review of Astronomy and Astrophysics 31, 473–521 (1993)
- [4] Urry, C. and Padovani, P. Unified Schemes for Radio-Loud Active Galactic Nuclei Publications of the Astronomical Society of the Pacific 107, 803 (1995)
- [5] Richards et al. Red and Reddened Quasars in the Sloan Digital Sky Survey The Astronomical Journal 126, 3, 1131–1147 (2003)
- [6] Ross, N. et al. Extremely red quasars from SDSS, BOSS and WISE: classification of optical spectra Monthly Notices of the Royal Astronomical Society 453, 4, 3932–3952 (2015)
- [7] Hamann, F. et al. Extremely red quasars in BOSS Monthly Notices of the Royal Astronomical Society 464, 3, 3431–3463 (2017)
- [8] Glikman, E. et al. FIRST-2Mass Sources below the APM Detection Threshold: A Population of Highly Reddened Quasars Astrophysical Journal 607, 1 (2004)
- [9] Urrutia, T. et al. The FIRST-2MASS Red Quasar Survey. II. An Anomalously High Fraction of LoBALs in Searches for Dust-Reddened Quasars Astrophysical Journal 698, 2 (2009)
- [10] Lacy, M. et al. Optical Spectroscopy and X-Ray Detections of a Sample of Quasars and Active Galactic Nuclei Selected in the Mid-Infrared from Two Spitzer Space Telescope Wide-Area Surveys The Astronomical Journal 133, 1, (2007)
- [11] Glikman, E. et al. Dust Reddened Quasars in FIRST and UKIDSS: Beyond the Tip of the Iceberg Astrophysical Journal 778, 2, 186–205 (2013)
- [12] Krawczyk, C. et al. Mining for Dust in Type 1 Quasars Astrophysical Journal 149, 6 (2015)
- [13] Díaz-santos, T. et al. The multiple merger assembly of a hyperluminous obscured quasar at redshift 4.6 Science 362, 6418, L17 (2018)
- [14] Díaz-santos, T. et al. Kinematics and Star Formation of High-Redshift Hot Dust-Obscured Quasars as Seen by ALMA Astronomy & Astrophysics 654, A37 (2021)
- [15] Finnerty, L. et al. Fast Outflows in Hot Dust-obscured Galaxies Detected with Keck/NIRES Astrophysical Journal 905, 1 (2020)
- [16] Alexander, M. et al. Weighing the Black Holes in Submillimeter-Emitting Galaxies Hosting Active Galactic Nuclei The Astronomical Journal 135, 5, 1968–1981 (2008)
- [17] GAIA Collaboration Gaia Data Release 2. Summary of the contents and survey properties Astronomy & Astrophysics 616, A1 (2018)
- [18] Brammer, G. Grizli: grism redshift and line analysis software Astrophysics Source Code Library. ascl:1905.001 (2019) (2019)
- [19] Shindler, J. et al. The X-SHOOTER/ALMA Sample of Quasars in the Epoch of Reionization. I. NIR Spectral Modeling, Iron Enrichment, and Broad Emission Line Properties Astrophysical Journal 905, 1, (2020)
- [20] Yang, J. et al. Pōniuā’ena: A Luminous Quasar Hosting a 1.5 Billion Solar Mass Black Hole Astrophysical Journal Letter 897, 1, L14 (2020).
- [21] Bowler, R. et al. Unveiling the nature of bright galaxies with the Hubble Space Telescope Monthly Notices of the Royal Astronomical Society 466, 3612–3635 (2017)
- [22] Matsuoka, Y. et al. Subaru High-z Exploration of Low-luminosity Quasars (SHELLQs). I. Discovery of 15 Quasars and Bright Galaxies at Astrophysical Journal 828, 1 (2016)
- [23] Matsuoka, Y. et al. Subaru High-z Exploration of Low-Luminosity Quasars (SHELLQs). II. Discovery of 32 quasars and luminous galaxies at 5.7 6.8 Publications of the Astronomical Society of Japan 70, S35 (2017)
- [24] Matsuoka, Y. et al. Subaru High-z Exploration of Low-luminosity Quasars (SHELLQs). IV. Discovery of 41 Quasars and Luminous Galaxies at Astrophysical Journal Supplement Series 237, 5, (2018)
- [25] Matsuoka, Y. et al. Discovery of the First Low-luminosity Quasar at Astrophysical Journal Letters 872, L1 (2019)
- [26] Matsuoka, Y. et al. Subaru High-z Exploration of Low-luminosity Quasars (SHELLQs). X. Discovery of 35 Quasars and Luminous Galaxies at Astrophysical Journal 883, 2 (2019)
- [27] Onoue, M. et al. Subaru High-z Exploration of Low-luminosity Quasars (SHELLQs). VI. Black Hole Mass Measurements of Six Quasars at 6.1 Astrophysical Journal 880, 2 (2019)
- [28] Schouws, S. et al. Significant Dust-Obscured Star Formation in Luminous Lyman-break Galaxies at Astrophysical Journal in press, (2021) (arXiv:2105.12133)
- [29] Peng, C. Y. et al. Detailed Decomposition of Galaxy Images. II. Beyond Axisymmetric Models The Astronomical Journal 139, 2097–2129 (2010)
- [30] McMullin, J. et al. CASA Architecture and Applications Astronomical Data Analysis Software and Systems XVI 376, 127 (2007)
- [31] Martí-Vidal, I. et al. Over-resolution of compact sources in interferometric observations Astronomy & Astrophysics 541, A135 (2012)
- [32] Fujimoto, S. et al. Demonstrating A New Census of INfrared Galaxies with ALMA (DANCING-ALMA). I. FIR Size and Luminosity Relation at Revealed with 1034 ALMA Sources Astrophysical Journal 850, 1 (2017)
- [33] Franco, M. et al. GOODS-ALMA: 1.1 mm galaxy survey. I. Source catalog and optically dark galaxies Astronomy & Astrophysics 620, A152 (2018)
- [34] Franco, M. et al. GOODS-ALMA: The slow downfall of star formation in z = 2-3 massive galaxies Astronomy & Astrophysics 643, A30 (2020)
- [35] Wang, T. et al. A dominant population of optically invisible massive galaxies in the early Universe Nature 572, 7768, 211–214 (2019)
- [36] Fudamoto, Y. et al. Normal, dust-obscured galaxies in the epoch of reionization Nature 597, 7877, 489-492 (2021)
- [37] Cortzen, I. et al. Deceptively cold dust in the massive starburst galaxy GN20 at Astronomy & Astrophysics 634, L14 (2007)
- [38] Jin, S. et al. Discovery of Four Apparently Cold Dusty Galaxies at in the COSMOS Field: Direct Evidence of Cosmic Microwave Background Impact on High-redshift Galaxy Observables Astrophysical Journal 887, 2 (2019)
- [39] Da Cunha, E. et al. An ALMA Survey of Sub-millimeter Galaxies in the Extended Chandra Deep Field South: Physical Properties Derived from Ultraviolet-to-radio Modeling Astrophysical Journal 806, 110 (2015)
- [40] Kajisawa et al. MOIRCS Deep Survey. IX. Deep Near-Infrared Imaging Data and Source Catalog Publications of the Astronomical Society of Japan 63, 379 (2011)
- [41] Magnelli et al. Evolution of the dusty infrared luminosity function from to using observations from Spitzer Astronomy & Astrophysics 528, 35 (2011)
- [42] Cowie, L. et al. A Submillimeter Perspective on the GOODS Fields (SUPER GOODS). I. An Ultradeep SCUBA-2 Survey of the GOODS-N Astrophysical Journal 837, 2, 139 (2017)
- [43] Owen, F. Deep JVLA Imaging of GOODS-N at 20 cm Astrophysical Journal Supplements Series 235, 2 (2018)
- [44] Liu, D. et al. Super-deblended Dust Emission in Galaxies. I. The GOODS-North Catalog and the Cosmic Star Formation Rate Density out to Redshift 6 Astrophysical Journal 853, 172 (2018)
- [45] Oliver, S. et al. The Herschel Multi-tiered Extragalactic Survey: HerMES Monthly Notices of the Royal Astronomical Society 424, 1614–1645 (2018)
- [46] Murphy, E. et al. The GOODS-N Jansky VLA 10-GHz Pilot Survey: Sizes of Star-forming JY Radio Sources Astrophysical Journal 839, 1 (2017)
- [47] Geach, J. et al. The SCUBA-2 Cosmology Legacy Survey: 850 m maps, catalogues and number counts Monthly Notices of the Royal Astronomical Society 465, 1789–1806 (2017)
- [48] Nanni, R. et al. The X-ray properties of luminous quasars Astronomy & Astrophysics 603, A128 (2017)
- [49] Vito, F. et al. Heavy X-ray obscuration in the most luminous galaxies discovered by WISE Monthly Notices of the Royal Astronomical Society 474, 4, 4528–4540 (2018)
- [50] HI4PI Collaboration. HI4PI: A full-sky H I survey based on EBHIS and GASS Astronomy & Astrophysics 594, A116 (2016)
- [51] Wang, F. et al. Revealing the Accretion Physics of Supermassive Black Holes at Redshift with Chandra and Infrared Observations Astrophysical Journal 908, 1 (2021)
- [52] Lusso, E. et al. The Tight Relation between X-Ray and Ultraviolet Luminosity of Quasars Astrophysical Journal 819, 2 (2016)
- [53] Vito, F. et al. The X-ray properties of quasars: no evident evolution of accretion physics in the first Gyr of the Universe Astronomy & Astrophysics 630, A118 (2019)
- [54] Chiaraluce, E. et al. The X-ray/UV ratio in active galactic nuclei: dispersion and variability Astronomy & Astrophysics 619, A95 (2018)
- [55] Zou, F. et al. X-ray properties of dust-obscured galaxies with broad optical/UV emission lines Monthly Notices of the Royal Astronomical Society 499, 2, 1823–1840 (2020)
- [56] Shemmer, O. et al. Chandra Observations of the Highest Redshift Quasars from the Sloan Digital Sky Survey Astrophysical Journal 644, 1 (2006)
- [57] Kim, Y. et al. High Star Formation Rates of Low Eddington Ratio Quasars at Astrophysical Journal 879, 2 (2019)
- [58] Iwasawa, K. et al. C-GOALS: Chandra observations of a complete sample of luminous infrared galaxies from the IRAS Revised Bright Galaxy Survey Astronomy & Astrophysics 529, A106 (2011)
- [59] Veilleux, B. et al. A Deep Hubble Space Telescope H-Band Imaging Survey of Massive Gas-Rich Mergers. II. The QUEST QSOs Astrophysical Journal 701, 1 (2009)
- [60] Ni, Q. et al. Connecting the X-ray properties of weak-line and typical quasars: testing for a geometrically thick accretion disk Monthly Notices of the Royal Astronomical Society 480, 4, 5184–5202 (2018)
- [61] Marques-Chaves, R. et al. The discovery of the most UV-Ly luminous star-forming galaxy: a young, dust- and metal-poor starburst with QSO-like luminosities Monthly Notices of the Royal Astronomical Society 499, 1 (2020)
- [62] Shibuya, T. et al. Morphologies of Galaxies at Revealed with HST Legacy Data. I. Size Evolution Astrophysical Journal Supplement Series 219, 15 (2019)
- [63] Conroy, C. et al. The Propagation of Uncertainties in Stellar Population Synthesis Modeling. I. The Relevance of Uncertain Aspects of Stellar Evolution and the Initial Mass Function to the Derived Physical Properties of Galaxies Astrophysical Journal 699, 486 (2009)
- [64] Conroy, C. & Gunn, J. The Propagation of Uncertainties in Stellar Population Synthesis Modeling. III. Model Calibration, Comparison, and Evaluation Astrophysical Journal 712, 833 (2010)
- [65] Brammer, G. et al. EAZY: A Fast, Public Photometric Redshift Code Astrophysical Journal 686, 2 (2008)
- [66] Polletta, M. et al. Spectral Energy Distributions of Hard X-Ray Selected Active Galactic Nuclei in the XMM-Newton Medium Deep Survey Astrophysical Journal 663, 1 (2007)
- [67] Glikman, E. et al. A Near-Infrared Spectral Template for Quasars Astrophysical Journal 640, 2 (2006)
- [68] Leipski, C. et al. Spectral Energy Distributions of QSOs at : Common Active Galactic Nucleus-heated Dust and Occasionally Strong Star-formation Astrophysical Journal 785, 2 (2014)
- [69] Nenkova, M. et al. AGN Dusty Tori. I. Handling of Clumpy Media Astrophysical Journal 685, 147 (2008)
- [70] Leja, J. et al. Hot Dust in Panchromatic SED Fitting: Identification of Active Galactic Nuclei and Improved Galaxy Properties Astrophysical Journal 854, 62 (2018)
- [71] Diamond-Stanic, A. et al. High-redshift SDSS Quasars with Weak Emission Lines Astrophysical Journal 699, 1 (2009)
- [72] Andika, I. et al. Probing the Nature of High-redshift Weak Emission Line Quasars: A Young Quasar with a Starburst Host Galaxy Astrophysical Journal 903, 1 (2020)
- [73] Wu, J. et al. X-Ray and Multiwavelength Insights into the Nature of Weak Emission-line Quasars at Low Redshift Astrophysical Journal 747, 1 (2012)
- [74] Vito, F. et al. Chandra and Magellan/FIRE follow-up observations of PSO167-13: An X-ray weak QSO at Astronomy & Astrophysics 649, A133 (2021)
- [75] Gallagher, S. C. et al. X-Raying the Ultraluminous Infrared Starburst Galaxy and Broad Absorption Line QSO Markarian 231 with Chandra Astrophysical Journal 569, 655 (2002)
- [76] Braito, V. et al. The XMM-Newton and BeppoSAX view of the Ultra Luminous Infrared Galaxy MKN 231 Astronomy & Astrophysics 420, 79 (2004)
- [77] Lipari, S., Colina, L., and Macchetto, F. Galaxies with Extreme Infrared and Fe II Emission. I. Markarian 231: The Signature of a Young Infrared QSO Astronomy & Astrophysics 427, 174L (1994)
- [78] Veilleux, S. et al. The Complete Ultraviolet Spectrum of the Archetypal ”Wind-dominated” Quasar Mrk 231: Absorption and Emission from a High-speed Dusty Nuclear Outflow Astrophysical Journal 825, 42 (2016)
- [79] Kokorev, V. et al. The Evolving Interstellar Medium of Star-Forming Galaxies, as traced by Stardust Astrophysical Journal 921, 1 (2021)
- [80] Draine, B. and Li, A. Infrared Emission from Interstellar Dust. IV. The Silicate-Graphite-PAH Model in the Post-Spitzer Era Astrophysical Journal 657, 2 (2007)
- [81] Mullaney, J. et al. GOODS-Herschel: the far-infrared view of star formation in active galactic nucleus host galaxies since Monthly Notices of the Royal Astronomical Society 419, 1, 95–115 (2012)
- [82] Shen, Y. et al. The Sloan Digital Sky Survey Reverberation Mapping Project: Velocity Shifts of Quasar Emission Lines Astrophysical Journal 831, 1 (2016)
- [83] Murphy, E. et al. Calibrating Extinction-free Star Formation Rate Diagnostics with 33 GHz Free-free Emission in NGC 6946 Astrophysical Journal 737, 67 (2011)
- [84] Kroupa, P. On the variation of the initial mass function Monthly Notices of the Royal Astronomical Society 322, 2, 231–246 (2001)
- [85] Simpson, J. et al. The SCUBA-2 Cosmology Legacy Survey: ALMA Resolves the Rest-frame Far-infrared Emission of Sub-millimeter Galaxies Astrophysical Journal 799, 81 (2015)
- [86] Lehmer, B. et al. The Evolution of Normal Galaxy X-Ray Emission through Cosmic History: Constraints from the 6 MS Chandra Deep Field-South Astrophysical Journal 825, 1 (2016)
- [87] Fornasini, F. et al. The MOSDEF Survey: The Metallicity Dependence of X-Ray Binary Populations at Astrophysical Journal 885, 1 (2019)
- [88] Fornasini, F. et al. Connecting the metallicity dependence and redshift evolution of high-mass X-ray binaries Monthly Notices of the Royal Astronomical Society 495, 1, 771-783 (2020)
- [89] Novak, M. et al. An ALMA Multiline Survey of the Interstellar Medium of the Redshift 7.5 Quasar Host Galaxy J1342+0928 Astrophysical Journal 881, 1 (2019)
- [90] Magdis, G. et al. The Evolving Interstellar Medium of Star-forming Galaxies since z = 2 as Probed by Their Infrared Spectral Energy Distributions Astrophysical Journal 760, 1 (2012)
- [91] Scoville, N. et al. ISM Masses and the Star formation Law at to 6: ALMA Observations of Dust Continuum in 145 Galaxies in the COSMOS Survey Field Astrophysical Journal 820, 2 (2016)
- [92] Solmon, P. et al. Mass, Luminosity, and Line Width Relations of Galactic Molecular Clouds Astrophysical Journal 319, 730 (1987)
- [93] Zanella, A. et al. The [C ii] emission as a molecular gas mass tracer in galaxies at low and high redshifts Monthly Notices of the Royal Astronomical Society 481, 2, 1976–1999 (2018)
- [94] Riechers, D. et al. A dust-obscured massive maximum-starburst galaxy at a redshift of 6.34 Nature 496, 329–333 (2013)
- [95] Strandet, M. et al. ISM Properties of a Massive Dusty Star-forming Galaxy Discovered at Astrophysical Journal Letter 842, 2, L15 (2017)
- [96] Crocker, A. et al. [C i](1–0) and [C i](2–1) in Resolved Local Galaxies Astrophysical Journal 887, 1 (2019)
- [97] Valentino, F. et al. A Survey of Atomic Carbon [C I] in High-redshift Main-sequence Galaxies Astrophysical Journal 869, 1 (2018)
- [98] Bothwell, S. et al. A survey of molecular gas in luminous sub-millimetre galaxies Monthly Notices of the Royal Astronomical Society 429, 4, 3047–3067 (2013)
- [99] Wang, R. et al. Star Formation and Gas Kinematics of Quasar Host Galaxies at : New Insights from ALMA Astrophysical Journal 773, 44 (2013)
- [100] Decarli, R. et al. An ALMA [C ii] Survey of 27 Quasars at Astrophysical Journal 854, 97 (2018)
- [101] Izumi, T. et al. Subaru High-z Exploration of Low-Luminosity Quasars (SHELLQs). III. Star formation properties of the host galaxies at studied with ALMA Publications of the Astronomical Society of Japan 70, 3 (2018)
- [102] Di Teodoro, T. et al. Spitzer Observations of Young Red Quasars Astrophysical Journal 757, 2 (2012)
- [103] Zakamska, N. et al. Discovery of extreme [O III] 5007 A outflows in high-redshift red quasars Monthly Notices of the Royal Astronomical Society 459, 3, 3144–3160 (2016)
- [104] Bongiorno, A. et al. The - relation for X-ray-obscured, red QSOs at Monthly Notices of the Royal Astronomical Society 443, 3, 2077–2091 (2014)
- [105] Díaz-Santos, T. et al. Explaining the [C ii] 157.7 m Deficit in Luminous Infrared Galaxies—First Results from a Herschel/PACS Study of the GOALS Sample Astrophysical Journal 774, 1 (2013)
- [106] Spilker, J. et al. ALMA Imaging and Gravitational Lens Models of South Pole Telescope – Selected Dusty, Star-Forming Galaxies at High Redshifts Astrophysical Journal 826, 2 (2016)
- [107] Gullberg, B. et al. The Dust and [C ii] Morphologies of Redshift 4.5 Sub-millimeter Galaxies at pc Resolution: The Absence of Large Clumps in the Interstellar Medium at High-redshift Astrophysical Journal 859, 1 (2018)
- [108] Laporte, N. et al. Dust in the Reionization Era: ALMA Observations of a z = 8.38 Gravitationally Lensed Galaxy Astrophysical Journal Letter 837, L21 (2017)
- [109] Hashimoto, T. et al. Big Three Dragons: A Lyman-break galaxy detected [O iii] 88 m, [C ii] 158 m, and dust continuum with ALMA Publications of the Astronomical Society of Japan 71, 4 (2019)
- [110] Bakx, T. et al. ALMA uncovers the [C ii] emission and warm dust continuum in a Lyman break galaxy Monthly Notices of the Royal Astronomical Society 493, 3, 4294–4307 (2020)
- [111] Izumi, T. et al. Subaru High-z Exploration of Low-luminosity Quasars (SHELLQs). XII. Extended [C ii] Structure (Merger or Outflow) in a z = 6.72 Red Quasar Astrophysical Journal 908, 2 (2021)
- [112] Fan, L. et al. The Spectral Energy Distribution of the Hyperluminous, Hot Dust-obscured Galaxy W2246-0526 Astrophysical Journal 854, 2 (2018)
- [113] Venemans, B. et al. Kiloparsec-scale ALMA Imaging of [C II] and Dust Continuum Emission of 27 Quasar Host Galaxies at Astrophysical Journal 904, 2 (130)
- [114] Hashimoto, T. et al. Detections of [O iii] 88 m in two quasars in the reionization epoch Publications of the Astronomical Society of Japan 71, 6 (2019)
- [115] Walter, F. et al. No Evidence for Enhanced [O iii] 88 m Emission in a Quasar Compared to Its Companion Starbursting Galaxy Astrophysical Journal Letters 869, L22 (2018)
- [116] Harikane, Y. et al. Large Population of ALMA Galaxies at with Very High [O iii] 88 m to [C ii] 158 m Flux Ratios: Evidence of Extremely High Ionization Parameter or PDR Deficit Astrophysical Journal 896, 2 (2020)
- [117] Pensabene, A. et al. The ALMA view of the high-redshift relation between supermassive black holes and their host galaxies Astronomy & Astrophysics 637, A84 (2020)
- [118] Neeleman, M. et al. The Kinematics of Quasar Host Galaxies Astrophysical Journal 911, 141
- [119] Willott, C. et al. Star Formation Rate and Dynamical Mass of 108 Solar Mass Black Hole Host Galaxies At Redshift 6 Astrophysical Journal 801, 2 (2015)
- [120] Willott, C. et al. A Wide Dispersion in Star Formation Rate and Dynamical Mass of 108 Solar Mass Black Hole Host Galaxies at Redshift 6 Astrophysical Journal 850, 108 (2017)
- [121] Venemans, B. et al. The Compact, 1 kpc Host Galaxy of a Quasar at a Redshift of 7.1 Astrophysical Journal 837, 146 (2017)
- [122] Izumi, T. et al. Subaru High-z Exploration of Low-Luminosity Quasars (SHELLQs). VIII. A less biased view of the early co-evolution of black holes and host galaxies Publications of the Astronomical Society of Japan 71, 6 (2019)
- [123] Kormendy, J. & Ho, L. Coevolution (Or Not) of Supermassive Black Holes and Host Galaxies Annual Review of Astronomy and Astrophysics 51, 1, 511–653 (2013)
- [124] Reines, A. et al. Relations between Central Black Hole Mass and Total Galaxy Stellar Mass in the Local Universe Astrophysical Journal 813, 2 (2015)
- [125] Ibar, E. et al. Deep multi-frequency radio imaging in the Lockman Hole - II. The spectral index of submillimetre galaxies Monthly Notices of the Royal Astronomical Society 401, 1, L53-L57 (2010)
- [126] Yun, M. et al. Radio Properties of Infrared-selected Galaxies in the IRAS 2 Jy Sample Astrophysical Journal 554, 2 (2001)
- [127] Magnelli, B. et al. Far-infrared properties of submillimeter and optically faint radio galaxies Astronomy & Astrophysics 518, L28 (2010)
- [128] Delhaize, J. et al. The VLA-COSMOS 3 GHz Large Project: The infrared-radio correlation of star-forming galaxies and AGN to Astronomy & Astrophysics 602, A4 (2017)
- [129] Dunlop, J. et al. Quasars, their host galaxies and their central black holes Monthly Notices of the Royal Astronomical Society 401, 1, 1095–1135 (2003)
- [130] Valiante, R. et al. The origin of the dust in high-redshift quasars: the case of SDSS J1148+5251 Monthly Notices of the Royal Astronomical Society 416, 3, 1916–1935 (2011)
- [131] Valiante, R. et al. High-redshift quasars host galaxies: is there a stellar mass crisis Monthly Notices of the Royal Astronomical Society 444, 3, 2442–2455 (2014)
- [132] Pezzulli, E. et al. Faint progenitors of luminous quasars: Why do not we see them Monthly Notices of the Royal Astronomical Society 466, 2, 2131–2142 (2017)
- [133] Mazzucchelli, C. et al. Physical Properties of 15 Quasars at Astrophysical Journal 849, 2 (2017)
- [134] Morganson, E. et al. The First High-redshift Quasar from Pan-STARRS The Astronomical Journal 143, 6 (2012)
- [135] Lawrence, A. et al. The UKIRT Infrared Deep Sky Survey (UKIDSS) Monthly Notices of the Royal Astronomical Society 379, 4, 1599-1617 (2007)
- [136] Willott, C. et al. The Canada-France High-z Quasar Survey: Nine New Quasars and the Luminosity Function at Redshift 6 The Astronomical Journal 139, 3, 906-918 (2010)
- [137] Vestergaard, M. & Peterson, B. M. Determining Central Black Hole Masses in Distant Active Galaxies and Quasars. II. Improved Optical and UV Scaling Relationships Astrophysical Journal 641, 689 (2006)
- [138] Anderson, J. Empirical Models for the WFC3/IR PSF Space Telescope WFC Instrument Science Report 12 (2016)
- [139] Just, D. et al. The X-Ray Properties of the Most Luminous Quasars from the Sloan Digital Sky Survey Astrophysical Journal 665, 2 (2007)
- [140] Sargsyan, L. et al. [C ii] 158 mLuminosities and Star Formation Rate in Dusty Starbursts and Active Galactic Nuclei Astrophysical Journal 755, 2 (2012)
- [141] Davies, F. B., Hennawi, J. F., & Eilers, A.-C. Evidence for low radiative efficiency or highly obscured growth of quasars Astrophysical Journal Letter 884, L19 (2019).
Extended Data Tables
Extended Data Table 1 Multi-wavelength photometry of GNz7q Observed Flux density‡ Uncertainty Telescope Instrument reference [m] [Jy] [Jy] 0.44 0.000 0.008 HST ACS/F435W This work (CHArGE) 0.61 0.005 HST ACS/F606W ” 0.78 0.005 0.007 HST ACS/F775W ” 0.81 0.006 HST ACS/F814W ” 0.85 0.056 0.010 HST ACS/F850LP ” 1.05 0.683 0.036 HST WFC3/F105W ” 1.25 1.307 0.067 HST WFC3/F125W ” 1.40 1.783 0.092 HST WFC3/F140W ” 1.60 2.103 0.107 HST WFC3/F160W ” 2.15 2.778 0.044 Subaru MORICS/ Kajisawa et al. 2011 3.6 3.574 0.180 Spitzer IRAC/ch1 This work (CHArGE) 4.5 3.907 0.197 Spitzer IRAC/ch2 ” 5.8 4.138 0.546 Spitzer IRAC/ch3 ” 8.0 4.553 0.471 Spitzer IRAC/ch4 ” 24 28.1 6.6 Spitzer MIPS Magnelli et al. 2011 100 1050 350 Herschel PACS Liu et al. 2018 160 2850 950 Herschel PACS ” 250 17,100 5,700 Herschel SPIRE Oliver et al. 2012 350 18,300 6,100 Herschel SPIRE ” 500 12,300 4,100 Herschel SPIRE ” 450 8,000 5,500 JCMT SCUBA2 This work 850 1,800 390 JCMT SCUBA2 Cowie et al. 2017 1,284 460 94† NOEMA Band 3 This work 3,276 24.6 6.9† NOEMA Band 1 This work 30,000 0.8 1.1 JVLA X Band Murphy et al. 2017 200,000 22.4 6.4 JVLA L Band Owen 2018
Extended Data Table 2 Measured and derived source properties Parameter Value Description R.A. 12:36:16.9195 Right Ascension (J2000) in HST Decl. 62:12:32.127 Declination (J2000) in HST Redshift from HST grism spectrum Redshift from [C ii] line 0.1 0.3 Rest-frame UV continuum slope ( erg s-1 Hz-1 Monochromatic optical luminosity at rest-frame 2,500 Å ( erg s-1 Hz-1 Dust corrected AGN bolometric luminosity (rest-frame 1216Å–20 cm) Dust attenuation for the quasar component Dust attenuation for the host galaxy component erg s-1 Rest-frame X-ray (2–10 keV) luminosity erg s-1 Hz-1 Monochromatic X-ray luminosity at rest-frame 2 keV Optical to X-ray spectral index (1.2 0.6) Rest-frame IR (8–1,000 m) luminosity (1.1 0.5) Rest-frame IR luminosity for the host galaxy component (1.0 0.3) Rest-frame IR luminosity for the AGN component 8 5 % AGN contribution to 80 21 K Peak dust temperature (1.1 0.3) [C ii] line luminosity (1.3 0.7) CO(7-6) line luminosity FWHM[CII] km s-1 FWHM of the [C ii] line FWHMCO km s-1 FWHM of the CO(7-6) line CO(6-5) line luminosity ([C ii] line width assumed) [C i](2-1) line luminosity ([C ii] line width assumed) SFR yr-1 SFR of the host galaxy (1.6 1.1) Dust mass of the host galaxy (2.0 1.2) Gas mass of the host galaxy (4.5 0.9) Dynamical mass (2.5 1.4) Stellar mass of the host galaxy from 2.1 0.3 IR/radio correlation Radio spectral index 0.48 kpc Effective radius of the rest-frame FIR continuum 1.4 0.2 kpc Effective radius of the [C ii] line
Extended Data Figures
![[Uncaptioned image]](/html/2204.06393/assets/x5.png)
Extended Data Figure 1 Rest-frame UV properties of GNz7q. The rest-frame 1450 luminosity as a function of redshift (a) and the UV continuum slope (b). GNz7q falls between the typical luminosity ranges of quasars and galaxies in the literature[19, 2, 20, 6], where both faint quasars and luminous galaxies have been also identified[119, 22, 23, 24, 25, 26, 21, 28]. GNz7q shows the reddest UV continuum slope among both galaxies and quasars at . The galaxies without spectroscopic redshifts and the quasars without a UV continuum slope measurement are displayed in the open symbols. The error bars denote the 1 measurement uncertainty.
![[Uncaptioned image]](/html/2204.06393/assets/x6.png)
Extended Data Figure 2 Point-source morphology of GNz7q. a, HST cutout in the HST WFC3/IR filters of F105W, F125W, F140W, and F160W (left), instrumental point spread function (PSF) models[138] (centre), and PSF fit residuals (right). b, Radial profile for the rest-frame UV continuum of GNz7q observed in F125W. The black circles show the observed values, while the dark and light red squares and lines present the PSF and the best-fit Sérsic models (see Methods). The error bars denote the 68th percentile in each annulus, and the dotted line indicates the standard deviation of the pixel.
![[Uncaptioned image]](/html/2204.06393/assets/x7.png)
Extended Data Figure 3 NOEMA 1-mm observation results. a, 1.3-mm continuum (left) and the velocity-integrated [C ii] maps (middle) with the natural weighting. We identify a nearby continuum object with a offset from GNz7q at the northern east part, dubbed “ND1”. The intensity of the 1.3-mm continuum and the velocity integrated [C ii] is shown in the right panel in green and red contours, respectively, overlaid on the HST/F160W cutout. The solid contours are drawn at 3, 5, and 7 levels, while the dashed white contours are drown at level. The NOEMA synthesized beam is presented at the left bottom. b, [C ii] line spectrum within a radius aperture. The blue curve is the best-fit Gaussian for the [C ii] line. The yellow shaded indicates the velocity range of [] km s-1 used for the velocity-integrated map in panel a. c, [C ii] line kinematics. The top and bottom panel present the velocity-weighted and the velocity-dispersion maps (), respectively.
![[Uncaptioned image]](/html/2204.06393/assets/x8.png)
Extended Data Figure 4 NOEMA 3-mm observation results. Left, 3.3-mm continuum (top) and the velocity-integrated CO(7-6) maps with the natural weighting. The black (white) contours are drown at 3, 4, and 5 (). Right, NOEMA 3-mm band spectrum for LSB (top) and USB (bottom) with a radius aperture. The dashed vertical line indicates the observed frequency of the expected far-IR lines based on the source redshift of determined by the [C ii] line. The blue curve is the best-fit Gaussian for the CO(7-6) line. The yellow shade indicates the velocity range used for the velocity-integrated map in the left panel.
![[Uncaptioned image]](/html/2204.06393/assets/x9.png)
Extended Data Figure 5 1.3-mm continuum (top) and [C ii] (bottom) size measurement results. Left, Observed map, which is the same as Extended Fig. 3a. Middle, Residual map by subtracting the best-fit model visibility obtained with uvmodelfit. For the dust continuum, we subtract the best-fit model visibility by fixing the major-axis effective radius as the upper limit value of kpc. The visibility of ND1 is subtracted by assuming its profile as a point source before running uvmodelfit. Right, Amplitude as a function of distance. The black circles shows the observed visibility. The error bars show the standard error of the mean in each distance bin. The red curve denotes the best-fit model for the [C ii] line, while the red dashed curve for the dust continuum indicates the model with the upper limit size.
![[Uncaptioned image]](/html/2204.06393/assets/x10.png)
Extended Data Figure 6 Optical luminosity vs. correlation. The black and blue squares denote SDSS quasars[139, 18, 52] at 0–4 and blue quasars[56, 48, 53] at respectively, taken from the literature. The arrows present the upper limits. The black line represents the best-fit relation based on 1544 quasars taken from the literature[48]. The gray shaded region denotes the 68th percentile derivation, evaluated by propagating the 1 uncertainties of the parameters that define the best-fit relation. The upper limit of GNz7q (99% confidence level) is estimated after the extinction correction and deviated from the best-fit relation by more than .
![[Uncaptioned image]](/html/2204.06393/assets/x11.png)
Extended Data Figure 7 Rest-frame UV size and luminosity relation. The black and blue circles show the rest-frame UV size measurements in the literature for galaxies[62, 21] at and for compact galaxies reported at –3, respectively[16, 61], but no objects similarly compact and luminous to GNz7q have been identified. The error bar denotes the 1 measurement uncertainty, and the sources whose errors exceed the measurements are not presented. The dashed line indicates the SFR surface density () by converting the UV luminosity to SFR[83]. If the compact UV emission in GNz7q is attributed to the star-forming activity, reaches 5,000 yr-1 kpc-2. Note that the UV luminosity is the observed value, and thus of GNz7q after dust correction will be more extreme in the star-forming scenario.
![[Uncaptioned image]](/html/2204.06393/assets/x12.png)
Extended Data Figure 8 NIR–MIR SED of GNz7q. Left: Observed-frame SED of GNz7q traced by the Spitzer IRAC and MIPS 24 m bands. The dark blue curve is the best-fit galaxy template (stellar continuum plus nebular emission from ionized gas in Hii regions) constrained at . The thin light blue curves are additional galaxy templates that largely span the galaxy color space at lower redshifts[65], and the thicker light blue curves are templates of nearby dusty starbursts M82 and Arp220[66]. The thick green curves are templates of Type 1 and 2 quasars[66], and the brown curve is a composite spectrum of nearby quasars[67]. The light green curves show the broad-band SEDs of high-redshift quasars at [68] interpolated to the redshift of GNz7q. Other than the galaxy fit, all SEDs and templates are normalized to the observed 8 m flux density of GNz7q. Right: Observed-frame MIR flux ratio diagram for the flux densities at 5.8 m, 8 m, and 24 m as observed for GNz7q and integrated from the SEDs displayed in the left panel. No templates from stars and star formation alone (blue curves and points) can reproduce the flux enhancement at 24 m (rest-frame 3 m) of GNz7q, which is fully consistent with the colors of luminous quasars at both low and high redshifts and likely arises from hot dust associated with an active nucleus. The error bars are obtained by propagating the 1 measurement uncertainty of each photometry.
![[Uncaptioned image]](/html/2204.06393/assets/x13.png)
Extended Data Figure 9 and properties compared with other populations. We show as a function of (a) and (b). For comparison, we also show observational results of local composite systems of AGN and starburst (black square), dusty starbursts at 0–7 (orange diamond), blue quasars at 6–7 (blue square), and red quasars at 3–5 (magenta square) taken from the literature[105, 106, 94, 140, 100, 89, 20, 6, 14]. GNz7q is at the extreme end of the relationship painted by known starbursts and quasars. The values of the blue quasars are calculated by assuming the single modified blackbody ( 47 K; 1.6), where the blue bar at the bottom left of the left panel shows a potential error scale with a change of by K from the assumption. For GNz7q, the error bar is obtained by propagating the 1 uncertainties of and .
![[Uncaptioned image]](/html/2204.06393/assets/x14.png)
Extended Data Figure 10 Host galaxy properties compared with other populations at . a–d, We show (a) SFR, (b) , (c) , (d) and as a function of redshift. For comparison, we also show other galaxy populations with spectroscopic redshifts: blue quasars (blue square), red quasars (magenta circle and shaded region), Lyman-break galaxies (green triangle), and a dusty starburst galaxy (orange circle) that are taken from the literature[95, 29, 57, 110, 108, 113, 109, 114, 25, 111, 20, 6, 89, 112, 14]. The magenta shade represents the 68th percentile of the host galaxy properties of the super-Eddington accretion red quasar, W2246-0526, at [112, 14]. The host galaxy of GNz7q show the most vigorously star-forming system at with the large gas reservoir. The filled and open symbols in panel (c) denote estimates from CO and [C ii] lines, respectively. The error bars of SFR and are estimated by propagating the 1 measurement uncertainty and a 0.2-dex uncertainty of the assumption, when they are derived from a single submm-mm band (Section 8). The error bars of and are estimated with the 1 measurement uncertainty and the propagation from both SFR and uncertainties, respectively. For all populations, the different assumptions of the initial mass function and the dust opacity coefficient among the literature are corrected.
![[Uncaptioned image]](/html/2204.06393/assets/x15.png)
Extended Data Figure 11 and relation. The colour scale and the vertical range of red-shade regions correspond to those of Fig. 3. The red circle and the red-shade regions show the potential range of GNz7q suggested by its faint and extremely faint X-ray property, respectively. The horizontal range of the red-shade regions indicates the 68th percentile of the estimate from the [C ii] line. For comparison, we also present and (or ) estimates for blue quasars at –7 (blue squares)[119, 122, 99, 121, 100, 117, 19, 118] and red quasars at (magenta circles)[104]. The error bars denote the 1 uncertainties taken from the literature. The values from the kinematic analysis based on the 3D modeling are shown in the filled blue squares with the 1 error bars[117, 118]. The measurements based on the rotation-disk assumption in the literature are shown by the open blue squares. The best-fit relation for the filled blue squares is shown by the blue line[117]. The black solid line represents the best-fit relation between the bulge mass and among local quiescent galaxies[123]. The black dashed line denotes the best-fit relation between the stellar mass of the entire system and among local AGNs[124]. The shaded regions present the 1 confidence level for the best-fit relations.