Investigating the effects of electron bounce-cyclotron resonance on plasma dynamics in capacitive discharges operated in the presence of a weak transverse magnetic field
Abstract
Recently, S Patil et al.Patil_013059_PRR_2022 have reported the existence of an enhanced operating regime when a low-pressure (5 mTorr) capacitively coupled discharge (CCP) is driven by a very high radio-frequency (60 MHz) source in the presence of a weak external magnetic field applied parallel to its electrodes. Their Particle-in-Cell (PIC) simulations show, that a significantly higher bulk plasma density and ion flux can be achieved at the electrode when the electron cyclotron frequency equals half of the applied RF frequency for a given fixed voltage. In the present work we take a detailed look at this phenomenon and further delineate the effect of this “electron bounce cyclotron resonance (EBCR)” on the electron and ion dynamics of the system. We find that the ionization collision rate and stochastic heating is maximum under resonance condition. The electron energy distribution function also indicates that the population of tail end electrons is highest for the case where EBCR is maximum. Formation of electric field transients in the bulk plasma region are also seen at lower values of applied magnetic field. Finally, we demonstrate that the EBCR induced effect is a low pressure phenomenon and weakens as the neutral gas pressure increases. The potential utility of this effect to advance the operational performance of CCP devices for industrial purposes is discussed.
pacs:
52.25.Mq, 52.25.-b, 52.70.GwI Introduction
The ion flux and the impact energy of ions incident on a substrate are two important parameters that control the processing rates and the quality of the wafer in plasma reactors used for silicon wafer etching and material deposition in semiconductor industries. The capacitively coupled plasma (CCP) reactor is the most popular tool for etching purposes in industries. It is typically operated by a 13.56 MHz radio-frequency (RF) source Lieberman_NJ_2005 ; Chen_APL_93_2008 ; Buddemeier_APL_67_1995 . The etching process is a function of the operating neutral gas pressure, the input power and the geometry of the system. Thus, both the ion flux and the ion energy changes simultaneously with input power for a fixed neutral gas pressure and system geometry. Accordingly, several detailed studies report that in the single frequency capacitively coupled plasma (SF-CCP) discharges the ion flux and the ion energy cannot be controlled independently Kaganovich_IEEE_34_2006 ; Kawamura_POP_13_2006 ; Lieberman_IEEE_16_1998 ; Godyak_SJP_78_1976 ; Godyak_JAP_57_1985 ; Kaganovich_PRL_89_2002 ; Sharma_POP_21_2014 ; Sharma_PSST_22_2013 ; Sharma_POP_20_2013 . To overcome this limitation, several alternate ideas have been proposed in the past. One widely used idea in semiconductor industry is the dual-frequency capacitively coupled plasma (DF-CCP) device in which the low frequency () component controls the sheath width (i.e. effectively ion energy) while the high frequency () component influences the plasma density (i.e. the ion flux) Goto_IEEE_6_1993 ; Robiche_JPDAP_36_2003 ; Kim_POP_10_2003 ; Turner_PRL_96_2006 ; Sharma_JPDAP_46_2013 ; Karkari_APL_93_2008 ; Boyle_JPDAP_37_2004 ; Sharma_JPDAP_47_2014 ; Sharma_Thesis_2013 . However, frequency coupling occurs if these two frequencies (i.e. and ) are too close to each other and as a result, independent control of ion flux and ion energy is not possible Kawamura_POP_13_2006 ; Turner_PRL_96_2006 ; Gans_APL_89_2006 ; Schulze_JPDAP_40_2007 ; Zhen_PSST_22_2013 . In order to minimize the frequency coupling effect, one has to choose very high compared to , which gives rise to electromagnetic effects, another undesirable physical phenomenon. These electromagnetic effects (typically occurring at 70 MHz) create nonuniformity in the plasma, which ultimately degrades the wafer quality Lieberman_PSST_11_2002 ; Perret_APL_83_2003 ; Perret_APL_86_2005 . Other alternative schemes to achieve the goal of independent control of ion flux and ion energy are electrical asymmetric effects Czarnetzki_PSST_20_2011 ; Heil_JPDAP_41_2008 ; Bruneau_PSST_23_2014 ; Bruneau_PRL_114_2015 ; Schungel_JPDAP_49_2016 and non-sinusoidal, tailored voltage/ current waveform excitations Economou_JVST_31_2013 ; Lafleur_PSST_25_2016 ; Qin_PSST_19_2010 ; Shin_PSST_20_2011 ; Sharma_PSST_24_2015 ; Sharma_PSST_29_114001_2020 ; Sharma_POP_28_103502_2021 . In addition to that, recently researchers have also explored the consequences of driving a CCP by frequencies up to a few tens of MHz or even higher. A CCP driven in the very high frequency (VHF) band (i.e. 30-300 MHz) creates higher plasma density because of the increase in the plasma current for a fixed discharge power and lower DC self-bias, thereby giving a higher etching rate with lower damage compared to the low frequency plasma excitation. Interesting phenomenon like formation of an electron beam near to the sheath edge which travels across the bulk plasma without collisions and interacts with the opposite sheath can create ionization and sustain the plasma in VHF driven CCP discharges Shahid_PSST_19_2010 ; Wilczek_PSST_24_2015 ; Sharma_POP_23_2016 . Other phenomena like the formation of electric field transients and its effect on the bulk plasma and sheaths, the presence of higher harmonics in voltage and current etc. are published in the literature of very high frequency CCP discharges Sharma_POP_23_2016 ; Sharma_POP_25_080705_2018 ; Sharma_JPDAP_52_2019 ; Miller_PSST_15_2006 ; Upsdhyay_JPDAP_46_2013 ; Sharma_POP_25_063501_2018 ; Wilczek_PSST_27_2018 ; Sharma_POP_26_2019 ; Sharma_PSST_29_2020 .
External magnetic fields have been used in many previous studies in the area of magnetically enhanced reactive ion etching (MERIE) Muller_ME_10_1989 ; Lieberman_IEEE_19_1991 ; Hutchinson_IEEE_23_1995 ; Kushner_APL_94_2003 ; Vasenkov_JAP_95_2004 ; Park_IEEE_25_1997 . You et al. You_TSF_519_2011 experimentally investigated the effect of static external magnetic field on asymmetric single frequency CCP argon discharges. The operated frequency is 13.56 MHz in low and intermediate pressure regime. They reported the appearance of EB drift resulting from the electric field E perpendicular to the electrodes and external magnetic field B parallel to the electrodes. In another PIC simulation study, conducted by Yang et al. Yang_PPP_14_2017 ; Yang_PSST_27_2018 , an asymmetric magnetic field with variable gradients has been used to create asymmetry in the arrangement of a capacitively coupled discharge reactor. They showed that the magnetic field asymmetry offers a method to independently control the ion flux and the ion energy. Later, Sharma et al. Sharma_POP_25_080704_2018 used a well-tested Electrostatic Direct Implicit Particle-In-Cell (EDIPIC) code Sydorenko_Thesis_2006 ; Campanell_POP_19_2012 ; Sheehan_PRL_111_2013 ; Carlsson_PSST_26_2017 ; Campanell_APL_103_2013 ; Charov_PSST_28_2019 and showed that enhancement in ion flux and effective control on ion energy can also be obtained by applying a uniform transverse external magnetic field.
As discussed above, an external transverse magnetic field in SF-CCP enhances the ion flux and also provides a mechanism to control the ion flux and ion energy. However, the presence of a large magnetic field (typically few tens to hundreds of Gauss) introduces an undesirable non-uniformity in the bulk plasma Barnat_PSST_17_2008 ; Fan_POP_20_2013 and thus compromises the uniformity of the wafer. Barnat et al. Barnat_PSST_17_2008 studied the effect of an external magnetic field on argon CCP discharges at 13.56 MHz applied frequency, and observed that the transverse magnetic field causes non-uniformities in the discharge owing to the EB drift. Fan et al. Fan_POP_20_2013 used 2D-3V PIC simulations to investigate the effect of an externally applied transverse magnetic field on an argon CCP discharge at 20 mTorr pressure driven by a 13.56 MHz RF source with an applied voltage of 200 V. It was found that for uniform magnetic field, the plasma density increases by increasing magnetic field from 0 G to 50 G. But above 20 G, the non-uniformity in the plasma caused by the EB drift becomes significant.
SF-CCP driven by VHF in presence of external transverse weak uniform magnetic field enters in a new operational regime. Recently, a different regime where a significant enhancement in the performance of low-pressure CCP discharge at much lower transverse magnetic field has been reported Patil_arXiv ; Patil_013059_PRR_2022 ; Zhang_PRE_104_045209_2021 ; Wang_PSST_30_10LT01_2021 . Patil el al. Patil_013059_PRR_2022 ; Patil_arXiv were the first to report, using PIC simulations, that a significant enhancement in the performance of a low-pressure (5 mTorr) CCP discharge can be achieved by applying a very weak transverse magnetic field ( 10 G) at the applied frequency of 60 MHz. It was shown that the enhancement in performance is due to a resonance effect which occurs when the electron cyclotron frequency (, where e, and B are the electronic charge, mass and external applied magnetic field respectively) matches one half of the applied RF frequency (). Subsequently, Zhang el al. Zhang_PRE_104_045209_2021 also observed a similar type of effect using PIC simulations in the frequency range of 13.56 MHz to 60 MHz and then verified these findings experimentally. Recently Wang et al. Wang_PSST_30_10LT01_2021 have reported the attenuation of self-excitation of plasma series resonance (PSR) in the presence of a transverse external magnetic field using 1D-3V PIC simulation.
In this study, we provide a more detailed study of the effect of a weak transverse magnetic field (10 G) on an argon CCP discharge driven at a very high frequency (60 MHz), at a very low neutral gas pressure (5 mTorr). We have used the 1D-3V Electrostatic Direct Implicit Particle-In-Cell (EDIPIC) code. We have shown that high plasma density, and thereby high ion flux can be achieved at a very low magnetic field for which the non-uniformity in plasma would be negligible. The paper is structured as follows. In Sec. II, we describe the simulation technique and parameters including boundary conditions. The simulation results at different magnetic fields and a discussion about the same are described in Sec. III. The concluding remarks are presented in Sec. IV.
II Simulation Technique and Parameters
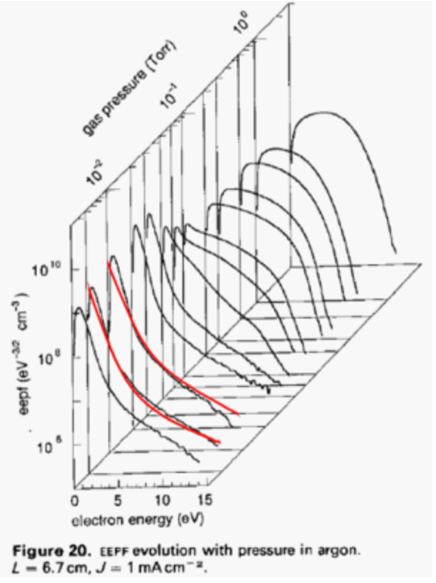
A well-tested and widely used 1D-3V Electrostatic Direct Implicit Particle-In-Cell (EDIPIC) code Sydorenko_Thesis_2006 ; Campanell_POP_19_2012 ; Sheehan_PRL_111_2013 ; Carlsson_PSST_26_2017 ; Campanell_APL_103_2013 ; Charov_PSST_28_2019 ; Sharma_POP_25_080704_2018 has been used for this study. It simulates the plasma domain bounded by two parallel plate electrodes. The code is based on the well-established Particle-in-Cell/Monte Carlo Collision (PIC-MCC) technique Birdsall_AH_1991 ; Hockney_AH_1988 . The electron-neutral collisions considered here are elastic, excitation and ionization. For the ion-neutral collisions, elastic and charge exchange collisions are taken into account. It is important to note that the metastable reactions are not critical at low pressure and thus not included here. The cross-section data used for the collisions have been taken from well-tested sources Shahid_JAP_82_1988 ; Lauro_JPDAP_37_2004 . The code evolves the positions and velocities of electrons as well as singly ionized argon ions i.e. Ar+. It is to be noted that although the code is 1D in position, it can accurately simulate the EB motion of charged particles because it has 3D in velocity space. The neutral gas dynamics is not evolved; the neutral gas distribution is straightforwardly uniform between the electrodes throughout the simulation. The neutral gas temperature also kept constant at 300 K. We have also ignored secondary electron emission since at low pressure, it has a negligible effect on discharge properties Lieberman_NJ_2005 . The external circuit has also not been considered here because in a simulation, it is easier to assume a given potential at the electrodes and allow the current form to adjust accordingly. We have also conducted a few simulations to benchmark EDIPIC code against a well established experimental paper Godyak_1992 to strengthen our present simulation results. The experimental parameters used in Godyak el al. Godyak_1992 are: L = 6.7 cm, J = 1 , = 13.56 MHz at different gas pressure for argon discharge. We have used EDIPIC for the same set of discharge parameters and compared electron energy distribution function (EEDF) at 5 mTorr and 10 mTorr. Figure 1 shows the comparison of EEDF measured by experiments and results from simulation (red curve) at these two pressures. It is clearly seen that bi-Maxwellian nature of EEDF obtained from simulation (red solid line in figure 1) is in good agreement with the experimental results.
The neutral argon gas at 5 mTorr pressure is used in present research work. The frequency and applied voltage amplitude are 60 MHz and 100 V respectively. The voltage having the following waveform is applied between the grounded electrode (GE) and the so-called powered electrode (PE), which are 32 mm apart:
| (1) |
Here , and are the voltage amplitude, applied radio-frequency and phase respectively. The electrode dimensions are anticipated to be significantly larger than the inter-electrode gap. Thus, the 1D spatial assumption is valid. The external magnetic field (B) has been varied from 0 G to 107 G and is applied parallel to the electrodes . The initial electron and ion temperatures are 2 eV and 0.026 eV (300 K) respectively. The cell size (x) used is 1/8 of the Debye length ( where is the permittivity of free space and is the electron temperature in eV) for a density of . The cell size is therefore m, which is small enough to resolve the Debye length (). The number of cells turns out to be 1217 for the system length of 32 mm. The time step () is estimated as / (maximum expected velocity), where the maximum expected velocity is four times the thermal velocity. The time step is thus s, which satisfies the stability criterion 0.2, since = 0.03 . This time step appropriately resolves the cyclotron motion at the maximum magnetic field of 107 G as = 1/ = s 425.6 . Here , where B and is the external magnetic field and the electronic mass respectively, is the cyclotron frequency. The number of super particles per cell is initially 400 which gives total number of particles of the order of . The external magnetic field (B) which is implemented parallel to the electrodes is quantified by the ratio so that the resonance can occur at r = 1. Here the value of ‘r’ is varied from 0 to 10 by varying the magnitude of external magnetic field from 0 G to 107 G. We have assumed the perfect absorbing boundary conditions here, i.e. all charged particles are absorbed when they reach at the electrodes.
III Results and Discussion
III.1 Plasma density and ion flux
The higher etch rate can be obtained by getting higher ion flux at the electrode for which, plasma density has to be increased. One of the ways to achieve this is to use a higher neutral gas pressure in the CCP. However, operating the CCP at a low pressure (typically at a few mTorr) is an essential criterion to restore anisotropy in the etching process by creating a collisionless plasma Lieberman_NJ_2005 .
The spatial variation of the electron and ion density averaged over last 100 RF cycles has been shown in figure 2 for a few specific values of ‘r’. It is clear from the figure that the peak density is at r =1 (for B = 10.7 G) which is nearly 3.5 times higher than unmagnetized case i.e. r = 0 (red curve). The density decreases significantly for the higher values of r = 2, 2.5 and 3.5 compared to r = 1. Finally, for r 3.5, the density starts to increase with ‘r’ and at r =10 (for B = 107.2 G) the density reaches nearly the value of the r =1 case. Also it is to be noted that the density profile is asymmetric at r = 2.5 case. We will discuss this phenomenon in a later section.
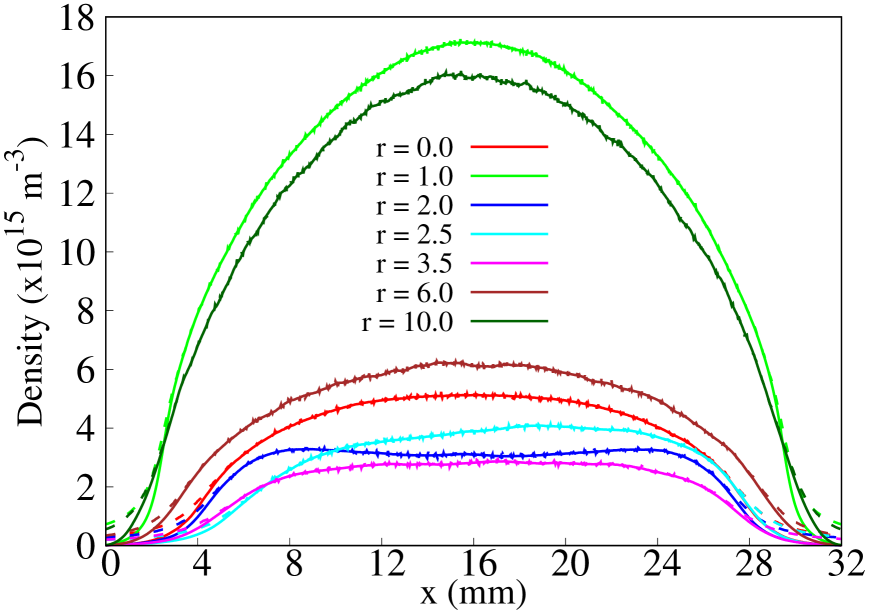
Figure 3 shows a plot of the peak electron density (at the center of discharge) and the ion flux (at the electrodes) against the magnetic field strength (i.e. against ‘r’). The left and right y-axis show the electron density and ion flux respectively. A few specific values of ‘r’ are also shown in the figure by a green font. The results demonstrate that at particular values of ‘r’ (i.e. 0.5 and 1), the plasma density and the ion flux display maximas. As shown in figure 2, at r = 1 a maximum plasma density of (at B = 10.7 G) appears and after that the density decreases rapidly up to r = 2. The density again increases monotonically after r = 3.5 (B = 37.3 G) and attains a value of at r =10 (B = 107.2 G). There is plenty of past literature that have reported the reason behind the monotonic increase of density beyond r = 3.5 in magnetically enhanced CCP devices Muller_ME_10_1989 ; Lieberman_IEEE_19_1991 ; Hutchinson_IEEE_23_1995 ; Kushner_APL_94_2003 ; Vasenkov_JAP_95_2004 ; Park_IEEE_25_1997 . In this paper the novel result at r =1 where a maximum in density is achieved at a very weak external magnetic field of 10.7 G is going to be discussed in detail.
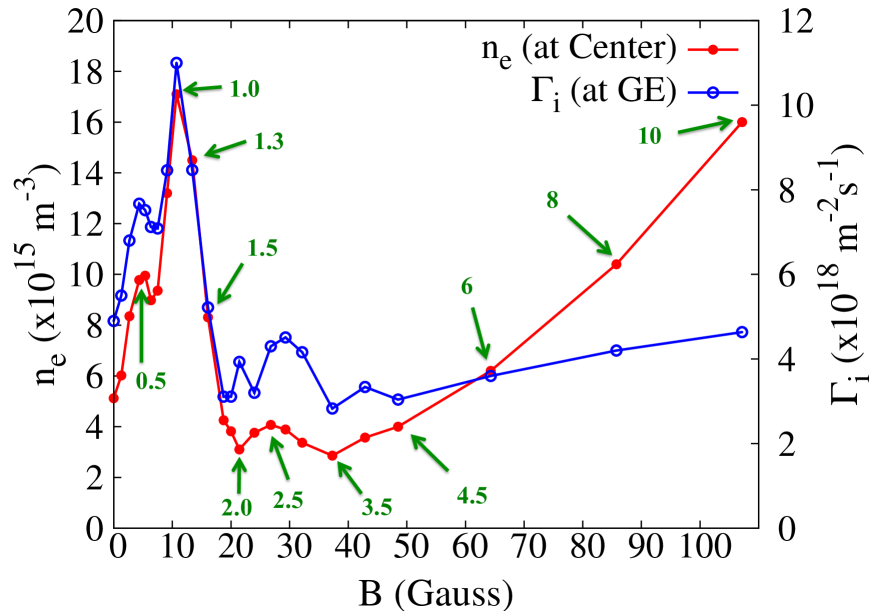
It is expected that the ion flux () at the electrodes (or equivalently the ion current density ) will follow a similar trend as the density with a corresponding peak at r = 1, as is observed in figure 3 (blue curve). However, the ion flux does not increase like the density above r = 3.5. This means that at a particular amplitude of the applied voltage, the ion flux obtained at r = 1 ( ) is considerably higher compared to the case in the absence of magnetic field ( ) as well as for r 3.5. So the larger magnetic fields (r 10) can create higher plasma densities although not proportionately higher ion flux at the electrodes.
III.2 Ion energy and plasma potential
To find out whether the observed peak at r = 1 is an improvement in the overall performance of the discharge, the average energy of ions incident on the electrodes needs to be observed.
Figure 4 demonstrates the change in the average energy of incident ions on the grounded electrode (at 32 mm) with the strength of the external magnetic field. It can be seen that the average energy of ions at r = 1 (i.e. at 10.7 G) is 54.5 eV, which is less than 57.0 ev the value corresponding to the case when the magnetic field is absent. We have calculated the sheath width (also shown in figure 2) which is 5.2 mm and 3 mm for r = 0 and r =1 case respectively. Therefore the change in ion energy can be ascribed to the reduction of the sheath width that affects the potential drop across the sheath. We can conclude that at r = 1, a considerably greater ions flux with a somewhat lower average ion energy can be achieved at the electrodes compared to the case without an external magnetic field.
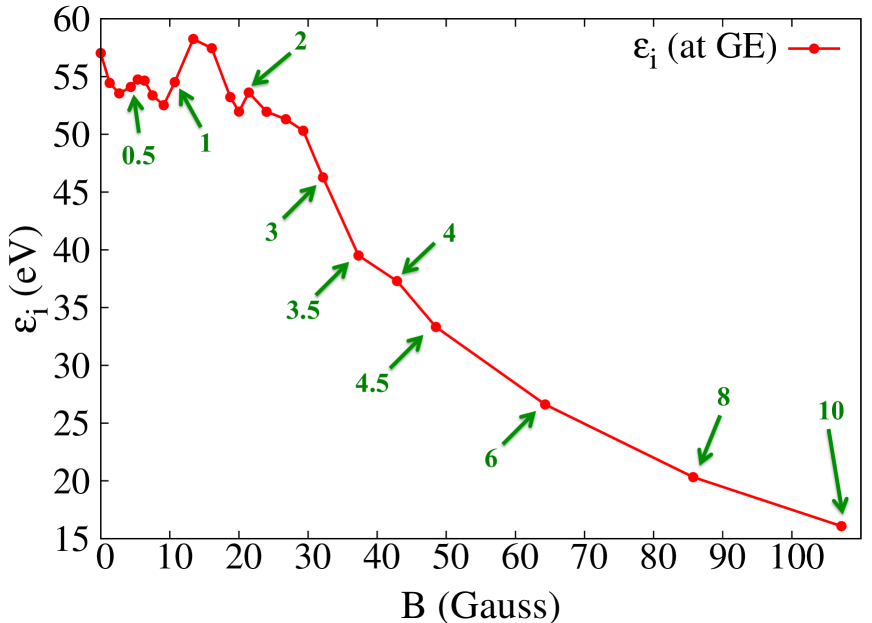
The energy of ions at r 3.0 is much lower than that at r = 1. This means that operation at r 3.0, has the advantage of lower ion energies, however at the cost of ion flux. Furthermore, the disadvantage of non-uniformity occurs in the plasma due to EB drift at higher magnetic fields, which would be negligible at r = 1. Consequently operating the CCP at r = 1 has a clear advantage because of negligible non-uniformity in plasma.
III.3 Rationale for choosing the magnetic field values
In this subsection, we examine the physical origin of this specific effect. In figure 5 we show trajectories of 3 electrons, which interact multiple times with the sheath. This figure has been already reported in our previous publication Patil_013059_PRR_2022 and reproduced here for completeness. These 3 electrons are labelled as 1, 2 and 3 having initial energy of 4 eV, 8 eV and 12 eV respectively. The figure 5 (a), (b) and (c) are for case B = 0 G (i.e. r = 0), B = 10.7 G (corresponding to r = 1.0) and B = 5.3 G (corresponding to r = 0.5) respectively. It is clear from the figure that in each case, the electrons are bounced back into the bulk plasma by the strong oscillating electric field of the sheath when they move towards the electrode. The discharge here is nearly collisionless and the electron-neutral collision is not significant inside the bulk plasma. In figure 5 (a) for the r =0 case, particle 1 (i.e. 4 eV) reaches the opposite sheath after getting a kick from the expanding left sheath. It bounces back again to the left sheath because of getting a kick from the expanding right sheath and gets trapped between the two sheaths. It is eventually lost to one of the electrodes after a few oscillations. In a similar way, particle 2 (i.e. the 8 eV one) is also trapped between the two sheaths and eventually gets lost to the right electrode at 45 ns after a couple of oscillations. Finally, particle 3 (i.e. one with 12 eV) gets kicked by the expanding left sheath, reaches the right sheath, bounces back and gets lost to the left electrode at 20 ns. The above results clearly show that electrons having different energies or velocities have different travel time between the two sheaths. Consequently, they are generally not in the resonant stage because their subsequent interactions with the sheaths are not in the same phase as the sheath oscillation. In figure 5 (b) for r = 1, it is to be noted that the electron motion closely resembles the pure cyclotron motion (the RF electric field inside bulk plasma is weak i.e. V/m). Consequently, all the 3 electrons getting kicked by the left sheath arrive to the same sheath after half a ‘cyclotron period’ (shown by dashed magenta line) irrespective of their velocities. It is because the ‘cyclotron period’ is not a function of the velocity of the electron and there being no velocity component parallel to the electrodes at the time of impact with the sheath. The duration of the subsequent reflections or bounces is called the “bounce time” here. For the case of “r=1”, the bounce time is equal to an RF period. As a result, the electrons, which are kicked by an expanding phase of an RF sheath, return to the same sheath at the same phase and undergo another energy gain from the interaction with expanding sheath. This mechanism for r = 1 expedites the effective production of energetic electrons as compared to r = 0 case. Consequently the electrons can gain substantial energy by this mechanism and contribute significantly to the process of ionization near to the sheath edge which then results in an increase of the ion flux. The electrons can remain in such a resonance till they collide with a neutral atom and that may occur once in every few RF periods on an average at such low pressures. The generation of high energetic electrons can also be seen in the profile of the electron energy distribution function (EEDF) and in the density of electrons having energy greater than the ionization potential. We will discuss this in the next subsection.
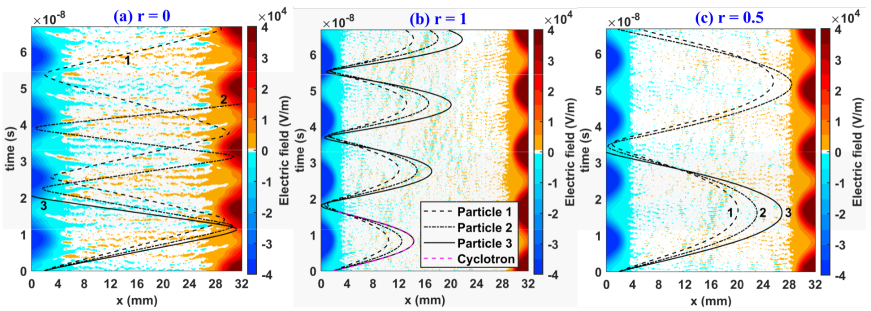
It is to be noted that similar, but smaller boosts in electron density and ion flux are spotted at r = 0.5 (see Fig. 3). The resonance phenomenon is less efficient for this case for two reasons. Firstly, here the electrons experience collisions inside the bulk plasma because the electrons that get kicked from the expanding sheath return to the same sheath after two RF periods (see Fig 5 (c)). The mechanism here is same as for r = 1 case however the electrons traverse longer paths compared to the r = 1 case. Secondly, the Larmor radius , where is the component of velocity perpendicular to B, is big enough to touch the opposite sheath at such a low magnetic field. The interaction of electrons with the opposite sheath can disturb the electron’s trajectory and interrupt the resonance.
As will become apparent after going over the simulation results, the discharge properties do not vary monotonously as the magnetic field is varied. The variation is particularly interesting at magnetic fields lower than 30 G. It has been observed that discharge properties of interest such as the density and the ion flux at the electrodes have extrema at simple rational values of the ratio of the cyclotron frequency () to the applied RF frequency (), especially at the lower values (viz. 0.5, 1). Thus, the magnetic fields used in the simulations have been varied by changing the ratio . The reason for using this ratio is as follows: At typical electron velocities (a few times the thermal velocity at eV), the magnetic force on the electron will dominate the electrostatic force because the electric field in the bulk is weak. The motion of an electron thus closely resembles cyclotron gyration. An electron reflected from a sheath at some phase of an RF cycle will undergo a motion as shown in Fig. 5. If the electron were to complete half a cyclotron gyration in one RF period, it would be incident on the sheath at the same phase as its previous incidence (Fig. 5 (b)). Such synchronization can go on either until the electron undergoes collisions within the bulk or until it gains enough energy to reach the opposite sheath because of its large Larmor radius. This, and similar possible synchronization conditions (as shown in Fig. 5) can be quantified by the number of half-cyclotron gyrations the electron undergoes in one RF cycle. In terms of time periods, this quantity (henceforth denoted by ‘r’) should satisfy:
| (2) |
| (3) |
Since (= ) is directly proportional to B, ‘r’ is also directly proportional to B. The values of the magnetic field for all simulations have been determined by setting the value of ‘r’ to the simple ratios (0.5, 1, 2, etc.) that are of interest.
III.4 Ionization rate
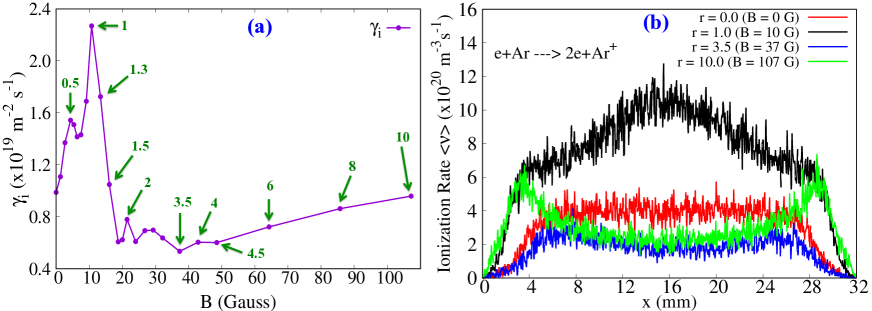
Discharge properties are determined by particle and energy balance. To explain the variation of the properties hitherto discussed, these balances ought to be analyzed. The particle balance depends on the outgoing ion and electron flux and the ionization in the discharge. The variation of total ionization rate (ionization events per second per unit electrode area) in the simulation region between two electrodes versus strength of external magnetic field is shown in figures 6 (a). The different values of ‘r’ (in green font) can also be observed in this figure. It is clearly observed that the total ionization rate is maximum for r = 1 where the plasma density is highest for the chosen parameters in our present study (see Fig 3). This is the case where highly energetic electrons are maximum in the system, which we will see in the description of electron energy distribution function (EEDF) in the next subsection. The total ionization rate decreases drastically above r = 1 and it again shows increasing trend above ‘r = 3.5’. However even at higher values of ‘r’ the total ionization rate in the discharge region is much less compared to the ‘r = 1’ case. Figure 6 (b) demonstrates the profile of ionization rate with respect to system length at different values of ‘r’ i.e. 0, 1, 3.5 and 10. It is clear from this figure that the ionization rate is maximum for r = 1 case where the electrons perform bounce cyclotron resonance phenomena as shown in figure 5 (b). However for the unmagnetized case i.e r = 0, the ionization occurs uniformly in the bulk regime. For higher values of ‘r’ (i.e 10) the electrons reflected from the oscillating sheath are tightly bound with the magnetic field lines and not able to penetrate to the center of discharge and hence create ionization in the vicinity of the sheath region only.
III.5 Electron Energy Distribution Function
The plasma parameters like electron density and temperature can be easily estimated by measuring the Electron Energy Distribution Function (EEDF), which is the most critical factor in chemical reactions during the plasma processing. Controlling the EEDF is very crucial to advance and optimize the etching process in CCP devices. There are many studies which show the change in EEDF with changing operating conditions in both magnetized (Fan_POP_20_2013, ; You_TSF_519_2011, ; Hutchinson_IEEE_23_1995, ) and unmagnetized CCP discharges (Fattah_APL_83_2003, ; Fattah_POP_19_2012, ; Fattah_POP_20_2013, ; Sharma_POP_23_2016, ; Sharma_POP_26_2019, ). In this section, we investigate the effect of the variation of the strength of external magnetic field on the shape of EEDF.
It is worthwhile to analyze the dependence of energy distribution of electrons on magnetic field in order to explain the variation in the ionization rate.
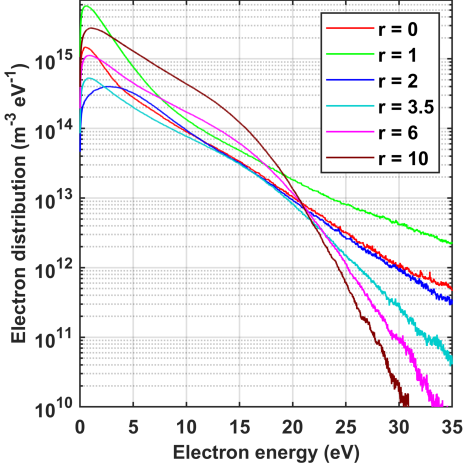
Figure 7 shows the electron energy distribution function at the center of discharge for few specific different values of ‘r’. For r = 0 (i.e. unmagnetized case), the EEDF is weakly bi-Maxwellian in nature (the two slopes of curve intersects at 3.5 eV) which indicates the presence of two distinct electron populations with different temperatures. The bi-Maxwellian nature of the EEDF is owing to the collisionless or stochastic electron heating which mainly occurs in the vicinity of the sheath edges Godyak_PRL_65_996_1990 ; Kaganovich_IEEE_20_66_1992 ; Schweigert_PRL_92_155001_2004 . For the unmagnetized case, the density at the center of discharge is . A significant population ( ) is of low energy electrons (bulk electrons), i.e. up to 3.5 eV. The population of medium energy electrons (between 3.5 eV and 16 eV i.e. the ionization potential) is , and the remaining population ( ) is of electrons in the high energy tail of the EEDF. As the value of ‘r’ increases from 0 to 1, the shape of EEDF remains bi-Maxwellian, but the electron density in the bulk increases rapidly; for r = 1, the density at the center of discharge is . As a result, the population of both low energy electrons ( ) and high energy electrons in the tail increases ( ). This is consistent with the increase in ionization rate.
For r = 2 the bounce cyclotron resonance phenomenon is not effective and hence the population of tail end electrons decreases and hence the overall density goes down which is clearly reflected in the EEDF curve which is Maxwellian. Figure 7 shows that for r = 3.5, 6 and 10 the population of high-energy tail electrons depletes because the energetic electrons reflected from sheath are tightly bound with the magnetic field lines and cannot penetrate up to the center of discharge and hence most of the ionization occurs in the vicinity of the sheath edge as discussed in the previous section. The shape of EEDF is more like a Druyvesteyn for r = 6 and 10.
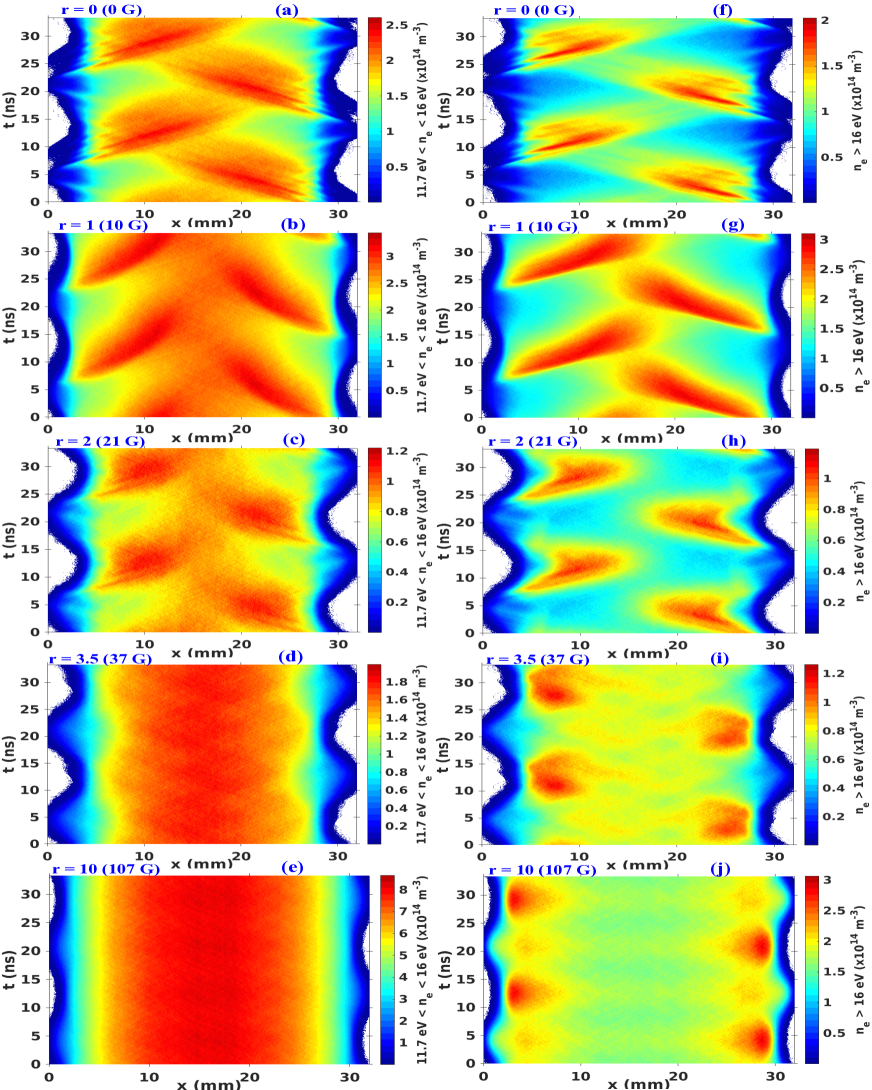
The change in the density of high-energy electrons by changing the value of ‘r’ can be explained from the spatio-temporal profile of energetic electrons for two RF cycles in figure 8. Sub figures (a)-(e) and (f)-(j) shows the density of electrons having energy between 11.7 eV to 16 eV and greater than 16 eV respectively. Here the 11.7 eV is the excited state and 16 eV is the ionization potential of argon. It is clear from sub-figure (a) and (f) that for r = 0 (0 G), the density of electrons having energy between 11.7-16 eV and greater than 16 eV are and respectively. It indicates that the energetic electrons emerge from the sheath edge at the time of sheath expansion and penetrate to the center of the discharge inside the bulk plasma. When the magnetic field increases to 10 G (r = 1) the density of such electrons increases significantly to (see sub-figure (b)) and (see sub-figure (g)) which is 32 and 55 increase respectively. The energetic electrons emerging from the expanding sheath edge are more intense and reach at the center of discharge. This is a clear evidence that the bounce cyclotron-resonance phenomenon increases the density of tail end electrons (energy greater than ionization potential), which enhance the ionization process mainly at center (see figure 6 (b)) and results in maximum density formation in this case. When the value of r is increased to r = 2 (21 G), the electron density drastically decreases to (for energy range 11.7-16 eV) and (for 16 eV) respectively. It is nearly 63 and 62 decrease for 11.7-16 eV and greater than 16 eV respectively. Hence the overall density for this case decreases significantly. The shape of the energetic electrons emerging from the expanding sheath also changes because of the magnetic field strength. Their penetration to bulk decreases because of magnetic field strength. When the value of ‘r’ is further increased to 3.5 (i.e at 37 G) the energetic electron density between 11.7-16 eV and greater than 16 eV are (see sub-figure (d)) and (see sub-figure (i)) respectively. It is nearly 65 and 6 increase for 11.7-16 eV and greater than 16 eV respectively compared to previous case. Sub-figure (d) indicates that majority of the density of electrons having energy between 11.7 eV to 16 eV are at the center of the discharge, however the peak density of electrons having energy greater than 16 eV are confined near to the sheath edge. Finally, when value of ‘r’ is 10 (i.e. at 107 G) the energetic electron density between 11.7-16 eV and greater than 16 eV are (see sub-figure (e)) and (see sub-figure (j)) respectively. Again the increase in density is 330 and 140 for 11.7-16 eV and greater than 16 eV respectively compared to previous case. This is also reflected in the curve of EEDF in figure 7. Sub-figure (e) indicates that majority of the density of electrons having energy between 11.7 eV to 16 eV are at the center of the discharge, however the peak density of electrons having energy greater than 16 eV are confined near to the sheath edge only.
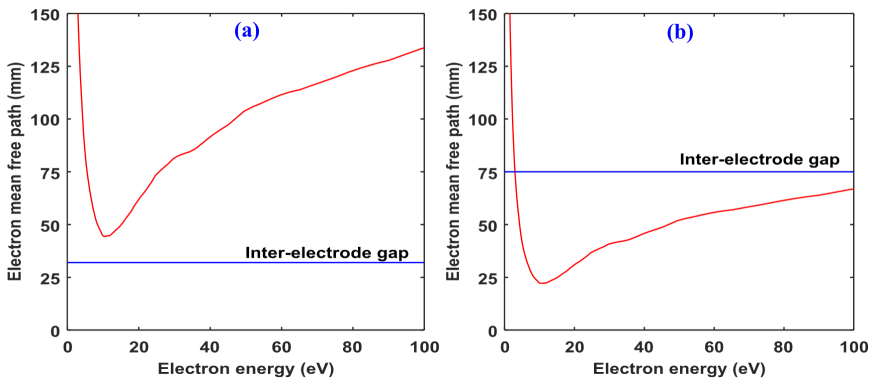
The increase in density as ‘r’ increases from 0 to 1 can be explained as follows: For r = 0 as well as for r = 1, the electrons moving toward an electrode are pushed back or “reflected” into the bulk plasma due to the presence of strong electric field in the sheath region. Let us refer to this sheath as ‘sheath 1’. Subsequently, such electrons will travel through the bulk and their motion will be influenced by the bulk electric field. This field is weak and can significantly affect only the trajectory of the very low energy electrons. The electrons under consideration, i.e. those, which interact with a sheath, are likely to have higher energies. Thus, the trajectories of a majority of the electrons under consideration are unaffected by the bulk electric field. An electron travelling through the bulk may either do so without colliding with a neutral or it may undergo a collision, the nature of which (elastic, excitation or ionization) will be determined probabilistically by the energy of the electron. The former possibility is more likely since the mean free path for collisions is larger than the inter-electrode gap (see figure 9 (a)).
If the electron does not collide at all in the unmagnetized case, it will reach the opposite sheath (see figure 5 (a)). Let us refer to it as ‘sheath 2’. The relative phase at which this electron arrives at sheath 2 with respect to the phase at which it was reflected by sheath 1 is determined by the time electron takes to travel the distance between the two sheaths. This travel time is thus estimated by the velocity of the electron after reflection and the strength of the electric field it encounters in the bulk plasma, but the later does not affect the trajectory significantly so has a negligible effect. As the electrons reflected by sheath 1 are distributed over the entire velocity range, their travel times must also be distributed over a certain range. For example, an electron having a higher velocity after reflection will reach sheath 2 earlier. This is true for electrons reflected from sheath 1 at all phases of an RF cycle. As a result, at each phase, reflected electrons in a certain velocity range will reach sheath 2 at a phase when the sheath width is minimum. These electrons constitute a fraction of the electrons absorbed by the electrode near sheath 2. The remaining fraction of the electrons that are absorbed consists of two types of electrons: one, electrons reflected by sheath 1 whose trajectories are changed due to collisions with neutrals such that they arrive at sheath 2 when the sheath width is minimum and two, the electrons created through ionization which also arrive at sheath 2 at this phase.
Now consider the trajectory of the reflected electrons in the r = 1 case as shown in figure 5 (b). If an electron does not collide with a neutral, its motion is affected by the magnetic field as well as the bulk electric field. However, the effect of the later is negligible (as was the case in the absence of magnetic field) and the electron motion can be approximated as cyclotron motion. Thus, the electron will return to sheath 1 after finishing half a gyration. However as explained earlier, the condition r = 1 means that the duration of half a gyration is accurately equal to the duration of an RF cycle. As the cyclotron frequency () is independent of velocity, an electron reflected by sheath 1 will return to sheath 1 at the same phase as its reflection, regardless of its velocity after reflection. Consequently, a fraction of all the electrons reflected by a sheath at any given phase of an RF cycle return to the same sheath at the same phase and the remaining fraction collides with neutrals in the bulk. Consequently, the only electrons that will get absorbed by an electrode at the minimum-width phase of the corresponding sheath are either the ones undergoing collisions in the bulk or the ones created through ionization, both of which must arrive at the sheath edge when the sheath width is minimum.
Note that for the synchronization between electron motion and the RF cycle to be effective, mean free path of the electrons () must be larger than the inter-electrode gap (i.e. collisionless discharge). If a majority of the reflected electrons collide with neutrals in the bulk, high density as achieved in the current study cannot be observed. For example, Turner et. al. Turner_PRL_76_2069_1996 have used an inter-electrode gap of 75 mm with a neutral gas pressure of 10 mTorr, for which the mean free path of a majority of electrons is smaller than the inter-electrode gap (see figure 9 (b)). Thus, they have not observed a high-density discharge at r = 1. Now if such a low-frequency discharge were to be operated in the collisionless regime (narrower gap and lower pressure), there is another reason why the synchronization would be ineffective.
We have assumed that an electron reflected by sheath 1 will not interact with sheath 2 during its half gyration, which it can if its Larmor radius is large enough. For r = 1, the gap between the two sheaths in the present study is about 26 mm (see figure 5) and the cyclotron frequency is 30 MHz. Therefore, an electron having Larmor radius greater than 26 mm must have energy greater than 68 eV. However the population of electrons in this energy range is realistically non-existent and can be ignored. This is what makes the synchronization between electron motion and the RF cycle effective. However, this synchronization would not lead to an increase in density if a substantial fraction of electrons reflected by sheath 1 interacted with sheath 2. Continuing the earlier example of Turner et al. Turner_PRL_76_2069_1996 , consider a low frequency discharge (i.e. 13.56 MHz) being operated with a narrow inter-electrode gap, about 32 mm. In that case, at r = 1, = = 6.78 MHz. Considering 3 mm sheath width, the Larmor radius for a reflected electron would have to be 26 mm to reach the other sheath, which corresponds to an energy of 3.5 eV. Consequently, after reflection a substantial fraction of electrons would reach the other sheath, which will render the synchronization ineffective. In conclusion, the synchronization is only effective for low-pressure, high frequency collisionless (or nearly collisionless) plasma.
The increase in density as ‘r’ increases above r = 4 is simply because of the increasing confinement leading to slower transport of electrons i.e. lesser loss. Above a certain ‘r’ (r 4), the Larmor radii for even the most energetic electrons having a non-negligible population are comparable to the sheath width (for example, at r = 4, 4.7 mm for a 35 eV electron). As a result, in the half cycle during which the width of a sheath decreases, a significant fraction of the reflected electrons will complete an entire gyration without approaching the electrode when the width of the corresponding sheath is minimum. Thus, at r 4, the electrons that do approach the electrode and get absorbed will mostly consist of the electrons undergoing collisions with neutrals. Consequently, the loss is determined by electron transport parameters. Without a magnetic field, the time and space scales of electron-neutral collisions (and thus of electron transport) are given by the collision frequency and the mean free path . Here, is the combined cross section for all types of electron-neutral collisions. The effective velocity is thus simply equal to the electron velocity . However, when the magnetic field is such that the cyclotron frequency is significantly greater than the collision frequency, the spatial scale of the transport is changed to twice the Larmor radius of the electron because until it collides, it will stay within a distance . The effective velocity now becomes = = = . At r = 4, = Hz, which is much greater than even the maximum value of the collision frequency, Hz. Thus, the electron transport and thereby electron loss is significantly reduced by the magnetic field for r 4. This is why the density increases with ‘r’. The nature of the energy distribution of electrons (figure 6 a), which is different than that for r 2, may be attributed to the change in the heating mode: for r 3.5, the heating is dominated by ohmic heating due to an appearance of significant electric field in the bulk (discussed in next subsection).
Between r = 2 and r = 4, the change in discharge properties with ‘r’ is not trivial. There is clearly a transition in the qualitative nature of the heating and transport mechanisms. In this range of ‘r’, a combination of the effects described above will determine the discharge properties. Other effects such as the change in sheath width and the corresponding change in collisionless heating may also play a significant role. Moreover, there is an asymmetry in the discharge properties in this range of ‘r’, for example in density (see figure 3), which adds another degree of complexity. This will be explored fully in a separate article.
III.6 Electron Heating
There are two important mechanisms through which electrons gain energy in CCP discharges: ohmic (collisional) heating and stochastic (collisionless) heating (Lieberman_NJ_2005, ). Ohmic heating mainly occurs in the bulk plasma because of electron-neutral collisions and stochastic heating is localized near the sheath edges due to momentum transfer between electrons and the oscillating high voltage sheaths Kawamura_POP_13_2006 ; Kaganovich_IEEE_34_2006 ; Kaganovich_PRL_89_2002 ; Sharma_PSST_22_2013 ; Lieberman_IEEE_16_638_1988 ; Kawamura_POP_21_123505_2014 ; Turner_PRL_75_1312_1995 . There is a high potential difference across sheath in CCP discharges which is large compared to the energy of plasma electrons. As a result, the electrons are reflected and confined within the discharge. The effect of external magnetic field on heating in an RF-CCP discharges was reported by Turner et al. Turner_PRL_76_2069_1996 . Using a fluid approach, they showed that collisionless heating could be allied with the rarefaction and compression of electrons flowing through the inhomogeneous plasma medium, which is stated as the ‘pressure heating’ mechanism. They reported the existence of a heating mode transition from collisionless to ohmic in the presence of weak external transverse magnetic field.
Figure 10 shows the variation of time-averaged electron heating in the discharge for some specific values of ‘r’.
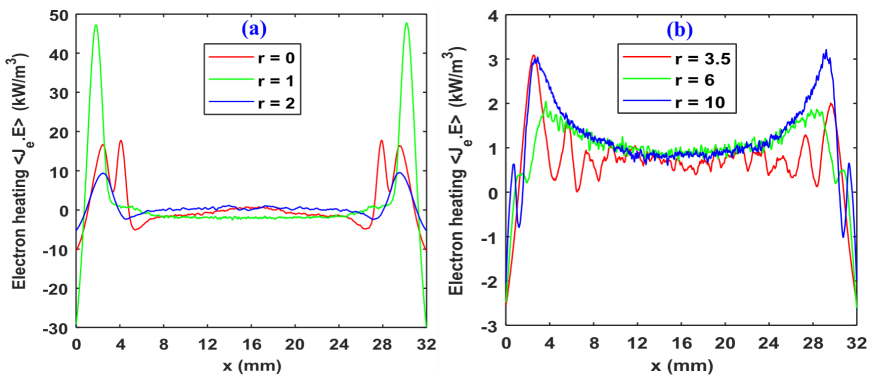
It is clear from figure 10 (a) that the positive heating is localized in the sheath regions and a small positive or negative electron heating is present in the bulk plasma. The physical explanation of the presence of negative electron heating i.e. can be found in literature Kaganovich_IEEE_34_2006 ; Surendra_PRL_66_1479_1991 ; Turner_JPDAP_42_194008_2009 . For r = 1, the heating is maximum and is much higher compared to unmagnetized case. Here the dominant heating mechanism is stochastic or collisionless. This effect diminishes or disappears when the electron collision frequency is increased either by increasing the gas pressure or removing the Ramsauer minimum in the electron-neutral collision cross section. As Turner et. al. Turner_PRL_76_2069_1996 demonstrated in their paper that increasing the strength of external magnetic field has a similar effect as introducing more collisions, i.e. increasing gas pressure, which results in more ohmic heating in the bulk plasma. This effect can be seen in figure 10 (b) where there is presence of significant ohmic heating in the bulk plasma. Above r = 3.5, the increase in total heating is due to the increase in ohmic heating in the bulk region.
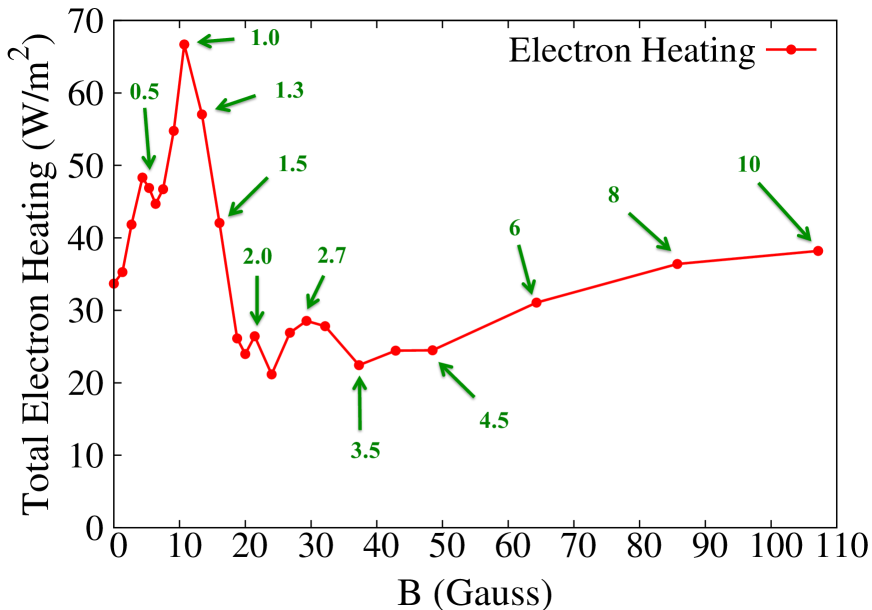
Figure 11 shows the variation of total electron heating with strength of magnetic field. The corresponding values of ‘r’ are also shown in the graph in green text. This figure indicates that the maximum electron heating is at 10 G i.e for r = 1 case which is 66.7 . This clearly shows that the total electron heating is maximum at bounce cyclotron resonance condition. Increasing values of ‘r’ decreases the total heating and above r = 3.5 it increases again however even at r = 10 the heating magnitude is 38 which is nearly 43 less compared to r = 1 case. As we know that the energy balance is between the total heating in the discharge and the energy spent in inelastic collisions (i.e. ionization and excitation) along with the kinetic energy lost due to particle fluxes to the electrodes. Thus, the variation in total electron heating is similar to the total ionization rate (see figure 6).
III.7 Electric Field
The electron heating changes from being largely stochastic to largely ohmic when going from unmagnetized/ low magnetic field strength to the high magnetic field values. This change is accompanied by an appearance of significant electric field in the bulk, as shown in the spatio-temporal plots in figure 12. This figure shows the spatio-temporal profile for two RF cycles, which is averaged over last 100 RF cycles after reaching steady state for all simulations. The interesting features such as the formation of electric field transients in the bulk plasma for unmagnetized CCP discharges (see figure 12 (a) for r = 0) has already been reported in the literature Sharma_POP_23_2016 ; Sharma_JPDAP_52_2019 ; Sharma_POP_26_2019 ; Sharma_PSST_29_2020 ; Sharma_JPDAP_54_055205_2021 ; Sharma_POP_21_2014 ; Sharma_CPP_55_331_2015 . In this subsection, the effect of external magnetic field on these electric field transients will be discussed.
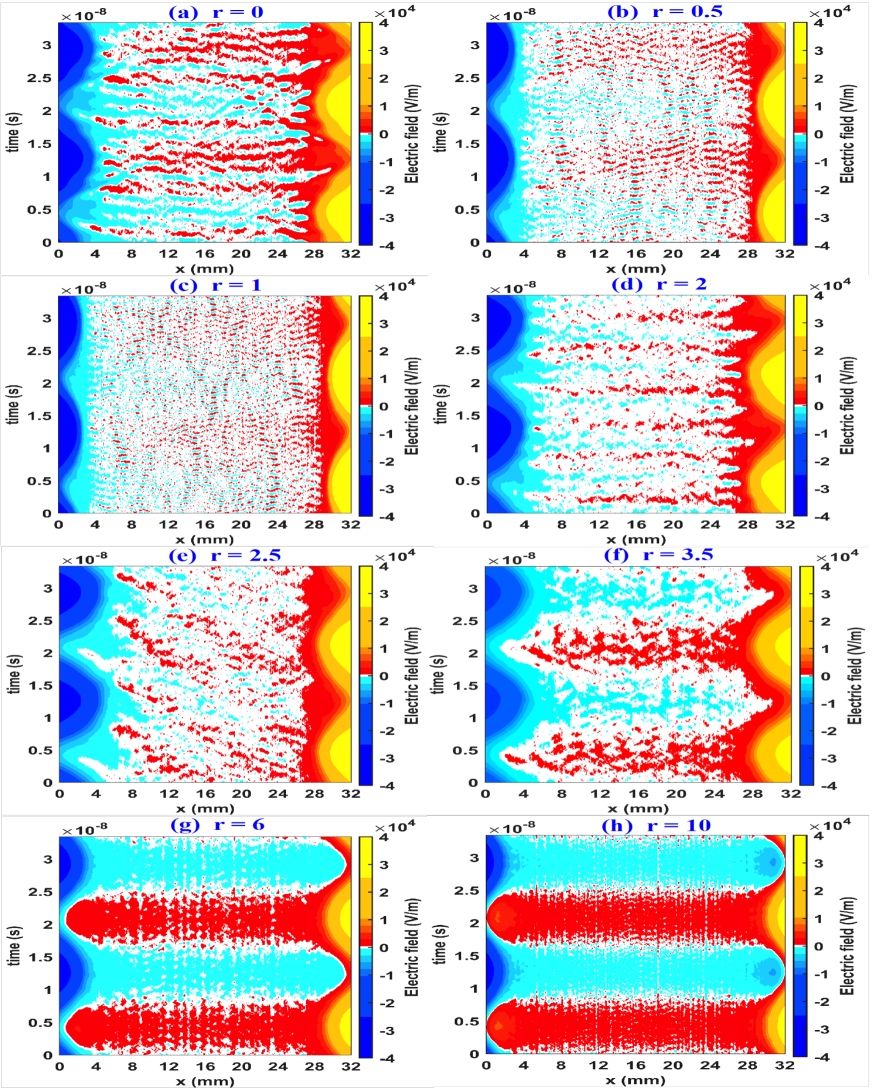
In figure 12, sub-figure (a) for r =0 demonstrates that the sheath electric field penetrates inside the bulk and creates filament like structures called electric field transients. As the values of ‘r’ increases to 0.5 ( 5.3 G) the density rises to from i.e. for ‘r=0’ case. Sub-figure (b) shows that the shape of transients are finer compared to ‘r=0’ case. When the value of ‘r’ increases from 0 to 0.5 the density of tail end electrons or energetic electrons having energy greater than 16 eV also increases from to , which is nearly an 18 increase. When ‘r’ is further increased to 1 (i.e. 10 G), the central peak plasma density is nearly . Here the energetic electrons density (energy 16 eV) is also increases to which is 32 higher compared to r = 0.5 case. The electric field transients are further refined and create very fine filament like structures. Such type of filamentation in umagnetized CCP case can be seen in the literature where the effect of RF voltage amplitude on electric field transients has been reported Sharma_JPDAP_52_2019 . When r = 2, the bulk peak plasma density decreases to and also the density of energetic electrons having energy greater than 16 eV i.e. which is nearly 62 decrement compared to r = 1 case. For this case the transient structures are again thick in nature. Again for further higher values of ‘r’ the electrons are confined because of higher magnetic field and significant ohmic heating occurs in the bulk region. The thickness of transient structure further increases, filamentation phenomenon of transient electric field vanishes and a lumped structure of electric field can be observed in the bulk regime (see sub-figures (g) and (h)). It is to be noted that the transient structures for ‘r = 2.5’ are entirely different in nature. This is currently being investigation and will be reported in a separate publication.
III.8 Effect of gas pressure on bounce-cyclotron resonance phenomenon
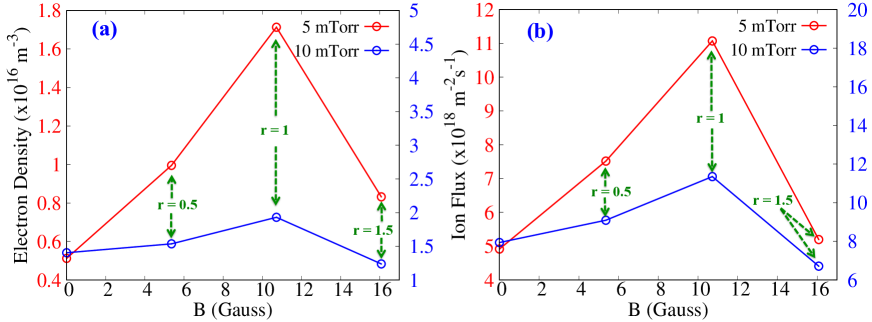
As discussed above, the bounce-cyclotron resonance phenomenon occurs at low pressure and in this section we show that by increasing pressure the effect of this phenomenon decreases significantly. For that one has to compare the electron-neutral collision frequency with the frequency of collisions with the sheath, which is twice of the cyclotron frequency. The fraction of electrons bouncing off the sheath that contributes to the resonant effect is equal to the average probability of an electron NOT colliding with a neutral between two bounces. This can be calculated as , where and are respectively the frequency of electron-neutral collisions and the frequency of bounces. Since is proportional to the neutral gas pressure, the fraction of electrons contributing to the resonant effect depends on the pressure. When the pressure is low enough for this fraction to be significant, the resonant effect is observed. For example, at 5 mTorr in our simulations, on average, 21 of the electrons bouncing off the sheath return for a consecutive bounce. For 7.5 mTorr and 10 mTorr, this fraction drops to 10 and 4 respectively. Simulations at 10 mTorr were carried out to support this estimate.
Figure 13 (a) and (b) shows the variation of electron density at the center of discharge and ion flux at the grounded electrode with respect to the strength of applied magnetic field. In this figure the left y-axis (red font) and right y-axis (blue font) indicate the electron bulk density and ion flux for 5 mTorr and 10 mTorr respectively. The bulk electron density and ion flux at the grounded electrode for 5 mTorr increases from (at r = 0) to (at r = 1) and to respectively. Hence the percentage increase in electron density and ion flux is nearly 240 and 120 respectively. On the other hand for 10 mTorr case, the bulk electron density and ion flux at the grounded electrode increases from (at r = 0) to (at r = 1) and to respectively. So here the percentage increase in electron density and ion flux is nearly 35 and 44 respectively. In conclusion, these figures confirm that the resonant effect vanishes at 10 mTorr. Using the above estimate, for the VHF range (30-300 MHz), resonant operation would typically require pressure to be less than 10 mTorr.
IV Conclusion and Discussion
It has been proposed that the resonant condition (r = 1) may be a better operation point for high frequency discharges since the nonuniformity for such a low magnetic field is expected to be much smaller compared to high magnetic fields (r 5-10). Such a resonant operation is only possible for high frequency discharges as the magnetic field required for cyclotron resonance (r = 1) at low RF frequencies will become so low that the Larmor radii of electrons will become larger than the system length, and the effect of resonance will disappear. Thus, high frequency CCP discharges have been shown to have a clear advantage through this study. The performance improvement at higher magnetic fields (r 3.5) as observed in this study has been consistent with previous studies Barnat_PSST_17_2008 ; Fan_POP_20_2013 .
It is also shown that at the resonance condition, the density is maximum however the ion energy at the grounded electrode is less compared to the unmagnetized case. The total ionization rate is also maximum for the r = 1 case and it is also shown that for this case the ionization inside bulk is maximum. For the higher values of ‘r’ ionization rate is maximum near to the sheath edges. With the help of EEDF profile it is demonstrated that the tail end electron population is maximum for r = 1 case and the tail depletes for the higher values of ‘r’. The presence of energetic electron population for the different cases of ‘r’ is also figured out with the help of spatiotemporal profile of density of electrons in different energy ranges, which shows that the presence of energetic electrons is maximum in the resonance case i.e. for r = 1. It is reported that the time average electron heating is maximum for r = 1 case and significant existence of ohmic heating is observed for higher values of ‘r’. The study of electric field transients for different values of ‘r’ has also been reported. Finally it is shown that the resonance phenomena is maximum at low pressure i.e. in the collisionless case and it disappears if the neutral gas density increases and the plasma is collisional. Further studies are required for a quantitative comparison between resonant discharges and generally used high magnetic field (50-100 G) discharges in terms of the trade-off between ion flux and ion energies at the electrodes.
V Acknowledgments
A.S. is grateful to the Indian National Science Academy (INSA) for the position of an Honorary Scientist. The work of I.K. was supported by the Princeton Collaborative Research Facility (PCRF), which is funded by the U.S. Department of Energy (DOE) under Contract No. DE-AC02-09CH11466. The results presented in this work have been simulated on ANTYA cluster at Institute for Plasma Research, Gujarat, India.
VI Author Declarations
Conflict of Interest The authors have no conflicts to disclose.
VII Data Availability
The data that support the findings of this study are available from the corresponding author upon reasonable request.
References
- (1) Sanket Patil, Sarveshwar Sharma, Sudip Sengupta, Abhijit Sen and Igor Kaganovich, Physical Review Research 4, 013059 (2022).
- (2) M. A. Lieberman and A. J. Lichtenberg, Principles of Plasma Discharges and Materials Processing (Wiley, NJ, 2005).
- (3) L. Xu, L. Chen, M. Funk, A. Ranjan, M. Hummel, R. Bravenec, R. Sundararajan, D. J. Economou, and V. M. Donnelly, Appl. Phys. Lett. 93, 261502 (2008).
- (4) U. Buddemeier, U. Kortshagen, and I. Pukropski, Appl. Phys. Lett. 67, 191 (1995).
- (5) I. D. Kaganovich, O. V. Polomarov, and C. E. Theodosiou, IEEE Trans. Plasma Sci. 34, 696 (2006).
- (6) E. Kawamura, M. A. Lieberman, and A. J. Lichtenberg, Phys. Plasmas 13, 053506 (2006).
- (7) M. A. Lieberman, IEEE Trans. Plasma Sci. 16, 638 (1988).
- (8) V. A. Godyak, Sov. J. Plasma Phys. 2, 78 (1976).
- (9) O. A. Popov and V. A. Godyak, J. Appl. Phys. 57, 53 (1985).
- (10) I. D. Kaganovich, Phys. Rev. Lett. 89, 265006 (2002).
- (11) S. Sharma, S. K. Mishra, and P. K. Kaw, Phys. Plasmas 21, 073511 (2014).
- (12) S. Sharma and M. M. Turner, Plasma Sources Sci. Technol. 22, 035014 (2013).
- (13) S. Sharma, and M. M. Turner, Phys. Plasmas 20(7), 073507 (2013)
- (14) H. H. Goto, H. D. Lowe, and T. Ohmi, IEEE Trans. Semicond. Manuf. 6, 58 (1993).
- (15) J. Robiche, P. C. Boyle, M. M. Turner, and A. R. Ellingboe, J. Phys. D: Appl. Phys. 36, 1810 (2003).
- (16) H. C. Kim, J. K. Lee, and J. W. Shon, Phys. Plasmas 10, 4545 (2003).
- (17) M. M. Turner, and P. Chabert, Phys. Rev. Lett. 96, 205001 (2006).
- (18) S. Sharma and M. M. Turner, J. Phys. D: Appl. Phys. 46, 285203 (2013).
- (19) S. K. Karkari, A. R. Ellingboe, and C. Gaman, Appl. Phys. Lett. 93, 071501 (2008).
- (20) P. C. Boyle, A. R. Ellingboe, and M. M. Turner, J. Phys. D: Appl. Phys. 37, 697 (2004).
- (21) S. Sharma and M. M. Turner, J. Phys. D: Appl. Phys. 47 (28), 285201 (2014).
- (22) S. Sharma, “Investigation of ion and electron kinetic phenomena in capacitively coupled radio-frequency plasma sheaths: A simulation study,” Ph.D. thesis (Dublin City University, Ireland, 2013).
- (23) T. Gans, J. Schulze, D. O’Connell, U. Czarnetzki, R. Faulkner, A. R. Ellingboe, and M. M. Turner, Appl. Phys. Lett. 89, 261502 (2006).
- (24) J. Schulze, T. Gans, D. O’Connell, U. Czarnetzki, A. R. Ellingboe, and M. M. Turner, J. Phys. D: Appl. Phys. 40, 7008 (2007).
- (25) Zhen-Hua Bi, Zhong-Ling Dai, Yu-Ru Zhang, Dong-Ping Liu and You-Nian Wang, Plasma Sources Sci. Tech. 22, 055007 (2013).
- (26) M. A. Lieberman, J. P. Booth, P. Chabert, R. J. Mand, and M. M. Turner, Plasma Sources Sci. Technol. 11, 283 (2002).
- (27) A. Perret, P. Chabert, J. P. Booth, J. Jolly, J. Guillon, and Ph. Auvray, Appl. Phys. Lett. 83, 243 (2003).
- (28) A. Perret, P. Chabert, J. Jolly, and J. P. Booth, Appl. Phys. Lett. 86, 021501 (2005).
- (29) U. Czarnetzki, J. Schulze, E. Schungel, and Z. Donko, Plasma Sources Sci. Technol. 20, 024010 (2011).
- (30) B. G. Heil, U. Czarnetzki, R. P. Brinkmann, and T. Mussenbrock, J. Phys. D: Appl. Phys. 41, 165202 (2008).
- (31) B. Bruneau, T. Novikova, T. Lafleur, J. P. Booth, and E. V. Johnson, Plasma Sources Sci. Technol. 23, 065010 (2014).
- (32) B. Bruneau, T. Gans, D. O’Connell, A. Greb, E. Johnson, and J.-P. Booth, Phys. Rev. Lett. 114, 125002 (2015).
- (33) E. Schungel, I. Korolov, B. Bruneau, A. Derzsi, E. Johnson, D. O’Connell, T. Gans, J. P. Booth, Z. Donko, and J. Schulze, J. Phys. D: Appl. Phys. 49, 265203 (2016).
- (34) D. J. Economou, J. Vac. Sci. Technol. A 31, 050823 (2013).
- (35) T. Lafleur, Plasma Sources Sci. Technol. 25, 013001 (2016).
- (36) X. V. Qin, Y. H. Ting, and A. E. Wendt, Plasma Sources Sci. Technol. 19, 065014 (2010).
- (37) H. Shin, W. Zhu, L. Xu, V. M. Donnelly, and D. J. Economou, Plasma Sources Sci. Technol. 20, 055001 (2011).
- (38) S. Sharma, S. K, Mishra, P. K. Kaw, A. Das, N. Sirse and M. M. Turner, Plasma Sources Sci. Technol., 24, 025037 (2015).
- (39) S. Sharma, N. Sirse and M. M. Turner, Plasma Sources Sci. Technol., 29(11), 114001 (2020).
- (40) S. Sharma, N. Sirse, A Kuley and M. M. Turner, Phys. of Plasmas, 28(10), 103502 (2021).
- (41) K. P. Muller, F. Heinrich, and H. Mader, Microelectron. Eng. 10, 55 (1989).
- (42) M. A. Lieberman and A. J. Lichtenberg, IEEE Trans. Plasma Sci. 19, 189 (1991).
- (43) D. A. W. Hutchinson, M. M. Turner, R. A. Doyle, and M. B. Hopkins, IEEE Trans. Plasma Sci. 23, 636 (1995).
- (44) M. J. Kushner, J. Appl. Phys. 94, 1436 (2003).
- (45) A. V. Vasenkov and M. J. Kushner, J. Appl. Phys. 95, 834 (2004).
- (46) J.-C. Park and B. Kang, IEEE Trans. Plasma Sci. 25, 499 (1997).
- (47) S. J. You, T. T. Hai, M. Park, D. W. Kim, J. H. Kim, D. J. Seong, Y. H. Shin, S. H. Lee, G. Y. Park, J. K. Lee, and H. Y. Chang, Thin Solid Films 519, 6981 (2011).
- (48) S. Yang, Y. Zhang, H. Wang, J. Cui, and W. Jiang, Plasma Processes Polym. 14, 1700087 (2017).
- (49) S. Yang, L. Chang, Y. Zhang, and W. Jiang, Plasma Sources Sci. Technol. 27, 035008 (2018).
- (50) S. Sharma, I. Kaganovich, A. Khrabrov, P. Kaw, and A. Sen, Physics of Plasmas, 25(8), 080704 (2018).
- (51) D. Sydorenko, “Particle-in-cell simulations of electron dynamics in low pressure discharges with magnetic fields,” Ph.D. thesis (University of Saskatchewan, Canada, 2006).
- (52) M. D. Campanell, A. V. Khrabrov, and I. D. Kaganovich, Phys. Plasmas 19, 123513 (2012).
- (53) J. P. Sheehan, N. Hershkowitz, I. D. Kaganovich, H. Wang, Y. Raitses, E. V. Barnat, B. R. Weatherford, and D. Sydorenko, Phys. Rev. Lett. 111, 075002 (2013).
- (54) M. Campanell and H. Wang, Appl. Phys. Lett. 103, 104104 (2013).
- (55) J. Carlsson, A. Khrabrov, I. Kaganovich, T. Sommerer, and D. Keating, Plasma Sources Sci. Technol. 26, 014003 (2017).
- (56) T Charoy, J Boeuf, A Bourdon, JA Carlsson, P Chabert, B Cuenot, D Eremin, L Garrigues, K Hara, ID Kaganovich, AT Powis, A Smolyakov, D Sydorenko, A Tavant, O Vermorel, W Villafana ”2D axial-azimuthal particle-in-cell benchmark for low-temperature partially magnetized plasmas”, Plasma Sources Science and Technology 28(10), 105010 (2019).
- (57) R. Shahid, B. Kallol, and C. Ken, Plasma Sources Sci. Technol. 19, 015014 (2010).
- (58) S. Wilczek, J. Trieschmann, J. Schulze, E. Schuengel, R. P. Brinkmann, A. Derzsi, I. Korolov, Z. Donko, and T. Mussenbrock, Plasma Sources Sci. Technol. 24, 024002 (2015).
- (59) S. Sharma, N. Sirse, P. K. Kaw, M. M. Turner, and A. R. Ellingboe, Phys. Plasmas 23, 110701 (2016).
- (60) Sharma, A. Sen, N. Sirse, M. M. Turner, and A. R. Ellingboe, Phys. Plasmas 25, 080705 (2018).
- (61) S. Sharma, N. Sirse, A. Sen, J. S. Wu, and M. M. Turner, J. Phys. D: Appl. Phys. 52, 365201 (2019).
- (62) P. A. Miller, E. V. Barnat, G. A. Hebner, P. A. Paterson, and J. P. Holland, Plasma Sources Sci. Technol. 15, 889–899 (2006).
- (63) R. R. Upadhyay, I. Sawada, P. L. G. Ventzek, and L. L. Raja, J. Phys. D: Appl. Phys. 46, 472001 (2013).
- (64) S. Sharma, N. Sirse, M. M. Turner, and A. R. Ellingboe, Phys. Plasmas 25, 063501 (2018).
- (65) S. Wilczek, J. Trieschmann, J. Schulze, Z. Donko, R. P. Brinkmann, and T. Mussenbrock, Plasma Sources Sci. Technol. 27, 125010 (2018).
- (66) S. Sharma, N. Sirse, A. Sen, M. M. Turner, and A. R. Ellingboe, Phys. Plasmas 26, 103508 (2019).
- (67) S. Sharma, N. Sirse, A. Kuley, and M. M. Turner, Plasma Sources Sci. Technol. 29, 045003 (2020).
- (68) S. Sharma, N. Sirse, A. Kuley, A. Sen and M. M. Turner, J. Phys. D: Appl. Phys. 54, 055205 (2021).
- (69) E. V. Barnat, P. A. Miller, and A. M. Paterson, Plasma Sources Sci. Technol. 17, 045005 (2008).
- (70) Yu Fan, Ying Zou, Jizhong Sun, Thomas Stirner, and Dezhen Wang, Phys. Plasmas 20, 103507 (2013).
- (71) Patil S, Sharma S, Sengupta S, Sen A and Kaganovich I 2020 An enhanced operating regime for high frequency capacitive discharges (arXiv:2012.02752 )
- (72) Quan-Zhi Zhang, Jing-Yu Sun, Wen-Qi Lu, Julian Schulze, Yu-Qing Guo, and You-Nian Wang, Resonant sheath heating in weakly magnetized capacitively coupled plasmas due to electron-cyclotron motion, Phys. Rev. E 104, 045209 (2021).
- (73) Li Wang, Máte Vass ´, Zoltán Donko´, Peter Hartmann, Aranka Derzsi, Yuan-Hong Song and Julian Schulze, Magnetic attenuation of the self-excitation of the plasma series resonance in low-pressure capacitively coupled discharges, Plasma Sources Sci. Technol. 30 (2021) 10LT01
- (74) C. K. Birdsall, Plasma Physics via Computer Simulation (Adam Hilger, Bristol, 1991).
- (75) R. W. Hockney and J. W. Eastwood, Computer Simulation Using Particles (Adam Hilger, Bristol, 1988).
- (76) R. Shahid and Mark J. Kushner, J. Appl. Phys. 82 2805 (1997).
- (77) Lauro-Taroni, M. M. Turner, and N. StJ Braithwaite, J. Phys. D: Appl. Phys. 37 2216 (2004).
- (78) V. A. Godyak, R. B. Piejak, and B. M. Alexandrovich, Plasma Sources Sci. Technol. 1 36 (1992).
- (79) E. Abdel-Fattah, and H. Sugai, Appl. Phys. Lett. 83 1533 (2003).
- (80) E. Abdel-Fattah, M. Bazavan and H. Sugai, Phys. Plasmas 19 113503 (2012).
- (81) E. Abdel-Fattah, and H. Sugai, Phys. Plasmas 20 023501 (2013).
- (82) V. A. Godyak, and R. B. Piejak, Phys. Rev. Lett. 65 996 (1990).
- (83) I. D. Kaganovich, and L. D Tsendin, IEEE Trans. Plasma Sci. 20 66 (1992).
- (84) I. V. Schweigert, Phys. Rev. Lett. 92 155001 (2004).
- (85) M. A. Lieberman, IEEE Trans. Plasma Sci. 16 638 (1988).
- (86) E. Kawamura, M. A. Lieberman, and A. J. Lichtenberg, Phys. Plasmas 21, 123505 (2014).
- (87) M. M. Turner, Phys. Rev. Lett. 75 1312 (1995).
- (88) M. M. Turner, D. A. W. Hutchinson, R. A. Doyle, and M. B. Hopkins, Phys. Rev. Lett. 76 2069 (1996).
- (89) M. Surendra, and D. B. Graves, Phys. Rev. Lett. 66 1469 (1991).
- (90) M. M. Turner, J. Phys. D: Appl. Phys. R 42 194008 (2009).
- (91) S. Sharma, S. K. Mishra, P. K. Kaw, M. M. Turner and S. K. Karkari, Contributions to Plasma Physics 55 331 (2015).