2 Lund Observatory, Department of Astronomy and Theoretical Physics, Lund University, Box 43, 221 00 Lund, Sweden
3 Institute of Computational Sciences, University of Zurich, Winterthurerstrasse 109, 8057, Zurich, Switzerland
e-mail: Anders.Johansen@sund.ku.dk
Nucleation and growth of iron pebbles
explains the formation of
iron-rich planets akin to Mercury
The pathway to forming the iron-rich planet Mercury remains mysterious. Mercury’s core makes up 70% of the planetary mass, which implies a significant enrichment of iron relative to silicates, while its mantle is strongly depleted in oxidized iron. The high core mass fraction is traditionally ascribed to evaporative loss of silicates, e.g. following a giant impact, but the high abundance of moderately volatile elements in the mantle of Mercury is inconsistent with reaching temperatures much above 1,000 K during its formation. Here we explore the nucleation of solid particles from a gas of solar composition that cools down in the hot inner regions of the protoplanetary disc. The high surface tension of iron causes iron particles to nucleate homogeneously (i.e., not on a more refractory substrate) under very high supersaturation. The low nucleation rates lead to depositional growth of large iron pebbles on a sparse population of nucleated iron nano-particles. Silicates in the form of iron-free MgSiO3 nucleate at similar temperatures but obtain smaller sizes due to the much higher number of nucleated particles. This results in a chemical separation of large iron particles from silicate particles with ten times lower Stokes numbers. We propose that such conditions lead to the formation of iron-rich planetesimals by the streaming instability. In this view, Mercury formed by accretion of iron-rich planetesimals with a sub-solar abundance of highly reduced silicate material. Our results imply that the iron-rich planets known to orbit the Sun and other stars are not required to have experienced mantle-stripping impacts. Instead their formation could be a direct consequence of temperature fluctuations in protoplanetary discs and chemical separation of distinct crystal species through the ensuing nucleation process.
Key Words.:
planets and satellites: formation – planets and satellites: composition – planets and satellites: terrestrial planets – protoplanetary discs1 Introduction
The formation of Mercury from iron-rich planetesimals that were separated physically from their iron-poor counterparts was discussed in Weidenschilling (1978) who proposed that the higher density of iron planetesimals leads to lower orbital decay speeds. However, such aerodynamical separation does not address how iron and silicates became separated into distinct planetesimal populations in the first place. A possible pathway to achieve formation of iron-enhanced planetesimals is that pebbles become increasingly iron-rich as they grow, due to enhanced growth of dust aggregates that have a large fraction of iron compared to silicates (Hubbard, 2014; Kruss & Wurm, 2018, 2020).
The alternative evaporation model requires Mercury to have become thermally processed at ambient protoplanetary disc temperatures above 3,000 K after the formation of the planetary core (Cameron, 1985). One or more giant impacts between Mercury and other planetary bodies could have caused similar temperatures and evaporation rates after the dissipation of the protoplanetary disc (Benz et al., 2007; Chau et al., 2018), but this model is challenged by the subsequent reaccretion of the evaporated silicates (Benz et al., 1988), although the solar wind could reduce the efficiency of the reaccretion (Spalding & Adams, 2020). Gamma-ray spectroscopy by the MESSENGER probe revealed a K/Th ratio in Mercury’s mantle that is indistinguishable from that of Venus, Earth and Mars (Peplowski et al., 2011). Since K is a moderately volatile element with a condensation temperature of around 1,000 K, Mercury could not have experienced temperatures much in excess of this threshold during its formation. This finding is thus in tension with the evaporation model.
The highly reduced mantle of Mercury is arguably as puzzling as its high core mass fraction. The measured fraction of oxidized FeO in the mantle is consistent with (Warell & Blewett, 2004; Vander Kaaden & McCubbin, 2015; Ebel & Stewart, 2018), while Venus, Earth, Mars and Vesta have significant FeO fractions (8%, 8%, 18% and 20%, respectively) in their crusts and mantles (Robinson & Taylor, 2001). Silicate minerals with low FeO contents are expected to condense out under the high pressures prevalent in the inner regions of the solar protoplanetary disc (Kozasa & Hasegawa, 1988). However, maintaining a low-FeO mantle requires additionally that the contribution to Mercury of planetesimals formed in the Venus-Earth-Mars region was negligible. Hence, there must have been very little mixing between the planetesimal populations that formed the terrestrial planets. This requires limited stirring by Jupiter, in strong contrast with models where Jupiter penetrates the terrestrial planet region during its early migration (Walsh et al., 2011). This scenario where Jupiter does not stir the planetesimals in the terrestrial planet zone nevertheless makes it challenging to reach Mars’ current mass in -body simulations (Woo et al., 2022). In the alternative pebble accretion model for terrestrial planet formation (Johansen et al., 2021), the drifting pebbles contain largely reduced iron that is later oxidized by dissolution in hot water within the growing Venus, Earth and Mars (Johansen et al., 2022). These reduced pebbles would, if they contributed significant mass to Mercury, therefore agree with the lack of FeO in the crust of Mercury but their solar Fe/Si value would be inconsistent with Mercury’s bulk composition.
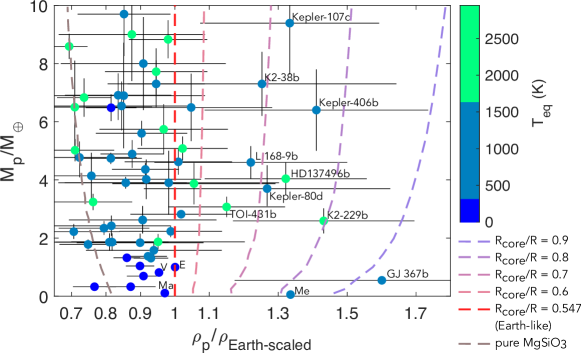
The discovery of exoplanets with similar densities as Mercury makes the problem of Mercury formation even more acute (Santerne et al., 2018). Fig. 1 shows observed super-Mercuries with well-characterized masses and radii; they have masses ranging between 0.5 and 10 . The displayed planets are well-characterized in the sense that they are included in the PlanetS database (Otegi et al., 2020); in addition we show K2-38b and Kepler-406 b, which are discussed in Adibekyan et al. (2021b). In an attempt to explain the high densities and high iron contents of super-Mercuries several mechanisms were suggested (Wurm et al., 2013; Kruss & Wurm, 2018; Rappaport et al., 2012), including collisions (Stewart & Leinhardt, 2012; Clement & Chambers, 2021). In contrast to previous suggestions from impact studies (Marcus et al., 2010), observed super-Mercuries are not limited to masses of 5 . Recent formation studies that incorporate high energy collisions are unable to reproduce the highest density super-Mercuries (Scora et al., 2020). Further, observations indicate that super-Mercuries may be a distinct population from super-Earths with regard to their inferred Fe/(Mg+Si) contents (Adibekyan et al., 2021a). The scarcity of planets between both populations can suggest that giant impacts are unlikely the only cause of forming super-Mercuries. This is because the stochastic nature of collisions should result in a continuous population. However, this scarcity is less clear in the density-mass space and planetary data is too limited to draw a conclusion from this speculation. Overall, it seems plausible to believe that additional mechanisms other than collisions are at play to form iron-enhanced worlds. These mechanisms should be able to form planets at the observed large range of masses and core-radius fractions (Fig. 1).
In this paper we explore how metallic iron separates from iron-free silicates following cooling of a gas of solar composition in the inner regions of the protoplanetary disc. This cooling could be a natural consequence of FU Orionis outbursts in the very innermost regions of the protoplanetary disc (Bell & Lin, 1994; Hartmann & Kenyon, 1996; Hillenbrand & Findeisen, 2015) or other intrinsic long-time-scale variations of the stellar luminosity. The homogeneous nucleation of iron and silicate particles in a cooling medium was first considered by Kozasa & Hasegawa (1987) and Kozasa & Hasegawa (1988) in the context of dust nucleation in stellar outflows and primordial cooling and condensation in the protoplanetary disc. They found that large iron nuggets form when the cooling rate is low. This is due to the high surface tension of iron (Ozawa et al., 2011). The surface tension determines the stability of the growing proto-clusters and high surface tension implies (a) that the molecule has no energetic advantage from nucleating on an existing substrate (i.e., heterogeneous nucleation is suppressed) and (b) that the nucleation rates are low and hence that the rare nano-particles that nucleate from the gas phase will grow to large sizes by direct depositional growth due to the lack of competition from other seeds. We extend the classical description of homogeneous nucleation from Kozasa & Hasegawa (1987) with updated versions of classical nucleation theory that are better calibrated with experiments even at high values of the super-saturation level (Lümmen & Kraska, 2005; Kashchiev, 2006).
The surface tension of silicates is much lower than for iron (Kozasa & Hasegawa, 1987; Zhang et al., 2021) and silicates therefore nucleate at a higher abundance, with correspondingly smaller final sizes. Iron may deposit as oxidized FeO on existing silicate particles for high cooling rates (Kozasa & Hasegawa, 1988), but the lowering of the surface tension by admixture of small amounts of sulfur into the iron causes metallic iron to nucleate at higher temperatures than FeO. We show that the size difference between iron pebbles and silicate pebbles leads to the formation of iron-rich planetesimals by the streaming instability. Mercury and other iron-rich planets could thus be the result of accretion between such iron-rich planetesimals.
Our paper is organized as follows. In Section 2 we describe our theoretical model for homogeneous nucleation of iron and a handful of other species. We show that improved description of classical nucleation theory gives very good fits to experimental data for homogeneous nucleation of iron. In Section 3 we describe our model for the protoplanetary disc that contains a zone with active magnetorotational turbulence in regions where the temperature is above approximately 800 K. We show that the sublimation fronts of Fe and MgSiO3 are located close to each other within the active MRI zone. In Section 4 we present the calculations of the nucleation of several particle sizes and demonstrate how iron pebbles grow much larger than the pebbles made out of pure silicates. In Section 5 we discuss implications for the formation of iron-rich planets as well as shortcomings of the model. We finally conclude with a short summary in Section 6.
2 Nucleation model
The formation of a solid phase directly from the gas phase is referred to as homogeneous nucleation, while formation of the solid phase on an existing substrate is referred to as heterogeneous nucleation (Hoose & Möhler, 2012). We focus first on homogeneous nucleation, since metal and silicate crystal structures with a high surface tension do not benefit energetically from nucleating on a substrate material. Later we demonstrate why heterogeneous nucleation of FeO on existing silicate substrates is likely not a relevant process in protoplanetary discs.
We summarize here briefly the steps to derive the homogeneous nucleation rate in classical nucleation theory (see Kashchiev, 2006, for a more detailed picture). The change in Gibbs free energy by formation of a solid nucleus of size from the gas phase is
| (1) |
Here is the surface tension and is the change in free energy per volume of formation of the solid phase (which has a negative value). Small clusters are highly unstable due to the dominant surface tension. The critical cluster size for stability is found from setting to obtain
| (2) |
The free energy difference can now be expressed through the supersaturation factor as
| (3) |
where is the density of the solid phase and the molecular mass. The nucleation energy barrier can thus be written as
| (4) |
Here is the specific volume per molecule in the solid phase. The rate at which the cluster of the critical size form is proportional to the exponential of the ratio of free energy to particle energy,
| (5) |
with the prefactor (of unit ). For homogeneous nucleation, Kozasa & Hasegawa (1987) use the prefactor
| (6) |
Here is the sticking probability and is the concentration of vapour monomers in the gas.
The prefactor is nevertheless highly model-dependent (see Kashchiev, 2006, for a critical review). To describe experimental results on homogeneous nucleation of iron, Lümmen & Kraska (2005) use a master equation of the form
| (7) |
They determined and from nucleation experiments at 800 K, 900 K and 1,000 K for different (assumed) values of . For and they found and . The latter is consistent with classical nucleation theory, which has a value of -3 (see equation 5), and the value of is also within order unity equal to the classical expression. The comparison between data and theory is much worse for the prefactor scaling . We compare the experimental data of Lümmen & Kraska (2005) to the classical nucleation theory expression in Figure 2 and observe that classical nucleation theory is wrong by many orders of magnitude for both low and high supersaturations.
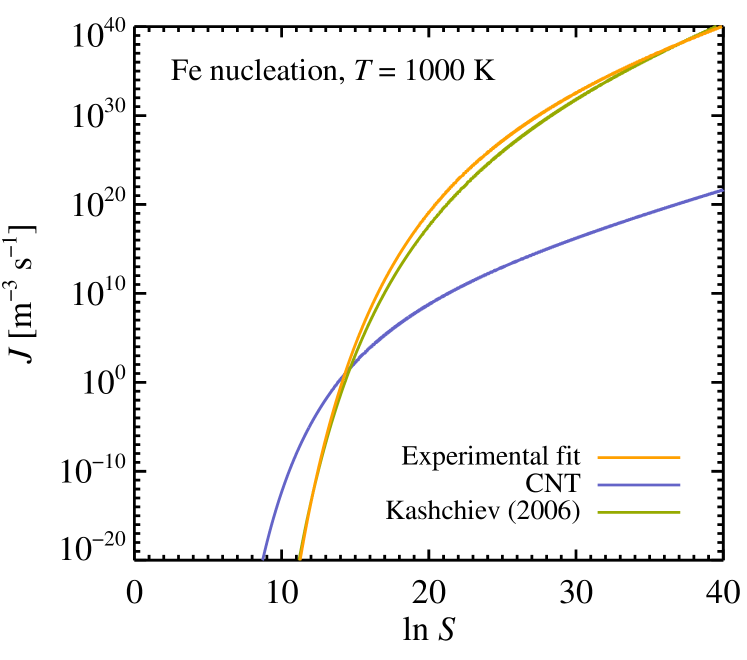
Kashchiev (2006) therefore adopted corrections to classical nucleation theory and arrived at the expression
| (8) |
Here
| (9) |
with denoting the saturated number density . The parameter takes the classical value of
| (10) |
but appears in the Kashchiev (2006) model also in the prefactor. We show in Figure 2 the excellent correspondence between this improved nucleation model and the experimental data on iron nucleation. Here we multiplied in equation (10) by a small factor 2.5 to obtain a better fit; this change in corresponds when propagated to the nucleation rate to a sticking probability of approximately 1% for iron vapour impinging on the growing iron clusters.
Ironically, despite the orders of magnitude wrong prefactor of classical nucleation theory for homogeneous nucleation of iron, the value of the supersaturation where nucleation occurs is not affected very strongly. This can be seen by first taking the logarithm of the generalized prefactor (equation 7),
| (11) |
and then differentiating while holding the nucleation rate, , constant. That yields a connection between variations in the prefactor, , and variations in the supersaturation, , as
| (12) |
Isolating gives
| (13) |
Iron generally nucleates in the limit when . At K, equation (10) yields and hence for . Hence even an error in of will be compensated by a of the order of 1. This relative insensitivity to the prefactor is also evident from Figure 2 where a small shift of the CNT curve along the axis leads to an enormous change in the nucleation rate.
3 Protoplanetary disc model
We consider the heating and cooling of vapour and solids near the sublimation temperatures of the refractory molecules Al2O3 (corundum), MgSiO3 (enstatite111We ignore the major Mg-carrying mineral Mg2SiO4 (forsterite), since it can bind only half of the Si atoms and since its sublimation temperature is very close to that of enstatite for the pressures relevant in the inner regions of the protoplanetary disc.), Fe (iron) and FeO (wüstite). We follow Nozawa et al. (2003), Nozawa et al. (2011) and Woitke et al. (2018) and calculate the supersaturation level from the chemical reaction that forms the relevant mineral. We include the following reactions separately,
| (14) | |||||
| (15) | |||||
| (16) | |||||
| (17) | |||||
| (18) |
As an example, the supersaturation level of Al2O3 (corundum) is calculated from the equilibrium
| (19) | |||||
where Pa is the pressure of the standard state and is the universal gas constant. Here the chemical activity of the mineral phase (Al2O3) is set to zero (Nozawa et al., 2003). The change in Gibbs free energy of this reaction, (per mole), is calculated by subtracting the sum of the Gibbs free energies of the reactants from the sum of the Gibbs free energies of the products (including the solid mineral), following the parametrizations presented in Sharp & Huebner (1990). This chemical reaction solution to the formation of a mineral phase corresponds to a saturated vapour pressure approach only when the mineral formation does not involve a chemical reaction with another species, as is the case above for Fe. Using a saturated vapour pressure approach to the more complex minerals on our list would only give an approximate estimate of the equilibrium temperature (van Lieshout et al., 2014; Aguichine et al., 2020).
We consider the inner regions of the protoplanetary disc and construct the temperature () and surface density () profiles as function of the distance using an assumed constant gas accretion rate through the disc and onto the star of mass and luminosity . The temperature is taken as the maximum of the irradiative temperature (Ida et al., 2016),
| (20) |
and the viscous temperature . The latter is found from the balance between viscous heating and black body cooling at the disc surface (Bell & Lin, 1994),
| (21) |
Here is the effective cooling temperature at the disc surface. We take into account that a part of the mass accretion rate will not lead to heating, if the angular momentum is transported by large-scale disc winds (Mori et al., 2021). Hence , with representing the total angular transport and representing the local turbulence, gives the fraction of mass transported via turbulence and hence leading to heating.
The effective temperature is connected to the mid-plane temperature through radiative balance
| (22) |
Here is the opacity. The opacity is found by calculating the mass fraction in solids from the saturated vapour densities as
| (23) |
We then add up the opacity power laws from Bell & Lin (1994) for water ice, “metals” (iron, enstatite and corundum) and gas, with each component multiplied by its relative depletion factor due to thermal desorption.
We assume that the turbulent diffusion varies from in the dead zone to where the magnetorotational instability is active, following the profile
| (24) | |||||
We use K (Desch & Turner, 2015) and K (which gives a good match to the turbulence profile in the inner regions of the protoplanetary disc, see Flock et al., 2017).
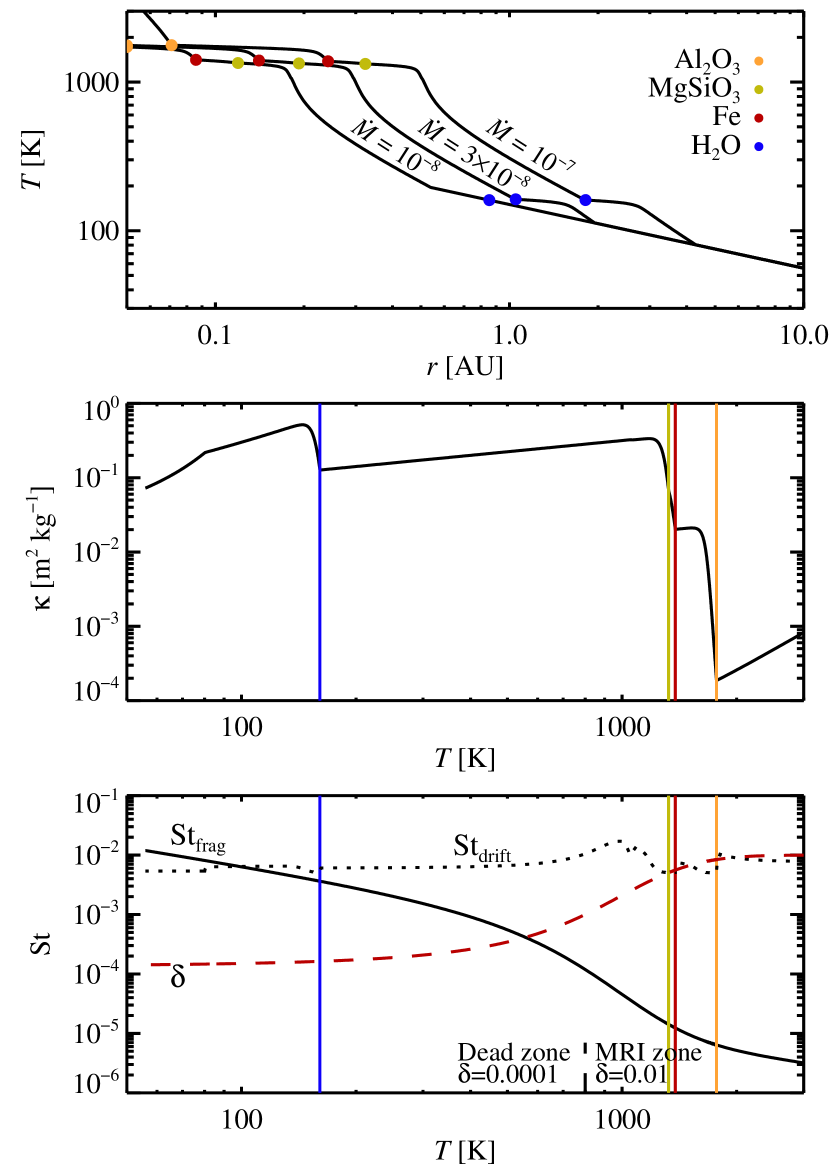
We solve the structure equations iteratively to find and . The resulting temperature profile is shown in Figure 3 for three different values of the mass accretion rate onto the star. The sublimation fronts of iron and enstatite are very close together and evolve from 0.2–0.3 AU at high accretion rates to 0.1 AU for the lower accretion rates characteristic of later disc phases.

The fragmentation-limited Stokes number is calculated from (Birnstiel et al., 2012)
| (25) |
where m/s is the fragmentation threshold speed (Güttler et al., 2010) and is the isothermal sound speed of the gas defined as with representing the mean molecular weight of a solar mixture of H2 and He. Here the dimensionless Stokes number is defined as
| (26) |
where is the particle radius, is the internal density and is the gas surface density. This definition of the Stokes number is valid in the Epstein regime when the particle size is much smaller than the mean free path of the gas (Weidenschilling, 1977). The particles drift towards the star with the speed
| (27) |
This expression is valid for (Weidenschilling, 1977; Johansen et al., 2019). Here the gas speed is given by (Pringle, 1981)
| (28) |
For very low Stokes numbers, , the particles are primarily transported by gas advection. We define the Stokes number where the radial drift speed is as high as the gas advection speed from .
Figure 3 shows that at temperatures below the ice sublimation temperature, the fragmentation limited Stokes number is large enough that particles drift faster than the gas. In that case the pebble-to-gas flux ratio can become higher than the nominal value of (Ida et al., 2016; Johansen & Bitsch, 2019). Here is defined as the ratio of the radial pebble flux to the radial gas flux,
| (29) |
Knowing , we can reconstruct the local metallicity from the relationship
| (30) |
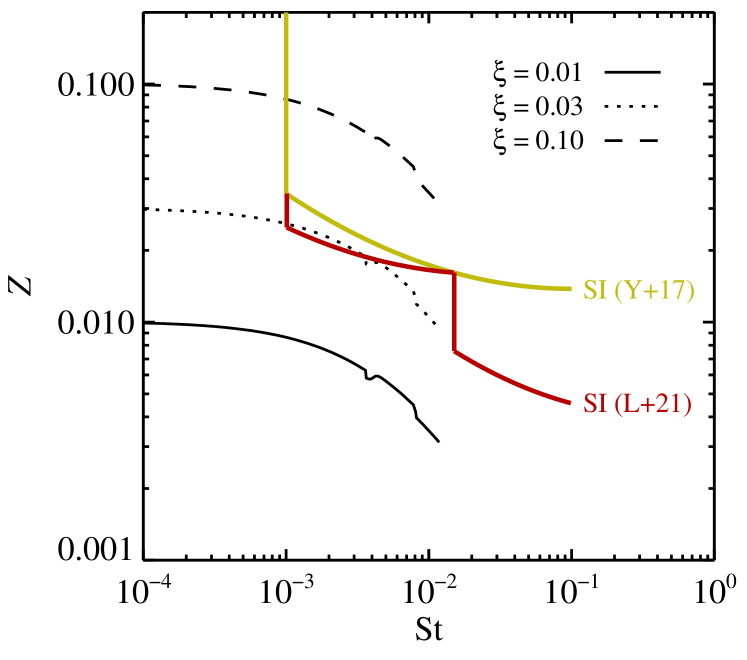
We show the metallicity profile for three different values of in Figure 4. In the inner regions of the protoplanetary disc, where the Stokes number is low and , we recover . Further out, drops. We also show in Figure 4 the threshold metallicity for planetesimal formation by the streaming instability. It is clear that very high pebble-to-gas flux ratios, of , are needed to trigger the streaming instability for Stokes numbers in the range between and , which may be achievable by fragmentation-limited growth in the dead zone of the protoplanetary disc. The much lower Stokes number in the MRI zone are not prone to planetesimal formation by the streaming instability for any values of .. Larger particle sizes are needed to form planetesimals in the region where Mercury formed – and we propose here that these particles form by nucleation and depositional growth.
4 Cooling, nucleation and phase separation
Young stars undergo periodic outbursts where luminosities may reach and mass accretion rates onto the star are as high as (Hartmann & Kenyon, 1996). These outbursts are likely related to a thermal instability that affects the very innermost regions of the disc where the effective temperature of the disc is higher than K. Bell & Lin (1994) estimated that the ionization front, which separates the outburst region of the protoplanetary disc from the quiescent part, will move out as far as 0.1 AU from the star. This means that regions of iron and silicate sublimation are not directly involved in the outbursts. However, the strong irradiative heating at the outburst luminosity will, during the outburst, affect even the Mercury formation region, with the outburst temperature reaching
| (31) |
These FU Ori outbursts decay on time-scale of decades or even centuries (Hartmann & Kenyon, 1996). Other models that rely on the triggering of MRI turbulence and gravitational instability have FU Orionis outbursts extended out to 0.5 AU or more (Zhu et al., 2007, 2009; Hillenbrand & Findeisen, 2015; Pignatale et al., 2018). In that case, the nucleation of refractory dust can also take place due to the decrease in mass accretion rate and local viscous heating as the outburst declines.
The cooling rate of an outburst can be connected to the decay time-scale as
| (32) | |||||
Hence realistic cooling rates in the Mercury-formation zone lie in the range of .
We calculate the nucleation of particles at AU, the approximate current location of Mercury, as a function of the cooling rate . The nucleation rate is calculated from equation (8). Nucleated particles grow at the rate determined by the flux of the constituent vapour species with the lowest impact frequency, the so-called key vapour species (Nozawa et al., 2003), according to the equation
| (33) |
where is the speed of the key vapour species perpendicular to the surface, is the number density of the key vapour species, and are the density and molecular weight of the solid phase, is the sticking probability and is a correction factor for large grains whose growth is limited by the diffusion coefficient (Libbrecht, 2005). We set the sticking coefficient of Fe vapour onto the Fe solid phase to be unity due to the highly super-saturated vapor deposition (Tachibana et al., 2011). We set the sticking coefficient to 0.1 for all other species due to kinetic hindrance of evaporation and condensation (Takigawa et al., 2009; van Lieshout et al., 2014).
Following Kozasa & Hasegawa (1988) we include the species Al2O3, MgSiO3, Fe, Fe+S and FeO. We added here Fe+S to our list in order to probe the effect of sulfur on the nucleation rate of iron, since dissolved sulfur lowers the surface tension of iron (Kozasa & Hasegawa, 1988) and hence increases the nucleation temperature to closer to the equilibrium temperature. FeO plays the additional role to probe whether iron nucleates at higher or lower temperatures than the equilibrium temperature of FeO over a silicate surface (which would mix iron and silicates).
The surface tension is a key parameter that determines the outcome of nucleation through equations (8) and (9). We use nominal values from Kozasa & Hasegawa (1987) and Kozasa & Hasegawa (1988) of for corundum, for enstatite, for iron and for FeO. The effect of sulfur in reducing the surface tension of iron is a strongly declining function of temperature. As we show below, this surface tension reduction is key to prevent heterogeneous nucleation of iron oxide (FeO) on existing enstatite substrates. We assume that the presence of S in the Fe crystals lowers the surface tension of Fe+S to , which we read off from Figure 2 of Kozasa & Hasegawa (1988) at a temperature of approximately 1150 K. The strong temperature dependence of the sulfur activity implies that any difference in the stellar S/Fe ratio relative to the solar value is likely not significant when calculating the surface tension.
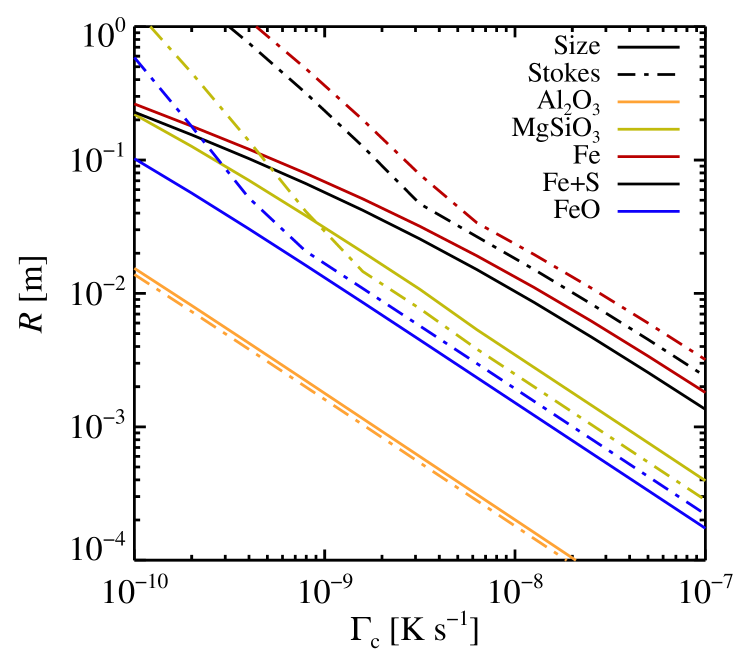
The resulting particle sizes and Stokes numbers are shown in Figure 5. We take into account here that large particles enter the Stokes drag force regime where the Stokes number St scales quadratically with the particle size (Weidenschilling, 1977). There is a general development towards larger particle sizes for lower cooling rate. This is due to the increased time for condensation onto rare nuclei when the cooling rate is low. Higher cooling rates lead to the nucleation of many more nano-particles and hence the resulting particle size becomes smaller. The largest particles are Fe (and Fe+S) due to the very high surface tension, and hence limited nucleation, of iron. These iron particles are generally five times larger than silicate particles (MgSiO3) and have ten times higher Stokes number.
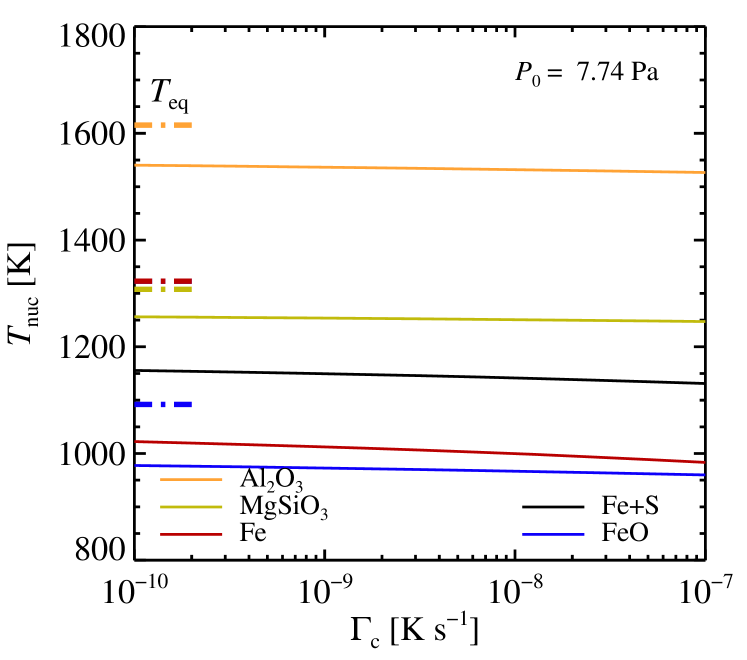
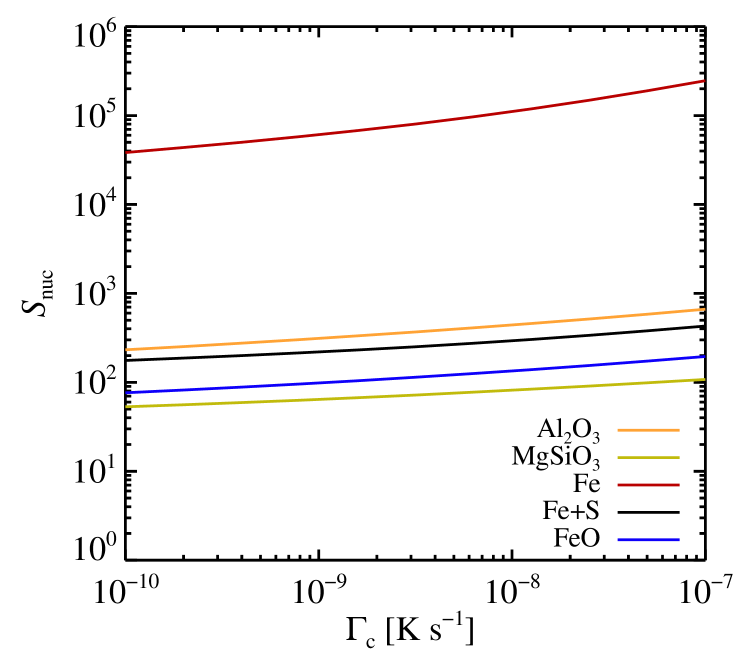
The nucleation temperatures and supersaturation levels at the maximum nucleation are shown in Figure 6. The main nucleation occurs several hundred Kelvin below the formal equilibrium temperatures; this is true for all species. Iron has so poor nucleation properties that the nucleation temperature is even below the equilibrium temperature of FeO. Hence iron atoms would instead deposit as FeO onto existing silicates. However, inclusion of sulfur in the iron (Fe+S) decreases the surface tension enough that Fe+S can nucleate before FeO and hence prevent the iron from getting oxidized.
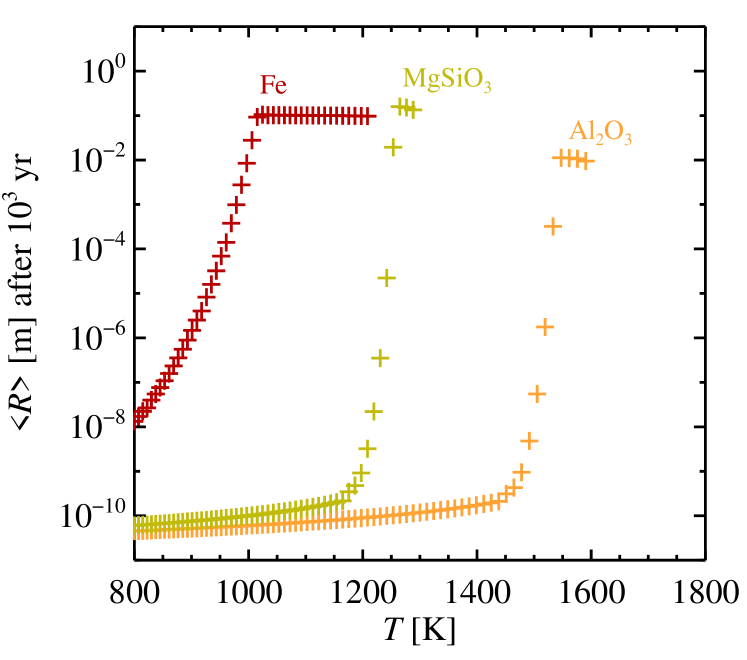
We perform an additional numerical experiment where we instantaneously lower the temperature from 2,000 K to a (fixed) target temperature and let the particles nucleate and grow at a constant temperature. The resulting particle sizes are shown in Figure 7. At large temperatures, nucleation is so inefficient that the rare nuclei can grow to meter sizes by direct vapour deposition. This is nevertheless a very inefficient process as not all the vapour will be transferred to the solid phase even in the yr integration of the experiment. At lower temperatures, vapour deposition leads to smaller particles, but the efficiency over yr is here 100% (i.e., all the vapour is deposited onto the particles). As the temperature is pushed 100 K or more below this transition to efficient deposition, the nucleation becomes so efficient that all vapour resides in nano-meter-scale particles.
5 Discussion
5.1 Formation of iron-rich planetesimals
The density and gravity field of Mercury yield a bulk composition of between 60% and 70% iron (Hauck et al., 2013). This is approximately twice the iron-to-rock ratio of the solar composition (Lodders, 2003). The highly reduced mantle of Mercury furthermore implies that the planet could have incorporated a significant fraction of Si into the metallic melt during core formation (Nittler et al., 2018), but this does not change the overall picture that Mercury has an enlarged iron fraction relative to the other terrestrial planets.
We consider now the implications of our dust nucleation model for planetesimal formation by the streaming instability. The pebbles with the highest Stokes numbers are known to drive filament formation by the streaming instability when considering a size distribution of the pebbles (Bai & Stone, 2010; Schaffer et al., 2018, 2021). The size distribution of the pebbles entering the planetesimals that condense out of the filament is nevertheless relatively unexplored. We define here a “filtering function” that describes the amount of pebbles of a certain Stokes number that enter a planetesimal divided by the total number of pebbles of that Stokes number,
| (34) |
Here is the highest Stokes number in the size distribution. Thus the differential of the cumulative mass distribution (i.e., the fraction of mass present in pebbles with Stokes number larger than St) in the planetesimal becomes
| (35) |
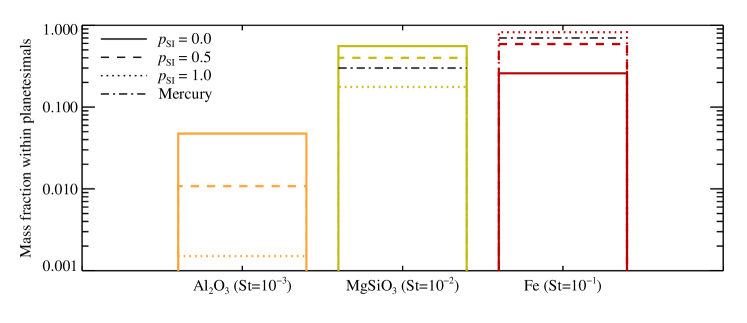
From the results of Johansen et al. (2007) we estimate for the two Stokes number bins with and ; the bins with even higher Stokes numbers contribute to the planetesimals relatively evenly but this may reflect that such large pebbles are already quite decoupled from the gas. From the non-stratified simulations of Yang & Zhu (2021) we find instead a steeper in the densest clumps when considering Stokes numbers in the range between and that are more relevant for our nucleation model. We show in Figure 8 how values of between 0.5 and 1.0 match Mercury well when there is a factor ten difference in Stokes number between iron and enstatite pebbles. Mercury’s crust also appears to have an enriched Al/Si ratio relative to the moon (Peplowski et al., 2012); this could indicate either an affinity with enstatite chondrites (which are rich in Si) or a limited accretion of Al-carrying minerals such as corundum (Al2O3).
5.2 Formation of Mercury analogues and super-Mercuries
The formation of iron-rich planetesimals will be followed by growth of protoplanets through planetesimal accretion and pebble accretion. The growth will initially take place in the MRI-active zone of the protoplanetary disc and therefore excitation of the orbits of the protoplanets by turbulent density fluctuations must be take into account. The eccentricity induced by the turbulent fluctuations in balance with gas drag is (Ida et al., 2008; Johansen & Bitsch, 2019)
| (36) | |||||
Here is a measure of the strength of the turbulent density fluctuations and we assume as in Ida et al. (2008). The parameter describes the gas density relative to the minimum mass solar nebula. We scaled the equations to the radius and orbit of Mercury. Tidal damping is relevant for large protoplanets and planets. Ida et al. (2008) give the equilibrium eccentricity between turbulent density fluctuations and tidal damping as
| (37) | |||||
Mercury’s current eccentricity of 0.2 is therefore hard to excite by realistic values for the turbulent stirring and likely reflects later perturbations by Jupiter (Roig et al., 2016). As the MRI-zone retreats with time and the protoplanets enter the dead zone, the eccentricity is reduced by 1-2 orders of magnitude and pebble accretion becomes the main growth mode.
Mercury must have avoided a phase of rapid pebble accretion in order to have maintained its low mass and to prevent dilution of its iron-rich composition with drifting pebbles of solar Fe/Si ratio. It is possible that the inner regions of the protoplanetary disc were already dissipated away by disc winds when the MRI zone retreated to interior of Mercury’s orbit (Ogihara et al., 2017). Alternatively, the inner disc edge had expanded outwards across Mercury’s orbit when the temperature became cold enough for pebble accretion to be efficient (Liu et al., 2017). The oblateness of the young Sun could also have increased Mercury’s inclination to its current value if the Sun had a high primordial rotation rate (Ward et al., 1976) and thus suppressed pebble accretion.
5.3 Growth of planetesimals
We make here a simple calculation of the growth from planetesimal to protoplanet via planetesimal accretion. The growth equation includes gravitational focusing,
| (38) |
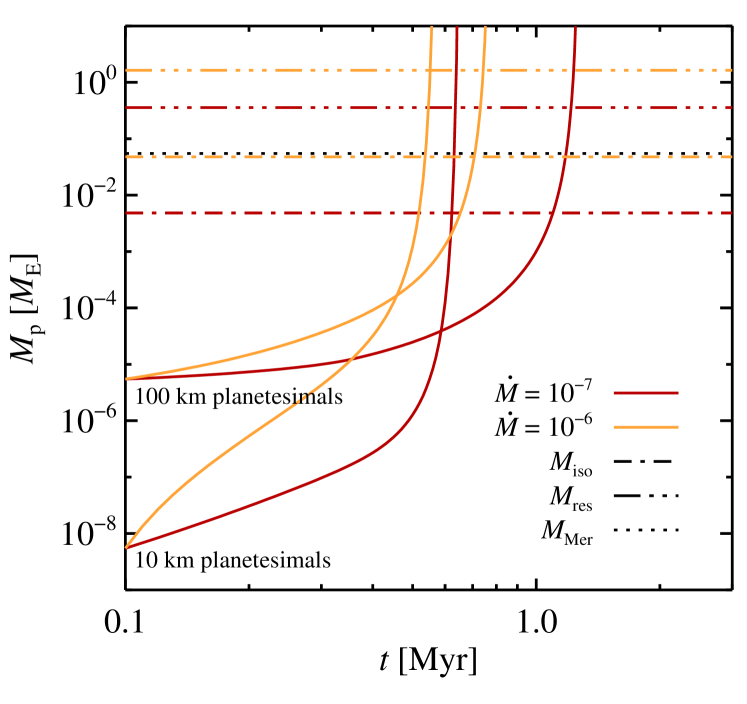
Here is the surface density of planetesimals, assumed to be 0.01 times the surface density of gas when the planetesimals form. We set the planetesimal speed where is set by the balance between turbulent stirring and gas drag on planetesimals (equation 36). We adopt a viscous protoplanetary disc model where the gas accretion rate falls with time (see Johansen et al., 2019, for details). The resulting mass growth is shown in Figure 9 for two different values for the planetesimal radius (100 km and 10 km) and two different values for the gas accretion rate when the planetesimals form ( and ). A planet with the mass of Mercury can form by accretion of iron-rich planetesimals within 1 Myr under all circumstances. For at the planetesimal formation stage, the planetesimal isolation mass is, intriguingly, very similar to Mercury’s mass. A lower surface density of planetesimals, as exemplified here by the calculations using , has isolation masses ten times lower than Mercury’s mass and would require an additional giant impact stage to read the full mass of Mercury.
The reservoir of iron-rich planetesimals that form at each heating event in the protoplanetary disc can be assessed from the expression
| (39) |
where is the planetesimal column density and is the width of the zone where iron planetesimals form. We calculate from the gas surface density evaluated from the stellar mass accretion rate through (here is the turbulent viscosity). Taking we get for and for . Thus, Mercury could form from the mass reservoir of a single planetesimal formation event, while super-Mercuries in the mass range 5–10 would need to accumulate planetesimals from several protoplanetary disc heating events at the earliest stages of protoplanetary disc evolution where the stellar mass accretion rate is high. Very young stars are estimated to undergo FU-Orionis-like outbursts (Hillenbrand & Findeisen, 2015) and this yields a mass budget that allows the formation of super-Mercuries by accretion of iron planetesimals.
5.4 Latent heat
We ignored the latent heat release during the vapour deposition. The ratio of the heating by latent heat release to the cooling by radiation is
| (40) |
Here is the latent heat, is the vapour density and is the speed at which iron vapour impinges onto the surface of a growing particles. For iron with MJ/kg, K, m/s and kg/m3 we get that latent heat contributes 0.1%-1% of the heat relative to the cooling. Therefore latent heat is safely negligible.
5.5 Calcium-aluminium rich planets
Dorn et al. (2019) suggest the presence of close-in super-Earths that are enhanced in CAI material (ultrarefractory calcium-aluminium rich minerals, represented in our model by the corundum mineral) and depleted in iron (e.g., 55 Cnc e, WASP-47 e). These planets have characteristically lower densities (by 10-20%) than the majority of super-Earths. It remains unclear how to obtain reservoirs in the proto-planetary disc that allow to form CAI-rich planets of several . Previous formation models that employed N-body simulations in combination with equilibrium chemistry models achieve the formation of up to 1 or 3 (Carter-Bond et al., 2012; Thiabaud et al., 2014).
Our protoplanetary disc model (Figure 3) has a separation of approximately 0.3 AU between the iron sublimation front at an ambient temperature of 1300 K and the corundum destruction front at a temperature of approximately 1600 K. If planetesimals form in this region, then they would be rich in elements present in refractory minerals (such as Al and Ca). Several tens of Earth masses ultrarefractory material will flow through this “CAI region” of the protoplanetary disc and onto the star during the early phases of protoplanetary disc evolution when the stellar accretion rate is high.
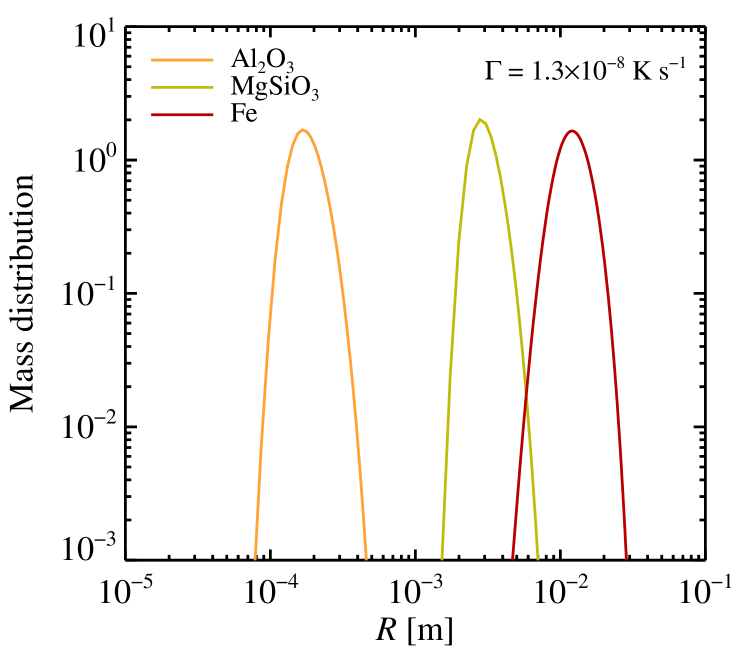
The low abundance of Al relative to Fe, Mg and Si (solar Al:Si=0.084) gives very low condensational growth rates of corundum and these minerals grow at most to a few 100 microns in size (or ) in our model, see Figure 2. Calcium-Aluminium Rich Inclusions (CAI) found in meteorites are up to several cm in size (Krot et al., 2004; Toppani et al., 2006). These large CAI nevertheless often display characteristics of melting (Charnoz et al., 2015), which may hide their accretional history. More primitive CAI appear to be aggregates of nodules of 10–50 microns in size (Krot et al., 2004). Thus CAI aggregates large enough to drive formation of ultrarefractory planetesimals might be achieved in our model by coagulation of microscopic CAI-lets that formed by nucleation and slow condensation. The efficiency of this growth within the MRI-unstable region of the protoplanetary disc would nevertheless require a better understanding of how such ultrarefractory minerals stick under high collisions speeds.
The pebble accretion efficiency (defined as the rate of pebble accretion onto a planet divided by the flux of pebbles through the protoplanetary disc) increases with both decreasing distance from the star as well as with decreasing Stokes number (Lambrechts & Johansen, 2014). Ultrarefractory planets would therefore also experience significant pebble accretion rates. We nevertheless caution that both planetesimal formation and pebble accretion in strongly turbulent regions of the protoplanetary discs are poorly understood (Johansen et al., 2007; Xu et al., 2017; Gole et al., 2020). Our nucleation models can be used in future work using -body simulations to evaluate planetary growth in the innermost regions of protoplanetary discs.
5.6 Ultrarefractory metal seeds
We have ignored the possibility that rare ultrarefractory metal grains (made e.g. out of O) could act as substrates for heterogeneous nucleation of iron. Kozasa & Hasegawa (1988) investigated this possibility and included that Os has a very high surface tension and hence will nucleate after Fe, unless the cooling time is very long. The abundance of Os is anyway very low and even if it condenses first, it will likely form few and very small grains only. That would still lead to formation of large metal pebbles.
5.7 Validity of Classical Nucleation Theory
Donn & Nuth (1985) criticized the application of CNT to the low-density, high-temperature environment in AGB stars. The CNT approach requires that the collision time-scale is much shorter than the time-scale for changing the super saturation. Nozawa & Kozasa (2013) compared CNT with non-steady models and found that CNT is valid when the collision frequency of atoms on a cluster is much higher than the rate of change of the supersaturation. These conditions are safely fulfilled in the dense protoplanetary disc environment.
Kimura et al. (2017) reported an extremely low sticking efficiency () for homogeneous nucleation of iron from the vapour phase in micro-gravity experiments. Various explanations for the difference between these experiments and ground-based experiments showing much higher sticking efficiencies are discussed in Kimura et al. (2017). As we discussed in Section 2, we already effectively assumed a sticking efficiency of to match the Kashchiev (2006) model to the experimental nucleation data. We simply note here that the sticking efficiency for the homogeneous nucleation of a wide range of minerals under micro-gravity conditions would be needed to assess the outcome of these experiments on the nucleation competition between the different minerals.
6 Conclusions
We have explored in this paper the homogeneous nucleation of iron and other refractory minerals following a protoplanetary disc heating event (such as an FU Orionis outburst). Perhaps the most surprising outcome of our calculations is that all these minerals nucleate at very high supersaturation levels. Metal and rock have high surface tension and the minerals therefore do not benefit from heterogeneous nucleation on existing surfaces. Homogeneous nucleation directly from the gas phase requires extreme values of the supersaturation to overcome the high surface tension of small clusters to grow to stable, nucleated particles. Iron has the largest surface tension of the minerals considered here (Al2O3, MgSiO3, Fe, Fe+S and FeO) and nucleates at supersaturation levels up to above .
The difficulty in nucleating new iron particles directly implies that iron pebbles grow to very large sizes, up to a few cm at low cooling rates. This large growth is due to the scarcity of nucleated nano-scale particles. The lucky particles that do nucleate are therefore exposed to a large reservoir of iron vapour to drive further growth to macroscopic pebbles. We have used enstatite (MgSiO3) to represent rock-forming minerals. Enstatite nucleates at lower supersaturation levels than iron and therefore the pebbles grow to sizes that are a factor few smaller than the iron pebbles. Combined with the intrinsic material density difference, this gives a factor ten difference in Stokes number between iron and enstatite pebbles.
We propose that this mechanism is at the heart of the curious composition of Mercury. Planetesimals formed by the streaming instability preferably incorporate pebbles with the largest Stokes number from the background size distribution. These planetesimals therefore become iron-rich. We demonstrate that accretion of iron-rich planetesimals leads to the formation of Mercury-mass planets within a million years. The mass reservoir is large enough to form iron-rich super-Earths if the protoplanetary disc undergoes several FU Orionis outbursts during the earliest phases of protoplanetary disc evolution. The iron-rich planetesimals will also contain a minor fraction of silicates. Importantly, these silicates will be very reduced (poor in oxidized FeO) because of the separation of Fe on one side and MgO/SiO2 minerals on the other side by the nucleation process. This may explain why Mercury’s mantle has the lowest FeO fraction of all rocky bodies in the inner Solar System (Warell & Blewett, 2004).
A growing number of exoplanets are known now to have a density similar to Mercury’s and covering a large range of masses up to 5–10 . Their high density could arguably be a consequence of mantle stripping in giant impacts, as has traditionally been used to explain Mercury’s high core fraction. Our model, in contrast, implies that the formation of this class of iron-rich and highly reduced planets is a direct consequence of luminosity variations of very young stars and a nucleation process that separates iron from silicates.
Acknowledgements.
The authors would like to thank the anonymous referee for many valuable comments that helped improve the manuscript. A.J. acknowledges funding from the European Research Foundation (ERC Consolidator Grant 724687-PLANETESYS), the Knut and Alice Wallenberg Foundation (Wallenberg Scholar Grant 2019.0442), the Swedish Research Council (Project Grant 2018-04867), the Danish National Research Foundation (DNRF Chair Grant DNRF159) and the Göran Gustafsson Foundation. C.D. acknowledges support from the Swiss National Science Foundation under grant PZ00P2_174028.References
- Adibekyan et al. (2021a) Adibekyan, V., Dorn, C., Sousa, S. G., et al. 2021a, Science, 374, 330. doi:10.1126/science.abg8794
- Adibekyan et al. (2021b) Adibekyan, V., Santos, N. C., Dorn, C., et al. 2021b, Communications of the Byurakan Astrophysical Observatory, 68, 447. doi:10.52526/25792776-2021.68.2-447
- Aguichine et al. (2020) Aguichine, A., Mousis, O., Devouard, B., et al. 2020, ApJ, 901, 97. doi:10.3847/1538-4357/abaf47
- Bai & Stone (2010) Bai, X.-N. & Stone, J. M. 2010, ApJ, 722, 1437. doi:10.1088/0004-637X/722/2/1437
- Bell & Lin (1994) Bell, K. R. & Lin, D. N. C. 1994, ApJ, 427, 987. doi:10.1086/174206
- Benz et al. (1988) Benz, W., Slattery, W. L., & Cameron, A. G. W. 1988, Icarus, 74, 516. doi:10.1016/0019-1035(88)90118-2
- Benz et al. (2007) Benz, W., Anic, A., Horner, J., et al. 2007, Space Sci. Rev., 132, 189. doi:10.1007/s11214-007-9284-1
- Birnstiel et al. (2012) Birnstiel, T., Klahr, H., & Ercolano, B. 2012, A&A, 539, A148. doi:10.1051/0004-6361/201118136
- Cameron (1985) Cameron, A. G. W. 1985, Icarus, 64, 285. doi:10.1016/0019-1035(85)90091-0
- Carter-Bond et al. (2012) Carter-Bond, J. C., O’Brien, D. P., Delgado Mena, E., et al. 2012, ApJ, 747, L2. doi:10.1088/2041-8205/747/1/L2
- Chau et al. (2018) Chau, A., Reinhardt, C., Helled, R., et al. 2018, ApJ, 865, 35. doi:10.3847/1538-4357/aad8b0
- Charnoz et al. (2015) Charnoz, S., Aléon, J., Chaumard, N., et al. 2015, Icarus, 252, 440
- Clement & Chambers (2021) Clement, M. S. & Chambers, J. E. 2021, AJ, 162, 3. doi:10.3847/1538-3881/abfb6c
- Desch & Turner (2015) Desch, S. J. & Turner, N. J. 2015, ApJ, 811, 156
- Donn & Nuth (1985) Donn, B. & Nuth, J. A. 1985, ApJ, 288, 187. doi:10.1086/162779
- Dorn et al. (2019) Dorn, C., Harrison, J. H. D., Bonsor, A., et al. 2019, MNRAS, 484, 712. doi:10.1093/mnras/sty3435
- Ebel & Stewart (2018) Ebel, D. S. & Stewart, S. T. 2018, Mercury. The View after MESSENGER, 497. doi:10.1017/9781316650684.019
- Flock et al. (2017) Flock, M., Fromang, S., Turner, N. J., et al. 2017, ApJ, 835, 230. doi:10.3847/1538-4357/835/2/230
- Gole et al. (2020) Gole, D. A., Simon, J. B., Li, R., et al. 2020, ApJ, 904, 132. doi:10.3847/1538-4357/abc334
- Güttler et al. (2010) Güttler, C., Blum, J., Zsom, A., et al. 2010, A&A, 513, A56. doi:10.1051/0004-6361/200912852
- Hartmann & Kenyon (1996) Hartmann, L. & Kenyon, S. J. 1996, ARA&A, 34, 207
- Hauck et al. (2013) Hauck, S. A., Margot, J.-L., Solomon, S. C., et al. 2013, Journal of Geophysical Research (Planets), 118, 1204. doi:10.1002/jgre.20091
- Hillenbrand & Findeisen (2015) Hillenbrand, L. A. & Findeisen, K. P. 2015, ApJ, 808, 68. doi:10.1088/0004-637X/808/1/68
- Hoose & Möhler (2012) Hoose, C. & Möhler, O. 2012, Atmospheric Chemistry & Physics, 12, 9817
- Hubbard (2014) Hubbard, A. 2014, Icarus, 241, 329. doi:10.1016/j.icarus.2014.06.032
- Ida et al. (2008) Ida, S., Guillot, T., & Morbidelli, A. 2008, ApJ, 686, 1292. doi:10.1086/591903
- Ida et al. (2016) Ida, S., Guillot, T., & Morbidelli, A. 2016, A&A, 591, A72
- Johansen et al. (2007) Johansen, A., Oishi, J. S., Mac Low, M.-M., et al. 2007, Nature, 448, 1022. doi:10.1038/nature06086
- Johansen & Bitsch (2019) Johansen, A. & Bitsch, B. 2019, A&A, 631, A70. doi:10.1051/0004-6361/201936351
- Johansen et al. (2019) Johansen, A., Ida, S., & Brasser, R. 2019, A&A, 622, A202. doi:10.1051/0004-6361/201834071
- Johansen et al. (2021) Johansen, A., Ronnet, T., Bizzarro, M., et al. 2021, Science Advances, 7, eabc0444. doi:10.1126/sciadv.abc0444
- Johansen et al. (2022) Johansen, A., Ronnet, T., Schiller, M., et al. 2022, A&A, submitted
- Kashchiev (2006) Kashchiev, D. 2006, J. Chem. Phys., 125, 044505
- Kimura et al. (2017) Kimura, Y., Tanaka, K. K., Nozawa, T., et al. 2017, Science Advances, 3, e1601992. doi:10.1126/sciadv.1601992
- Kozasa & Hasegawa (1987) Kozasa, T. & Hasegawa, H. 1987, Progress of Theoretical Physics, 77, 1402
- Kozasa & Hasegawa (1988) Kozasa, T. & Hasegawa, H. 1988, Icarus, 73, 180
- Krot et al. (2004) Krot, A. N., MacPherson, G. J., Ulyanov, A. A., et al. 2004, Meteoritics & Planetary Science, 39, 1517
- Kruss & Wurm (2018) Kruss, M. & Wurm, G. 2018, ApJ, 869, 45. doi:10.3847/1538-4357/aaec78
- Kruss & Wurm (2020) Kruss, M. & Wurm, G. 2020, The Planetary Science Journal, 1, 23. doi:10.3847/PSJ/ab93c4
- Lambrechts & Johansen (2014) Lambrechts, M. & Johansen, A. 2014, A&A, 572, A107. doi:10.1051/0004-6361/201424343
- Li & Youdin (2021) Li, R. & Youdin, A. N. 2021, ApJ, 919, 107. doi:10.3847/1538-4357/ac0e9f
- Libbrecht (2005) Libbrecht, K. G. 2005, Reports on Progress in Physics, 68, 855
- Liu et al. (2017) Liu, B., Ormel, C. W., & Lin, D. N. C. 2017, A&A, 601, A15. doi:10.1051/0004-6361/201630017
- Lodders (2003) Lodders, K. 2003, ApJ, 591, 1220. doi:10.1086/375492
- Lümmen & Kraska (2005) Lümmen, N. & Kraska, T. 2005, Journal of Aerosol Science, 36, 1409
- Marcus et al. (2010) Marcus, R. A., Sasselov, D., Hernquist, L., et al. 2010, ApJ, 712, L73. doi:10.1088/2041-8205/712/1/L73
- Mori et al. (2021) Mori, S., Okuzumi, S., Kunitomo, M., et al. 2021, ApJ, 916, 72. doi:10.3847/1538-4357/ac06a9
- Nittler et al. (2018) Nittler, L. R., Chabot, N. L., Grove, T. L., et al. 2018, Mercury. The View after MESSENGER, 30. doi:10.1017/9781316650684.003
- Nozawa et al. (2003) Nozawa, T., Kozasa, T., Umeda, H., et al. 2003, ApJ, 598, 785. doi:10.1086/379011
- Nozawa et al. (2011) Nozawa, T., Maeda, K., Kozasa, T., et al. 2011, ApJ, 736, 45
- Nozawa & Kozasa (2013) Nozawa, T. & Kozasa, T. 2013, ApJ, 776, 24
- Ogihara et al. (2017) Ogihara, M., Kokubo, E., Suzuki, T. K., et al. 2017, A&A, 608, A74. doi:10.1051/0004-6361/201730777
- Otegi et al. (2020) Otegi, J. F., Bouchy, F., & Helled, R. 2020, A&A, 634, A43. doi:10.1051/0004-6361/201936482
- Ozawa et al. (2011) Ozawa, S., Takahashi, S., Fukuyama, H., et al. 2011, Journal of Physics Conference Series, 327, 012020
- Peplowski et al. (2011) Peplowski, P. N., Evans, L. G., Hauck, S. A., et al. 2011, Science, 333, 1850. doi:10.1126/science.1211576
- Peplowski et al. (2012) Peplowski, P. N., Rhodes, E. A., Hamara, D. K., et al. 2012, Journal of Geophysical Research (Planets), 117, E00L10. doi:10.1029/2012JE004181
- Pignatale et al. (2018) Pignatale, F. C., Charnoz, S., Chaussidon, M., et al. 2018, ApJ, 867, L23. doi:10.3847/2041-8213/aaeb22
- Pringle (1981) Pringle, J. E. 1981, ARA&A, 19, 137. doi:10.1146/annurev.aa.19.090181.001033
- Rappaport et al. (2012) Rappaport, S., Levine, A., Chiang, E., et al. 2012, ApJ, 752, 1. doi:10.1088/0004-637X/752/1/1
- Robinson & Taylor (2001) Robinson, M. S. & Taylor, G. J. 2001, Meteoritics and Planetary Science, 36, 841
- Roig et al. (2016) Roig, F., Nesvorný, D., & DeSouza, S. R. 2016, ApJ, 820, L30. doi:10.3847/2041-8205/820/2/L30
- Santerne et al. (2018) Santerne, A., Brugger, B., Armstrong, D. J., et al. 2018, Nature Astronomy, 2, 393. doi:10.1038/s41550-018-0420-5
- Schaffer et al. (2018) Schaffer, N., Yang, C.-C., & Johansen, A. 2018, A&A, 618, A75. doi:10.1051/0004-6361/201832783
- Schaffer et al. (2021) Schaffer, N., Johansen, A., & Lambrechts, M. 2021, A&A, 653, A14. doi:10.1051/0004-6361/202140690
- Scora et al. (2020) Scora, J., Valencia, D., Morbidelli, A., et al. 2020, MNRAS, 493, 4910. doi:10.1093/mnras/staa568
- Sharp & Huebner (1990) Sharp, C. M. & Huebner, W. F. 1990, ApJS, 72, 417. doi:10.1086/191422
- Spalding & Adams (2020) Spalding, C. & Adams, F. C. 2020, The Planetary Science Journal, 1, 7. doi:10.3847/PSJ/ab781f
- Stewart & Leinhardt (2012) Stewart, S. T. & Leinhardt, Z. M. 2012, ApJ, 751, 32. doi:10.1088/0004-637X/751/1/32
- Tachibana et al. (2011) Tachibana, S., Nagahara, H., Ozawa, K., et al. 2011, ApJ, 736, 16. doi:10.1088/0004-637X/736/1/16
- Takigawa et al. (2009) Takigawa, A., Tachibana, S., Nagahara, H., et al. 2009, ApJ, 707, L97. doi:10.1088/0004-637X/707/1/L97
- Thiabaud et al. (2014) Thiabaud, A., Marboeuf, U., Alibert, Y., et al. 2014, A&A, 562, A27. doi:10.1051/0004-6361/201322208
- Toppani et al. (2006) Toppani, A., Libourel, G., Robert, F., et al. 2006, Geochim. Cosmochim. Acta., 70, 5035
- van Lieshout et al. (2014) van Lieshout, R., Min, M., & Dominik, C. 2014, A&A, 572, A76. doi:10.1051/0004-6361/201424876
- Vander Kaaden & McCubbin (2015) Vander Kaaden, K. E. & McCubbin, F. M. 2015, Journal of Geophysical Research (Planets), 120, 195. doi:10.1002/2014JE004733
- Walsh et al. (2011) Walsh, K. J., Morbidelli, A., Raymond, S. N., et al. 2011, Nature, 475, 206. doi:10.1038/nature10201
- Ward et al. (1976) Ward, W. R., Colombo, G., & Franklin, F. A. 1976, Icarus, 28, 441. doi:10.1016/0019-1035(76)90117-2
- Warell & Blewett (2004) Warell, J. & Blewett, D. T. 2004, Icarus, 168, 257. doi:10.1016/j.icarus.2003.10.020
- Weidenschilling (1977) Weidenschilling, S. J. 1977, MNRAS, 180, 57. doi:10.1093/mnras/180.2.57
- Weidenschilling (1978) Weidenschilling, S. J. 1978, Icarus, 35, 99. doi:10.1016/0019-1035(78)90064-7
- Woitke et al. (2018) Woitke, P., Helling, C., Hunter, G. H., et al. 2018, A&A, 614, A1. doi:10.1051/0004-6361/201732193
- Woo et al. (2022) Woo, J. M. Y., Brasser, R., Grimm, S. L., et al. 2022, Icarus, 371, 114692. doi:10.1016/j.icarus.2021.114692
- Wurm et al. (2013) Wurm, G., Trieloff, M., & Rauer, H. 2013, ApJ, 769, 78. doi:10.1088/0004-637X/769/1/78
- Xu et al. (2017) Xu, Z., Bai, X.-N., & Murray-Clay, R. A. 2017, ApJ, 847, 52. doi:10.3847/1538-4357/aa8620
- Yang et al. (2017) Yang, C.-C., Johansen, A., & Carrera, D. 2017, A&A, 606, A80. doi:10.1051/0004-6361/201630106
- Yang & Zhu (2021) Yang, C.-C. & Zhu, Z. 2021, MNRAS, 508, 5538. doi:10.1093/mnras/stab2959
- Zhang et al. (2021) Zhang, R., Wang, Z., Meng, Y., et al. 2021, Chemical Engineering Science, 245, 116870
- Zhu et al. (2007) Zhu, Z., Hartmann, L., Calvet, N., et al. 2007, ApJ, 669, 483. doi:10.1086/521345
- Zhu et al. (2009) Zhu, Z., Hartmann, L., Gammie, C., et al. 2009, ApJ, 701, 620. doi:10.1088/0004-637X/701/1/620