NICER monitoring of supersoft X-ray sources
Abstract
We monitored four supersoft sources - two persistent ones, CAL 83 and MR Vel, and the recent novae YZ Ret (Nova Ret 2020) and V1674 Her (Nova Her 2021) - with NICER. The two persistent SSS were observed with unvaried X-ray flux level and spectrum, respectively, 13 and 20 years after the last observations. Short period modulations of the supersoft X-ray source (SSS) appear where the spectrum of the luminous central source was fully visible (in CAL 83 and V1674 Her) and were absent in YZ Ret and MR Vel, in which the flux originated in photoionized or shocked plasma, while the white dwarf (WD) was not observable. We thus suggest that the pulsations occur on, or very close to, the WD surface. The pulsations of CAL 83 were almost unvaried after 15 years, including an irregular drift of the 67 s period by 2.1 s. Simulations, including previous XMM-Newton data, indicate actual variations in period length within hours, rather than an artifact of the variable amplitude of the pulsations. Large amplitude pulsations with a period of 501.530.30 s were always detected in V1674 Her, as long as the SSS was observable. This period seems to be due to rotation of a highly magnetized WD. We cannot confirm the maximum effective temperature of (145,000 K) previously inferred for this nova, and discuss the difficulty in interpreting its spectrum. The WD appears to present two surface zones, one of which does not emit SSS flux.
1 Introduction
Supersoft X-ray sources (SSS) that are also sufficiently luminous at other wavelengths, allowing a clear classification, are found to be accreting WDs, undergoing hydrogen burning in a shell close to the surface (see, among other articles Orio, 2013, and references therein). Often, they are transient SSS in post-outburst novae, in which hydrogen burning continues near the surface after the bulk of accreted envelope mass has been ejected and the WD photosphere has shrunk back to almost pre-outburst radius. The range of effective temperature Teff in the SSS varies from 120,000 K to about a million K. Most post-AGB WDs that are still shell-burning hydrogen have larger envelopes on top than post-novae, and the average Teff is much lower, often peaking only in the ultraviolet (see the objects studied by Córsico & Althaus, 2014). There are a few exceptions, mainly PG 1159-type central stars of planetary nebulae, with T100,000 K (Löbling et al., 2019; Adamczak et al., 2012). In the accreting WD of binaries, the burning shell is closer to the surface than in the post-AGB stars. In novae, convection brings to the surface + decaying nuclei that heat the envelope, so the average Teff is the highest. Several post-outburst novae have been found to be close to the high end of the SSS temperature distribution (e.g. Ness et al., 2011; Orio et al., 2018). A non-negligible group of non-novae, semi-steady or recurrent SSS, has been discovered in the Local Group (see Orio et al., 2010; Orio, 2013), in directions of low absorbing column of gas. Especially in the Magellanic Clouds, many of these SSS have been identified with WD binaries in which accretion occurs onto the WD and hydrogen burning is ignited, but the process occurs at such high rate that it does not cause thermonuclear runaways like in novae (see Yaron et al., 2005; Starrfield et al., 2012; Wolf et al., 2013, for the theoretical models). In this work, we observed again two of the non-nova close binary SSS, extending the time line of their observations to over 20 years for one of them (MR Vel) and 40 years for the other one, CAL 83.
A very interesting characteristic of many SSS is the flux modulation with short periods, ranging from tens of seconds to 1 hour. In Table 1, we show a list of measured periods of semi-steady SSS and novae in the SSS phase, not including longer periods that have also been measured in some cases and have been found to be orbital in nature. The periods in the 5-45 minutes range measured in several novae, namely V407 Lup, V2491 Cyg and V4743 Sgr have been measured again at quiescence when the X-ray flux was 5 orders of magnitude lower and spectrum was less soft, as described in the references in Table 1. For these novae, the period has been attributed to the WD spin in a highly magnetized WD, an intermediate polar (IP) system. The period detection at quiescence is understood as due to the accretion curtain/pre-shock material absorbing the X-ray soft radiation of the hot polar caps differently as the WD rotates. It is not obvious why the SSS emission of the hydrogen burning WD is not homogeneous and why it shows a modulation with the rotation period. Probably, the WD is hotter at the poles, and/or the burning occurs closer to the surface and lasts longer at the poles, possibly fed by renewed accretion at the end of the outburst (see Zemko et al., 2016; Aydi et al., 2018, for a discussion). Understanding the mechanism of the modulations of the SSS post-outburst is essential to correctly model the outburst and the quiescent life of the systems.
Also in two non-nova SSS, the periodicity has been linked with the rotation period of the WD. In the WD with the shortest ever detected period of 13.2 s, RX J0648.0-4418, a negative period derivative has been measured, and has been interpreted as due to a young, contracting WD in a system containing a subdwarf as close binary companion (Mereghetti et al., 2021, and references therein). In CAL83, a period of 67 s has also been interpreted as linked with rotation. The period appeared to have a drift of about 3 s within short timescales, interpreted by Odendaal et al. (2014) as due to an envelope that is not quite synchronized with the rotation of the core WD, and by Odendaal & Meintjes (2017) as due to the effect of a weak ( G) magnetic field in an equatorial belt at the boundary with an accretion disk.
However, this model does not apply during the thermonuclear runaway, especially for the two pulsating RN/symbiotics, RS Oph and V3890 Sgr, which host a red giant and are thought to undergo disk accretion because of atmospheric Roche Lobe overflow (see Booth et al., 2016; Mikołajewska et al., 2021). Ness et al. (2015) attributed the modulations to non-radial g-mode oscillations caused by the burning that induces gravity waves in the envelope (so called “ mechanism”), but detailed calculations ruled out periods longer than 10 s Wolf et al. (2018), leaving the puzzle unsolved.
With its excellent timing capabilities and high signal-to-noise, especially in the soft X-ray range, the Neutron Star Interior Composition Explorer Mission (NICER) is an excellent instrument to study the SSS and their intriguing periodic modulations. The NICER camera is an external attached payload on the International Space Station (ISS). Although NICER’s main task is to perform a fundamental investigation of the extreme physics of neutron stars, measuring their X-ray pulse profiles in order to better constrain the neutron star equation of state, NICER is useful for a variety of astrophysical targets. NICER provides also unprecedented timing-spectroscopy capability, with high throughput and low background (Prigozhin et al., 2016). The NICER instrument is the X-ray Timing Instrument (XTI), designed to detect the soft X-ray (0.2 - 12 keV) band emission from compact sources with both high time resolution and spectral information. It is a highly modular collection of X-ray concentrator (XRC) optics, each with an associated detector. The XTI collects cosmic X-rays using grazing-incidence, gold-coated aluminum foil optics, equipped with 56 pairs of XRC optic modules and a silicon-drift detector for high time resolution observations (time-tagging resolution 300 nanoseconds). A shorter read-out time than other similar detectors on satellites in space (Chandra, XMM-Newton, Swift) allows significantly less pile-up and this is ideal for supersoft X-ray sources.
This paper is structured as follows: each of the four source we studied, CAL 83, MR Vel, V1674 Her, YZ Ret, is described in a separate section, with subsections describing the data and a brief discussion of the results. Finally, we summarize the results and draw some general conclusions in a final Conclusions section.
| Object | Type | Period | References |
|---|---|---|---|
| RX J0648.0-4418 | O subdwarf+WD | 13.2 s | Mereghetti et al. (2009); Popov et al. (2018) |
| Mereghetti et al. (2021) | |||
| N LMC 2009 | nova | 33.20.1 s | Ness et al. (2015); Orio et al. (2021) |
| RS Oph | nova,symbiotic | 34.90.2 s | Nelson et al. (2008); Osborne et al. (2011); Pei et al. (2021c) |
| KT Eri | nova | 34.830.06 s | Ness et al. (2015); Pei et al. (2021b) |
| V339 Del | nova | 54.10.2 s | Ness et al. (2015) |
| CAL 83 | main seq.+WD | 67 s | Odendaal et al. (2014); Odendaal & Meintjes (2017) |
| V3890 Sgr | nova,symbiotic | 82.90.6 s | Beardmore et al. (2019); Page et al. (2020) |
| Chandra r2-12 | semi-steady SSS | 217.760.05 s | Trudolyubov & Priedhorsky (2008); Chiosi et al. (2014) |
| Nova Her 2021 | nova | 501.350.30 s | this work (see also Maccarone et al., 2021) |
| Pei et al. (2021a); Drake et al. (2021) | |||
| V407 Lup | nova | 565 s | Aydi et al. (2018) Orio2021b, in preparation |
| XMMU J004319.4+411759 | nova? | 865.50.5 s | Osborne et al. (2001) |
| V4743 Sgr | nova | 1325 s | Ness et al. (2003); Leibowitz et al. (2006) |
| Zemko et al. (2016, 2018) | |||
| V2491 Cyg | nova | 2303.4 s | Ness et al. (2011, 2015); Zemko et al. (2015) |
| V1494 Aql | nova | 2498.8 s | Drake et al. (2003) Rohrbach et al. (2009) |
| V959 Mon | nova | 55 and 102 min. | Peretz et al. (2016) |
2 CAL 83: the “oldest” known SSS
CAL 83 was discovered with Einstein as one of the very first luminous SSS (Long et al., 1981). It is a close binary luminous SSS in the Large Magellanic Cloud (LMC), never observed to undergo a nova outburst. The current understanding is that it hosts a massive WD accreting from a main sequence or slightly evolved companion, and it is luminous because of continuous shell nuclear burning. The luminosity due to the burning is orders of magnitudes higher than the accretion energy released in the disk. The accretion disk is instead a main contributor to the optical light, because it reprocesses X-rays from the disk in the optical energy range (Popham & di Stefano, 1996). The nature of the companion is not well known. van den Heuvel et al. (1992) have argued that the donor star is more massive than the WD, while optical data analyzed by Crampton et al. (1987); Odendaal et al. (2014) seemed to show that the compact object is more massive than the donor.
CAL 83 has been observed to be extremely X-ray luminous for the last 40 years. Occasional “off” states were observed for at least two days in 1999 November, during one day on 2001 October, and again twice in 2008 January and March, in observations spaced about 8 weeks apart (leaving us to wonder whether the off state lasted for the whole 8 weeks or longer). A week later in 2008, detection of intermediately high luminosity followed, but after two more weeks - in 2008 April - the source was again undetectable in two exposures, with a week interval in between. The sparse and irregular cadence of the observations (see Lanz et al., 2005; Odendaal et al., 2014) does not allow to draw any clear conclusion on the duration of the “X-ray off” states. However, both Greiner & Di Stefano (2002) and Rajoelimanana et al. (2013) found that all “X-ray off” states were observed during optically bright states of the source, followed by a periodic dimming (by about 1 mag) about every 450 days. CAL 83 appeared X-ray luminous when the optical luminosity was lowest. Since the source of optical luminosity is the accretion disk, the reason of this apparent anticorrelation of X-ray and optical luminosity may be similar to the model proposed by Southwell et al. (1996) for RXJ0513-69, namely that photospheric contraction follows a period of high mass accretion rate that triggers the burning, increasing the effective temperature of the WD and making the WD visible as a SSS. A periodic decrease in may be followed by quenching of the burning and photospheric expansion after a certain time.
2.1 The NICER observations of CAL83
The details of the observations are shown in Table 2. We obtained six observations on six different dates. An initial exposure of about 1 ks was done on 2019 April 19, to assess whether it had come out of a low state detected with Swift on 2019 April 15 in a 2 ks long exposure. It was found to be X-ray luminous again, after little less than 4 days. Five more observations of very different total duration were done between May 16 and May 21 of the same year and no more ‘off” states were observed. While the work by Odendaal et al. (2014) focused on XMM-Newton continuous exposures with duration of hours, the NICER observations gave the opportunity to observe if and how the period changes over timescales of days and weeks. Frequent interruptions of the NICER exposures are due to the obstruction by the Earth, and the maximum exposure capacity for NICER is limited to s. Moreover, during effective exposures, space weather conditions can also impact the quality of the data when there are flares in the background, due to the ISS being in certain regions near the poles or the South Atlantic Anomaly. Uninterrupted exposures of CAL 83 lasted from 208 to 1006 s, and exposures done on the same day, usually with intervals of order of 5000 s in between, were coadded in separate observations’ data sets with the same observation number, and were archived as such in HEASARC.
2.2 Data reduction of the NICER exposures
HEASoft version 6.29c and NICER data-analysis software nicerdas version 5.0 were used to reduce the data of NICER observations. The timing analysis was performed with the Starlink PERIOD package, following the Lomb-Scargle (LS) method (Scargle, 1982). Each light curve was first detrended, by subtracting a linear fit and dividing by the standard deviation. The PERIOD task SCARGLE was then used to create Lomb-Scargle periodograms (LSP) from each light curve. In the spectra of all the six NICER observations of CAL 83 all photons from the source are in the 0.2 1.0 keV energy region, so the light curves used to perform the timing analysis were extracted in this range. With the PERIOD task PEAKS, we found the highest peak in the periodogram between the frequencies we specified, and in order to determine the statistical significance of the period and obtain a statistical error, we performed a Fisher randomization test, as described by Linnell Nemec & Nemec (1985), over frequencies from 10 to 100 mHz, including also red noise in the significance analysis. We did not subtract any background, which was very low compared to the source for most of the time, but we experimented with exclusions of intervals of high background by using two slightly different methods, with the nicer-bkg-estimator tool, which excludes periods of inclement “space weather”, and the alternative nibackgen3C50 tool which uses a different method to choose the good time intervals (GTIs). Both tools are described in https://heasarc.gsfc.nasa.gov/docs/nicer/tools/nicer_bkg_est_tools.html. However, excluding high background periods decreased the duration of the available observation and the duration of the light curve is important for the significance of the period searching by using the LS method.
2.3 Results of the NICER observations
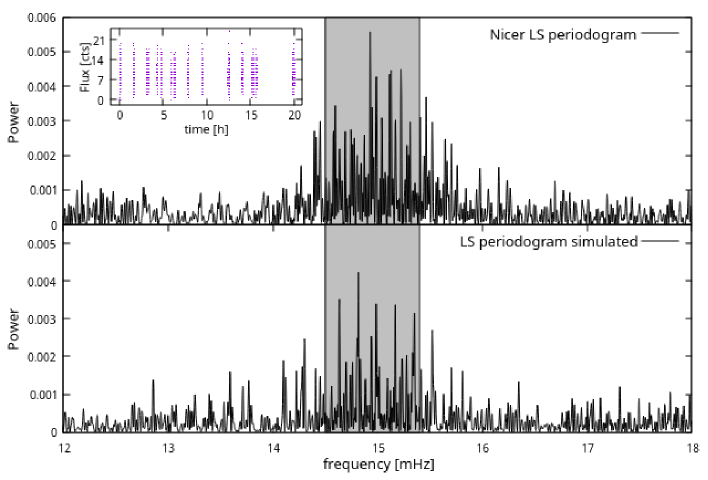
Table 3 shows the results obtained with the LS period search with three differently filtered datasets: using all the available exposure time and not excluding the high background periods, excluding high background periods by using the nicer-bkg-estimator tool, and finally also using the nibackgen3C50 tool. Periodograms obtained for different dates shown in Fig. 1, and the light curves folded with the periods listed in the second column of Table 3 are shown in Fig. 2. Because the actual time intervals considered in each exposure without exclusion of adverse space weather and with the two different methods are slightly different, we measured slightly different periods. This difference, we found, is actually due to the fact that the period is always found to drift within time scales of minutes and hours, so even excluding different, short time intervals (that is, using different good time intervals, or “GTIs”) yields different results. With the last correction method, the period was not detected in observation 261100105 of May 19 2019, and there is only a low significance detection in the first two columns. We suggest that the reason for which the period becomes undetectable during short continuous exposure is in the variable amplitude of the modulation, that becomes too small for detections at times. We do not find evidence that the periodicity is transient. We also note that with both methods of excluding bad space weather, the results are consistent within statistical errors with the “whole light curve” in 3 out of 4 observations with a high probability detection.
However, the detected periods are not consistent with each other on the different dates, showing a clear variation from one day to the other. The variation is not dependent on the average count rate during the exposure, indicating that we cannot correlate the average count rate with the length of the measured period. The periodograms obtained with the dataset in column 2 of Table 3 are shown in Fig.1, and Fig.2 shows the light curves folded with the measured periods. Table 4 shows that we did not find significant differences in the modulation amplitude of the 67 s period in the light curves extracted in both the 0.2 0.4 keV range and in the 0.4 1 keV range. Thus, the modulation is not energy-dependent in the 0.2 1 keV in which CAL 83 is X-ray luminous.
Table 5 shows the results of the analysis of the single short exposures, excluding the intervals of poor space weather only with the nicer-bkg-estimator tool. Here we evaluated the statistical error for the frequency by fitting a Gaussian to the highest peak in the periodogram, when this fit was possible. We retrieved the frequency with high significance only in 7 of the single short intervals of uninterrupted exposures, and the statistical error in the frequency is quite large. Realizing that the errors are very large, we did not perform a statistical test to evaluate the errors better like we did for the “total” observations in Table 3. We stress that again, we did not find a correlation between average count rate during the exposure and frequency measured in the exposure. We attribute the difficulty to measure the period during the short continuous observations to the varying amplitude of the pulsation. Since it appears to vary when we fold the single light curves with the period that was detected, we suggest in some exposures it must have been too low for a clear measurement, and that it is unlikely that the period was transient.
| Observation ID | Start time | Exposure time | Mean count rate | Softness ratio |
|---|---|---|---|---|
| (UTC) | (s) | (cts s-1) | (see text) | |
| 2611010101 | 2019-04-19,08:20:00 | 1104 | 6.000 0.076 | 1.27 |
| 2611010102 | 2019-05-16,18:35:24 | 878 | 7.8850.097 | 1.06 |
| 2611010103 | 2019-05-17,21:09:30 | 996 | 8.1970.093 | 1.04 |
| 2611010104 | 2019-05-18,00:14:52 | 11057 | 7.4050.038 | 1.13 |
| 2611010105 | 2019-05-19,02:30:34 | 2763 | 6.8660.061 | 1.22 |
| 2611010106 | 2019-05-21,23:39:58 | 7632 | 8.3430.035 | 0.987 |
| Observation ID | Period | Significance | Time | Period | Significance | Time | Period | Significance |
|---|---|---|---|---|---|---|---|---|
| (s) | (%) | (s) | (s) | (%) | (s) | (s) | (%) | |
| Whole light curvea | nicer-bkg-estimatorb | nibackgen3C50c | ||||||
| 2611010101 | 66.60.2 | 99.5 | 1100 | 66.70.2 | 99.0 | 825 | 66.00.2 | 98.5 |
| 2611010102 | 65.01.2 | 99.0 | 877 | 65.01.2 | 99.0 | 759 | 65.41.3 | 99.5 |
| 2611010104 | 65.680.01 | 99.0 | 8435 | 66.980.02 | 99.0 | 9388 | 66.710.02 | 99.0 |
| 2611010105 | 62.420.08 | 44.5 | 2693 | 72.50.1 | 32.8 | 2010 | … | … |
| 2611010106 | 66.850.02 | 99.0 | 4040 | 68.250.02 | 99.0 | 7305 | 65.670.02 | 99.0 |
Notes: a: Using light curves in which the high background periods are not excluded. b: Using light curves in which the high background periods are excluded by using the nicer-bkg-estimator tool . c: Using light curves in which the high background periods are excluded by using the nibackgen3C50 tool.
| Observation | Perioda | Modulation amplitude (%) | Modulation amplitude (%) |
|---|---|---|---|
| ID | (s) | 0.2 0.4 keV | 0.4 1.0 keV |
| 2611010101 | 66.70 | 22.4 | 27.2 |
| 2611010102 | 65.00 | 16.2 | 17.1 |
| 2611010104 | 66.98 | 4.0 | 8.2 |
| 2611010105 | 72.50 | 8.1 | 11.0 |
| 2611010106 | 68.25 | 7.6 | 8.7 |
Notes: a: The period used to fold the corresponding light curves of CAL 83 in Fig.2.
| Obs. ID | Seg. | Start Time (UT) | Exp. (s) | Freq. (mHz) | P(s) | Sig. (%) |
|---|---|---|---|---|---|---|
| 2611010101 | 1 | 2019 April 19 08:24:36 | 405 | 14.370.85 | 69.6 | 10 |
| 2 | 2019 April 19 09:57:13 | 708 | 14.990.46 | 66.7 | 94.7 | |
| 2611010102 | 1 | 2019 May 16 18:35:24 | 872 | 15.220.62 | 65.7 | 86.4 |
| 2611010103 | 1 | 2019 May 17 21:11:52 | 205 | – | – | – |
| 2 | 2019 May 17 22:44:36 | 670 | 15.220.85 | 65.7 | 10 | |
| 2611010104 | 1 | 2019 May 18 00:17:19 | 769 | – | – | – |
| 2 | 2019 May 18 01:50:01 | 791 | – | – | – | |
| 3 | 2019 May 18 03:24:15 | 714 | 15.260.65 | 65.5 | 10 | |
| 4 | 2019 May 18 04:35:06 | 408 | – | – | – | |
| 5 | 2019 May 18 04:58:41 | 628 | 15.030.80 | 66.5 | 98.7 | |
| 6 | 2019 May 18 06:07:49 | 379 | – | – | – | |
| 7 | 2019 May 18 06:33:09 | 545 | 14.44 | 69.3 | 10 | |
| 9 | 2019 May 18 08:06:37 | 519 | 14.30 | 69.9 | 10 | |
| 11 | 2019 May 18 09:39:18 | 538 | 15.11 | 66.2 | 10 | |
| 12 | 2019 May 18 12:41:11 | 779 | – | – | – | |
| 14 | 2019 May 18 14:18:26 | 507 | 15.190.66 | 65.8 | 10 | |
| 15 | 2019 May 18 15:24:05 | 830(553) | – | – | – | |
| 16 | 2019 May 18 15:54:54 | 280 | 15.541.61 | 64.4 | 10 | |
| 17 | 2019 May 18 20:02:14 | 907 | 15.020.63 | 66.6 | 99.9 | |
| 2611010105 | 1 | 2019 May 19 02:33:11 | 921 | – | – | – |
| 2 | 2019 May 19 04:05:54 | 920 | 15.170.53 | 65.9 | 50.3 | |
| 3 | 2019 May 19 05:39:44 | 854 | – | – | – | |
| 2611010106 | 1 | 2019 May 21 23:47:04 | 1006(373) | 14.86 | 67.3 | 10 |
| 2 | 2019 May 22 01:25:08 | 699 | – | – | – | |
| 3 | 2019 May 22 04:26:48 | 143 | – | – | – | |
| 6 | 2019 May 22 12:21:10 | 279 | 14.781.86 | 67.4 | 98.9 | |
| 8 | 2019 May 22 15:16:58 | 644 | 14.910.85 | 67.0 | 68.2 | |
| 9 | 2019 May 22 16:49:09 | 854 | 15.030.65 | 66.5 | 99.9 | |
| 10 | 2019 May 22 18:22:33 | 960 | – | – | – |


2.4 Simulating the CAL 83 data for better understanding
Simulations of the periodic variability of nova V4743 Sgr done by Dobrotka & Ness (2017) showed that a double-peak pattern found in the periodogram was not caused by two actual different frequencies, but originated in a single frequency with amplitude variability, causing a false beating. In Orio et al. (2021), we could not rule out that the measured period drift for N LMC 2009 was an artifact of variable amplitude, even if detailed simulations showed that an actual variation of the period was more likely. In order to assess whether the period drift measured in CAL 83 is real, or an artifact due to the variable amplitude of the oscillation, we resorted to simulations.
The period was modeled as a sinusoidal function
| (1) |
where is the mean period value111No long term trend was noticeable in the observed data. Poisson noise was then added. The simulations were performed by varying either only one of the two and parameters, or both of them at the same time, to examine how the actual variations affect the amplitude or/and the period we measure.
In order to simulate the variability, we selected randomly generated points in Gaussian curves centered on the mean value of or , and selected variance values corresponding to typical values in the actual periodograms. We chose the input for the sine function by randomly selecting the values of a polynomial ( and ) of order between 10 and 30. If the amplitude was negative, we assumed . The sinusoidal function thus can be written as:
| (2) |
For the three types of variability (, + , ) we run 1000000 simulations, creating Lomb-Scargle periodograms. We selected the periodogram that best simulates the data, by calculating the sum of the residual squares calculated over a given period interval, where is the observed power and the simulated one.
We performed these simulations for the light curve of NICER observation 2611010104 shown in Table 5, consisting of 15 partial exposures (Fig 3 inset; note that we neglected the intervals without any measured value, and split one interval of Table 3 in two parts, because there was a small gap during the exposure). Besides the detected 67 s period, some randomly selected mean values between 65 s and 69 s (gray shaded area in Fig 3) were also used. We chose the best 100 results for each type of variability by examining the sum of the residual squares, and compared the observed and simulated LS periodograms. 52 of the best periodograms were simulated with variable amplitude and constant period, 23 with constant amplitude and variable period and, 25 with variable amplitude and period.
The result indicates that the constant and variable period fit the data equally well. However, Fig 3 (bottom panel) shows the simulated LS periodogram in which the light curve was modulated with constant amplitude and constant period. It is clear that it is affected by significant aliasing because of the different duration of the partial observations and intervals between them. Thus, complicated patterns of variability cannot be analysed.
In order to eliminate the aliasing problem, we repeated the simulation with the same values, splitting the light curve in the short continuous exposures listed in Table3, and created an LS periodogram for each short exposure. The duration of the individual continuous exposures varies from 240 s to 907 s and, as shown in Table 3, was often not sufficiently long for clear detections of the periodicity. In the simulations, we found the following distribution for the 100 periodograms with the best residuals: 48 with variable amplitude and constant frequency, 17 with constant amplitude and variable frequency, 35 with variable amplitude and variable frequency. However, the LS periodograms have very broad peaks, which in most cases we could not reproduce, so this simulation did not lead to a clear conclusion. Fig. 2 of Odendaal et al. (2014), based on XMM-Newton data, shows that the width of the frequency drift due to potentially variable periodicity is approximately 1-2 mHz (see ObsID 0506531701). Considering 1/T (where T is the duration of a continuous exposure) as periodogram resolution, even the longest NICER snapshot of 907 s yields a resolution of 1.1 mHz, which is comparable to the width of the frequency drift and does not allow a detailed analysis. As a test, we repeated the simulations only with exposures longer than 500s (a limit that was empirically based on visual inspection of the periodograms) and found a different result, namely 94 of the 100 best simulations had variable amplitude and fixed frequency. Thus, the results of these simulations of the many short NICER exposures depend on the minimum length chosen to select the exposures to model.
We conclude that the analysis should be based on much longer continuous exposures and repeated the simulation for the XMM-Newton EPIC-pn light curve of ObsID 0506531701, the most recent and longest continuous exposure among all X-ray observations of CAL 83 (see Odendaal et al., 2014). As Fig. 3, bottom right panel, shows, this continuous exposure gave a complex result, with other minor peaks in the periodograms that were relatively high. We adopted the following mean values: = 65.2s , = 66.3 s, = 66.7 s, = 67.3 s, corresponding to the highest peaks around the observed 67 s periodicity, and a value between them. We modeled the long-term trend of the observed light curve by assuming that the vertical shift resulted from a polynomial fit (13th order, ). Again, we selected the 100 best residuals fits, obtaining the following outcome: 87 were with constant amplitude and variable period, 13 with variable amplitude and variable period, none with a constant period. The best simulated LS periodogram is shown in Fig 4.
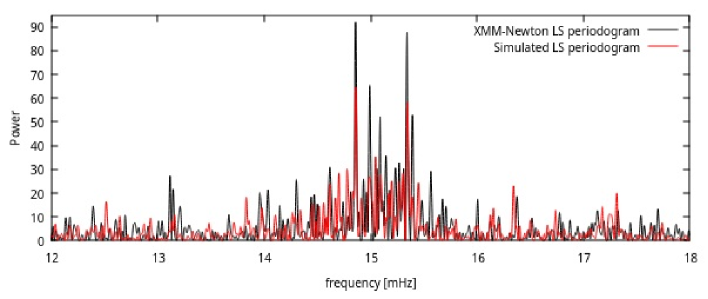
With the result obtained with the XMM-Newton data we draw the conclusions that CAL 83 has a variable period, ruling out that the observed LS periodogram is modulated by a stable period with variable amplitude (even if also the amplitude varies). As mentioned above, Dobrotka et al. (2021) were able to model the periodogram of Nova LMC 2009a in the SSS phase even only with variable amplitude, but a variable period appeared to yield better simulations. While in the LMC 2009a the scattering was around 0.4 s, in CAL 83 it is quite longer, namely 2.1 s, allowing a more definite conclusion.
2.5 CAL 83 spectra observed with NICER
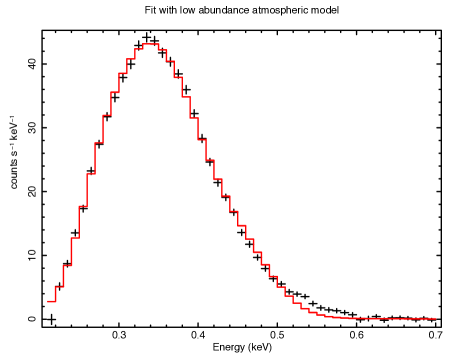
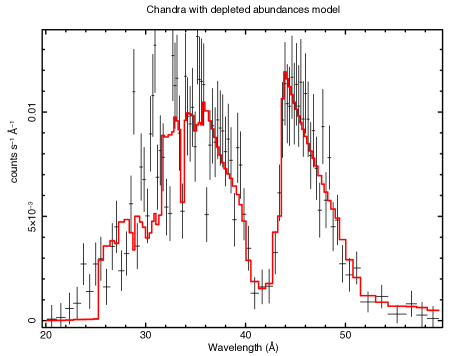
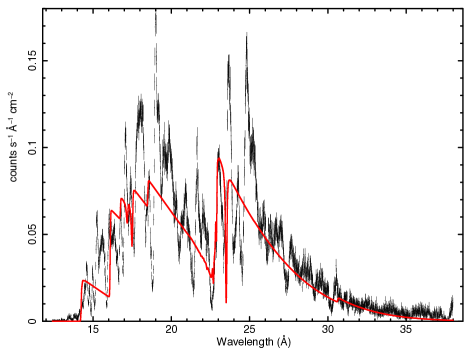
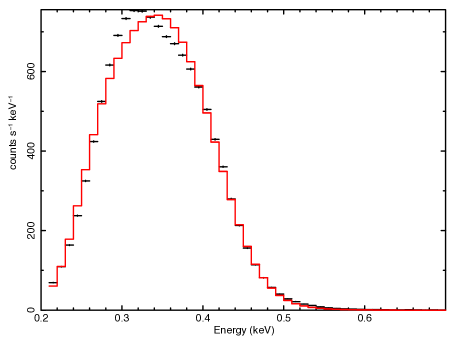
CAL 83 was observed with the Chandra Low Energy Transmission Grating (LETG) in 2001 May and with XMM-Newton once in 2001 and in several exposures between 2007 and 2008. Two LETG exposures in 2002 October found the source in an “off” state. Because of the shorter NICER read-out time, the spectra are not affected by pile-up in this extremely soft source, like EPIC and the Chandra ACIS-S (an observation was done with this instrument in 1999), but CAL 83 is too soft for the XMM-Newton RGS grating, that does not measure the whole spectral range of interest. Therefore, we compare the NICER spectra with the ones observed in 2001 with the LETG, despite the very different spectral resolution. The average count rate of CAL 83 has always varied in different observations (see Odendaal et al., 2014), and an interesting question is whether there is a correlation with spectral variations. In Fig. 5, in the top panel on the right, we compare the NICER average spectra on different days and we also show the comparison with the LETG spectrum of 2001. One of the 2019 NICER spectra, and the LETG 2001 one, are shown fitted with atmospheric models in the lower panels of Fig. 5, in units of energy and wavelength, respectively. A rigorous fit was done by Lanz et al. (2005), who found a best fit with with log(g)=8.5 and Teff=550,0002,500 K, fixed N(H)=6.5 1020 cm-2, absolute luminosity 1.80.6 1037 erg s-1. These author’s atmospheric models are not public, so we used the publicly available TMAP code grid of models of Rauch et al. (2010), available in the web site http://astro.uni-tuebingen.de/#rauch/TMAP/TMAP.html. We find the best fit to the NICER spectrum of May 18 (the longest exposure) with a model studied for Magellanic Cloud and Galactic halo sources with depleted abundances, with log(g)=9.0. Model “halo” with log(g)=9, that we used, is adopted from a grid of models with only elements from H to Ca, that is defined as “not suitable for precise spectral analysis” because only approximate formulae were used in order to account for Stark line broadening. However, with the broad-band spectra the absorption lines are not measurable and great precision is not required. The more rigorously calculated grid with elements up to Ni has peculiar abundances adopted from specific nova models (see Rauch et al., 2010), so we found that the depleted abundances model is more suitable, as expected because the Magellanic Clouds have low metallicity and no strong mixing like in post-novae should have occurred in CAL 83. All the public grids in the web site are either with log(g)=8 or log(g)=9, but no available models were computed with values between these two extremes. log(g)=9 models fit better than those with log(g)=8, but the fit we obtain is not perfect, mainly because it underpredicts the flux above 0.5 keV. The values we obtain are close to those of Lanz et al. (2005), but the higher log(g) results in a lower temperature, namely Teff=502,0005,000 K, N(H)=5.1 1020 cm-2, absorbed flux 7.4 10-12 erg s-1 cm-2 and unabsorbed flux 3.5 10-11 erg s-1 cm-2. We find that this model fits also the LETG spectrum of 2001, with Teff=469,0005,000 K, N(H)=6.3 1020 cm-2, absorbed flux 8.3 10-12 erg s-1 cm-2, unabsorbed flux 5.6 10-11 erg s-1 cm-2 (corresponding to an absolute luminosity of 1.67 1037 erg s-1 at a distance of 50 kpc to the LMC). However, if we model the LETG spectrum with more bins, we obtain a better result with the grid studied for nova abundances, (specifically, model SSS-003-00010-00060.bin-0.002-9), because it includes more ions and thus models the absorption features. The resulting parameters are Teff=505,0005,000 K, N(H)=5.8 1020 cm-2, absorbed flux 7.9 10-12 erg s-1 cm-2, unabsorbed flux 4.5 10-11 erg s-1 cm-2 (corresponding to absolute luminosity 1.34 1037 erg s-1). Since we did not have a sufficiently “sensitive” grid of log(g) values, the small differences in the best fits’ parameters (of order 10%) are within each other’s statistical errors and do not indicate any significant spectral difference between 2001 and 2019.
Because the peak of the count rate is around 0.35 keV, in Table 2 we also give the “softness ratio” measured as count rate in the 0.2-0.35 keV band divided by count rate in the 0.35-1 keV band. It is evident from the table that this ratio decreases when the total count rate increases, thus when the average count rate is lower, the softest portion increases. We also tried to estimate the flux in two energy ranges, the softest, namely 0.2-0.3 keV and the total flux in the 0.2-0.8 keV range (there is hardly any flux above 0.8 keV). We did so by fitting the model described above, choosing on purpose the softest possible range for this comparison. We found that the unabsorbed flux in this softest band varies by at most 15% around an average 2.1 erg cm-2 s-1. The total range in the whole 0.2-0.8 keV range of interest also varies by about 15% around an average value of erg cm-2 s-1. From these two indications, “softness ratio” and comparison of flux estimates, we infer that the measured count rate variation is not due to change in column density N(H), as would be the case if it was due, for instance, to a wind.
2.6 Accretion and burning in CAL 83
Odendaal & Meintjes (2017) offered an attractive explanation for the oscillations in the X-ray flux of CAL 83, as a “dwarf nova oscillation” type of quasi periodic oscillation in a “belt-like structure” at the boundary of the inner accretion disk, which is weakly coupled with the WD core by a G magnetic field, rotating faster than the WD itself and with a combination of spin-up and spin-down. However, the high S/N obtained with NICER in the softest range (0.2-0.4 keV) demonstrates that the modulation is not energy dependent. The accretion belt is very unlikely to emit such conspicuous flux in the very soft energy band of 0.2-0.4 keV. Since we attribute the extremely high flux in this range only to the WD atmospheric emission, the pulsation appears to be occurring on the WD.
Odendaal & Meintjes (2017) did not quantify all aspects of the model for the case of CAL 83 and spectral predictions are missing in the paper, but since accretion would produce a much less luminous and much less soft emission than observed, the absence of energy dependence may be a strong point against the so called eLIMA model of these authors. The short period oscillations with a period drift observed in RS Oph and V3890 Sgr, which are symbiotic systems, during their nova eruption are also unlikely to be explained by such a model. The accretion disks in symbiotics have very different size and characteristics and there is evidence that at least the inner accretion disk is destroyed during the eruption (Worters et al., 2007). In the 2006 outburst the accretion disk of RS Oph was only re-established by day 241 of the outburst, long after the SSS turn-off (Worters et al., 2007). A common model for all the shortest period modulations of the SSS seems desirable, even if only for an “Occam’s razor” criterion.
Another important point raised by the NICER monitoring is that the SSS flux always appears to vary by up to 30%, even within hours, without spectral hardening that may indicate increased absorption. Moreover, we observed that the rise from the minimum X-ray luminosity L erg s-1 to an X-ray luminosity level above 1037 erg s-1 took only 3 days, and the source was never observed again at minimum in the course of 5 days in 2019 May. A successful explanation of the luminosity variations of CAL 83, attributed either to photospheric adjustments or to variable accretion (see Greiner & Di Stefano, 2002), has to take these timescales into account.
3 MR Vel: an “extreme” symbiotic star
MR Vel (RX J0927.5-4758) is a peculiar steady X-ray source, initially observed with ROSAT and later observed and found equally luminous with ASCA, BeppoSAX, Chandra and XMM-Newton, with a highly absorbed (N(H) cm-2), yet supersoft X-ray spectrum due mainly to emission lines (see Motch et al., 2002; Bearda et al., 2002, and references therein). Despite the relatively low inclination, estimated to be between (according to Schmidtke et al., 2000), the X-ray grating spectra show an emission line spectrum that cannot be fitted with models of collisional ionization or photoionization and is difficult to explain. The absorbed X-ray luminosity is about 1035 erg s-1 at a distance of 1 kpc, but GAIA indicates a value of 5.68 kpc (Bailer-Jones et al., 2021).
The orbital period of MR Vel is 4.028 days (Schmidtke et al., 2000; Schmidtke & Cowley, 2001), and the optical light curve also shows modulations with periods of 0.2 to 0.3 days - a 0.2 days modulation was also observed in X-rays in the year 2000 (see Motch et al., 2002; Bearda et al., 2002, and references therein). The radial velocities of the HeII 4686 and H emission lines and their amplitude allowed to estimate a mass range of 1-2 M⊙ for the donor, and of 0.7-1.7 M⊙ for the accreting object (Schmidtke et al., 2000; Schmidtke & Cowley, 2001). So far, no trace of the donor has been detected in the optical spectrum (Schmidtke et al., 2000), nor in the I-band (Mennickent et al., 2003). In June 1997, Motch (1998) detected transient jets from MR Vel with projected velocity of 5200 km/s. The receding component of the H jet with projected velocity of 5350 km/s was tentatively identified by Schmidtke et al. (2000) in March 1999. Since for the majority of jets, the outflow velocity reflects the escape velocity at their origin (Livio, 1998), and assuming that the jet expansion is perpendicular to the orbital plane, the expansion velocity is km s-1 for the inclination range given above (), is consistent with a massive, M⊙, WD accretor and narrows the range for the mass of the donor, M⊙. For a binary period of about 4 days and the above mass range, the Roche lobe radius of a main sequence secondary should be of the order of R⊙, thus a donor star with mass 1-1.6 M⊙ fitting this system must be evolved. The effective temperature of this donor does not exceed 6000 K, and the luminosity does not exceed L⊙. The 2MASS magnitudes of MR Vel, , , provide some additional constraints. The source is highly reddened, as indicated by the neutral hydrogen column density, cm-2, which corresponds to a reddening of E(B-V) (adopting the conversion relationship given by Güver & Özel, 2009). The reddening corrected is thus consistent with a G2-8 giant ( K; moreover the magnitude combined with the Gaia distance indicates a luminosity of L⊙. The radius of such a star, R⊙, would be almost 3 larger than the Roche lobe radius. Summarizing, the observational data are consistent with a low-mass, 1-1.6 M⊙, yellow (G-type) giant donor ascending the first giant branch, and a massive, 1-1.3 M⊙, WD secondary. So, in principle, MR Vel is likely to be a sort of extreme (with the shortest orbital period!) yellow symbiotic system, similar to, e.g., StHA 190 (Smith et al., 2001).


3.1 The NICER observations of MR Vel
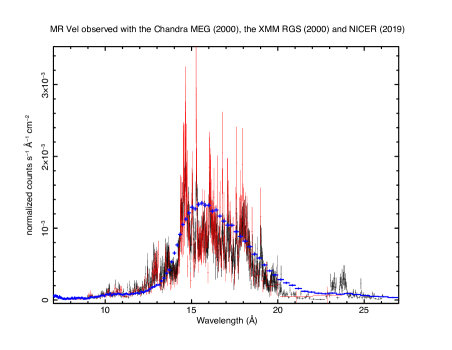
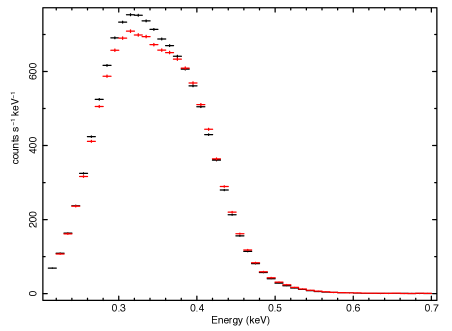
We observed MR Vel with NICER in several exposures lasting about 1000 s each on 2019 May 18 and 19. The data reduction was performed as described above for CAL 83, and the data we present had bad space weather intervals subtracted with the nibackgen3C50 tool. Fig. 6 shows the light curve observed in the 0.2-12 keV range of NICER. We could not conclude anything definite about the orbital modulation, although the variability observed over 35 hours, namely the apparent modulation in Fig.6, supports this possibility. Fig. 7 also shows that, even if there are spectral variations within hours, there have not been major differences on time scales of hours (NICER-NICER comparison, panel on the left) or of years (panel on the right, with the Chandra HETG and XMM-Newton RGS grating spectra compared to the spectrum observed with NICER). There were some small, but exceeding the cross-calibration uncertainties, flux differences between NICER exposures, and between the average spectrum observed in 2000 and in 2021. These variations were both in soft and the hard tail of the spectrum, so they do not seem to be due to variable, intrinsic absorption.
4 V1674 Her (Nova Her 2021): a magnetic nova
This nova was discovered as the transient TCP J18573095+1653396 on 2021 June 12.537 UT at mag. 8.4 by Seiji Ueda (Kushiro, Hokkaido, Japan). Munari et al. (2021) reported optical spectroscopic confirmation that this was indeed a nova in outburst. The optical decay from optical maximum - around V=6.2 - is quantified as t2 (time for a decay by 2 mag) and was as short as 2.5 days. Few novae have such a rapid decrease from peak optical luminosity, indicating a very energetic phenomenon. Like YZ Ret, V1674 Her in outburst was detected at all wavelengths from IR to gamma rays (Li, 2021; Aydi et al., 2020). The nova was observed in 2021 June with Swift and the XRT telescope did not detect a source between 2021 June 13 and 2021 June 18. After almost a week after the optical maximum, on 2021 June 18 a hard X-ray source appeared, followed on 2021 July 1st by the initial rise of a luminous supersoft X-ray source.
A modulation with a periodicity of 501.42770.0002 s was discovered in archival Zwicky Transient Facility images by Mroz et al. (2021); Drake et al. (2021) and it was followed by the discovery that a very close period is measurable in the supersoft X-ray source that appeared shortly after the outburst. Maccarone et al. (2021) reported a modulation with a 503.9 s period in a Chandra observation done for 10 ks on 2021 July 10 with the HRC-S camera, and in Pei et al. (2021a) we reported a modulation with a 501.80.7 s period in the initial NICER data. A second Chandra observation by Drake et al. (2021) revealed a period of 501.720.11 s in the 0-order light curve of an exposure of 30 ks done with the Chandra HRC-S camera and Low Energy Transmission Grating. The period measured at optical wavelengths before the outburst is not consistent, within the error estimate, with the one measured with Chandra by Drake et al. (2021), or even with a new, recent optical period of 501.5160.018 s measured by Patterson et al. (2021). Assuming the period is the one of the WD rotation, this is an indication of spin down due to ejected mass in the range 0.2-2 M⊙. In a paper in preparation (Dobrotka et al. 2022) a group of us will re-examine the Chandra lightcurves and try to determine whether, given the superimposed aperiodic variability and the non-sinusoidal shape of the modulation, the conclusion of a period change and/or different optical and X-ray periods can be confirmed. However, here we examine only the NICER data.
The fact that the period detected at optical wavelength at quiescence is very close to the one detected in supersoft X-rays in outburst has been interpreted as an indication that Nova Her may host a magnetized white dwarf, in a intermediate polar (IP) system. These systems host WDs whose magnetic field strengths reach several 105 Gauss. An accretion disk forms, but it is truncated where the ram pressure of the matter in the disk is equal to the magnetic pressure of the WD’s magnetic field (at the Alfvèn radius) and the matter is channeled to the poles. WDs in IPs are not synchronized with the orbital period like the more magnetized polars, and since the magnetic axes of the WD is generally inclined with respect to their rotation axes, the asynchronous primary is an oblique rotator. X-ray flux modulation with the WD spin period is one of the main observational properties, considered the best indirect proof of the IP nature in many systems in which direct measurements of circular polarization with current instrumentation yield only upper limits for the magnetic field. The cause of the short (around a minute) period modulation of the supersoft X-rays in outburst is not fully understood, but the modulation has been attributed to the WD rotation in three other recent novae in outburst, with periods of several minutes, detected again at quiescence, along with typical signatures of IPs: V4743 Sgr (Ness et al., 2003; Leibowitz et al., 2006; Dobrotka & Ness, 2017), V2491 Cyg (Ness et al., 2011; Zemko et al., 2015, 2018) and V407 Lup (Aydi et al., 2018, and Orio et al. 2021, in preparation). As described above for one of the proposed explanations for CAL 83, the modulation of the supersoft X-rays indicates non-homogeneous temperature on the surface of the WD, which presumably is hotter at the poles.
4.1 The NICER observations of V1674 Her and their timing analysis
V1674 Her was monitored with NICER on 45 different dates between 2021/07/10 and 2021/08/31, with daily frequency whenever it was possible. The X-ray light curve was previously followed with the Swift XRT, and although there always was a detectable X-ray source from the third day after optical maximum, initially there was a faint, non-supersoft X-ray source, most likely due to shocks in the ejected matter (see Drake et al., 2021).
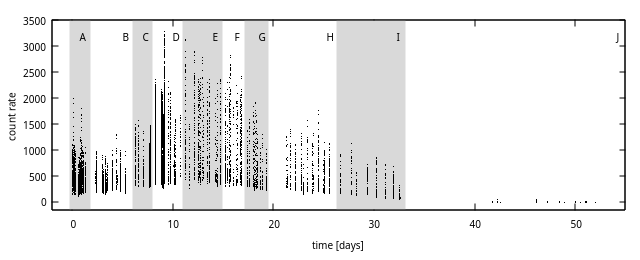
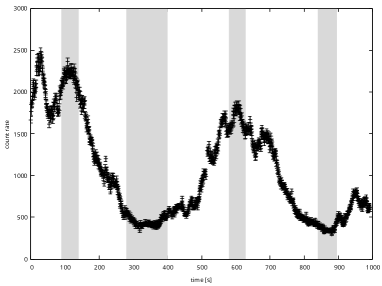
We started the NICER monitoring only after the luminous supersoft X-ray source was observed to rise with Swift. The data were again reduced as described for CAL 83, and the light curve we measured is shown in Fig. 8. The NICER exposures were not always continuous, and the total exposure time in one day varied from 476 s (not sufficiently long for period detection) to 15782 s. The modulation with the 501 s period is very clear throughout the whole period of NICER observations, including the late exposures when the count rate had decreased significantly (interval J in Fig. 8). However, there was also irregular variability almost every day, on time scales of a few seconds, and Figs. 9 and 10 show two examples of variability observed only within 24 hours in each case.
In Fig. 11, we show periodograms of the NICER exposures done in the time intervals marked from A to J in Fig. 8, namely from 2021 July 11 until 2021 July 12, from 2021 July 13 until 2021 July 22, from July22 to August 1, from August 1 to August 8, and from that day until August 31st. The peak frequency, listed in Table 6, is always clearly detected, until the end of the NICER observations, and always falls within the error derived in each interval. Because of the spacing between the single short exposures, in some cases covering even only one whole period, the plots show several aliases, but it is clear that the main frequency peak, corresponding to an average period 501.535 s, is well detected and unique. The peak frequency is always the same within a small uncertainty that we estimated by fitting a Gaussian to the peak of the power spectrum, and is also listed in Table 6. The derived uncertainty in the period was only -0.300 s when the signal-to-noise is the highest, and became -1.330/+1.340 s when the source was fading. Although the Gaussian fitting method gives a rather conservative estimate of the error compared with statistical methods, given the superimposed aperiodic variability we preferred it, and in this case we did not perform a Fisher randomization test. We concluded that the NICER data do not support the strong conclusions on the spin-down derived in Drake et al. (2021).
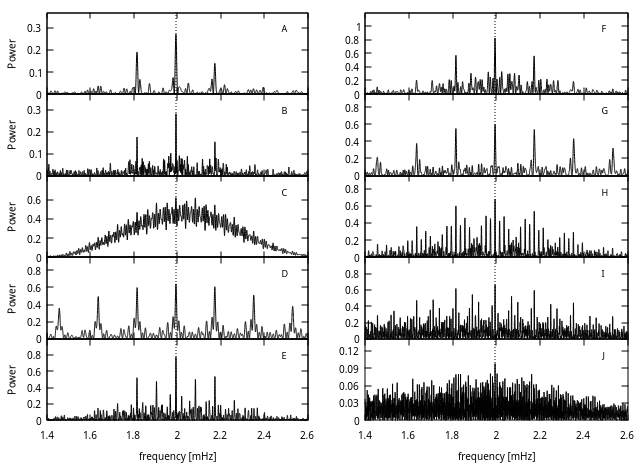
| Time interval | Frequency peak (mHz) |
|---|---|
| A | 1.99380.0031 |
| B | 1.99390.0012 |
| C | 1.99350.0044 |
| D | 1.99390.0033 |
| E | 1.99390.0012 |
| F | 1.99370.0021 |
| G | 1.99400.0024 |
| H | 1.99390.0009 |
| I | 1.99390.0006 |
| J | 1.99390.0004 |
As the light curve in Fig. 8 shows, the total unabsorbed average flux decreased since the beginning of August, and the source was observed with NICER until August 31, when the count rate had decreased to 1.3850.059 cts s-1. New observations with the Swift X-ray telescope (XRT) were done on September 9, 26-27, and October 10-15, still detecting the SSS with about constant flux between August 30 and October 16, and with a very similar X-ray spectral shape (see Fig. 15). The period was detected until the end of the NICER monitoring. We do not know whether the present X-ray flux is representative of the quiescent level over the next few years, because there may still be accelerated accretion due to irradiation, but since the quiescent IPs X-ray luminosity is on average larger than 1032 erg s-1, at a distance of 5 kpc (see discussion Drake et al., 2021, and references therein) we expect that V1674 Her will still be detectable in a few months after the nova has returned to quiescence, and detecting the period in the accreting quiescent source will be an important test of its IP nature.
4.2 The X-ray spectral evolution of Nova her 2021
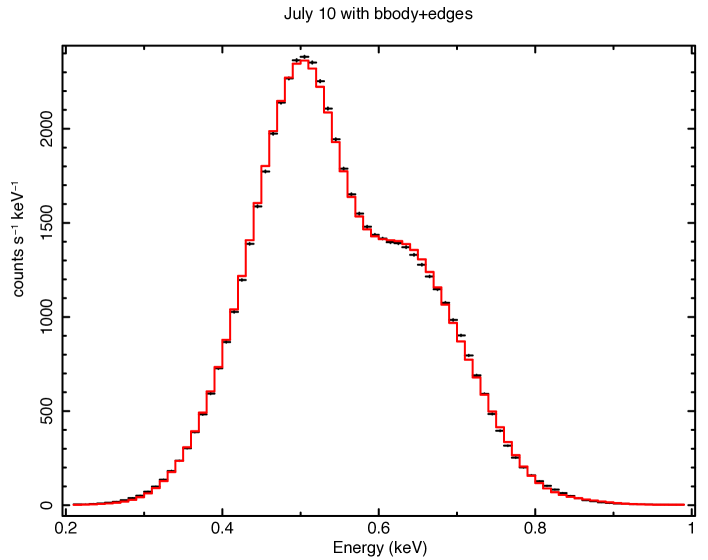
Drake et al. (2021) do not discuss spectral models that fits the Chandra LETG spectrum observed on 2021 July 19 by their collaboration, limiting the analysis to identifying spectral lines. However, they also present Swift XRT monitoring and examine simple models to fit the Swift X-ray spectra of the nova. They find a fit with a blackbody with four added absorption edges (assumed to be of N VI at 0.55 keV, N VII at 0.67 keV, O VII at 0.74 keV and O VIII at 0.87 keV to simulate typical edges observed in such a hot atmosphere), or with the model grid we used above for CAL 83 and solar abundances, specifically the rauch-H-Ca-solar-90.fits model. They suggest a constant column density N(H)=2.9 10-21 cm-2 (approximately the value estimated in the direction of the nova, without intrinsic contribution) and a constant blackbody temperature of about 61 eV between days 18.9 and 27.7 after the optical maximum. After this period the blackbody temperature increased and reached an astounding value of 125 eV (145,000 K) on day 44.2, later oscillating between 65 and 85 eV. Although we confirm the goodness of these fits to many of the Swift data, the better S/N, larger calibrated energy range and same or better spectral resolution of NICER (Prigozhin et al., 2016) allow to observe a more structured spectrum than the one measured with Swift, and reveal that the models used for Swift are not adequate for better quality spectra.
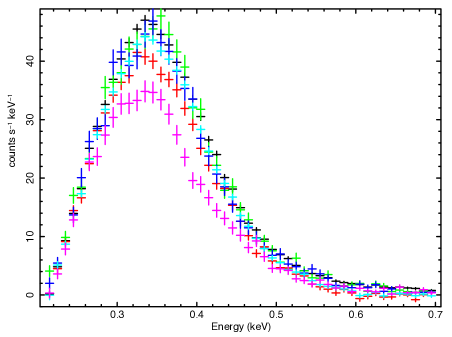
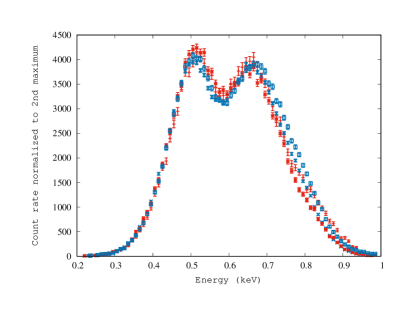
For the average NICER spectra of different exposures, both on the same day and on different dates, we measured a very similar spectral shape. However, in Fig. 12 we show the spectra extracted during the first exposure done on 2021 July 20 in short (100-150 s) intervals around the maxima and minima, normalized to the level of count rate in the 0.2-0.4 cts s-1 range of the first of the two maxima. We notice some hardening during minima, that appears evident when we compare the “softness ratio”, that for this source we defined as the ratio of the count rate in the 0.2-0.5 keV divided by the count rate in the 0.5-1.0 keV: 0.25 and 0.27 for the two maxima, and 2.77 and 2.41 during the minima. This difference indicates that the flux decrease may be due to column density variations. We repeated the exercise for maxima and minima during other GTIs and exposures, finding that, around the time of the minima, we consistently seem to measure a larger ratio of count rate in the 0.5-10 keV range to that in the 0.2-0.5 keV range than around the maxima. The “high state” average spectrum versus “low state” average spectrum comparison in Fig. 3 of Drake et al. (2021) for the Chandra spectrum around minima showed more flux compared to the continuum level for emission lines of iron in the 0.776-0.886 keV region, of O VIII at 0.654 keV and O VII at 0.574 keV, and of N VII at 0.500 keV, than the average spectrum extracted close to the maxima. These emission lines are not resolved with NICER, so even comparing maximum and minimum spectra obtained during the same period cycle does not allow to clarify whether the less soft spectrum is due to emission lines that are more prominent above the continuum. We cannot rule out that the variation is due only to the plasma that emits the emission lines, rather than to the WD atmospheric flux, which at this temperature should have only absorption features (Rauch et al., 2010).
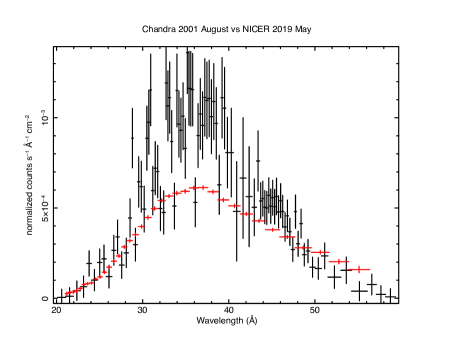
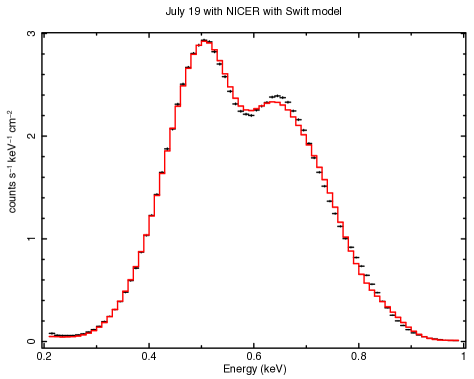
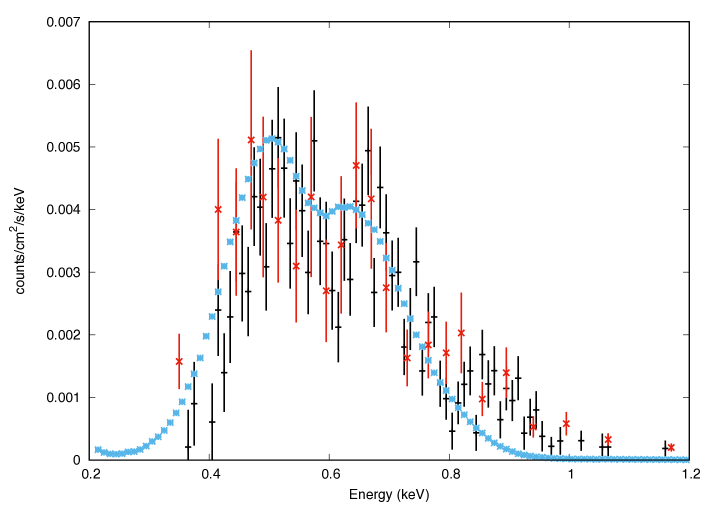
We also suggest that the difficulty in fitting the data, at least since July 13, is due to these strong emission lines, measurable only in the single Chandra grating exposure. In Fig. 13 we show the NICER spectrum observed on 2021 July 19 and the Chandra LETG spectrum observed on the same day, which is complex and rich in both emission and absorption features. We also overplot the fit to both spectra with a blackbody and absorption edges used for the Swift spectra of the same period (Drake et al., 2021). This is the best fit we obtained to the NICER data with only one component, but it is not rigorous, yielding a reduced value larger than 1. The deviation from an atmospheric spectrum due the emission lines appears clearly in the panel on the right, showing the Chandra spectrum. The prominent, superimposed emission lines, must originate in one or more additional components. We concluded that the blackbody with absorption edges is not a significant model for the SSS phase of V1674 Her, and that the effective temperature of the WD cannot be estimated in this way.
Until we have a rigorous model for the Chandra LETG spectrum of the supersoft source (which should be the subject of an upcoming paper), we cannot draw any conclusions on the effective temperature, which is related to the WD mass. We note that the atmospheric fits are closer to converge only using the grid without enhanced abundances, and at a temperature not exceeding 900,000 K, which is significantly lower than the temperature obtained with the fits to the Swift spectra (Drake et al., 2021) with blackbody and absorption edges (the column density in this case N(H) would be higher). However, the only definite conclusion we can draw is not based on the model fits, and is that by comparison with other novae’s SSS spectra (see Fig. 3 of Drake et al., 2021) V1674 Her was quite “harder” than average, indicating a very massive WD.
One interesting characteristic of two novae that in recent years have been found to be IPs is that the supersoft luminosity emission region appeared to shrink rather than cool during the luminosity decay (Page, 2012; Aydi et al., 2018). In Fig. 15 we show that this seems to have been the case also for V1674 Her. If the SSS was cooling, it was only by a very small amount, as the source flux was decreasing much faster than what may be attributed to decreasing temperature. A likely interpretation is that the burning ended later at the poles than in the rest of the WD, possibly fed by renewed accretion. Also in quiescence, three IP-novae retained a very soft emission region, albeit at much lower luminosity, with about the same effective temperature as the nova in outburst (Zemko et al., 2015, 2016), Orio et 1l. 2021, in preparation.
5 YZ Ret: a so far unique “VY Scl” nova
YZ Ret (Nova Ret 2020, also called EC03572-5455 and MGAB-V207 in different surveys) was discovered in outburst on 2020-07-11.76 at magnitude V5 by Mc Naught (2020, CBET, 4811, 1) but the nova was unreported for about a week, because pre-discovery images were later examined and the nova was found to have erupted on 2020-07-08.171 (see Sokolovsky et al., 2021, and references therein). It was classified as a nova in eruption thanks to optical spectra first obtained by Aydi et al. (2020). Two peculiarities made this nova interesting for our study: in the first place, it is the first known VY Scl system to have been observed in a nova outburst (see Li et al., 2020; Sokolovsky et al., 2021). VY Scl are nova-like binaries that undergo transient periods of fading of the optical light by 1.5 to 7 mag in less than 150 days, lasting from weeks to years. In the more common “high state”, VY Scl have large optical and UV luminosity, and this is interpreted as evidence that most of the time mass transfer onto the WD occurs at the high rate M⊙ yr-1, to sustain an accretion disc in a stable hot state in which dwarf novae outbursts are suppressed. The low states have been attributed to a sudden drop of from the secondary, or even to a total cessation of mass transfer (King & Cannizzo, 1998; Hessman, 2000); perhaps due to spots on the surface of the secondary covering the L1 point (Livio & Pringle, 1994) or non-equilibrium of the irradiated atmosphere of the donor (see Wu et al., 1995).
Monitoring the X-rays emission of a few VY Scl WD binaries, no indications have been found of a previously hypothesized SSS, expected with high because of non-explosive thermonuclear burning (see Zemko et al., 2014, and references therein). At least for one VY Scl, V794 Aql, there is no clear correlation between optical and X-ray luminosity (Sun et al., 2020). Mass transfer may be very irregular or sporadic for these systems, due to a complicated interplay between the two binary components affecting the thermal state of the donor. YZ Ret has proven that even if thermonuclear burning does occur, it must last for quite some time and end in a nova outburst, instead of being steady and without outflows as expected for SNe Ia progenitors (e.g. models by van den Heuvel et al., 1992).
The other peculiarity of this nova is that, unlike most Galactic novae which are often concentrated towards the Galactic bulge, it is located away from the Galactic plane, with a very low column density of only about 1.2-1.3 cm-2.
5.1 NICER observations of YZ Ret
We observed the nova with NICER in 20 intervals of about 1000 s each, during an overall time of 29.71 hours starting on 2020 September 28 at 15:25:44 UT. The light curve over all this period of observation is shown in Fig. 16. No periodic modulation could be detected in the NICER light curve.
In Pei et al. (2020) we announced the observation and measurement of the X-ray source. We found that, since the column density was known and the distance determined with the GAIA parallax is 2.7 kpc (Bailer-Jones et al., 2018), an attempt to fit the spectrum with an atmospheric model yielded a relatively poor fit, but was sufficient to obtain an order of magnitude of the X-ray flux. We found that the X-ray luminosity was too low to be originating from all, of most of, the surface of a hydrogen burning WD, only about 2.5 erg s-1 (see Fig. 17). We confirm this result: the closest fit obtained with a model atmosphere (nova model SSS-003-00010-00060.bin-0.002-9.00.fits in the grid by Rauch, see above) yields a reduced of 1.37 with 75 degrees of freedom, with Teff=534,000 K and N(H)=3.3 cm-2. The bolometric luminosity would be only erg s-1 at distance of 2.7 kpc.
An observation with XMM-Newton, including use of the RGS grating and done 5 days earlier, explains the low flux: the system must be at high inclination, because no stellar continuum was detected. The spectrum was an emission line one (Sokolovsky et al., 2021), probably due to photoionized ejecta and with no spectral signatures of shocked material in collisional ionization equilibrium. Although this conclusion cannot be reached by examining our NICER broad band spectrum, the bolometric luminosity derived is of order 1/1000 of that expected for a burning WD atmosphere, about the same as in the XMM-Newton observation, so clearly this does not support the possibility that the spectrum changed and the central WD SSS spectrum emerged during the 5 days intercurring between our NICER exposures and the data taken by Sokolovsky et al. (2021). In a different project collaboration, some of us observed the nova after another month with the Chandra LETG, and although the spectrum had considerably changed and softened in comparison with the observations reported by Sokolovsky et al. (2021) and with our NICER broad band spectra, it was, once again, an emission line one, without a measurable stellar continuum (Drake et al., 2020, and Orio et al. 2022, in preparation).

6 Conclusions
We have observed four SSS with NICER, two persistent sources in close binaries and two transient ones (two novae). The types of objects we observed span almost all the types of WD binaries. The two close binaries appear to be, respectively, a CV-like binary with possibly an unusually massive donor, clearly observed at low inclination (CAL 83), and a short-period symbiotic with a yellow donor (MR Vel). The two novae are very likely to be also an IP (V167Her) and a VY Scl nova-like (YZ Ret).
The two SSS non-nova close binaries, specifically MR Vel, and CAL 83 in its most common “high” state, had almost unvaried SSS spectra since the last observation performed 21 and 13 years ago, respectively. MR Vel was observed with almost the same X-ray flux. Although the flux of CAL 83 varies and there are occasional minima when the SSS becomes undetectable, the maximum flux is also about the same. It is remarkable that this source has not been observed to change significantly over 40 years of X-ray observations.
The large deviations from the continuum of a WD atmosphere and especially the orders of magnitude lower SSS flux of YZ Ret indicates that the WD was never observed in this nova. This is understood if the nova system is observed at high inclination (see Ness et al., 2013). In agreement with the detection of an emission line spectrum with X-ray gratings close to the time of the NICER observations and even much later, we attribute the SSS flux to the ejecta, which may have either been shocked or photoionized. Given the repeated observations with different satellites at different post-outburst times, we rule out with confidence that a very short-lived SSS phase with WD emission was ever observable for this nova.
The 67 s period of CAL 83 is only measurable in X-rays and it has an irregular drift in length, by about 3%. Our simulations and a rigorous statistical analysis were not conclusive using the short NICER exposures, but by going back to the most recent XMM-Newton exposure, which was much longer and without interruptions, we found that this drift appears to be real and not an artifact of varying amplitude, although the amplitude of the modulations is also often observed to vary.
We confirm the evidence pointing to rotation of a magnetic WD as the cause of the modulation of V1674 Her, although in outburst the X-ray luminosity was not due to accretion onto the pole, and only originated in shell burning. Thus, the WD superficial temperature may not have been homogeneous during the SSS phase, explaining also the difficulty in obtaining a unique and rigorous spectral fit.
The flux of V1674 Her had irregular fluctuations superimposed on the regular modulation, confirming the aperiodic variability detected in other nova SSS (e.g. N SMC 2016, Orio et al. (2018), and N LMC 2009 Orio et al. (2021)).
Because of superimposed emission lines - revealed by a Chandra high resolution spectrum - we were not able to obtain a rigorous fit to most of the NICER spectra. Although the SSS spectrum of V1674 Her was “harder” than the SSS spectra of other novae, with the higher S/N and better supersoft response of NICER we could not confirm the extremely high peak temperature of 1,450,000 K suggested by fitting Swift spectra (Drake et al., 2021).
Comparing the V1674 Her count rate and spectrum around maximum and minimum of the 501 s period, we find that the soft flux is not more absorbed at minimum, so the flux periodic variation is not due to periodically varying absorption. The interpretation we suggest is that there is a “SSS-obscure” region, that has much lower effective temperature and does not emit X-rays, possibly around the equator, with a sharp gradient between the SSS and non-SSS regions. The SSS regions must occupy a large portion of the surface, because the SSS flux does not disappear during the minima.
The 501 s (8.35 minutes) period in V1674 Her was constant (within the precision of our timing analysis) during the post-eruption luminous SSS phase, and a very close period was measured in optical in quiescence and in outburst. Within the precision of the NICER data, we could not confirm the putative spin-up of the WD after the outburst.
The fading of V1674 Her without significant spectral changes indicates that the SSS emitting region shrunk before cooling, a phenomenon suggested to occur also in other “magnetic novae”.
We only observed periodic modulations in two SSS (nova V1674 Her and the non-nova close binary CAL 83) in which there are clear indications that we observed the WD surface, while no such modulations were measured in two sources (again, a nova - YZ Ret - and a non-nova - MR Vel) in which we only observed a wind or an outflow. Considering also that the oscillations were never observed in other SSS whose spectrum is dominated by emission lines, and whose flux is much lower than in SSS in which the WD atmospheric continuum was observed, this pinpoints at the root cause of the periodic flux modulations as a phenomenon occurring on the WD surface or very close to it. Of course, there are also nova and non-nova SSS in which the WD was observed, but periodic modulations were never measured (see Ness et al., 2015, who list 18 SSS in which they searched for minute long oscillations, finding them only in 5 of them, with a duty-cycle even as short as 11%). Only 3 out of the 18 sources in this paper (CAL 87, U Sco and V959 Mon) are at high inclination, and only CAL 87 has a X-ray spectrum that is completely dominated by emission lines like MR Vel and YZ Ret. However, there are a few caveats. First of all, 5 other of those 18 sources show modulations of the X-ray flux with tens of minutes (see Table 1), bringing the total number of X-ray sources with quasi-periodic or periodic SSS modulations to 10 out of 18. If the modulations with periods of tens of minutes and those with 1 minute long oscillations are mutually exclusive, as in this sample of SSS, this may be a clue to a rotational nature of the shorter oscillations, per analogy with the longer ones. A parameter to notice is the effective temperature of the non-periodic SSS, as estimated in the papers referenced in Table 1. We find that on average, they have lower temperature, although there is an overlap with the range of temperature of the periodic sources. The lower average temperature of the non-periodic SSS means that also their average X-ray luminosity is lower, hindering the timing analysis because of the lower S/N. Finally, we note that the “duty cycle” (the fraction of time in which the modulation is measurable) of the two sources observed with NICER and described in this paper is about 70% for CAL 83 and 100% for V1674 Her, higher than all measurements of Ness et al. (2015). For the recent outburst of RS Oph, in a separate, still unpublished paper in preparation by Orio et al. (2022) we found a 100% duty cycle of a 35 s oscillations, compared to only 16% found in 2006 by Ness et al. (2015) with lower S/N data. We can speculate that the variable amplitude of the period may make the modulation undetectable when the S/N of the measurement is low, the amplitude of the fluctuation is small, and the period is short. Does the modulation really disappear for part of the time and is it really not present in almost half of the SSS with an observable WD? We would like to argue that the jury is still out, and that NICER with its high S/N may allow to answer in the next few years, with more observations of SSS.
Acknowledgement
MO and MG were supported by NASA awards for NICER cycles AO1, AO2 and AO3. SP was funded by a PhD stipend of the China Scholarship Council. AD and J. Magdolen were supported by the Slovak grant VEGA 1/0408/20, and by the Operational Programme Research and Innovation for the project: Scientific and Research Centre of Excellence SlovakION for Material and Interdisciplinary Research”, ITMS2014+ : 313011W085 co-financed by the European Regional Development Fund. GJML is member of the CIC-CONICET (Argentina) and acknowledges support from grant ANPCYT-PICT 0901/2017. J. Mikolajewska was financed by Polish National Science Centre grants 2015/18/A/ST9/00746 and 2017/27/B/ST9/01940.
References
- Adamczak et al. (2012) Adamczak, J., Werner, K., Rauch, T., et al. 2012, A&A, 546, A1, doi: 10.1051/0004-6361/201219718
- Aydi et al. (2018) Aydi, E., Orio, M., Beardmore, A. P., et al. 2018, MNRAS, 480, 572, doi: 10.1093/mnras/sty1759
- Aydi et al. (2020) Aydi, E., Buckley, D. A. H., Chomiuk, L., et al. 2020, The Astronomer’s Telegram, 13867, 1
- Bailer-Jones et al. (2021) Bailer-Jones, C. A. L., Rybizki, J., Fouesneau, M., Demleitner, M., & Andrae, R. 2021, VizieR Online Data Catalog, I/352
- Bailer-Jones et al. (2018) Bailer-Jones, C. A. L., Rybizki, J., Fouesneau, M., Mantelet, G., & Andrae, R. 2018, AJ, 156, 58, doi: 10.3847/1538-3881/aacb21
- Bearda et al. (2002) Bearda, H., Hartmann, W., Ebisawa, K., et al. 2002, A&A, 385, 511, doi: 10.1051/0004-6361:20020104
- Beardmore et al. (2019) Beardmore, A. P., Page, K. L., Markwardt, C. B., et al. 2019, The Astronomer’s Telegram, 13086, 1
- Booth et al. (2016) Booth, R. A., Mohamed, S., & Podsiadlowski, P. 2016, MNRAS, 457, 822, doi: 10.1093/mnras/stw001
- Chiosi et al. (2014) Chiosi, E., Orio, M., Bernardini, F., Henze, M., & Jamialahmadi, N. 2014, MNRAS, 443, 1821, doi: 10.1093/mnras/stu1145
- Córsico & Althaus (2014) Córsico, A. H., & Althaus, L. G. 2014, ApJ, 793, L17, doi: 10.1088/2041-8205/793/1/L17
- Crampton et al. (1987) Crampton, D., Cowley, A. P., Hutchings, J. B., et al. 1987, ApJ, 321, 745, doi: 10.1086/165667
- Dobrotka & Ness (2017) Dobrotka, A., & Ness, J. U. 2017, MNRAS, 467, 4865, doi: 10.1093/mnras/stx442
- Dobrotka et al. (2021) Dobrotka, A., Orio, M., Benka, D., & Vanderburg, A. 2021, A&A, 649, A67, doi: 10.1051/0004-6361/202039742
- Drake et al. (2020) Drake, J. J., Orio, M., Bearmore, A., et al. 2020, The Astronomer’s Telegram, 14214, 1
- Drake et al. (2003) Drake, J. J., Wagner, R. M., Starrfield, S., et al. 2003, ApJ, 584, 448, doi: 10.1086/345534
- Drake et al. (2021) Drake, J. J., Ness, J.-U., Page, K. L., et al. 2021, arXiv e-prints, arXiv:2110.14058. https://arxiv.org/abs/2110.14058
- Greiner & Di Stefano (2002) Greiner, J., & Di Stefano, R. 2002, A&A, 387, 944, doi: 10.1051/0004-6361:20020463
- Güver & Özel (2009) Güver, T., & Özel, F. 2009, MNRAS, 400, 2050, doi: 10.1111/j.1365-2966.2009.15598.x
- Hessman (2000) Hessman, F. V. 2000, New A Rev., 44, 155, doi: 10.1016/S1387-6473(00)00030-0
- King & Cannizzo (1998) King, A. R., & Cannizzo, J. K. 1998, ApJ, 499, 348, doi: 10.1086/305630
- Lanz et al. (2005) Lanz, T., Telis, G. A., Audard, M., et al. 2005, ApJ, 619, 517, doi: 10.1086/426382
- Leibowitz et al. (2006) Leibowitz, E., Orio, M., Gonzalez-Riestra, R., et al. 2006, MNRAS, 371, 424, doi: 10.1111/j.1365-2966.2006.10684.x
- Li (2021) Li, K.-L. 2021, The Astronomer’s Telegram, 14705, 1
- Li et al. (2020) Li, K.-L., Kong, A., Aydi, E., et al. 2020, The Astronomer’s Telegram, 13868, 1
- Linnell Nemec & Nemec (1985) Linnell Nemec, A. F., & Nemec, J. M. 1985, AJ, 90, 2317, doi: 10.1086/113936
- Livio (1998) Livio, M. 1998, in Astronomical Society of the Pacific Conference Series, Vol. 137, Wild Stars in the Old West, ed. S. Howell, E. Kuulkers, & C. Woodward, 264
- Livio & Pringle (1994) Livio, M., & Pringle, J. E. 1994, ApJ, 427, 956, doi: 10.1086/174202
- Löbling et al. (2019) Löbling, L., Rauch, T., Miller Bertolami, M. M., et al. 2019, MNRAS, 489, 1054, doi: 10.1093/mnras/stz1994
- Long et al. (1981) Long, K. S., Helfand, D. J., & Grabelsky, D. A. 1981, ApJ, 248, 925, doi: 10.1086/159222
- Maccarone et al. (2021) Maccarone, T. J., Beardmore, A., Mukai, K., et al. 2021, The Astronomer’s Telegram, 14776, 1
- Mennickent et al. (2003) Mennickent, R. E., Matsumoto, K., & Diaz, M. 2003, A&A, 402, 315, doi: 10.1051/0004-6361:20030262
- Mereghetti et al. (2009) Mereghetti, S., Tiengo, A., Esposito, P., et al. 2009, Science, 325, 1222, doi: 10.1126/science.1176252
- Mereghetti et al. (2021) Mereghetti, S., Pintore, F., Rauch, T., et al. 2021, MNRAS, 504, 920, doi: 10.1093/mnras/stab1004
- Mikołajewska et al. (2021) Mikołajewska, J., Iłkiewicz, K., Gałan, C., et al. 2021, MNRAS, 504, 2122, doi: 10.1093/mnras/stab1058
- Motch (1998) Motch, C. 1998, A&A, 338, L13. https://arxiv.org/abs/astro-ph/9807226
- Motch et al. (2002) Motch, C., Bearda, H., & Neiner, C. 2002, A&A, 393, 913, doi: 10.1051/0004-6361:20020966
- Mroz et al. (2021) Mroz, P., Burdge, K., Roestel, J. v., et al. 2021, The Astronomer’s Telegram, 14720, 1
- Munari et al. (2021) Munari, U., Valisa, P., & Dallaporta, S. 2021, The Astronomer’s Telegram, 14704, 1
- Nelson et al. (2008) Nelson, T., Orio, M., Cassinelli, J. P., et al. 2008, ApJ, 673, 1067, doi: 10.1086/524054
- Ness et al. (2003) Ness, J. U., Starrfield, S., Burwitz, V., et al. 2003, ApJ, 594, L127, doi: 10.1086/378664
- Ness et al. (2011) Ness, J. U., Osborne, J. P., Dobrotka, A., et al. 2011, ApJ, 733, 70, doi: 10.1088/0004-637X/733/1/70
- Ness et al. (2013) Ness, J. U., Osborne, J. P., Henze, M., et al. 2013, A&A, 559, A50, doi: 10.1051/0004-6361/201322415
- Ness et al. (2015) Ness, J. U., Beardmore, A. P., Osborne, J. P., et al. 2015, A&A, 578, A39, doi: 10.1051/0004-6361/201425178
- Odendaal & Meintjes (2017) Odendaal, A., & Meintjes, P. J. 2017, MNRAS, 467, 2797, doi: 10.1093/mnras/stx233
- Odendaal et al. (2014) Odendaal, A., Meintjes, P. J., Charles, P. A., & Rajoelimanana, A. F. 2014, MNRAS, 437, 2948, doi: 10.1093/mnras/stt2111
- Orio (2013) Orio, M. 2013, The Astronomical Review, 8, 71, doi: 10.1080/21672857.2013.11519714
- Orio et al. (2010) Orio, M., Nelson, T., Bianchini, A., Di Mille, F., & Harbeck, D. 2010, ApJ, 717, 739, doi: 10.1088/0004-637X/717/2/739
- Orio et al. (2018) Orio, M., Ness, J. U., Dobrotka, A., et al. 2018, ApJ, 862, 164, doi: 10.3847/1538-4357/aacf06
- Orio et al. (2021) Orio, M., Dobrotka, A., Pinto, C., et al. 2021, MNRAS, 505, 3113, doi: 10.1093/mnras/stab1391
- Osborne et al. (2001) Osborne, J. P., Borozdin, K. N., Trudolyubov, S. P., et al. 2001, A&A, 378, 800, doi: 10.1051/0004-6361:20011228
- Osborne et al. (2011) Osborne, J. P., Page, K. L., Beardmore, A. P., et al. 2011, ApJ, 727, 124, doi: 10.1088/0004-637X/727/2/124
- Page (2012) Page, K. L. 2012, Mem. Soc. Astron. Italiana, 83, 815
- Page et al. (2020) Page, K. L., Kuin, N. P. M., Beardmore, A. P., et al. 2020, MNRAS, 499, 4814, doi: 10.1093/mnras/staa3083
- Patterson et al. (2021) Patterson, J., Epstein-Martin, M., Vanmunster, T., & Kemp, J. 2021, The Astronomer’s Telegram, 14856, 1
- Pei et al. (2021a) Pei, S., Luna, G. J. M., Orio, M., et al. 2021a, The Astronomer’s Telegram, 14798, 1
- Pei et al. (2021b) Pei, S., Orio, M., Ness, J.-U., & Ospina, N. 2021b, MNRAS, 507, 2073, doi: 10.1093/mnras/stab2298
- Pei et al. (2020) Pei, S., Orio, M., Gendreau, K., et al. 2020, The Astronomer’s Telegram, 14067, 1
- Pei et al. (2021c) —. 2021c, The Astronomer’s Telegram, 14901, 1
- Peretz et al. (2016) Peretz, U., Orio, M., Behar, E., et al. 2016, ApJ, 829, 2, doi: 10.3847/0004-637X/829/1/2
- Popham & di Stefano (1996) Popham, R., & di Stefano, R. 1996, Accretion Disks in Supersoft X-Ray Sources, ed. J. Greiner, Vol. 472, 65, doi: 10.1007/BFb0102247
- Popov et al. (2018) Popov, S. B., Mereghetti, S., Blinnikov, S. I., Kuranov, A. G., & Yungelson, L. R. 2018, MNRAS, 474, 2750, doi: 10.1093/mnras/stx2910
- Prigozhin et al. (2016) Prigozhin, G., Gendreau, K., Doty, J. P., et al. 2016, in Society of Photo-Optical Instrumentation Engineers (SPIE) Conference Series, Vol. 9905, Space Telescopes and Instrumentation 2016: Ultraviolet to Gamma Ray, ed. J.-W. A. den Herder, T. Takahashi, & M. Bautz, 99051I, doi: 10.1117/12.2231718
- Rajoelimanana et al. (2013) Rajoelimanana, A. F., Charles, P. A., Meintjes, P. J., Odendaal, A., & Udalski, A. 2013, MNRAS, 432, 2886, doi: 10.1093/mnras/stt645
- Rauch et al. (2010) Rauch, T., Orio, M., Gonzales-Riestra, R., et al. 2010, ApJ, 717, 363, doi: 10.1088/0004-637X/717/1/363
- Rohrbach et al. (2009) Rohrbach, J. G., Ness, J. U., & Starrfield, S. 2009, AJ, 137, 4627, doi: 10.1088/0004-6256/137/6/4627
- Scargle (1982) Scargle, J. D. 1982, ApJ, 263, 835, doi: 10.1086/160554
- Schmidtke & Cowley (2001) Schmidtke, P. C., & Cowley, A. P. 2001, AJ, 122, 1569, doi: 10.1086/322155
- Schmidtke et al. (2000) Schmidtke, P. C., Cowley, A. P., Taylor, V. A., Crampton, D., & Hutchings, J. B. 2000, AJ, 120, 935, doi: 10.1086/301482
- Smith et al. (2001) Smith, V. V., Pereira, C. B., & Cunha, K. 2001, ApJ, 556, L55, doi: 10.1086/322864
- Sokolovsky et al. (2021) Sokolovsky, K. V., Li, K.-L., Lopes de Oliveira, R., et al. 2021, arXiv e-prints, arXiv:2108.03241. https://arxiv.org/abs/2108.03241
- Southwell et al. (1996) Southwell, K. A., Livio, M., Charles, P. A., O’Donoghue, D., & Sutherland, W. J. 1996, ApJ, 470, 1065, doi: 10.1086/177931
- Starrfield et al. (2012) Starrfield, S., Timmes, F. X., Iliadis, C., et al. 2012, Baltic Astronomy, 21, 76, doi: 10.1515/astro-2017-0361
- Sun et al. (2020) Sun, B., Orio, M., Dobrotka, A., et al. 2020, MNRAS, 499, 3006, doi: 10.1093/mnras/staa3012
- Trudolyubov & Priedhorsky (2008) Trudolyubov, S. P., & Priedhorsky, W. C. 2008, ApJ, 676, 1218, doi: 10.1086/526397
- van den Heuvel et al. (1992) van den Heuvel, E. P. J., Bhattacharya, D., Nomoto, K., & Rappaport, S. A. 1992, A&A, 262, 97
- Wolf et al. (2013) Wolf, W. M., Bildsten, L., Brooks, J., & Paxton, B. 2013, ApJ, 777, 136, doi: 10.1088/0004-637X/777/2/136
- Wolf et al. (2018) Wolf, W. M., Townsend, R. H. D., & Bildsten, L. 2018, ApJ, 855, 127, doi: 10.3847/1538-4357/aaad05
- Worters et al. (2007) Worters, H. L., Eyres, S. P. S., Bromage, G. E., & Osborne, J. P. 2007, MNRAS, 379, 1557, doi: 10.1111/j.1365-2966.2007.12066.x
- Wu et al. (1995) Wu, K., Wickramasinghe, D. T., & Warner, B. 1995, PASA, 12, 60, doi: 10.1017/S132335800002004X
- Yaron et al. (2005) Yaron, O., Prialnik, D., Shara, M. M., & Kovetz, A. 2005, ApJ, 623, 398, doi: 10.1086/428435
- Zemko et al. (2015) Zemko, P., Mukai, K., & Orio, M. 2015, ApJ, 807, 61, doi: 10.1088/0004-637X/807/1/61
- Zemko et al. (2016) Zemko, P., Orio, M., Mukai, K., et al. 2016, MNRAS, 460, 2744, doi: 10.1093/mnras/stw1199
- Zemko et al. (2014) Zemko, P., Orio, M., Mukai, K., & Shugarov, S. 2014, MNRAS, 445, 869, doi: 10.1093/mnras/stu1783
- Zemko et al. (2018) Zemko, P., Ciroi, S., Orio, M., et al. 2018, MNRAS, 480, 4489, doi: 10.1093/mnras/sty2061