Current and future neutrino limits
on the abundance of
primordial black holes
Abstract
Primordial black holes (PBHs) formed in the early Universe are sources of neutrinos emitted via Hawking radiation. Such astrophysical neutrinos could be detected at Earth and constraints on the abundance of comet-mass PBHs could be derived from the null observation of this neutrino flux. Here, we consider non-rotating PBHs and improve constraints using Super-Kamiokande neutrino data, as well as we perform forecasts for next-generation neutrino (Hyper-Kamiokande, JUNO, DUNE) and dark matter (DARWIN, ARGO) detectors, which we compare. For PBHs less massive than g, PBHs would have already evaporated by now, whereas more massive PBHs would still be present and would constitute a fraction of the dark matter of the Universe. We consider monochromatic and extended (log-normal) mass distributions, and a PBH mass range spanning from g to g. Finally, we also compare our results with previous ones in the literature.
PI/UAN-2021-691FT
IFIC/22-08
1 Introduction
The recent advances in the field of gravitational wave astronomy have renewed the interest from the scientific community in the possibility of discovering black holes (BHs) that would have been generated in the infancy of the Universe, before big bang nucleosynthesis (BBN). These primordial black holes (PBHs), first considered decades ago [1, 2], have gathered even more attention after the first detection by LIGO and VIRGO of gravitational waves emitted by the merger of a binary BH system [3]. The question whether the observed merger events correspond to BHs of astrophysical or primordial origin is still under debate, and a mixed population may also be compatible with observations [4, 5, 6, 7, 8, 9].
PBHs present several observational effects that makes them fascinating objects, and allow us to place stringent bounds on their abundance for a broad range of masses, from ton-mass PBHs to super-massive BHs. Among the myriad of probes employed to bound the allowed population of PBHs, one can highlight the non-observation of microlensing events [10, 11, 12, 13, 14, 15], accretion signatures on the cosmic microwave background (CMB) [16, 17] or on the EDGES 21-cm signal [18], disruption of stellar systems by the presence of PBHs [19, 20], effects on the Lyman- forest [21], and merger rates from gravitational waves [22, 23, 24, 25, 26, 27, 28, 8]. Moreover, future experiments could improve these bounds, as different forecasts show for next generation gravitational waves detectors [29, 30, 31, 32, 33], spectral distortions of the CMB [34] and 21-cm cosmology [35, 36] (see, e.g., Refs. [37, 38, 39, 40, 41] for recent reviews regarding current constraints, formation and abundance of PBHs).
A particularly captivating effect is the evaporation of BHs. Due to quantum effects in curved spacetime, BHs emit particles at their event horizon, which is known as Hawking radiation [42, 43]. PBH evaporation due to Hawking radiation allows setting stringent bounds on their abundance for PBH masses g, mainly through the observation of the extragalactic X-ray and -ray background [44, 45, 46, 47, 48, 49], radio signals [50], their impact on BBN abundances [51, 44, 52], anisotropies and spectral distortions of the CMB spectrum [53, 54, 55, 56, 57, 52], INTEGRAL and COMPTEL observations of the Galactic Center [58, 59, 60, 61, 62], electron and positron detections at Voyager 1 [63], and the claimed EDGES 21-cm signal [64, 65, 66, 67, 68, 69, 70].
Neutrinos would also be emitted as Hawking radiation during the evaporation of PBHs and henceforth, could be detected at neutrino observatories. Neutrino astronomy was initiated with the simultaneous detection of neutrino events originated from the supernova 1987A at the Kamiokande [71], IMB [72] and Baksan [73] detectors. Since then, many efforts have been devoted to seek for more neutrinos emitted at supernova occurrences [74, 75], from the diffuse supernova background (DSNB) [76, 77], and from other astrophysical sources [78, 79]. Future neutrino detectors, like Hyper-Kamiokande [80], JUNO [81] and DUNE [82] may become indispensable for detecting low-energy (in the range of tens of MeV) neutrinos of cosmic origin. Moreover, detectors for direct dark matter (DM) detection, such as DARWIN [83] and ARGO [84], may reach a good enough sensitivity to measure the neutrino floor and detect neutrino events from cosmic origin and others via coherent elastic neutrino-nucleus scattering (CENS) [85, 86, 87, 88, 89, 90].
Indeed, the detection of neutrino events has been proposed to probe the existence of comet-mass PBHs and to set limits on their abundance [91, 92, 93, 94, 95, 96]. Constraints on the PBH abundance with the same data used to search for the DSNB at Super-Kamiokande (SK) [97, 98, 99] were obtained more than a decade ago [44] and have been recently reviewed (including rotating PBHs) [60] using the maximum allowed integrated fluxes of the DSNB with current SK data [98]. The prospects of detecting neutrinos from PBHs at future neutrino detectors such as JUNO [100], DUNE and THEIA [101], IceCube [91, 102] and at forecoming DM detectors such as DARWIN [103], have also been recently studied. In this article, we revisit and improve upon the current bounds on the PBH abundance using SK data. We perform a complete spectral analysis, in analogy to one of the SK studies of the DSNB [98, 104] and update constraints on the fraction of PBHs that would constitute part of the DM today and on the abundance at production of those already evaporated. Moreover, we provide a comprehensive study of the sensitivities that can be reached by the most relevant future neutrino and DM detectors to constrain the abundance of PBHs, and extend the study to masses corresponding to PBHs with a lifetime shorter than the age of the Universe. For all detectors and PBH masses, we present results for monochromatic and log-normal mass distributions.
The structure of the article is as follows. Fundamentals on the formation and evaporation of PBHs are briefly discussed in Sec. 2, while the emitted spectrum and flux of neutrinos from PBH evaporation are discussed in Sec. 3. Then, in Sec. 4 we update and extend PBH bounds from SK data using the full spectral information of both, signal and backgrounds. The expected neutrino rates at forthcoming neutrino (Hyper-Kamiokande, JUNO, DUNE) and DM (DARWIN, ARGO) detectors are discussed in Sec. 5, while the analyses of the prospects of detection with these future detectors and the forecast of constraints on the PBH abundance in the mass range g is conducted in Sec. 6. Finally, a summary and concluding remarks are presented in Sec. 7.
2 Evaporation of primordial black holes
If PBHs exist and they formed in a radiation dominated epoch, when the Standard Model (SM) plasma had a temperature , their initial mass would have been similar to the enclosed mass in the particle horizon () [105],111A more accurate treatment should account for the fact that the PBH mass at formation also depends on the value and shape of the collapsing overdensity [106, 107, 108, 109, 110].
| (2.1) |
where , with the speed of sound at the radiation epoch, is a numerical factor that depends on the details of the gravitational collapse, corresponds to the SM radiation energy density at the formation time, and to the Hubble expansion rate. PBHs can gain mass via mergers [111, 112, 113] and accretion [114, 115, 116], although these processes are typically not very efficient, only inducing a mass gain by a factor of order , and will be, hereafter, ignored. At their formation time (when the plasma temperature is ), the fraction of the Universe’s energy density in the form of PBHs is [44]
| (2.2) |
Generalizing the expression from Ref. [44] for a broad mass spectrum, this is given by
| (2.3) |
where counts the number of relativistic degrees of freedom contributing to the SM energy density at production time [117], which is different for every mass. At production time, the mass distribution function is , and is the PBH comoving number density today, had those PBHs not evaporated away. We consider the mass distribution function to be normalized to one, so that , with the mean of the distribution.
As the PBHs energy density scales as non-relativistic matter, if massive enough (i.e., if not fully evaporated, , with the mass of PBHs evaporating now, see below), they would constitute part of the total DM abundance today, representing a fraction
| (2.4) |
and [39]
| (2.5) |
where is the reduced Hubble constant. Note that, by setting the lower limit of the integral in the numerator to , we only count (approximately) non-evaporated PBHs as part of the DM density today.
Note that, although monochromatic mass distributions are typically assumed to set limits on the PBH abundance, in general, PBH masses are expected to span over a broad interval, and constraints could be strengthened [118, 119, 120, 121, 122, 123, 39]. Extended PBH mass functions arise naturally if PBHs are created from inflationary fluctuations or cosmological phase transitions (see, e.g., Refs. [124, 125, 126, 127, 109, 128, 129, 130, 131]), and a log-normal distribution, first obtained in Ref. [132], represents a very good approximation for models with a symmetric peak in the power spectrum of curvature perturbations [120, 133]. In the analysis presented in the following sections, both monochromatic and log-normal distributions are considered, with
| (2.6) |
where denotes the median mass and represents the width of the log-normal distribution.222Note that log-normal distributions for the comoving mass density , rather than for the comoving number density, have been also considered (e.g., Refs. [120, 121]). The spectrum is normalized such that .
Therefore, the initial abundance can be explicitly written in each case as
| (2.7) |
and the relation between and , as
| (2.8) |
where the term
| (2.9) |
represents the fraction of PBHs that would not have evaporated by now (assuming instant evaporation).
Evaporation occurs because, due to quantum effects in curved spacetime, PBHs emit particles at their event horizon, the so-called Hawking radiation [42, 43]. The emitted spectrum has a nearly thermal black-body spectrum, with a temperature given by
| (2.10) |
where is the reduced Planck mass, with the gravitational constant. The number of particles with degrees of freedom radiated per unit of time and energy is given by a quasi-thermal black-body spectrum [42, 43],
| (2.11) |
with and for bosons and fermions, respectively, and is a gray-body factor [134, 135, 136, 137]. In addition to this primary spectrum generated via Hawking evaporation, the decay of hadrons and other particles promptly produced, results in a secondary spectrum of stable particles, including electrons, neutrinos and photons.
The neutrino spectrum rate at time is given by the sum of these two contributions weighted by the PBH mass distribution,
| (2.12) |
We compute the neutrino emission rates via the publicly available code BlackHawk [138, 139, 140]. To obtain the secondary spectra resulting from hadronization, interconversion, and decays of particles from the primary emission, BlackHawk makes use of PYTHIA [141], HERWIG [142] and Hazma [143]. We consider both contributions, which are computed for each PBH mass with BlackHawk v1.2.333 Note that the output of BlackHawk for the secondary spectra already includes the primary ones (private communication with BlackHawk’s authors). Notice that, whereas in BlackHawk v1.2 the degrees of freedom of light quarks are accounted for by considering the emission of single quarks (with free quark masses) below the QCD scale, BlackHawk v2.1 [140] enables the choice of a new low-energy hadronization scheme in which pions instead of quarks are emitted below the QCD scale. In principle, the approach in BlackHawk v1.2 could overestimate the number of degrees of freedom for masses g (see, e.g., Ref. [55]), with respect to the approach which considers effective quark and gluon masses and only considers pion emission below the QCD scale [144, 145, 146]. This is expected to result in different neutrino fluxes (see Refs. [62, 140] for the comparison of secondary photon and electron emission between both approaches) and therefore, in bounds which differ by a non-negligible amount from the ones we present here (or that have been obtained in other works with the use of BlackHawk v1.2, in the mentioned mass range). Nevertheless, BlackHawk v2.1 does not provide low-energy neutrino spectra using the new approach, yet. Therefore, with this note of caution, we proceed and show results obtained using the neutrino fluxes computed with BlackHawk v1.2, assuming Majorana neutrinos (six degrees of freedom). Note that, although the detection events are not sensitive to their Dirac/Majorana nature, in the case of Dirac neutrinos, right-handed and left-handed neutrinos are emitted in equal amounts (twelve rather than six degrees of freedom) [147], which results in slightly higher fluxes.
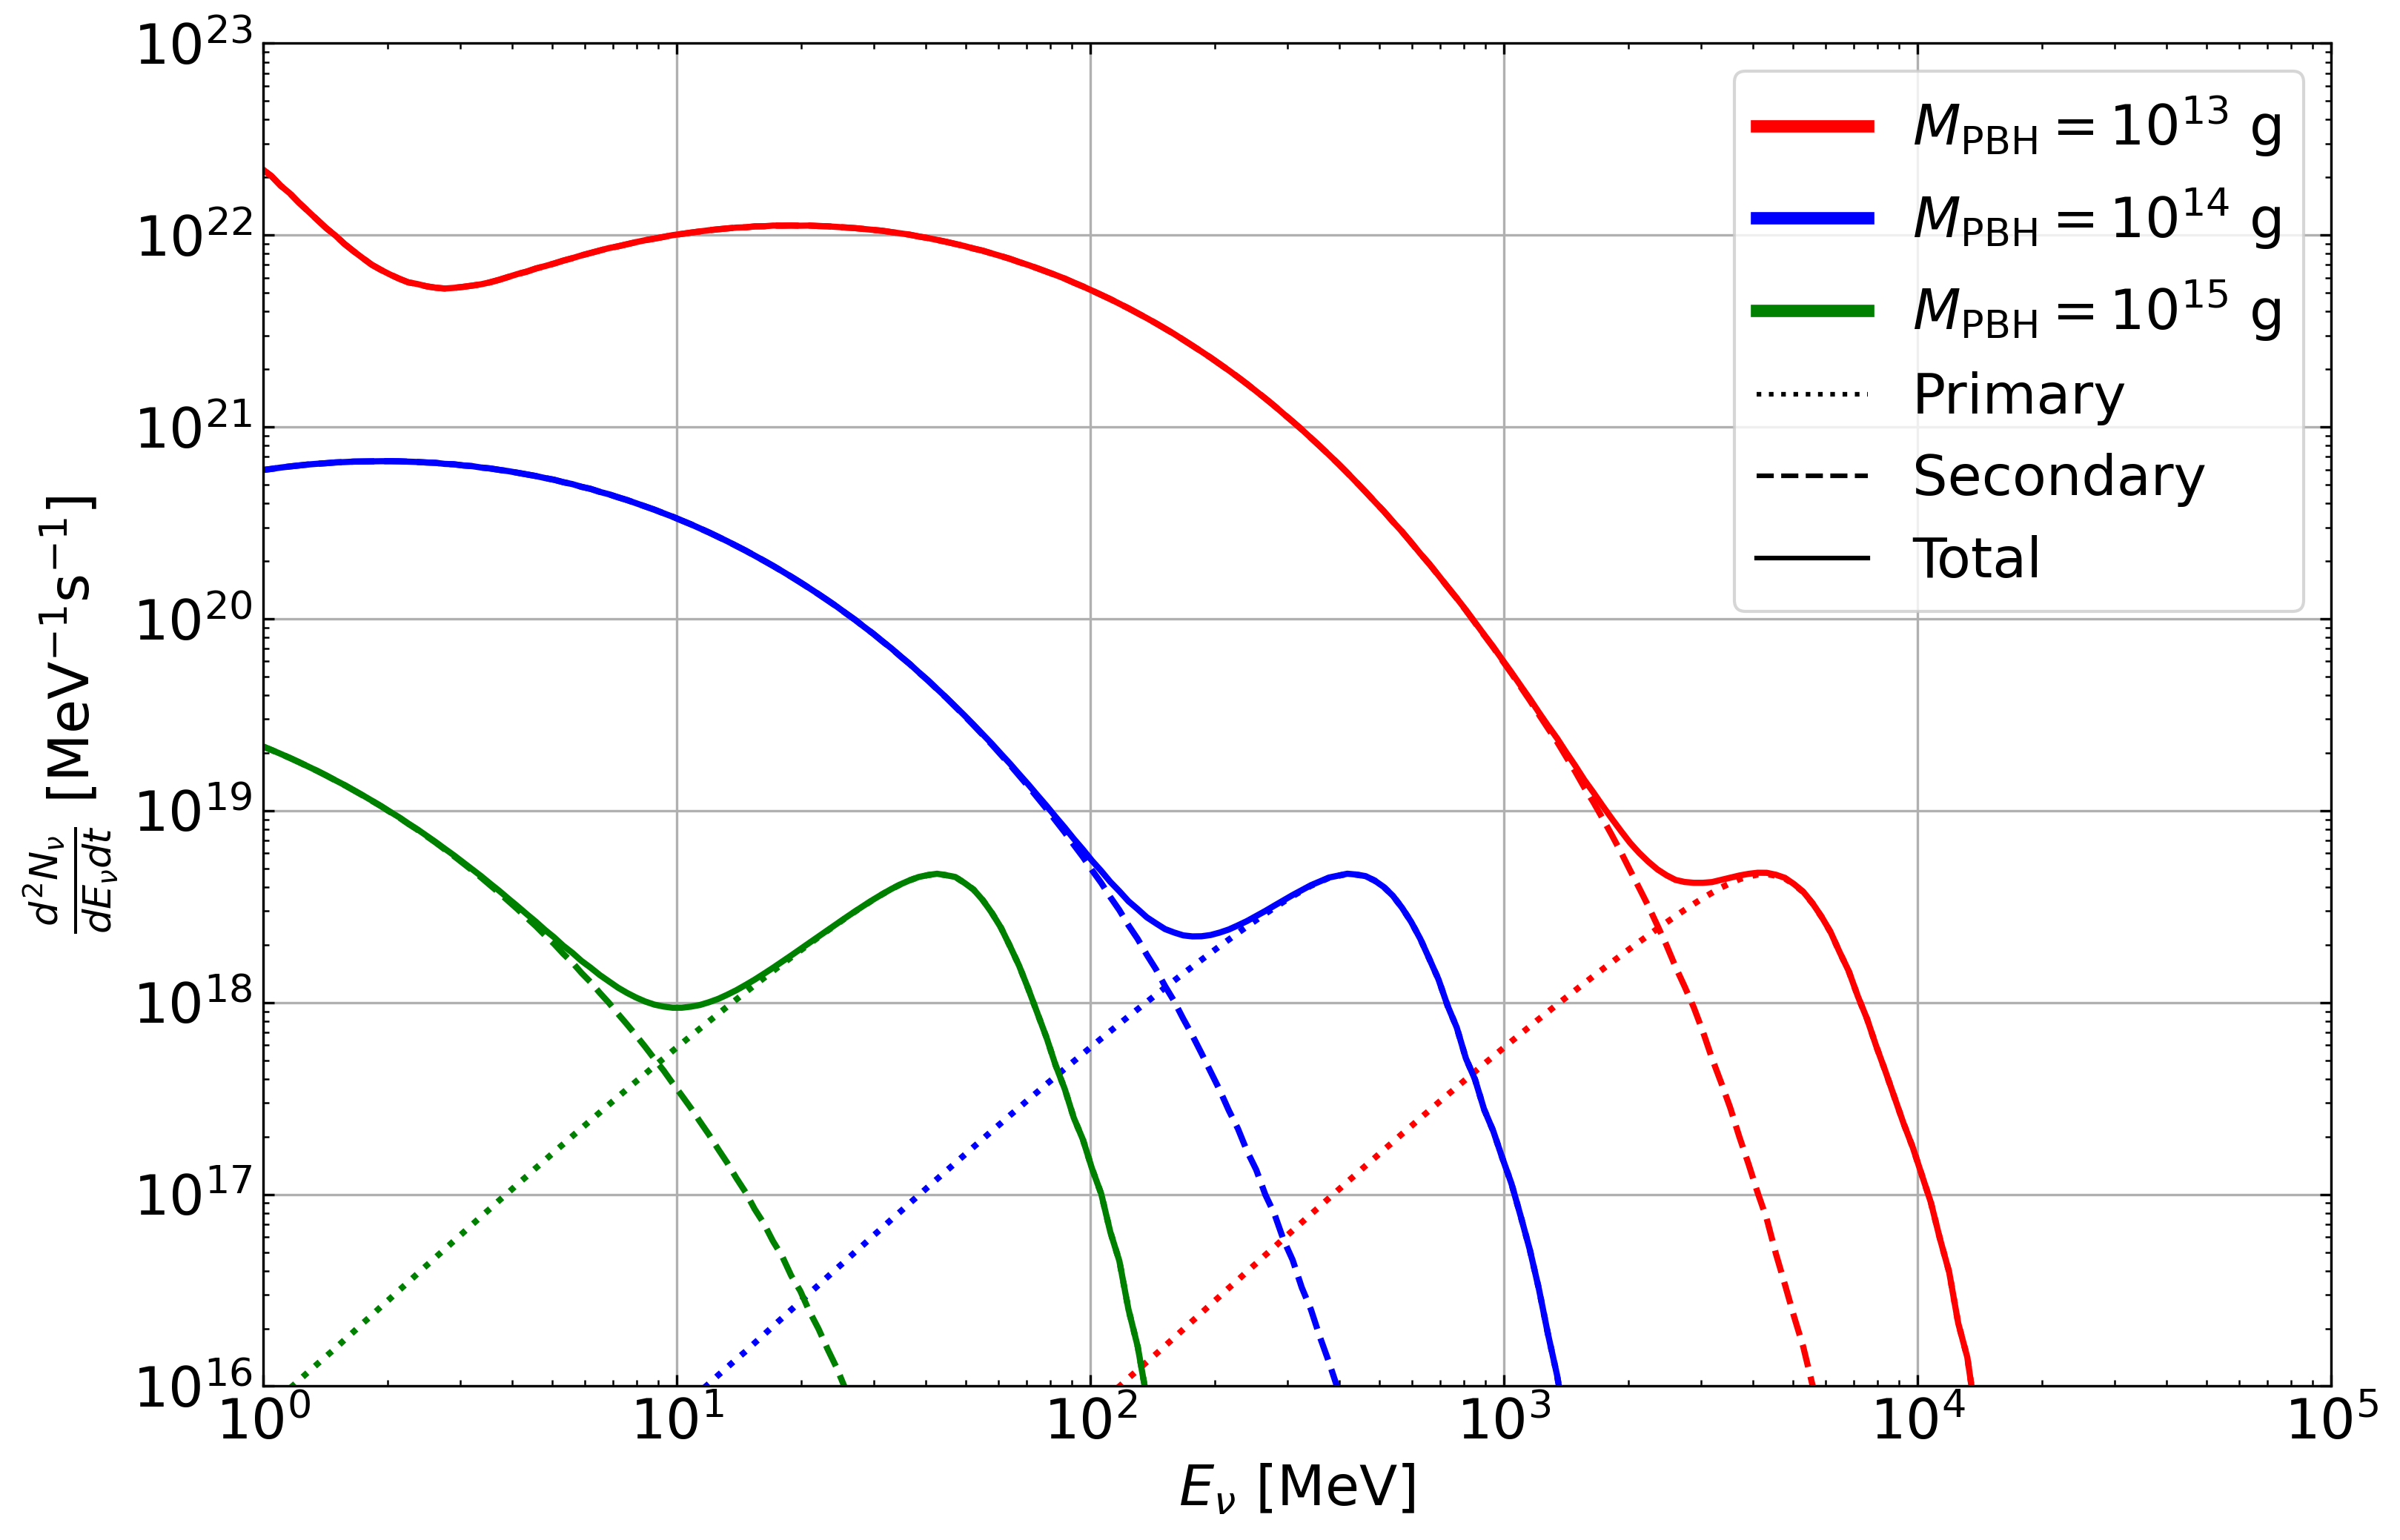
Figure 1 depicts the emission rate of for several PBH masses, explicitly showing the primary and secondary contributions, along with the total one. The primary spectrum dominates at high energies, around its peak at [135], approaching the geometric optics limit, , beyond the peak [135, 144]. However, secondary spectra dominate at lower energies, and become more prominent the smaller the PBH mass. Nonetheless, as discussed below, for most masses, the impact of the secondary spectrum on the results is mild, since backgrounds dominate the potential signal at energies where secondary spectra lie.
Due to this emission, PBHs continuously lose mass until their complete evaporation, with a lifetime that is approximately given by [145, 146]
| (2.13) |
where Gyr is the current age of the Universe. Hence, from the above estimate, PBHs with masses around g would have a lifetime that equals the current age of the Universe. Note, however, that the treatment of the number of degrees of freedom just below the QCD scale in the BlackHawk v1.2 code leads to a mass of PBH evaporating now of g. If their initial mass is , their lifetime is smaller than the age of the Universe, and therefore they would have already (or almost) fully evaporated. Alternatively, for initial masses , PBHs would have not evaporated yet. In such a case, PBHs would unavoidably form part of the DM today.
3 Neutrino flux from PBH evaporation
Given the emission rate from Eq. (2.12), the differential neutrino flux that reaches Earth is computed by including two contributions: the spectrum from the evaporation of extragalactic PBHs, taking into account the redshifting of energy, , and the spectrum of neutrinos from non-evaporated PBHs within the Milky Way, . The total flux is given by the sum of both contributions, . The differential extragalactic flux includes the contribution over the full sky integrated in redshift, and reads [44, 46],444This expression comes from the solution of the evolution equation accounting for redshift, which in terms of the intensity , takes the form .
| (3.1) |
where is the redshift corresponding to either today () or to the latest time in the output () from BlackHawk in case PBHs would have already evaporated away (i.e., ), and corresponds to the redshift at which PBHs where formed. Note, however, that neutrinos from PBH evaporation emitted before neutrino decoupling ( s) do not contribute to this flux. The precise initial time used in the above integral is not important because of the redshifting of energy.
As already discussed, for , PBHs would not have fully evaporated yet, and would contribute to the DM density now. For those masses, the current PBH number density can be written as a function of the DM fraction contributed by PBHs now, as , where is the mean of the mass distribution and is given by Eq. (2.9): () for the monochromatic case and for log-normal mass distributions. For those masses, PBHs in the Milky Way would also contribute to the neutrino emission, with a differential flux given by
| (3.2) |
where is the BlackHawk output for the instantaneous neutrino spectrum at , is the radial coordinate, kpc the distance from the center of the Milky Way to the solar system,555Note that this (standard) value is slightly larger than the current best estimates [148, 149]. the line-of-sight distance, and the angle between these two directions. Note that the double integral is known as the D-factor in decaying DM literature (see, e.g., Ref. [150]). The line-of-sight integral extends up to , with kpc being the halo radius. In what follows, the DM density profile is approximated by the Navarro-Frenk-White (NFW) profile [151, 152],
| (3.3) |
For the sake of comparison with other works in the literature, we use for the DM density in the solar neighborhood, and kpc for the scale radius of the Milky Way.666Note, however, that this combination of values is at odds with current estimates [153, 154]. Furthermore, they are correlated with the galactocentric distance [155], which we assume to be slightly larger than present estimates [148, 149]. From this point of view, our results are conservative. This contribution can be of the same order or larger than the extragalactic one, and thus cannot be neglected, in general, for non-evaporated PBHs.
Furthermore, note that neutrinos of a given flavor produced via PBH evaporation would mix with the other flavors along the way to Earth via neutrino oscillations. Denoting by the probability of averaged oscillations between flavors and (with the neutrino mixing matrix), the differential flux of neutrinos of flavor , , is given by the combination of the non-oscillated neutrino fluxes,
| (3.4) |
with neutrino mixing angles and CP phase taken from Ref. [156] (see also Refs. [157, 158]). Nevertheless, the flux of secondary spectra at Earth, in the PBH mass range of interest, peaks at lower energies ( MeV) than the ones accessible by neutrino detectors, where the solar electron neutrino (and reactor electron antineutrino) background dominates. Thus, given that the primary spectrum for all neutrino flavors is the same, neutrino oscillations only modify neutrino fluxes at low energies (secondary spectrum) at the % level [100, 101]. For the range of masses we consider, this occurs at energies for which backgrounds dominate the signal and thus, oscillations have a negligible impact on the final results presented in this work.
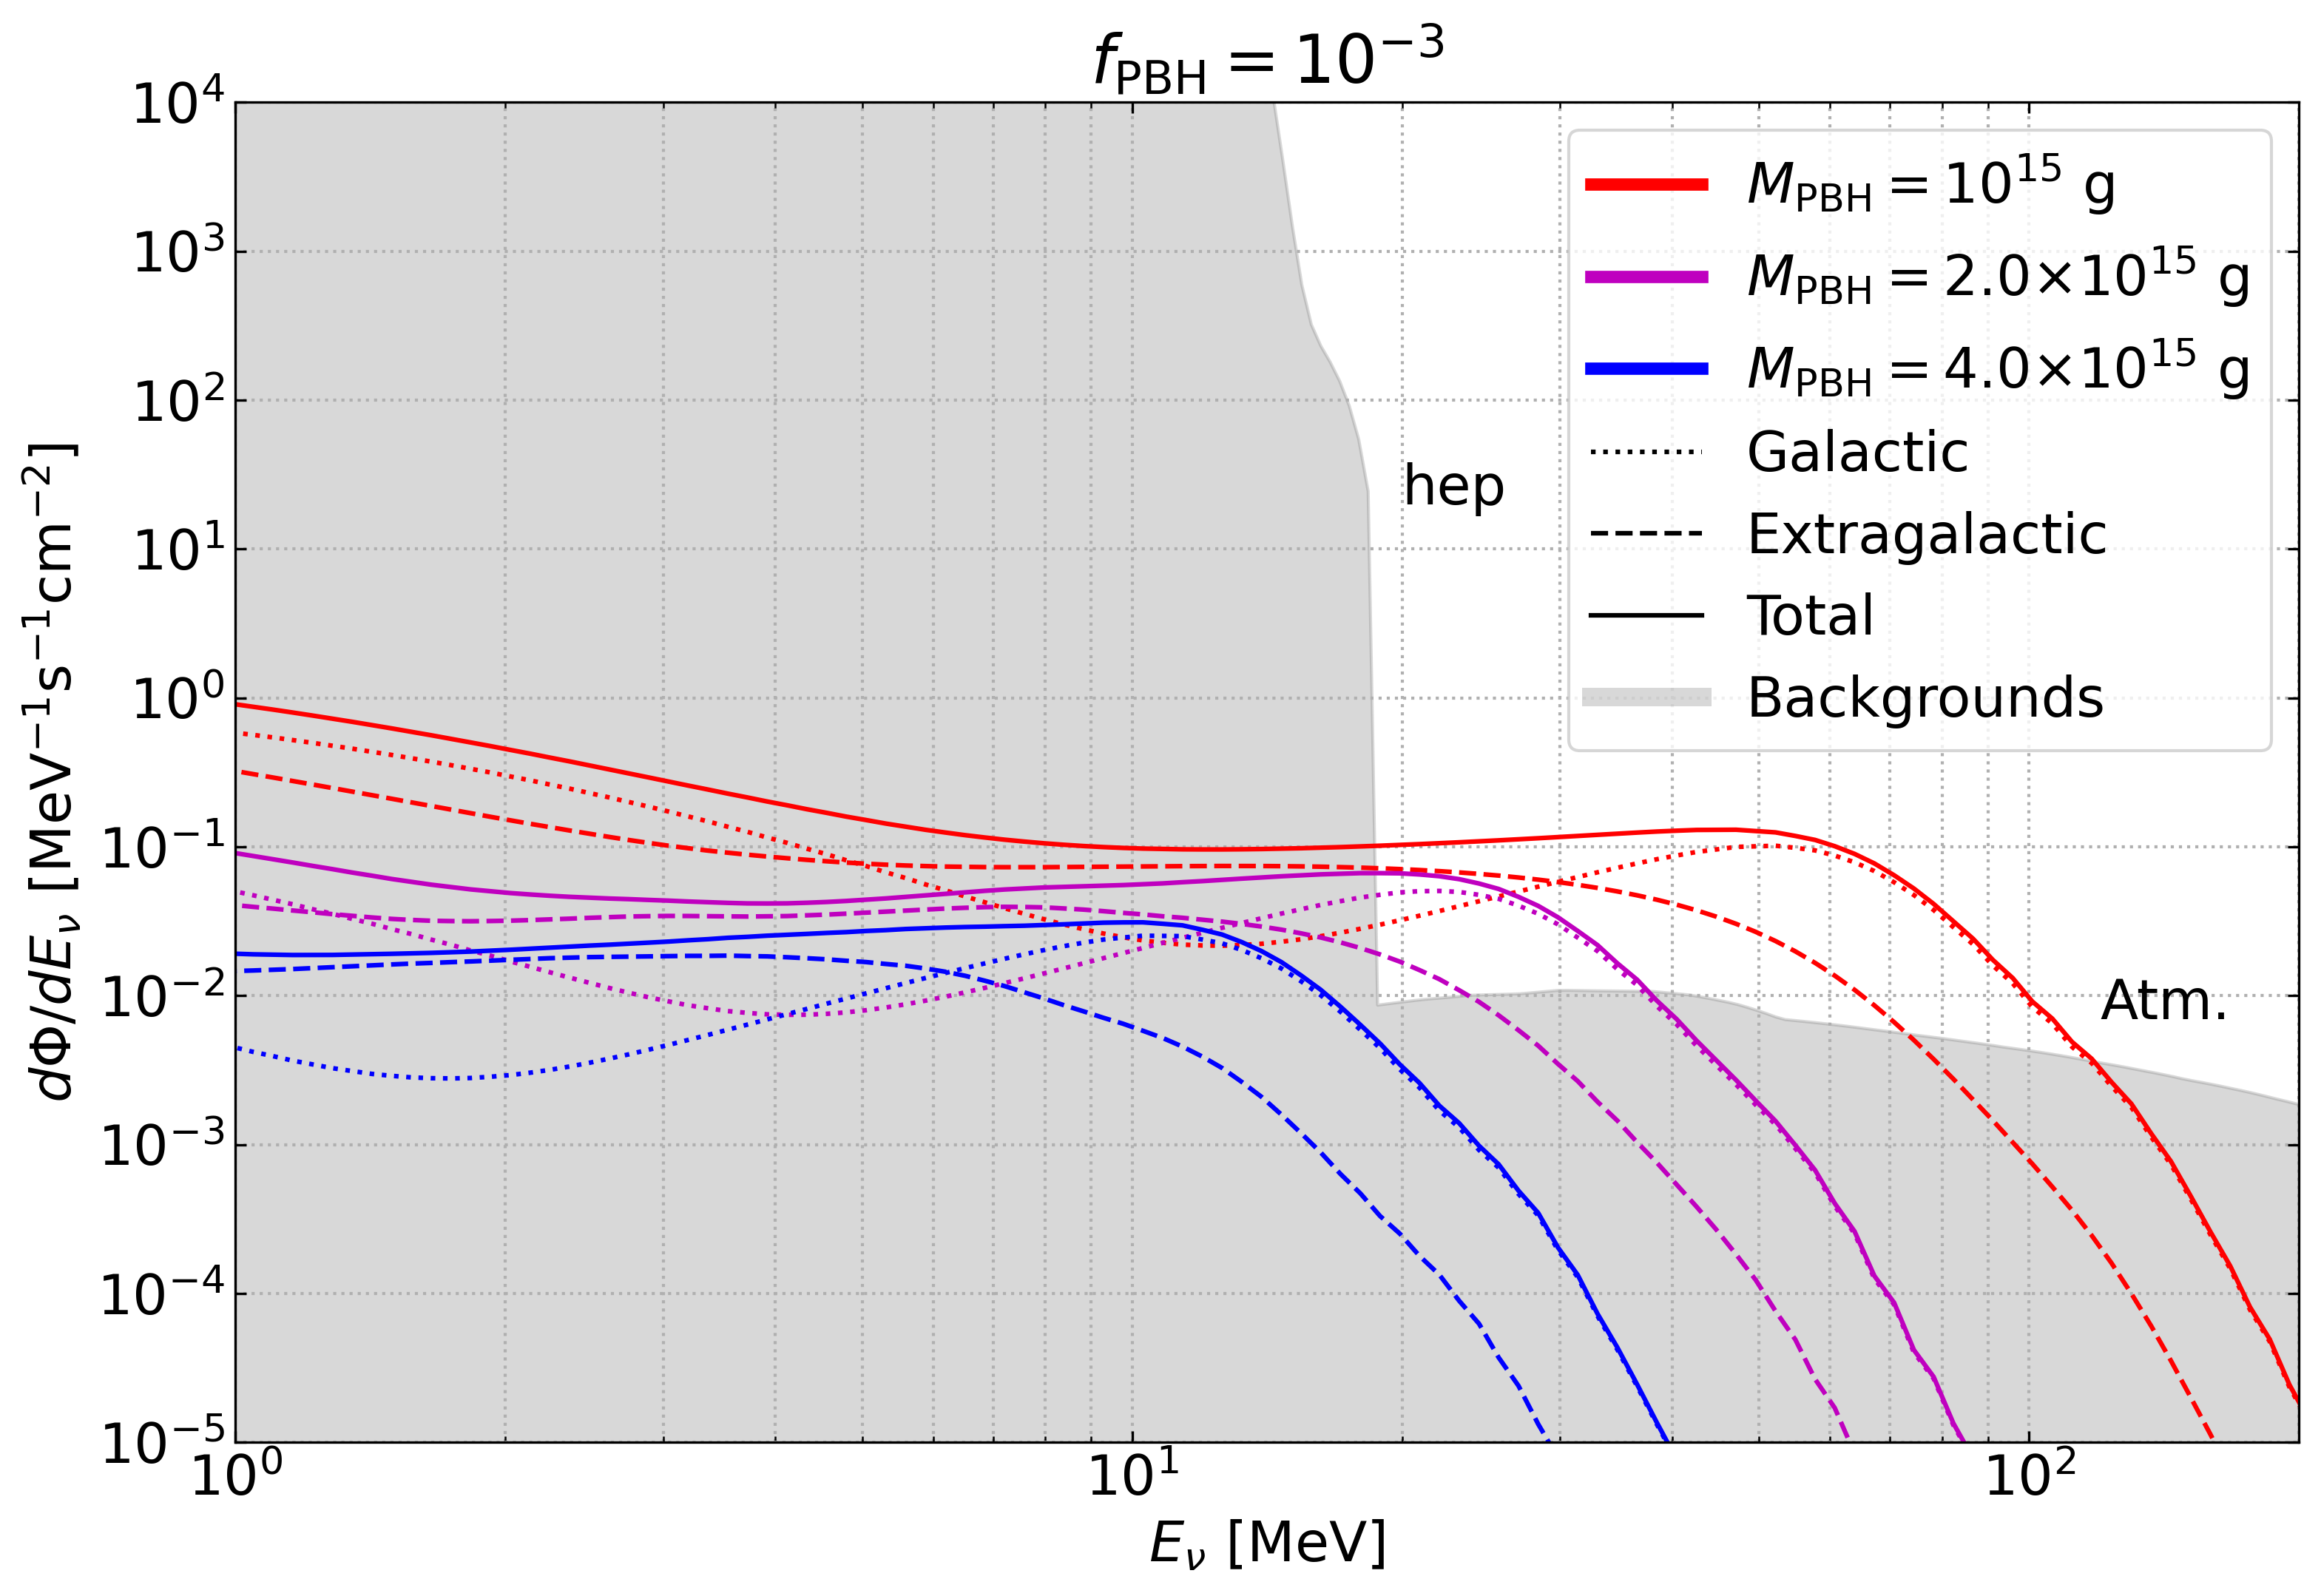
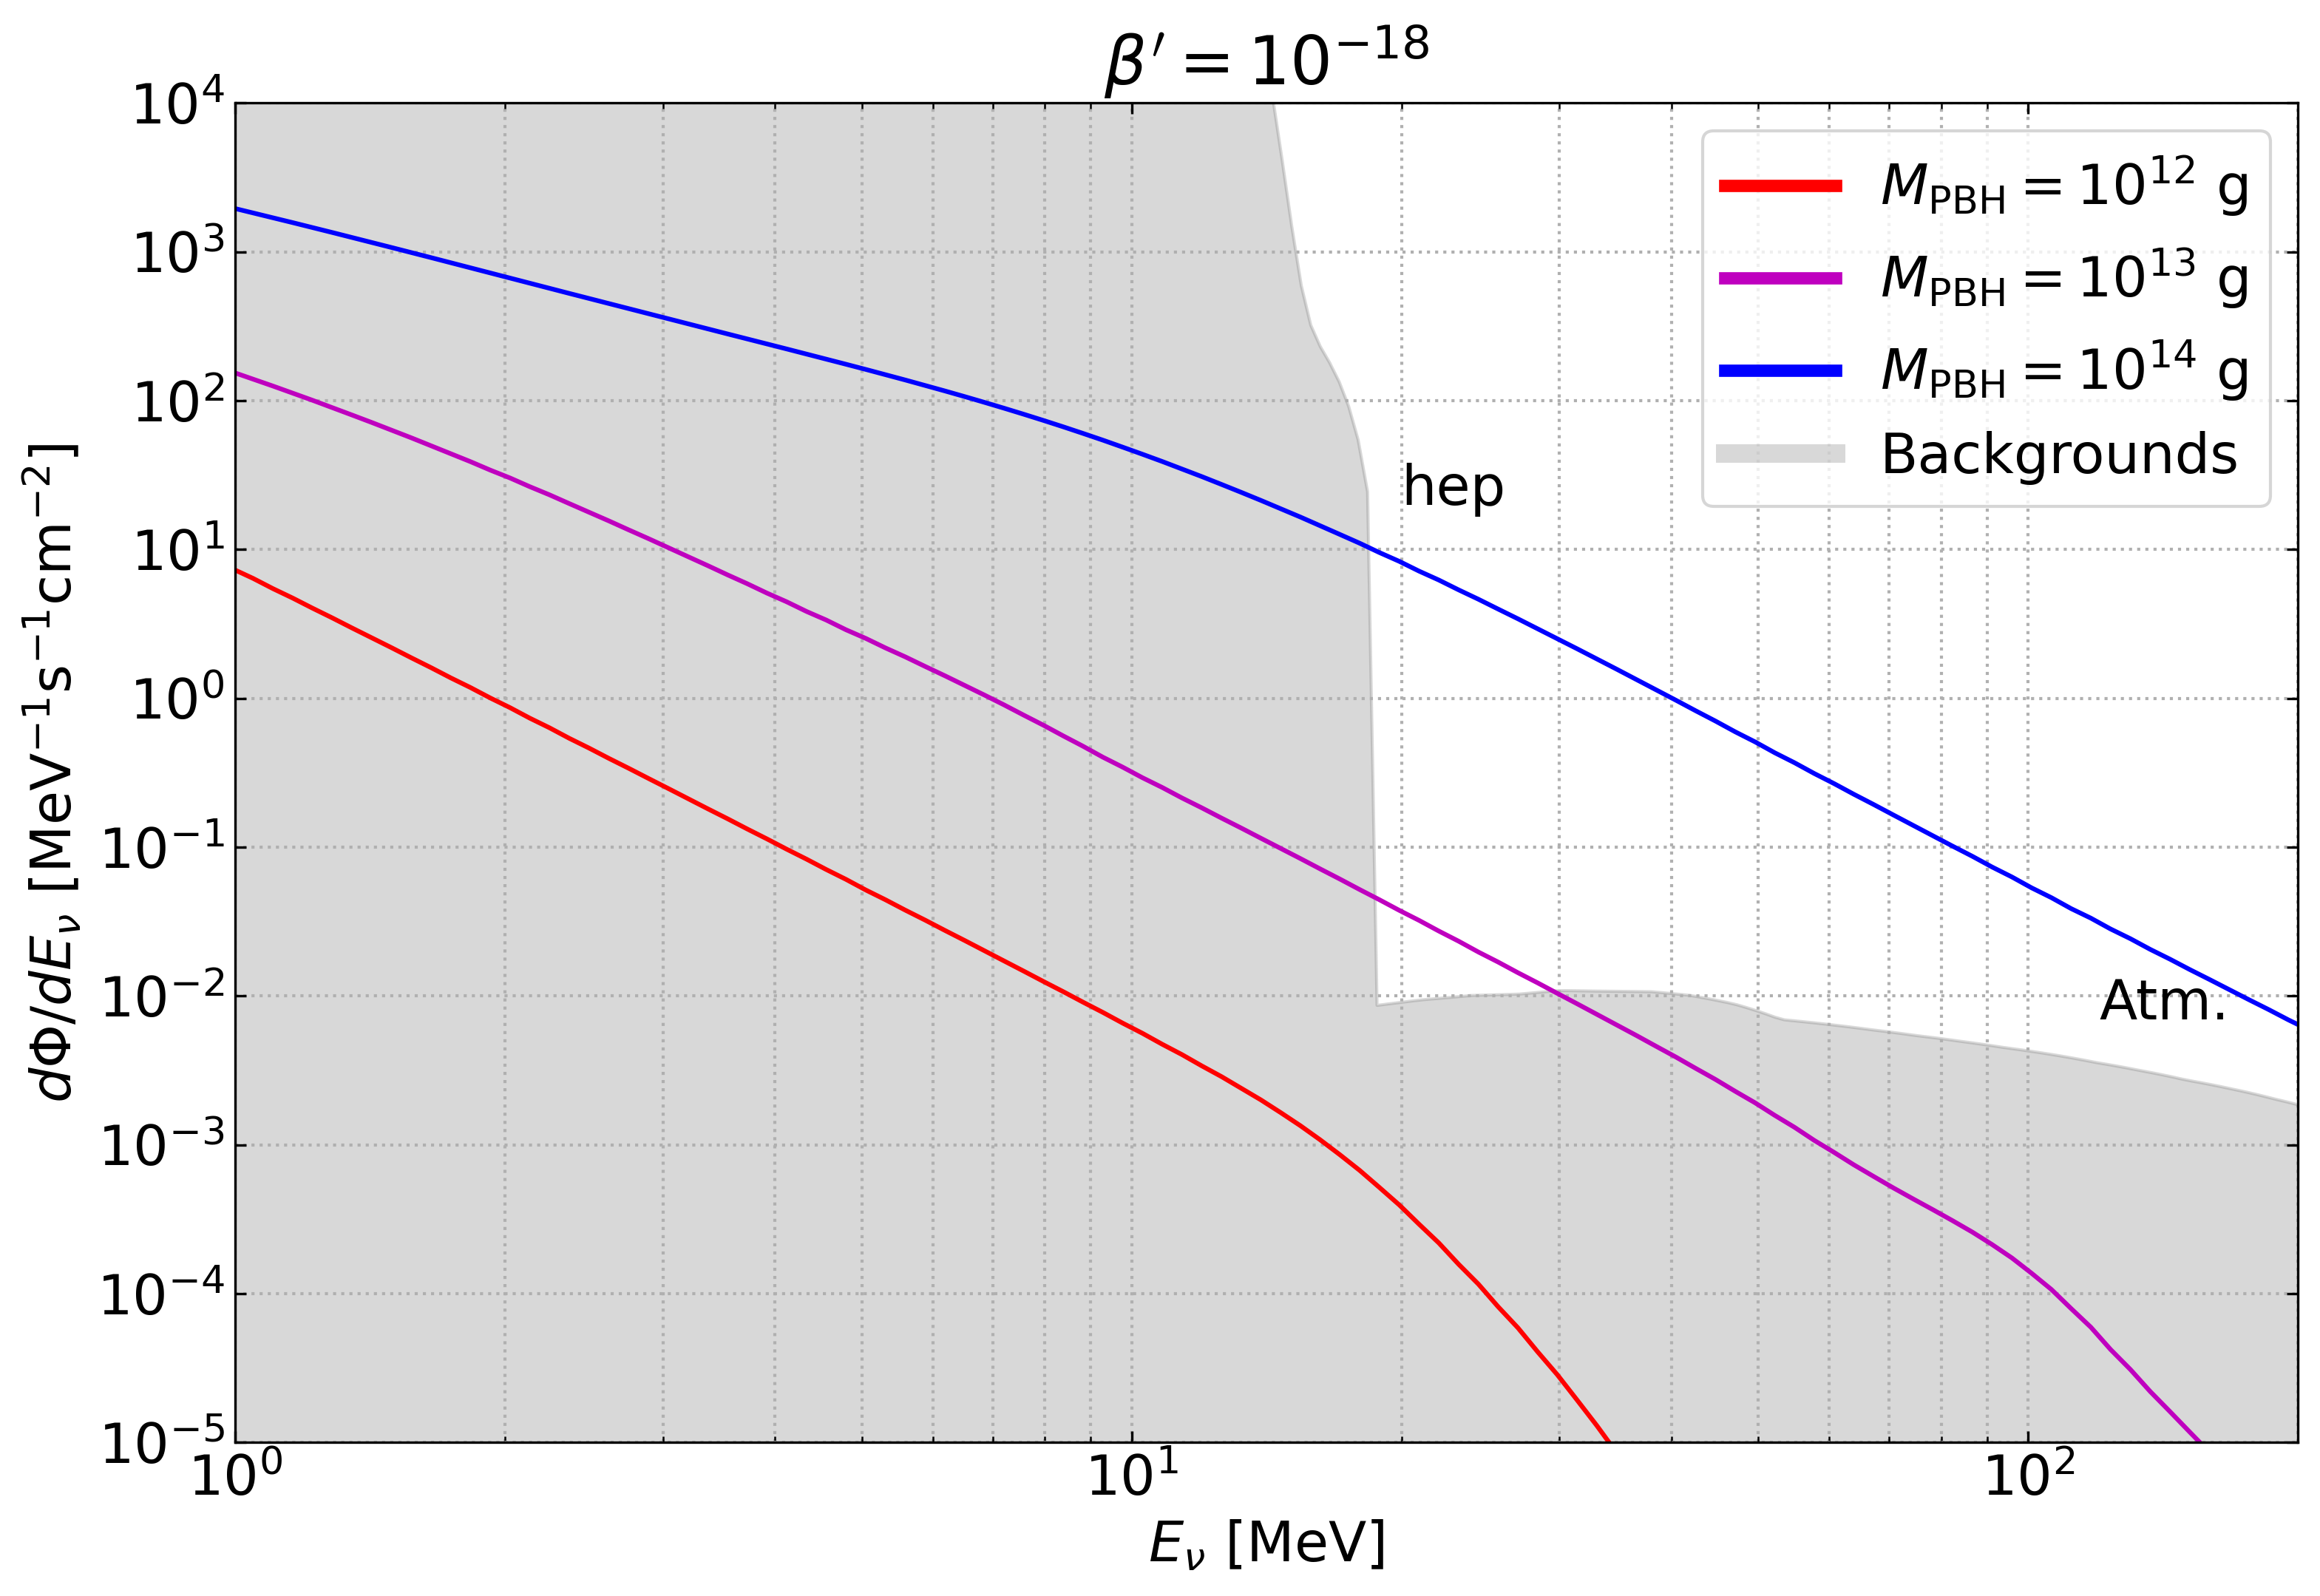
The electron neutrino flux from PBH evaporation is shown in Fig. 2, where we separately depict the galactic, extragalactic and total contributions for PBHs as DM, (top panel) and the extragalactic flux for evaporated PBHs, (bottom panel). In both cases, the fluxes are shown for monochromatic mass distributions. For comparison, the solar neutrino flux, as predicted from the AGSS09 model [159], and the atmospheric electron neutrino flux from the Monte-Carlo FLUKA simulations [160], are also shown. Another potential source of background for the PBH signal is the DSNB flux, which could be important for MeV and whose impact is discussed below, but it is not included in the figure.
The neutrino flux from non-evaporated PBHs () could dominate over other neutrino sources for MeV, whereas the PBH antineutrino flux (not shown) could be the highest flux for MeV. The galactic contribution peaks at higher energies than the extragalactic one, which is time-integrated and also experiences energy redshift. In the case of a monochromatic mass distribution, for g, the galactic contribution would be the largest one for MeV, whereas for less massive PBHs, the extragalactic contribution could also be important at energies around MeV. On the other hand, the emission from PBHs already evaporated (), only has the extragalactic contribution, which peaks at even lower energies than that of more massive PBHs. At emission time, the initial spectra are warmer than for non-evaporated PBHs (given the lower PBHs masses). Nevertheless, after , evaporation is almost complete and neutrinos are scarcely emitted. As can be understood from Eqs. (2.10) and (2.13), the redshift in energy from compensates the higher energies at emission, leading to a cooler final spectra (shifted to lower energies) at Earth, as shown in Fig. 2, where only the high-energy tail of the spectrum reaches beyond MeV.
In the case of the two extended mass distributions we consider in this work, the extragalactic contribution is always the dominant one at the energies of interest (i.e., a few tens of MeV), even in the case of median PBH masses . Indeed, the more extended the mass distribution, the larger is the relative contribution from the extragalactic signal. This can be understood from the fact that the maximum of the mass distribution lies at lower masses the larger the width is. In this case, for median masses , a fraction of PBHs in the low-mass tail would have evaporated by now and would not be part of the DM. This is (approximately) taken into account when setting limits on , see Eq. (2.8). Conversely, for median masses , a fraction of PBHs in the high-mass tail of the distribution would have survived today and would constitute part of the DM now. Yet, in this case, we only quote limits on .
4 Updated constraints with Super-Kamiokande data
Super-Kamiokande (SK) is a water-Cherenkov detector with a fiducial volume of 22.5 ktons ( free protons and oxygen nuclei). The best data in the energy range of neutrinos from PBH evaporation corresponds to that used in the search for the DSNB [98, 161, 99], which is divided into four phases: SK-I ( days), SK-II ( days), SK-III ( days) and SK-IV ( days). Indeed, limits on the integrated DSNB flux obtained with data from the first three phases [98] have been recently used to set bounds on the DM density fraction in the form of PBHs [60]. Nevertheless, the energy spectrum of the DSNB and that of neutrinos from PBH evaporation is not the same, so a detailed analysis must account for it. This is what we intend to do in this section.
The main detection channel of these neutrinos in SK is inverse beta-decay (IBD) (), with subdominant contributions from and charged-current (CC) interactions off oxygen nuclei and, in the absence of neutron tagging, from and CC interactions producing muons below Cherenkov threshold. Without requiring the detection of a delayed neutron (by detecting the 2.2 MeV photon released after neutron capture in hydrogen), the lowest energies considered in these searches are mainly determined by the ability to remove the radioactive spallation products caused by cosmic-ray muons. The analyses of the first three SK phases allowed placing bounds on the integrated DSNB flux above MeV (visible energy threshold at MeV). However, by tagging neutrons in delayed coincidence with the positron signal, a significant suppression of the background can be achieved and the energy threshold can be lowered. With the new trigger system, which allows neutron tagging, this is the main goal of the SK-IV analysis. A first study using partial SK-IV data extended the search down to MeV ( MeV), with a total lifetime of 960 days [161]. Nevertheless, the additional selection cuts to reduce the probability of accidental background events resulted in an efficiency of finding delayed events of , which correspondingly reduced the number of potential signal events. Given that most of the DSNB signal is expected to increase with decreasing energy, this analysis focused on the visible energy interval MeV, but yet, due to the limited statistics, the bounds obtained were weaker than with previous data, so these data had a minor effect on the overall results. Recently, the entire data set from SK-IV has been analyzed to extend the searches down to MeV ( MeV) [99]. Two new analyses have recently improved upon the one of the first three phases, by including two neutron tagging regions and a better spallation reduction algorithm. Yet, due to the preference for a small excess within this data set, the combined (SK-I, SK-II, SK-III, and SK-IV) limits are very similar to those obtained for the first three phases. In this work, we only include SK-I, SK-II, and SK-III data sets and we perform an analysis similar to the one of SK [98, 104].
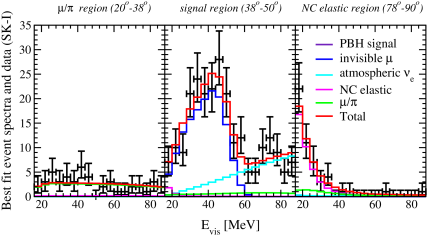
The two main sources of background at these energies are the Michel electrons and positrons from the decays at rest of invisible muons, which are produced below the threshold for Cherenkov emission by atmospheric or , and electrons and positrons produced by atmospheric and . Additionally, neutral-current (NC) elastic events, which can produce de-excitation gammas, and low energy muons and pions, misidentified as electrons or positrons, also constitute other sources of background.777Note that the guaranteed, but uncertain, DSNB would also represent a background for the PBH signal. Below we comment on its potential impact on neutrino limits, but we do not include it in the current analysis. It turns out that the average Cherenkov angle of photons from NC processes is large, whereas slow muons and pions emit Cherenkov light with a small angle. In contrast, IBD positrons are highly relativistic and emit Cherenkov light with an angle of . The SK analysis of the first three data sets did not add a selection cut on the angle, but considered three Cherenkov angle regions: (‘’ region), (‘signal’ region) and (‘NC elastic’ region).
As done in Ref. [162], we include interactions of off free protons, using the IBD differential cross section [163, 164], and we consider a relativistic Fermi gas model [165] to include and interactions off oxygen nuclei. In addition, we also include the PBH signal from and CC interactions, with final muons below Cherenkov threshold (in analogy to the invisible muons background). The expected fraction of events in the visible electron/positron energy interval , produced by neutrinos and antineutrinos from PBH evaporation, during phase = {SK-I, SK-II, SK-III} is given by
| (4.1) |
where is a normalization constant so that . The cross sections for IBD and for CC interactions with nuclei are given by and , respectively, and the factor accounts for water having twice as many free protons as oxygen nuclei. The Gaussian energy resolution of each SK phase, , is incorporated through , with the detection efficiency, and where and are the true and detected electron/positron energy, respectively. The energy-dependent efficiency888Note that the efficiency is given as a function of the reconstructed energy, , and not the true energy, . The trigger efficiency is close to 100% in the region of interest, so accounts for post-trigger reduction cuts to the data [98, 104]. [98, 104] and the energy resolution [166, 167, 168] of each SK phase were compiled in Ref. [162]. The second line represents the contribution from and CC interactions, whereas the last two lines correspond to the and events with muons below Cherenkov threshold ( MeV), produced by neutrinos with MeV. For the latter contribution, we consider the spectrum of electrons/positrons from muon decays at rest () and in orbit in an oxygen nucleus () [169], accounting for a probability of absorption of of .999In the analyses, for the contribution to the signal from and CC interactions, we use the shape of the invisible muon background, for each phase, from Ref. [104], and as normalization we use the total number of invisible muon events obtained from the last two lines in Eq. (4). Due to the minimum required neutrino energy to produce these events, this contribution is more important for small PBH masses (for non-evaporated PBHs) and for broad mass distributions, whose flux extends to higher energies. For large masses, the PBH contribution from invisible muons is much smaller than that from and CC interactions and can be neglected.
To describe the shape of the four backgrounds in each of the angular regions of observation, we use the probability distribution functions provided in Ref. [104] and we fit their overall normalizations (with fixed relative normalizations among the three Cherenkov regions). The potential signal events from PBHs evaporation are assumed to only contribute to the ‘signal’ region, which is a very good approximation. We perform a fit to the number of events of these five types: (PBH signal), (invisible muons background), (atmospheric background), (NC elastic background) and ( background). We consider 18 4-MeV bins in the visible electron/positron energy interval MeV and perform an extended maximum likelihood analysis, with the likelihood function for each SK phase defined as
| (4.2) |
where runs over the three Cherenkov regions, indicates the energy bin, is the fraction of events of type in the bin and in region , during phase , is the expected total number of events during phase , and is the number of detected events in the bin in region during phase .
We do not include energy scale and energy resolution uncertainties, but we do account for the energy-independent systematic error on the efficiency. To do so, we slightly modify the likelihood above, following Refs. [98, 104]. All in all, the inclusion of these uncertainties only changes the results at the percent level or below. The total likelihood is maximized for each SK data set, treating the background normalizations as nuance parameters. We add a restriction on such that we allow a 30% variation over the expected number invisible muon events using the FLUKA flux ( events/year).101010Note that the and fluxes from Ref. [170] (HKKM) are up to 10% larger than the FLUKA flux for MeV, so by allowing a 30% (flat) variation over the FLUKA flux, we allow a downwards variation over the HKKM flux. We also restrict to guarantee its correlation with , such that in the observation energy interval, in agreement with expectations. The likelihood for each phase is rescaled as a function of the number of signal events/year, , and the total likelihood results from their product, . The 90% confidence level (CL) limit on the number of signal events/year, , is determined by solving
| (4.3) |
The 90% CL limit on the fraction of PBHs contributing to the DM density is then given by
| (4.4) |
where is the expected rate of signal events in the detection interval for each SK phase , which corresponds to .
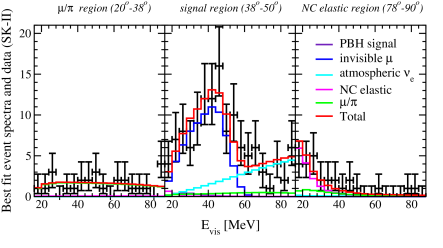
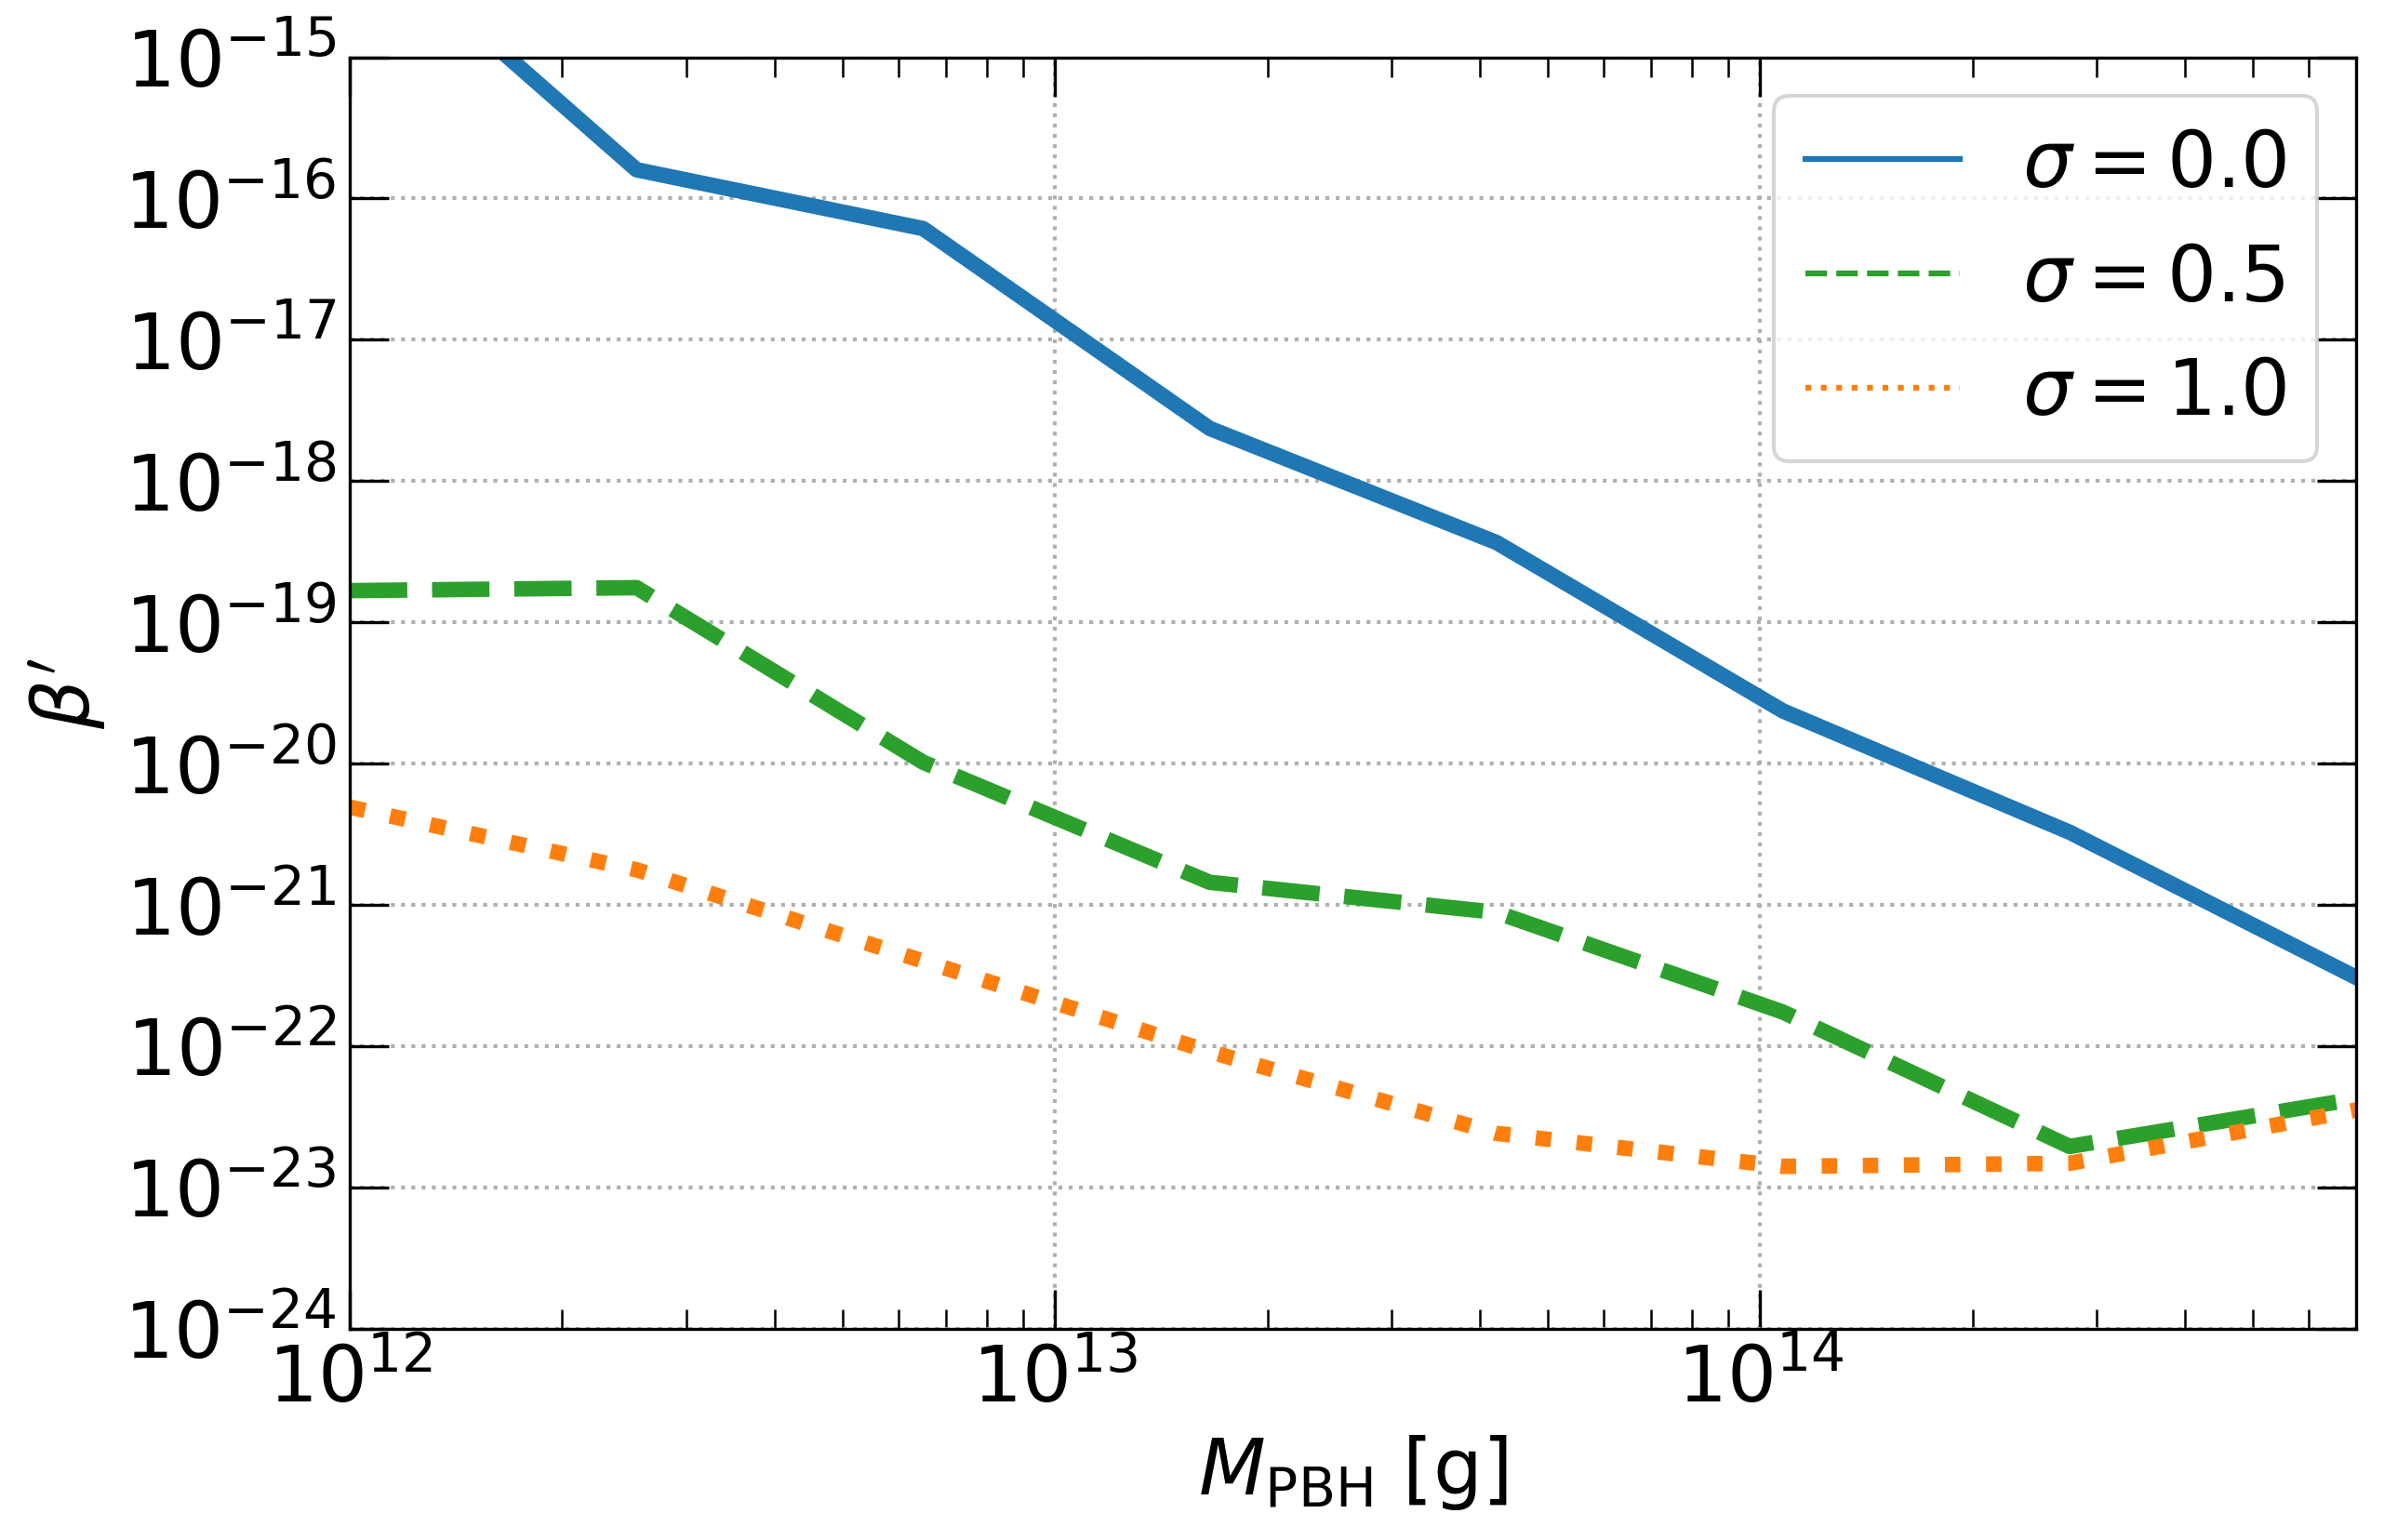
In Fig. 3, we show the best fit for the case of g with a monochromatic mass distribution. The best fits for the four backgrounds discussed above are depicted in the three Cherenkov regions. Note that for SK-II and SK-III, the best fit for the PBH signal is different from zero (barely visible for SK-II), (SK-II) and (SK-III). Yet, the joint best fit for the PBH signal for this PBH mass is . This is not so for all PBH masses or the different mass distributions considered in this work, although we do not attempt to explain the observed signal in terms of PBHs evaporation, but just focus on setting limits on their abundance, as described above. The limits on the PBH abundance, as a function of the PBH mass, corresponding to the monochromatic () and log-normal ( and 1) mass distributions, are shown in Fig. 4, for evaporated (left panel) and non-evaporated (right panel) PBHs. To ease the comparison with the projected bounds from future detectors, these SK limits will also be included in Figs. 6–9.
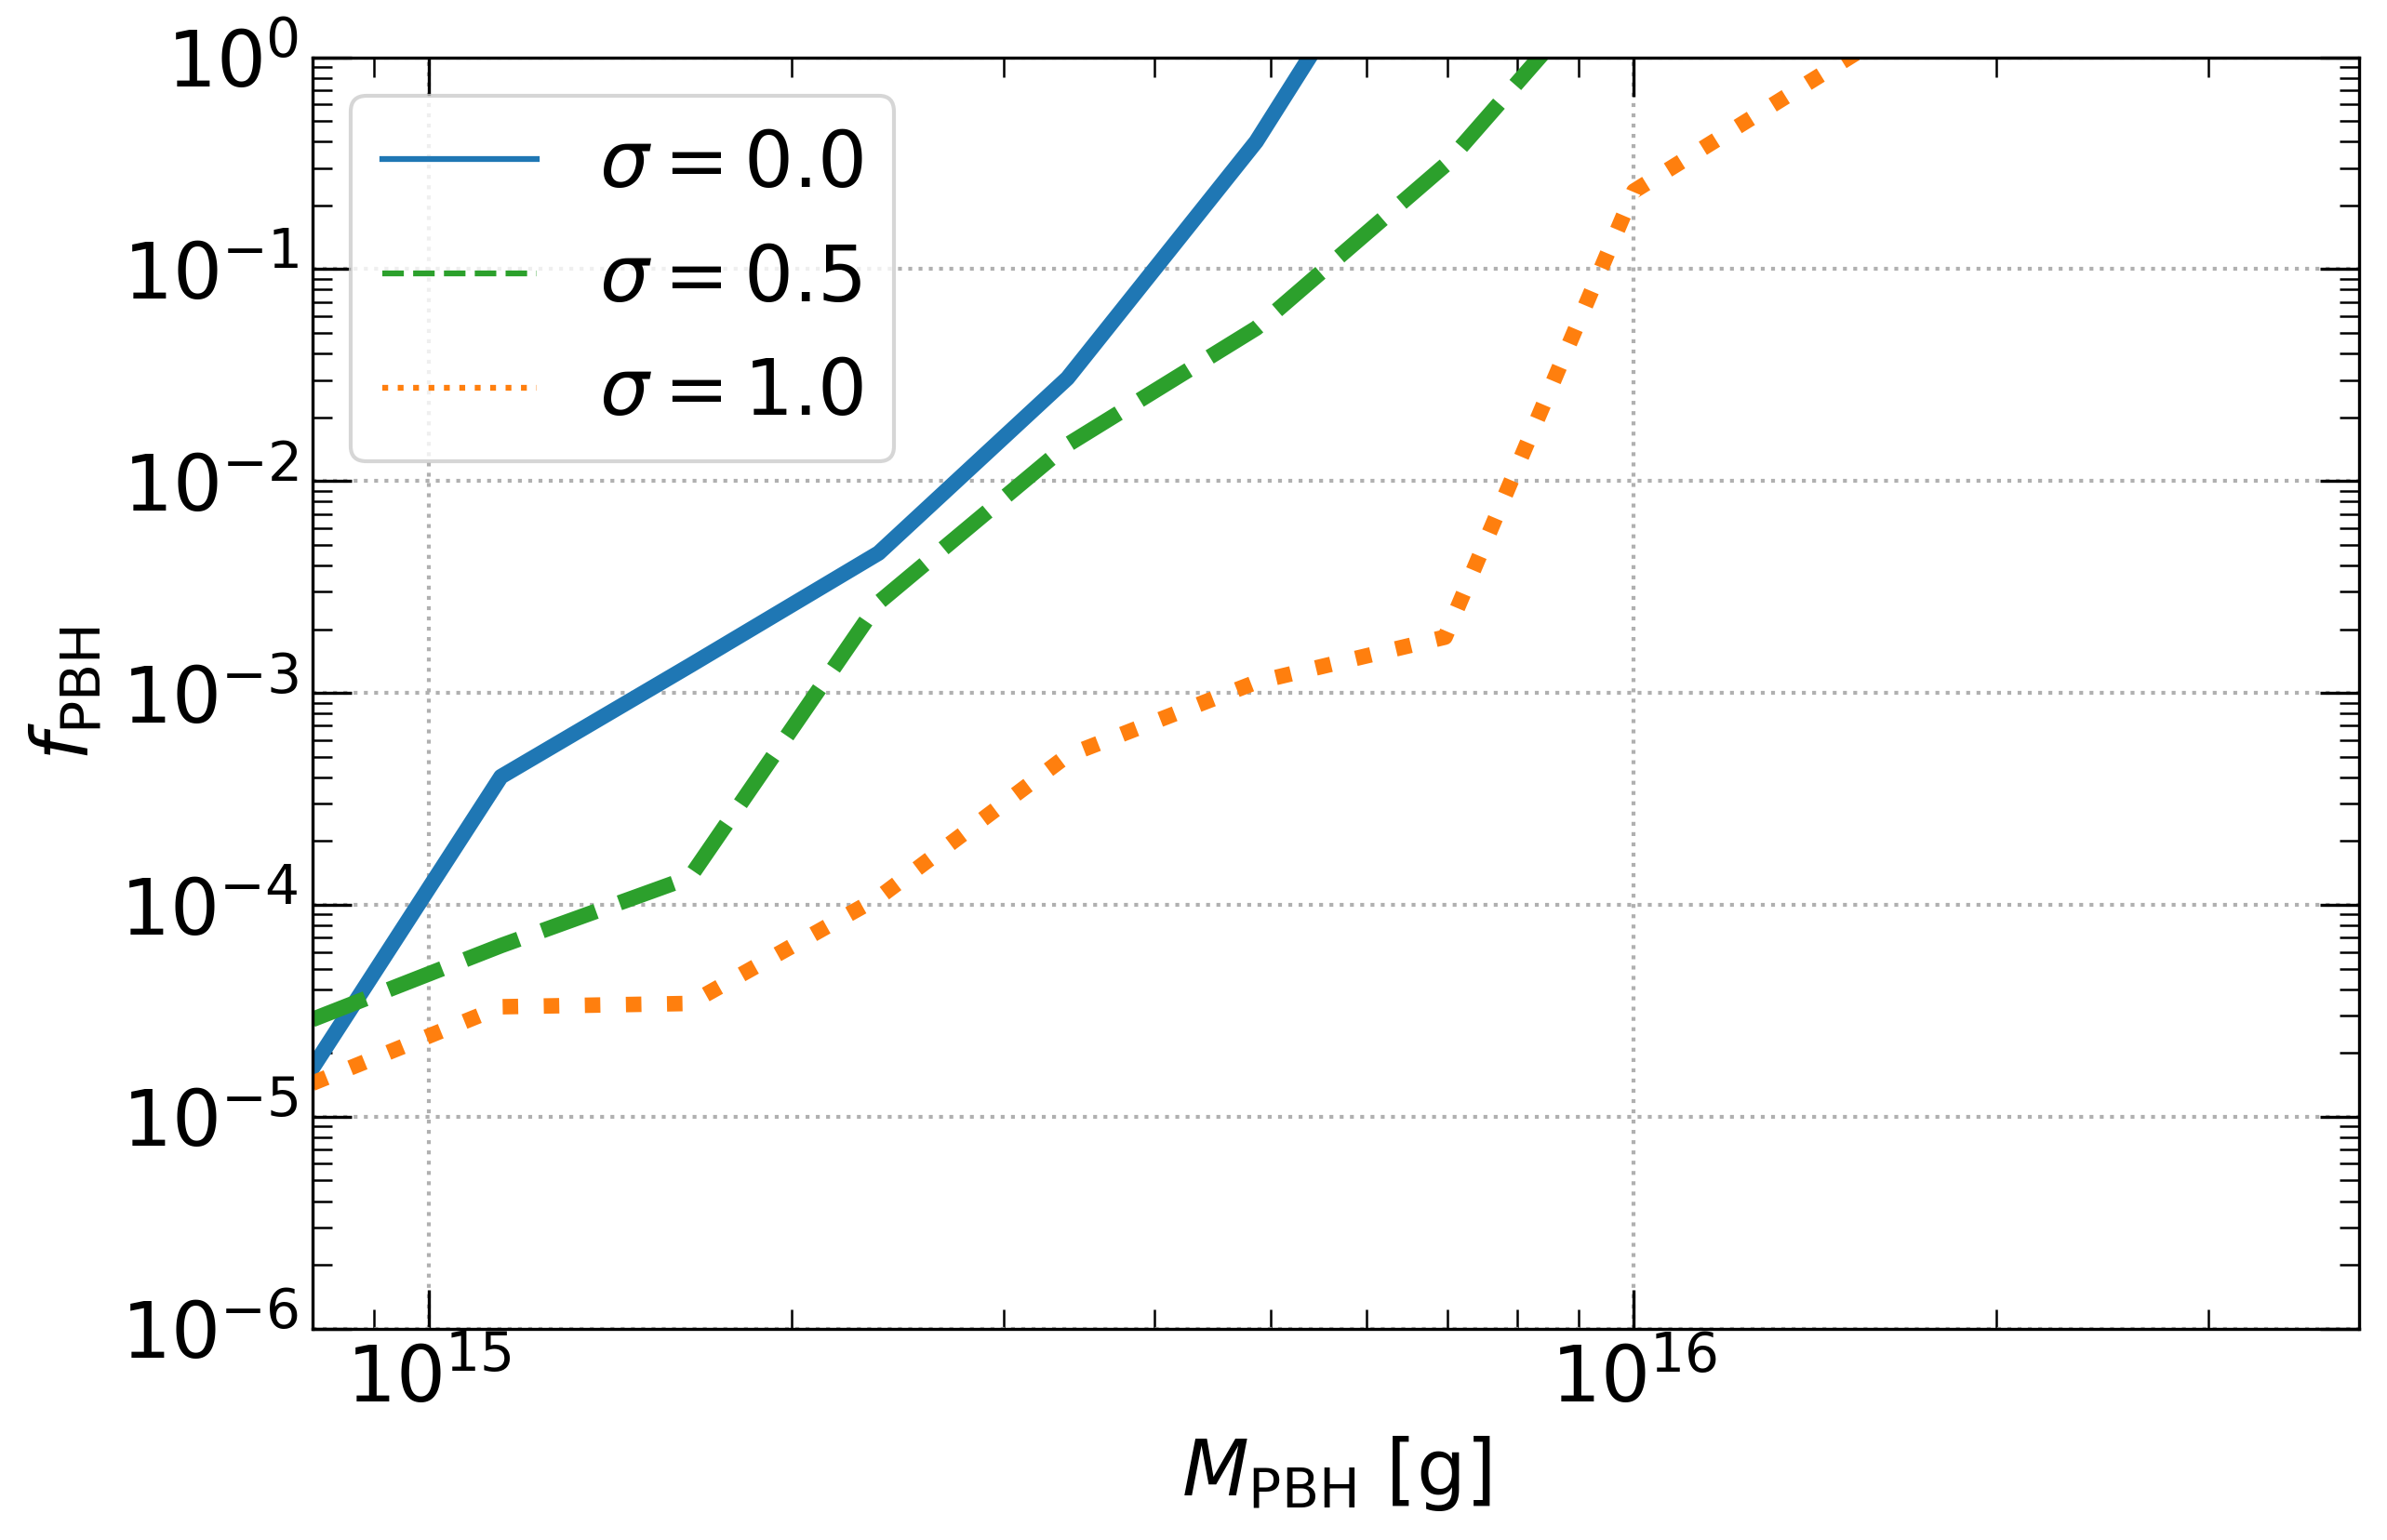
Our results for the case of non-evaporated PBHs, that would account for part of the DM in the Universe, can be compared with the limits in Ref. [60] (similar to those in Ref. [44]), which were obtained by imposing the integrated neutrino flux from PBHs evaporation to be lower than the allowed DSNB flux at SK. Here, as described above, we have performed a more complete analysis, using the spectral information of the detected events and accounting for the different energy distributions of signal and background events. This allows us to get more stringent limits than Refs. [44, 60]. We find that using the full spectral distribution becomes more important for smaller masses and for broader mass distributions. For a monochromatic mass distribution, this is particularly important for g. For these masses, the neutrino flux extends to much higher energies than in DSNB models, so the smaller the PBH mass the larger the ratio of the event rate to the integrated flux. This results in limits up to an order of magnitude more stringent than simply using the integrated DSNB flux. It turns out, however, that for g, current data allow a non-negligible contribution from neutrinos from PBHs evaporation, which weakens the would-be no-signal limit. This causes the small dent around those masses that can be seen in the right panel of Fig. 4 (solid line). For g, using the spectral information improves the constraints by less than a factor of two in the case of a monochromatic mass distribution. For extended mass distributions, accounting for the spectral information sets more stringent constraints up to larger masses (the larger the more extended the mass distribution). The improvement is of a factor of a few for the two log-normal mass distributions we consider and it is larger for the broadest one. Nevertheless, even when making the comparison at the level of integrated fluxes, our results for extended mass distributions are different from those of Ref. [60]. For both cases, we obtain bounds which vary more pronouncedly with PBH mass than those in Ref. [60], so that our limits are more constraining at small masses and less so at large masses. All in all, in comparison with Ref. [60], our results differ by up to an order of magnitude for and up to two orders of magnitude for , the largest differences occurring at the smallest PBH masses (with ).
The effect of considering signal events with muons produced below Cherenkov threshold also becomes more relevant for less massive non-evaporated PBH and for broader mass distributions, whose neutrino flux extends to higher energies where these events would mostly be produced. Counterintuitively, adding this contribution does not strengthen the constraints, but weakens them in general. This can be understood from the fact that the spectrum of invisible muons from neutrinos from PBHs evaporation is the same as that of invisible muons from atmospheric neutrinos, which represents the largest background. This degeneracy could allow accommodating a non-zero flux from PBHs, which would otherwise be disfavored. Yet, the constraint we have imposed on the contribution to invisible muons from the atmospheric neutrino flux does limit the contribution from PBHs. Finally, this addition only amounts to a correction of a few tens of percent in all cases. Had not we imposed such a constraint on the atmospheric neutrino contribution, the limits would (unrealistically) weaken by factors of up to four.
Additionally, we also compute limits on for evaporated PBHs, extending to masses as low as g. These limits represent an update and improvement over previous ones for a monochromatic mass distribution [44], which are about an order of magnitude less stringent than what we obtain. Furthermore, we also compute the limits for the two extended (log-normal) mass distributions considered above, which are more stringent the broader the mass distribution. As discussed above, the smaller PBH masses, the harder the emission spectrum, but also the earlier PBH evaporate and thus, the more substantial the energy redshift. Thus, the hardest neutrino flux at Earth corresponds to PBHs just evaporating now (see Fig. 2), g, and a qualitatively symmetric behavior of the limits for evaporating and non-evaporating PBHs is obtained.
5 Event rates at future detectors
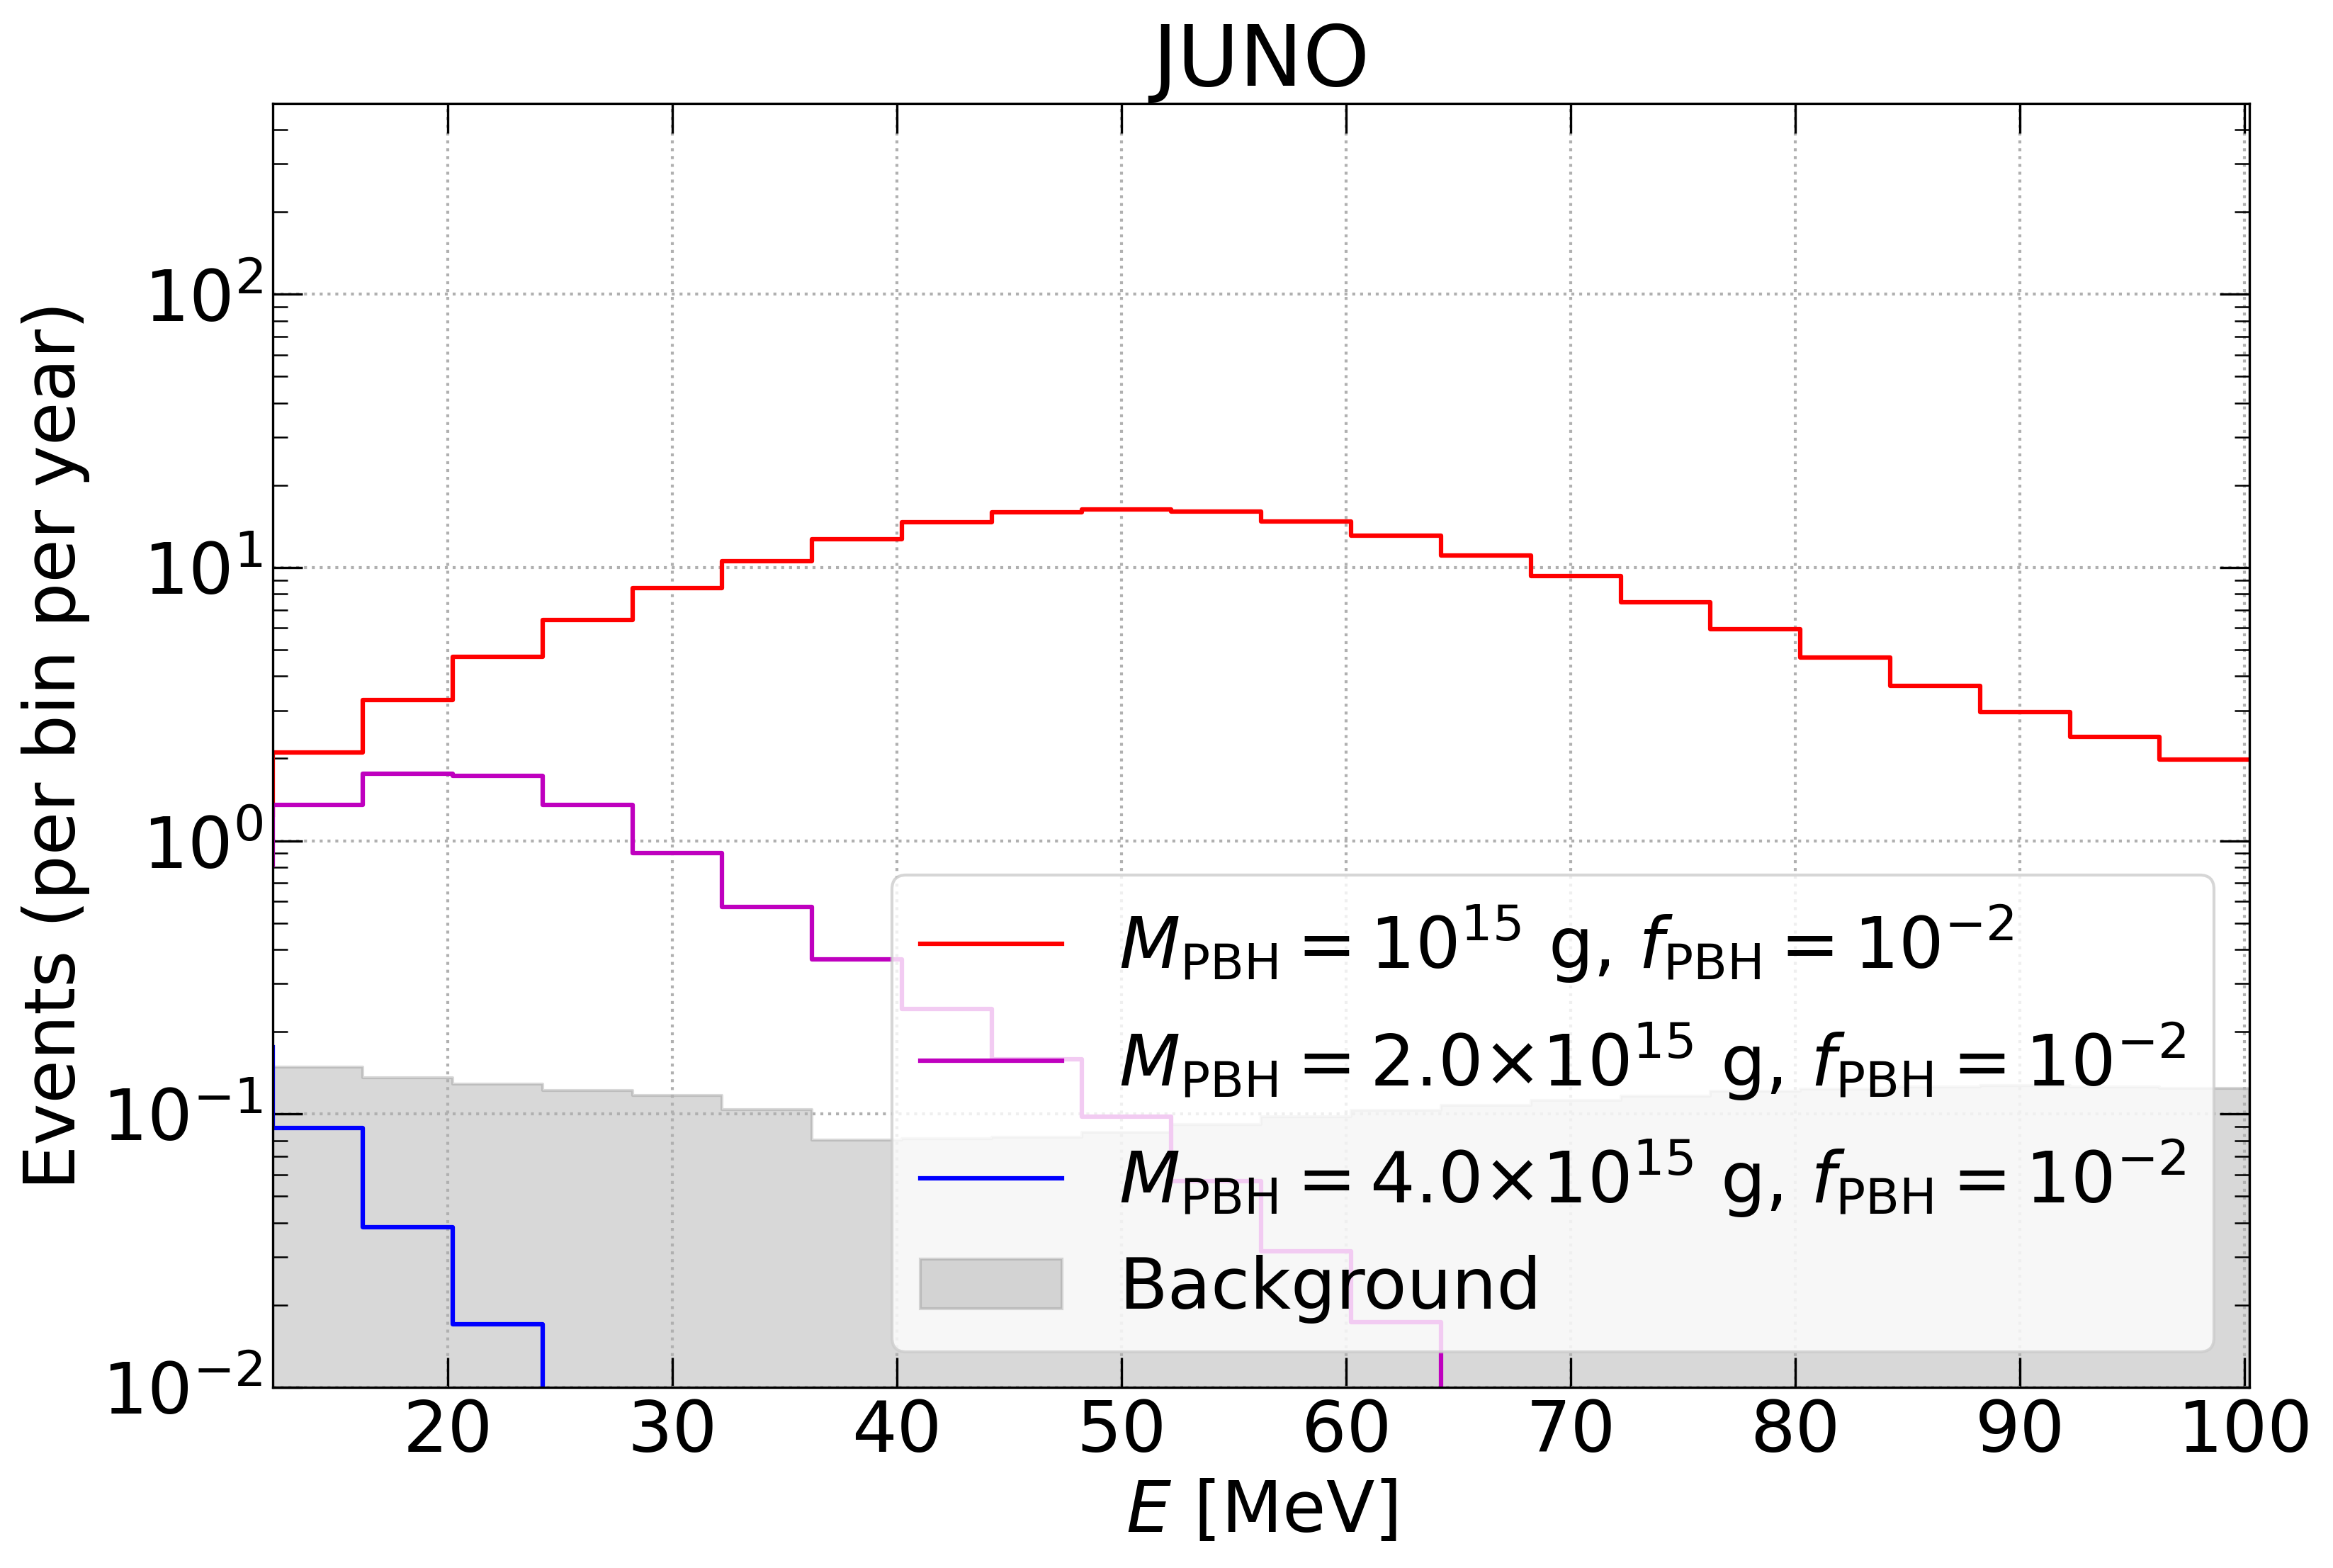
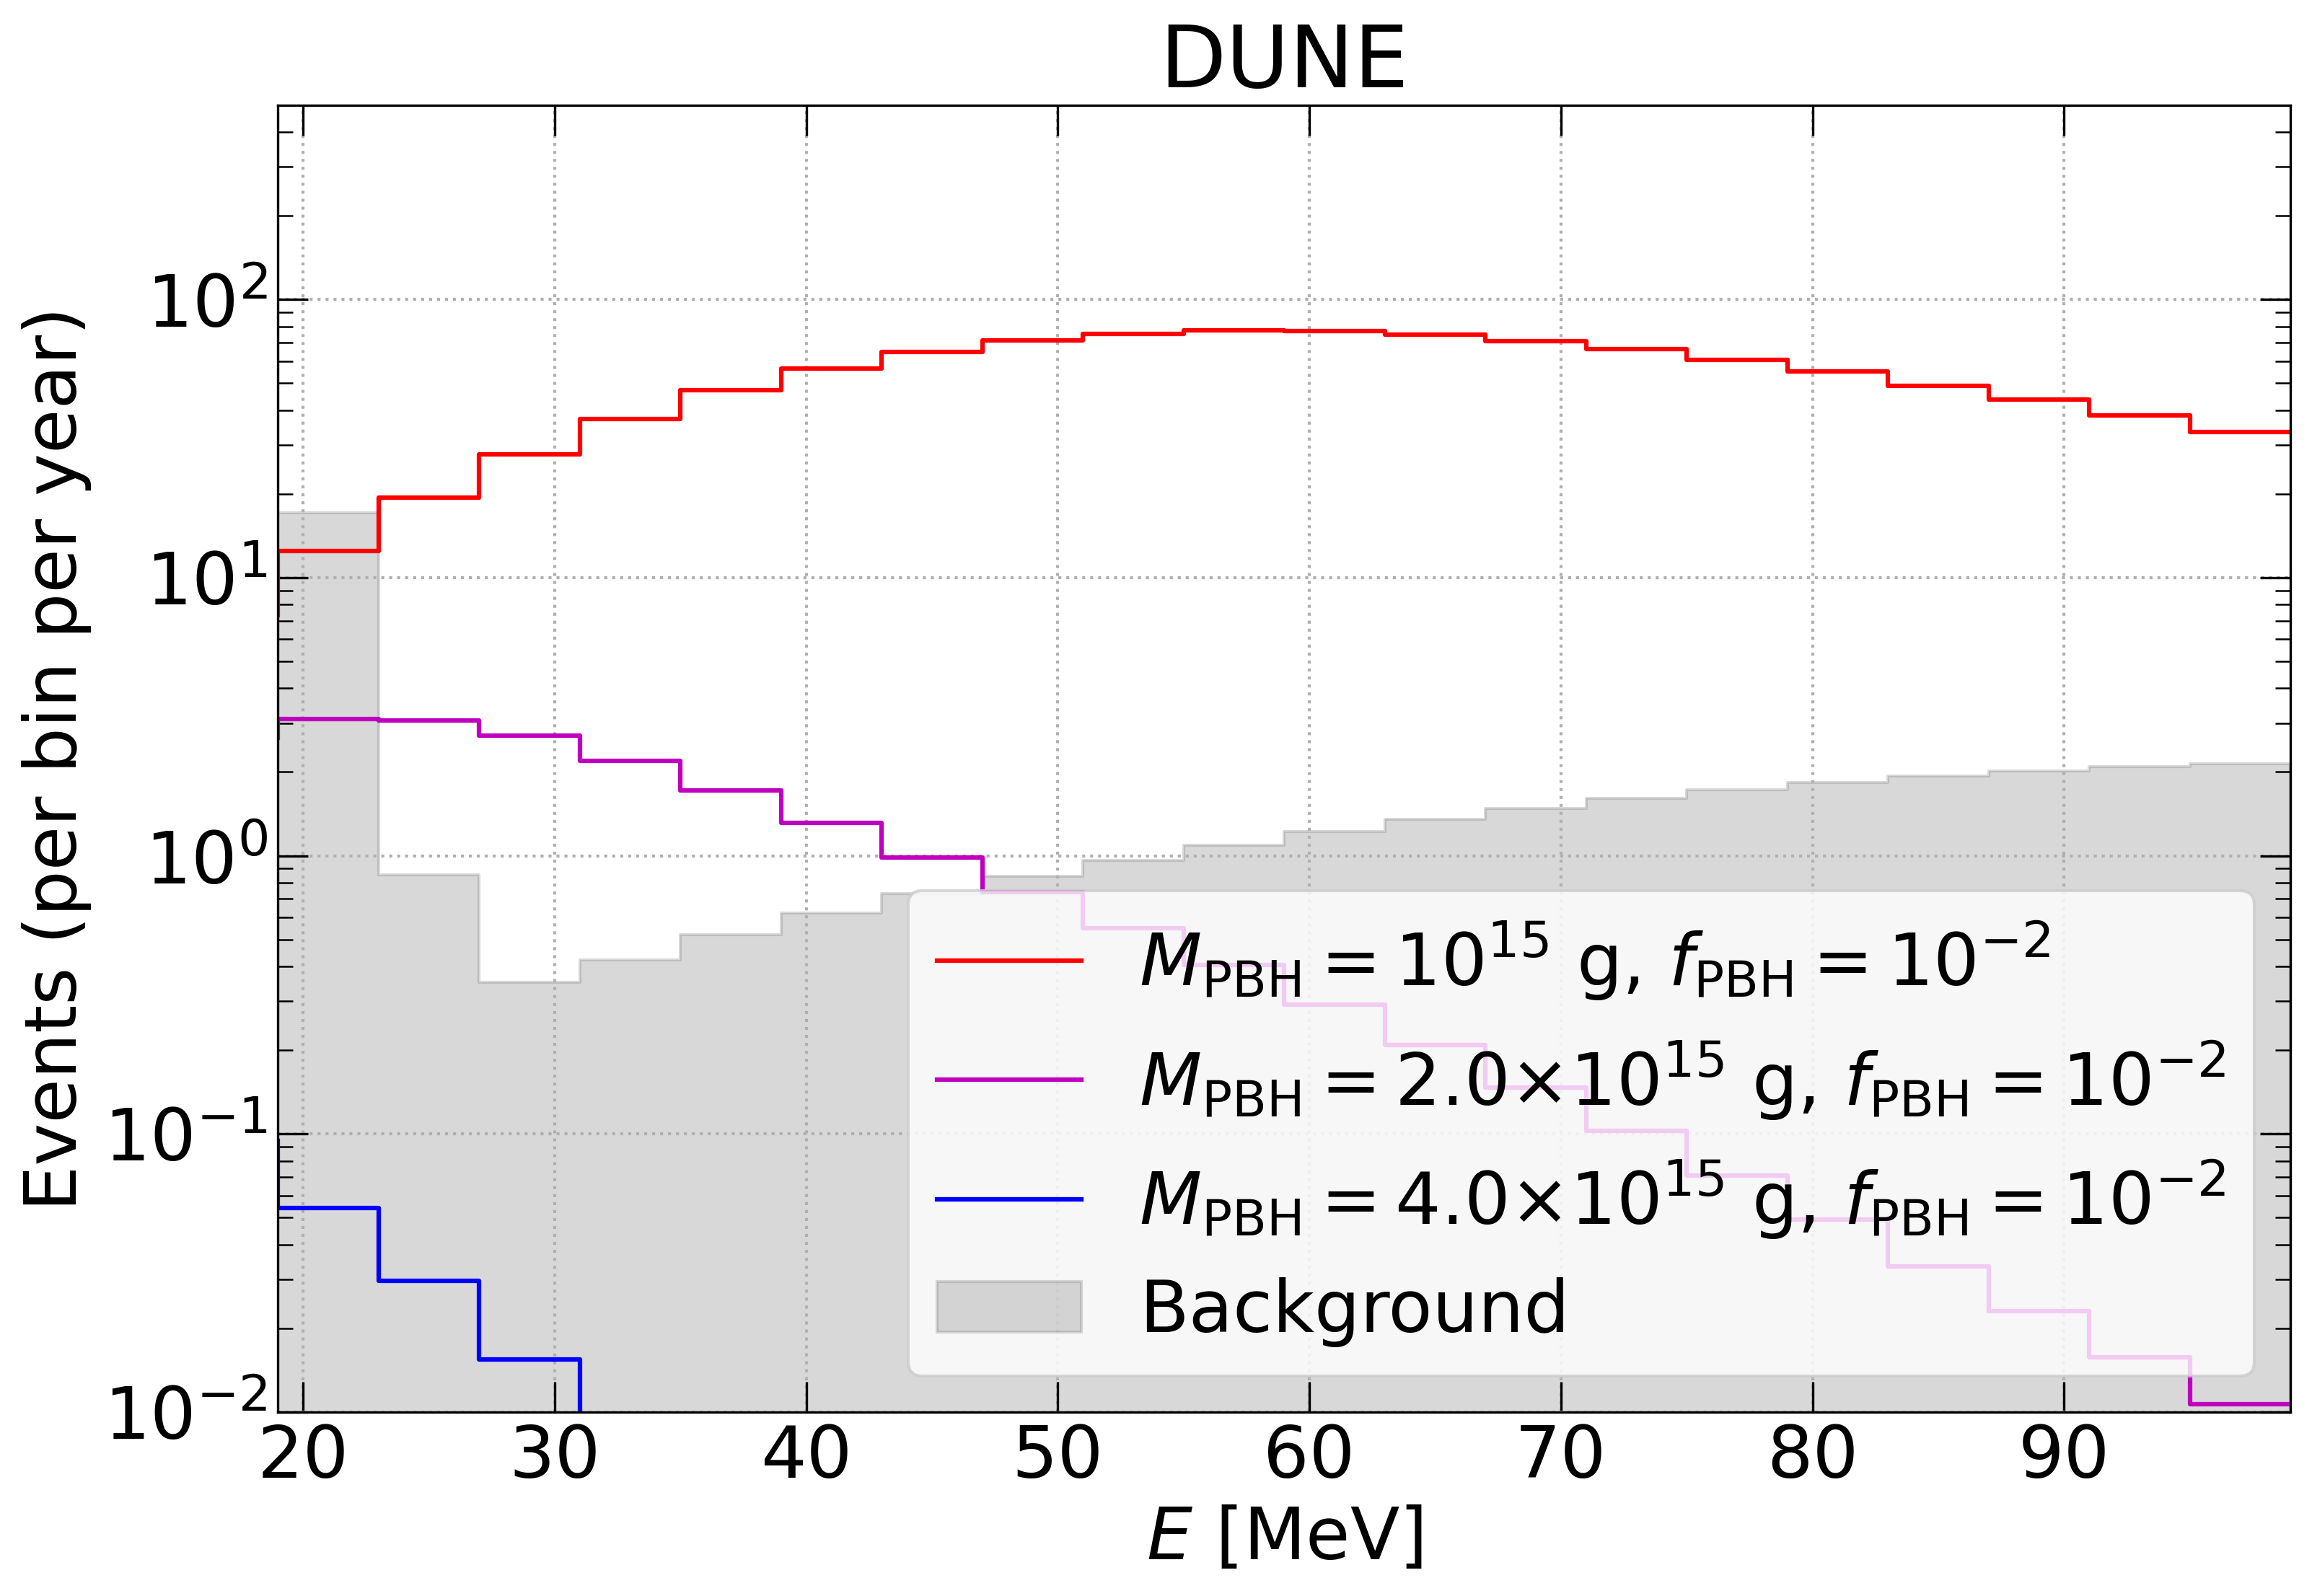
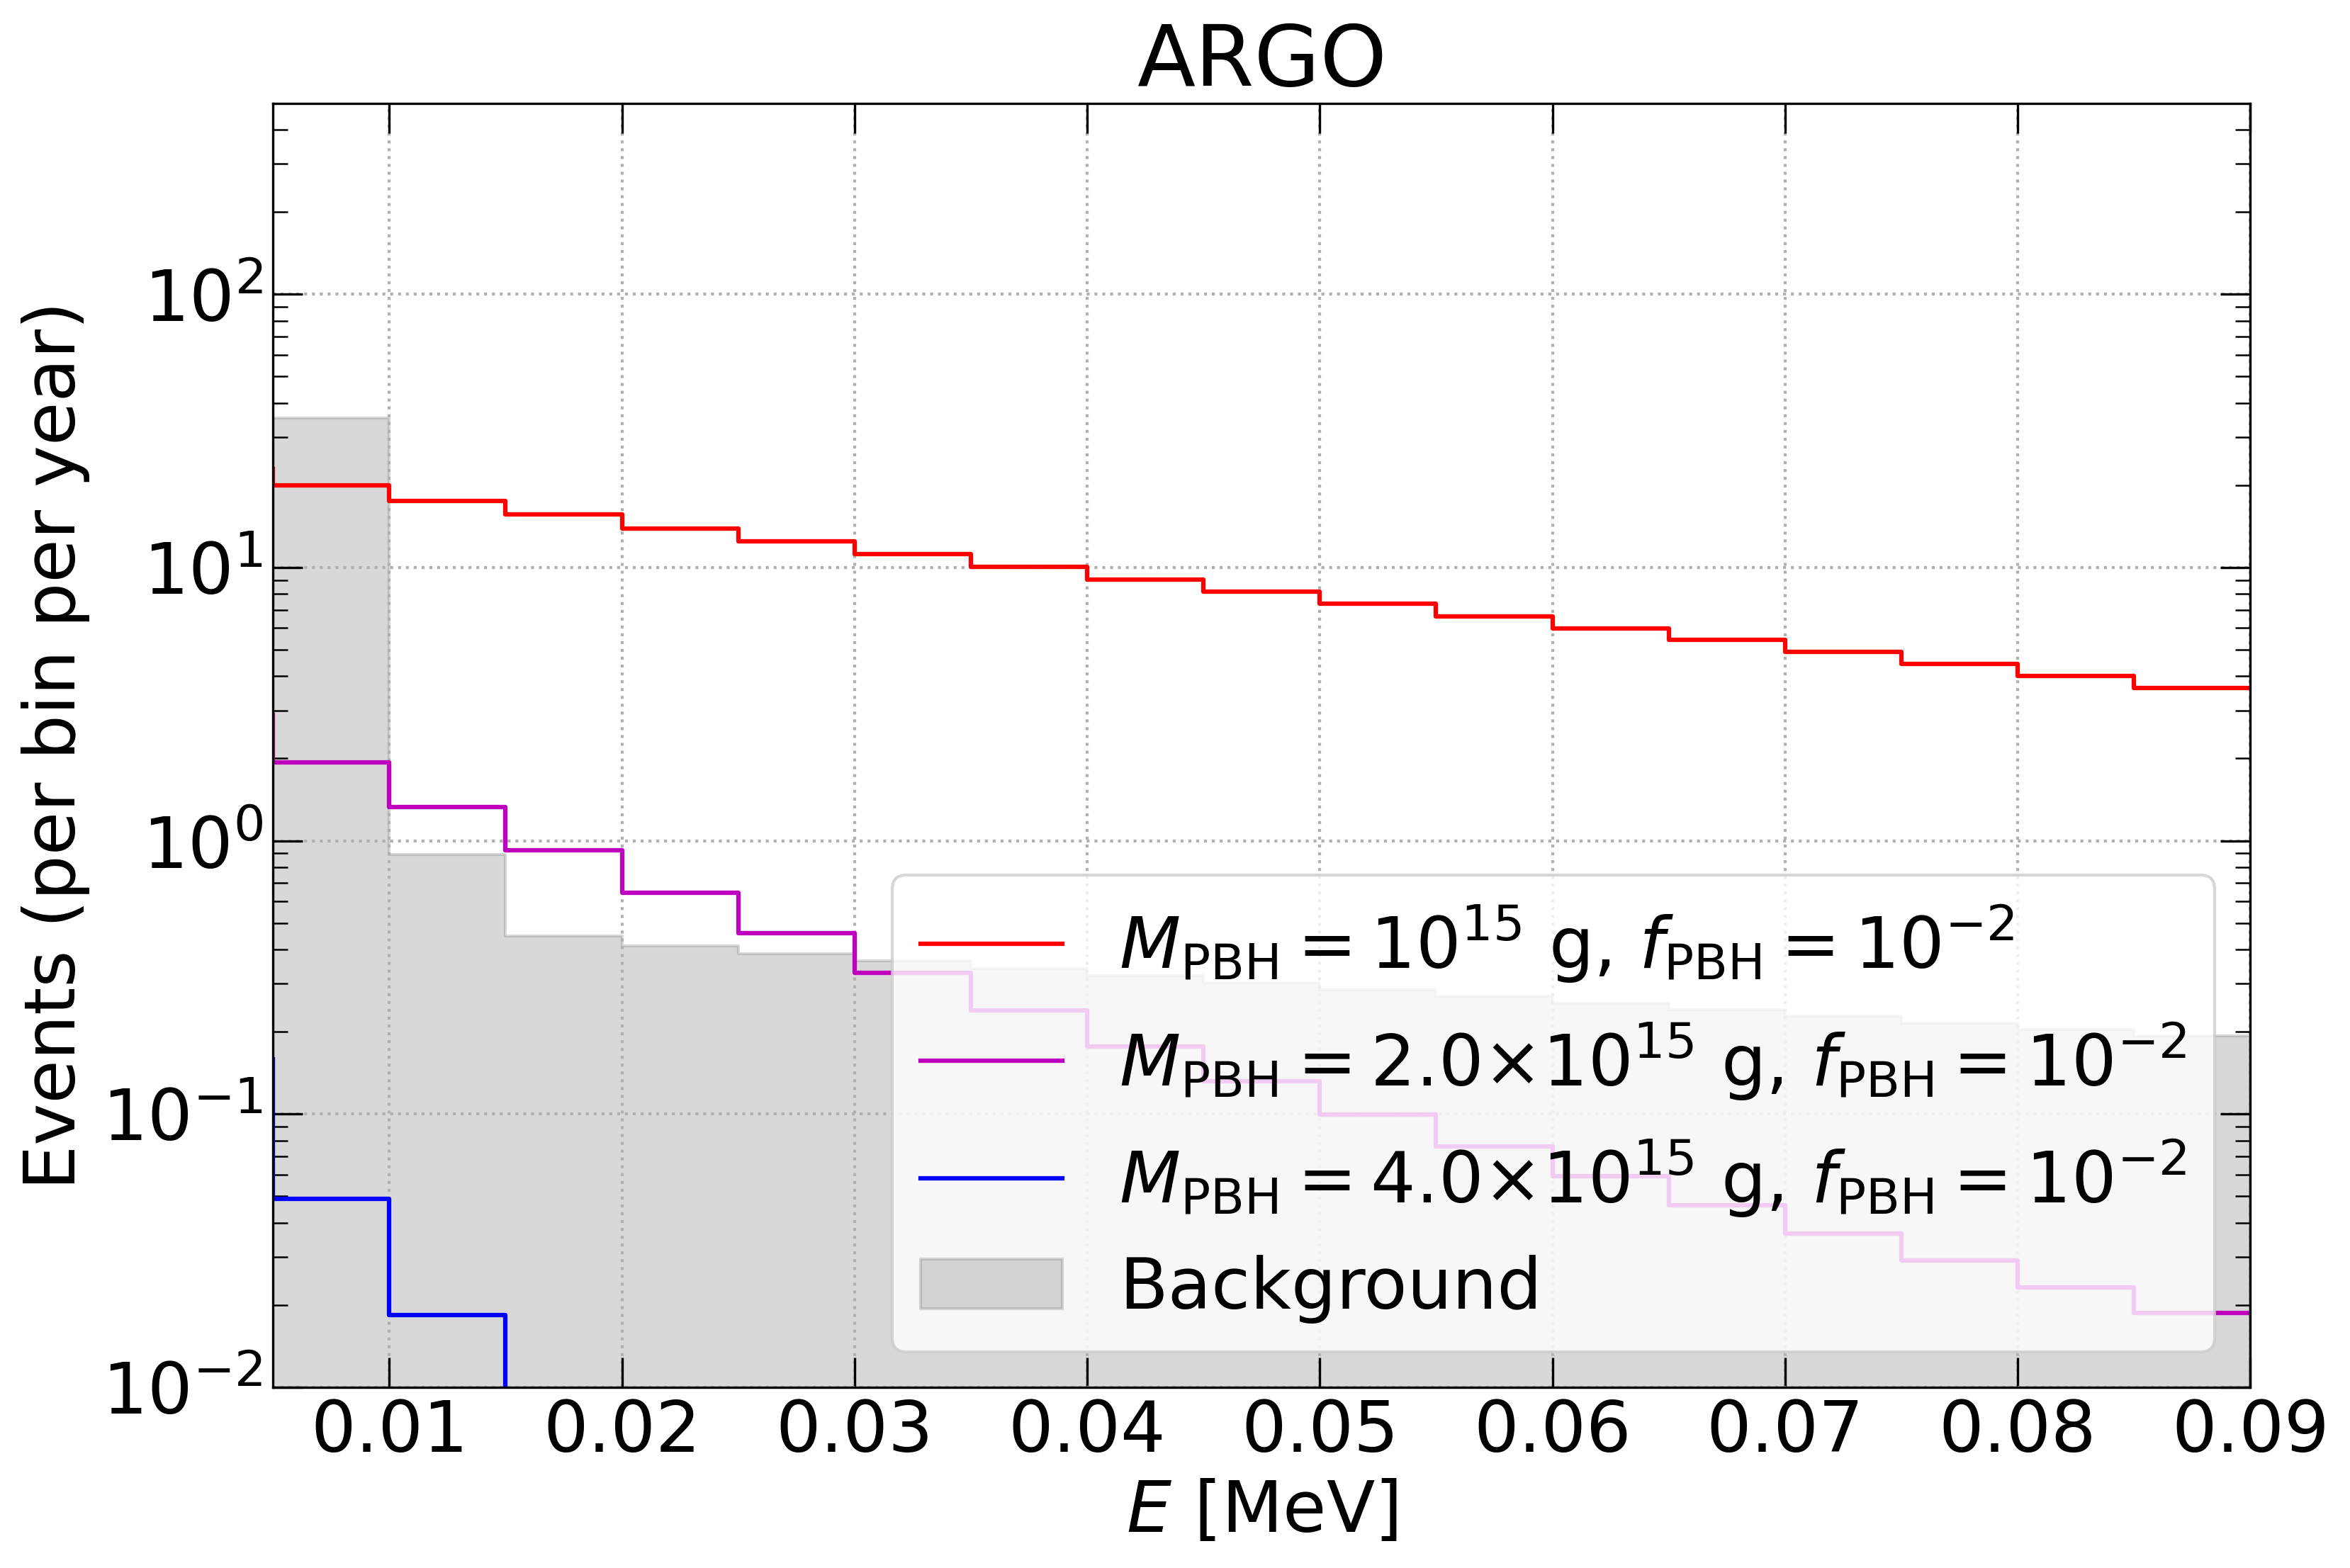
In this section we consider future neutrino and DM detectors and describe the main detection channel of neutrinos (or antineutrinos) from PBHs in each case, as well as the most relevant backgrounds. A summary of some of the features of the detectors considered in this work is shown in Tab. 1. The expected event rates for several PBH masses at different detectors are shown in Fig. 5 along with the background rates (after experimental cuts). The code employed in this section to estimate the sensitivity reach for future experiments, nuHawkHunter [171], has been made publicly available on GitHub \faGithub.111111https://github.com/vmmunoza/nuHawkHunter
| Experiment | Type | Fid. mass (kt) | Main channel | Energy threshold (MeV) |
|---|---|---|---|---|
| Super-Kamiokande [172] | Water Cherenkov | 22.5 | IBD | 16 |
| Hyper-Kamiokande [80] | Water Cherenkov | 374 | IBD | 16 |
| JUNO [81] | Liquid scintillator | 17 | IBD | 12 |
| DUNE [82] | Liquid argon | 40 | Ar | 19 |
| DARWIN [83] | Liquid xenon | 0.04 | CENS | 0.005 |
| ARGO[84] | Liquid argon | 0.37 | CENS | 0.005 |
The different detectors we consider are most sensitive to different channels and present different peculiarities. Among the relevant neutrino interactions with nuclei, one has to consider CC interactions of the form and , which lead to different products, such as de-excitation photons, leptons or neutrons. IBD belongs to the second category. On the other hand, NC include processes of the form , leading to the de-excitation of the nucleus, and also elastic scattering with nuclei, of the form . In general, independently of the specific process, for the forecasts presented in the following section for the different neutrino detectors, the event rates are approximately given by121212An exception is the potential signal from muons produced below threshold in water-Cherenkov detectors. In this case, the spectrum is well defined and only the absolute number of events needs to be computed. In this section, though, we do not include this contribution. Note that, when doped with gadolinium, this background (and therefore, the analogous potential signal) is significantly reduced.
| (5.1) |
where is the number of targets, is the detection efficiency, is the neutrino (or antineutrino) flux of the relevant flavor, is the true energy deposited in the detector, which is a function of the neutrino energy, is the visible energy, is the detection cross section for the correspondent interaction, and is the Gaussian resolution function,
| (5.2) |
where is the energy resolution. At sufficiently low energies, the deposited energy is approximately given in terms of the neutrino energy. For instance, in the case of IBD, we have checked that using the differential cross section instead, as done in the previous section, only introduces minor corrections at the few percent level in the event rate at the highest energies. Given that we provide forecasts of the sensitivity reach of future detectors and that we use a simplified description of them, we do not refine this calculation further.
5.1 Hyper-Kamiokande
Hyper-Kamiokande (HK) [80] is the expected successor of SK, designed to be built in Japan in the following decade. As its predecessor, it will be a water-Cherenkov detector, based therefore on the same physics, but with a larger volume. The planned final configuration contains two tanks of 187 kton of fiducial mass each, corresponding to targets in total. The results presented in this work assume 10 years of data with both tanks.
As in other water-Cherenkov detectors, the main detection channel at HK is IBD, . We use the cross section for the IBD channel tabulated in Ref. [164] (see also Ref. [163]). At energies much below the proton mass, the positron energy, , is approximately given in terms of the incoming neutrino energy, , such that .
The improved efficiency for neutron tagging by the addition of small amounts of gadolinium will help to significantly reduce the background and lower the energy threshold [173].131313After successfully developing the technology [174], the SK-Gd project was initiated in 2015, and in 2020, 10% of the planned final Gd concentration was loaded [175]. Although at the lowest energies, where spallation background cuts are critical to reduce the energy threshold, the efficiency is expected to be smaller than its value at energies MeV, in this section the total efficiency is assumed to be energy-independent. Taking into account a 90% efficiency of neutron capture (assuming a final concentration of 0.1% of gadolinium) and a 74% efficiency to detect 8 MeV photons, it is assumed to be [80]. The energy resolution of the detector is taken into account through the integral over the energy resolution window , assumed to be a Gaussian profile with the same energy resolution of SK-III, [168].
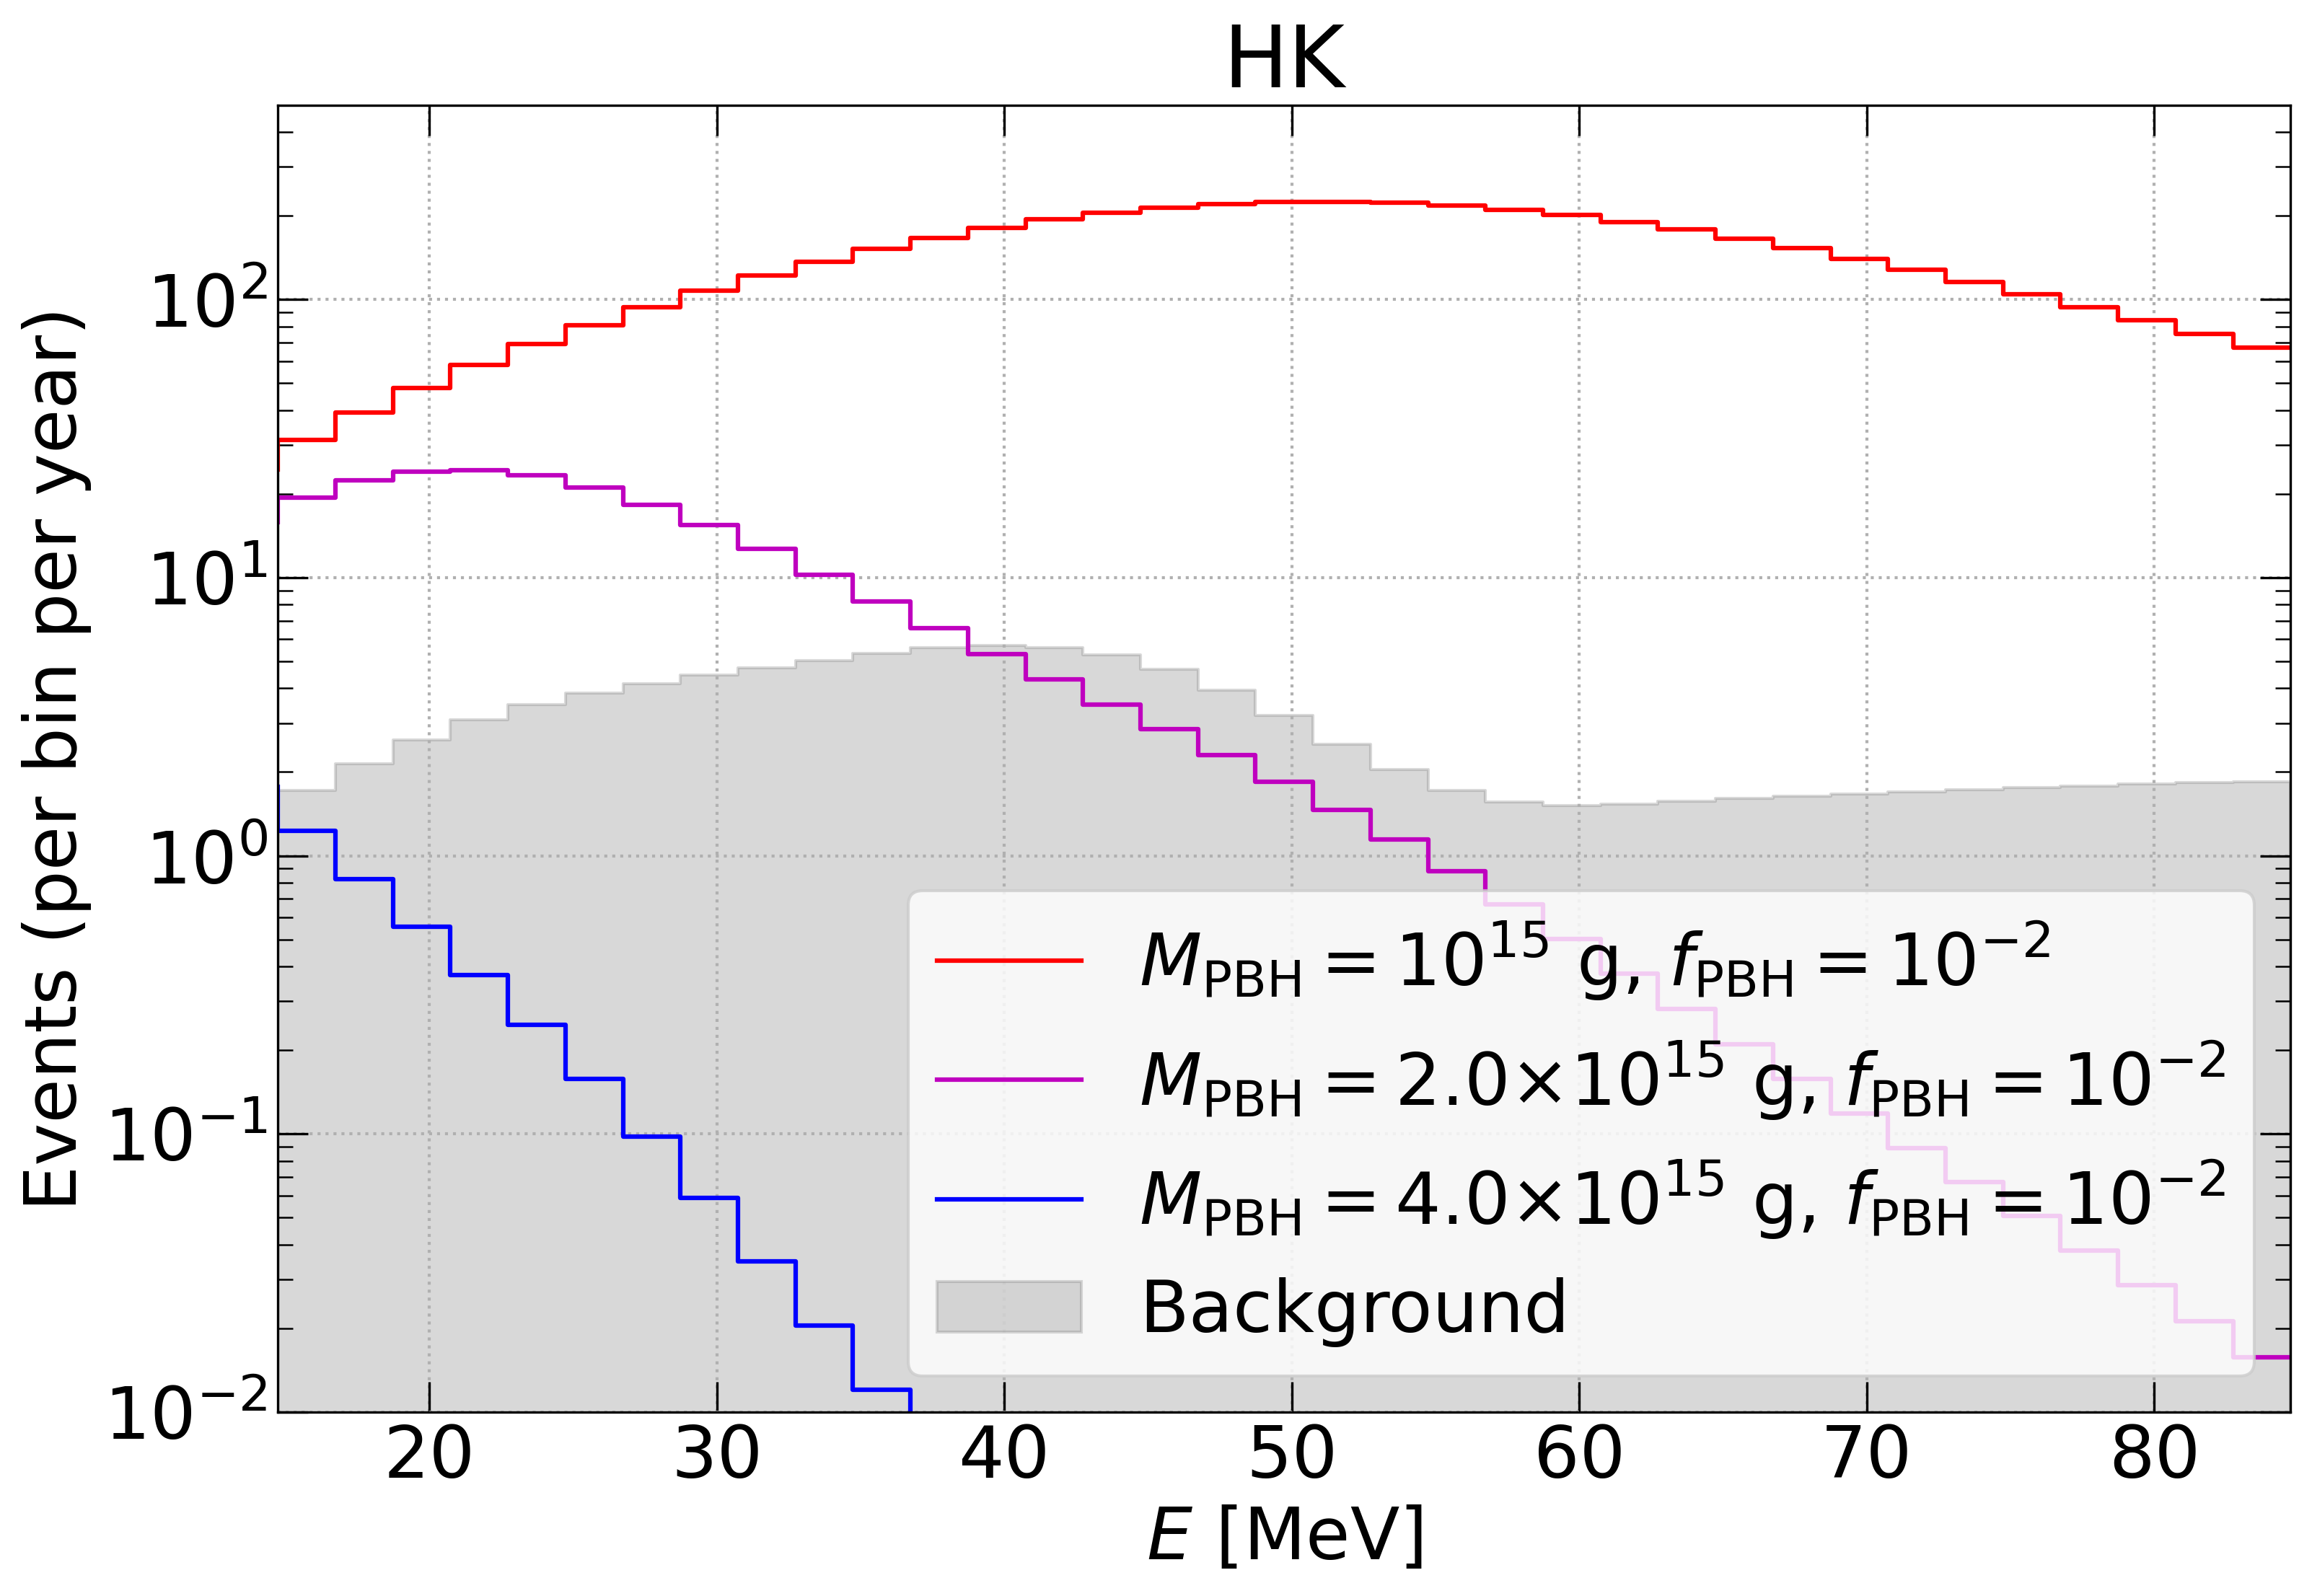
Assuming neutron tagging, the main backgrounds for energies MeV are accidental coincidences with spallation products, spallations products with accompanying neutrons and the tail of reactor antineutrinos (important below MeV) [80]. Among the spallation products, the only one with an accompanying neutron is 9Li, but its short lifetime would allow reaching a very high rejection efficiency. After cuts, above 16 MeV these backgrounds are expected to be negligible, so this is the energy threshold we consider. As discussed above, at higher energies, Michel electrons/positrons from invisible muons and and atmospheric CC events are the main backgrounds. However, the identification of IBD events by tagging neutrons in coincidence with the positron signal, would allow to significantly reduce the atmospheric backgrounds. In this work, we assume a factor of five background reduction with respect to the case of no gadolinium doping. For this background, we adopt the spectral shape corresponding to SK-I from Appendix B of Ref. [104], normalizing it according to Ref. [80] (right panel of Fig. 188). For the atmospheric and background, we make use of the fluxes from the Monte Carlo FLUKA simulations [160]. The expected event rates induced by neutrinos from PBH evaporation (for several PBH masses and assuming a monochromatic mass distribution) and the background rate are shown in the upper left panel of Fig. 5.
5.2 JUNO
The Jiangmen Underground Neutrino Observatory (JUNO) [81, 176] is a planned 20 kton liquid scintillator detector to be built in Jiangmen, China, consisting of a central tank filled with of linear alkylbenzene. The central detector is surrounded by a water-Cherenkov detector within a muon tracker, aimed at reducing certain sources of background, which will result in 17 kton of fiducial mass.
As in the case of water-Cherenkov detectors, the most important detection channel at the relevant energies is IBD [177, 100]. Therefore, the event rate is also approximately given by Eq. (5.1), with targets. We assume a detection efficiency of , due to the application of pulse-shape discrimination techniques to suppress backgrounds [178] (see below). Unlike Cherenkov detectors, rather than detecting the positron from the IBD reaction, liquid scintillator detectors tag photons from the subsequent positron-electron annihilation. Thus, the observed energy is given by MeV. Hence, . The width of the Gaussian energy resolution function for JUNO is assumed to be [176].
The most relevant backgrounds include reactor antineutrinos, NC atmospheric neutrino and antineutrino events, and CC atmospheric antineutrino events. The reactor antineutrino background dominates at energies MeV, so in our analysis we only consider MeV. Above this energy and up to MeV, the dominant background (after selection cuts) is caused by NC interactions with 12C, which can produce free neutrons and other nuclei as final states, which later decay and mimic the IBD signature. We consider the estimate of the event rate corresponding to this background from Ref. [176] (right panel of Fig. 5-2) after the application of pulse-shape discrimination [178], which is based on the computations for the KamLAND [179] and LENA [178] detectors, that result in a signal efficiency of . At higher energies, the NC background can be neglected with respect to interactions of atmospheric via CC (mainly IBD), which are the major source of background. To compute this background we consider the atmospheric neutrino fluxes obtained by the Monte Carlo FLUKA simulations [160], also assuming an efficiency of . Since the tabulated atmospheric fluxes are computed at the Kamioka latitude, we correct them to account for latitude effects by a constant multiplying factor, interpolating between the latitude correction factors from Ref. [180]. Unlike in water-Cherenkov detectors, in liquid scintillator detectors, muons can be very efficiently tagged, so the invisible muon background is negligible. Finally, fast neutrons from cosmic muon decays represent another source of background. However, such events are expected to occur at the edges of the detector, and thus its rate can be reduced to events/yr by introducing a soft fiducial volume cut. The application of pulse shape discrimination can further reduce this background down to events/yr [176], making it negligible.
The expected event rates induced by neutrinos from PBH evaporation (for several PBH masses and assuming a monochromatic mass distribution) and the background rate are shown in the upper right panel of Fig. 5.
5.3 DUNE
The Deep Underground Neutrino Experiment (DUNE) [82, 181] includes a liquid argon detector to be built in South Dakota, USA, composed of four time projection chambers of 10 kton each, resulting in a fiducial volume of 40 kton. The most relevant detection channel is the CC interaction of electron neutrinos with argon,
| (5.3) |
The event rate of a particular signal is computed via Eq. (5.1), with , and an efficiency (given by a trigger efficiency of 90% and a reconstruction efficiency of 96% [182, 183]). The total interaction cross section, , is obtained from Ref. [184] (see also Refs. [185, 186]), and can be approximately fitted by
| (5.4) |
which matches the tabulated values within in the energy range MeV. Given that its uncertainty is energy dependent and not smaller than 10% [186], this seems a reasonable fit. In our calculations, though, we use the tabulated values. Finally, the neutrino energy resolution () for the DUNE detector is taken to be [181] (right panel of Fig. 7.5).141414Note that a more optimistic neutrino energy resolution for the DUNE detector has also been considered within the context of neutrinos from PBHs evaporation [101]. Nevertheless, that energy resolution () actually corresponds to electrons and does not account for energy losses to neutrons, which limit the neutrino energy resolution to be above 15% for MeV [181].
At energies of a few MeV, the major sources of background in DUNE include neutron capture processes, due to radiogenic and cosmogenic sources, beta decays from atmospheric muon-induced spallation products, and 8B and hep solar neutrinos (see, e.g., Ref. [186]). Above MeV, solar and spallation backgrounds are the most important ones. Nevertheless, after applying some experimental cuts, the spallation background can be reduced to a negligible level at those energies [187]. Due to the high solar neutrino flux, the neutrino energy resolution of the detector determines the actual neutrino energy threshold for new signals. This can be clearly seen in the lower left panel of Fig. 5, where we depict the expected PBH signal (for several PBH masses and assuming a monochromatic mass distribution) and background event rates. The minimum energy for signal events to overcome backgrounds is larger than the endpoint of the hep solar neutrino spectrum (18.8 MeV). This impacts the maximum PBH mass that could actually be tested with DUNE. At higher energies, the dominant background comes from atmospheric CC interactions [185], Eq. (5.3). To compute these backgrounds, we consider solar neutrino fluxes [159] and we use the FLUKA simulations for low-energy atmospheric neutrino fluxes [160], corrected by a multiplicative latitude factor [180], as done above.
5.4 Dark matter detectors: DARWIN and ARGO
Direct DM detection experiments can also be effective neutrino detectors, via CENS. This process can occur as long as the wavelength of the momentum transferred to the target is large enough so that the entire region within the wavelength contributes to the amplitude.
Among the several projected DM detectors, DARWIN [83] will be composed of liquid xenon, and ARGO [84] of liquid argon, both planned to be placed at Gran Sasso, Italy. Here, for both experiments we assume a threshold for the nuclear recoil energy of keV and a maximum of keV, but we do not explicitly describe the quenching effects which could alter the energy spectrum. Note that is not the physical threshold of the experiments. Below this energy, however, the solar neutrino background would bury any possible signal from PBHs evaporation.
In the absence of physics beyond the SM, the CENS cross section with a nucleus , neglecting corrections of order and , is given by [188]
| (5.5) |
where is the recoil energy of the target nucleus, is the mass of the target nucleus, is Fermi coupling constant, is the weak hypercharge of a nucleus with neutrons and protons, and the weak charges of the neutron and the proton are and , with is the weak mixing angle, and is the nuclear form factor, taken to be the Helm form factor [189, 190].151515Note that , where and are the neutron and proton form factors, which in this work, are assumed to be equal. Since at low momentum transfer [191], the CENS cross section scales approximately as , which results in a significant enhancement for heavy nuclei.
Unlike the sensitivity studies above, here we consider the differential scattering cross section, so the event rate produced by neutrinos scattering off a target nucleus is written as
| (5.6) |
where . We assume perfect efficiency, , and an energy resolution () given by . This resolution approximately corresponds to expectations for an S2-based signal [192], being about 20% at 5 keV in a xenon detector [83]. Combining light and charge signals could improve the energy resolution by some tens of per cent, so from this point of view, our assumption is conservative. In this work, we use the same energy resolution for DARWIN and ARGO, although notice that liquid argon detectors could have a better energy resolution [84]. The number of targets is (40 t) for DARWIN and (370 t) for ARGO.
For the analysis, we use a bin size of keV in the measured (corrected for quenching) nuclear recoil energy. Notice that since the detection channel is a neutral-current process, all neutrino (and antineutrino) flavors contribute to the expected event spectrum. For these DM detectors, we consider the dominant backgrounds to be the solar and atmospheric neutrino fluxes (using the same fluxes as above) interacting with the target material via the CENS channel. The expected event rates induced by neutrinos from PBH evaporation (for several PBH masses and assuming a monochromatic mass distribution) and the background rate for ARGO are shown in the lower right panel of Fig. 5.
6 Sensitivity reach of future detectors
Next, we present sensitivity studies by performing a binned extended likelihood analysis for each detector. In all cases, we assume a data collection time of years and a bin size of MeV for HK, MeV for JUNO and DUNE and keV for the DM detectors (DARWIN and ARGO). We consider the maximum likelihood ratio, which for independently Poisson distributed data, can be written as
| (6.1) |
where is the number of expected events in bin produced by neutrinos from PBHs evaporation, is the number of expected background events in bin , and is the number of data points in bin . For the forecasts, our null hypothesis is the case with no contribution from PBH evaporation, and thus we take . Moreover, throughout the work, we assume the likelihood ratio to follow a distribution with one degree of freedom.
Note that the procedure we follow relies on several simplifying assumptions, which are expected to modify the sensitivities to different extent, although not dramatically. We have not included systematic uncertainties, as for instance in the background expectations, where we have not included the DSNB. Detection efficiencies have been taken as constants, while more realistic treatments would imply energy dependent efficiencies. Similarly, the energy resolution functions have been taken from the experimental proposals and may vary for the actual experiments. Furthermore, we have restricted ourselves to the main detection channels for each future experiment. Nonetheless, in detectors like HK and JUNO, other detection channels besides IBD could give rise to non-negligible (although subdominant) signals from PBHs, as well as their corresponding backgrounds. We have only considered Majorana neutrinos, while slightly different constraints would be obtained for Dirac neutrinos [147]. Although detected events are not sensitive to the Dirac/Majorana nature, the existence of Dirac neutrinos would lead to PBHs emitting more degrees of freedom (12 rather than 6), and hence evaporating somewhat earlier and with a slightly different neutrino spectrum. It is also worth to note that all these results apply to PBHs in asymptotically flat space-time. Properly describing PBHs with a metric embedded in a cosmological space-time may notably change the bounds from Hawking evaporation [193, 194]. Finally, notice that bounds from X-ray and -ray observations [44, 45, 46, 47, 48, 58, 59, 60, 61, 62] and from BBN abundances [51, 44, 52] and CMB anisotropies [53, 54, 55, 56, 57, 52] are more stringent (see, e.g., Ref. [39] for a complete compendium of bounds) than those obtained with neutrinos. All in all, these limits are complementary.
6.1 Sensitivity for PBHs as DM
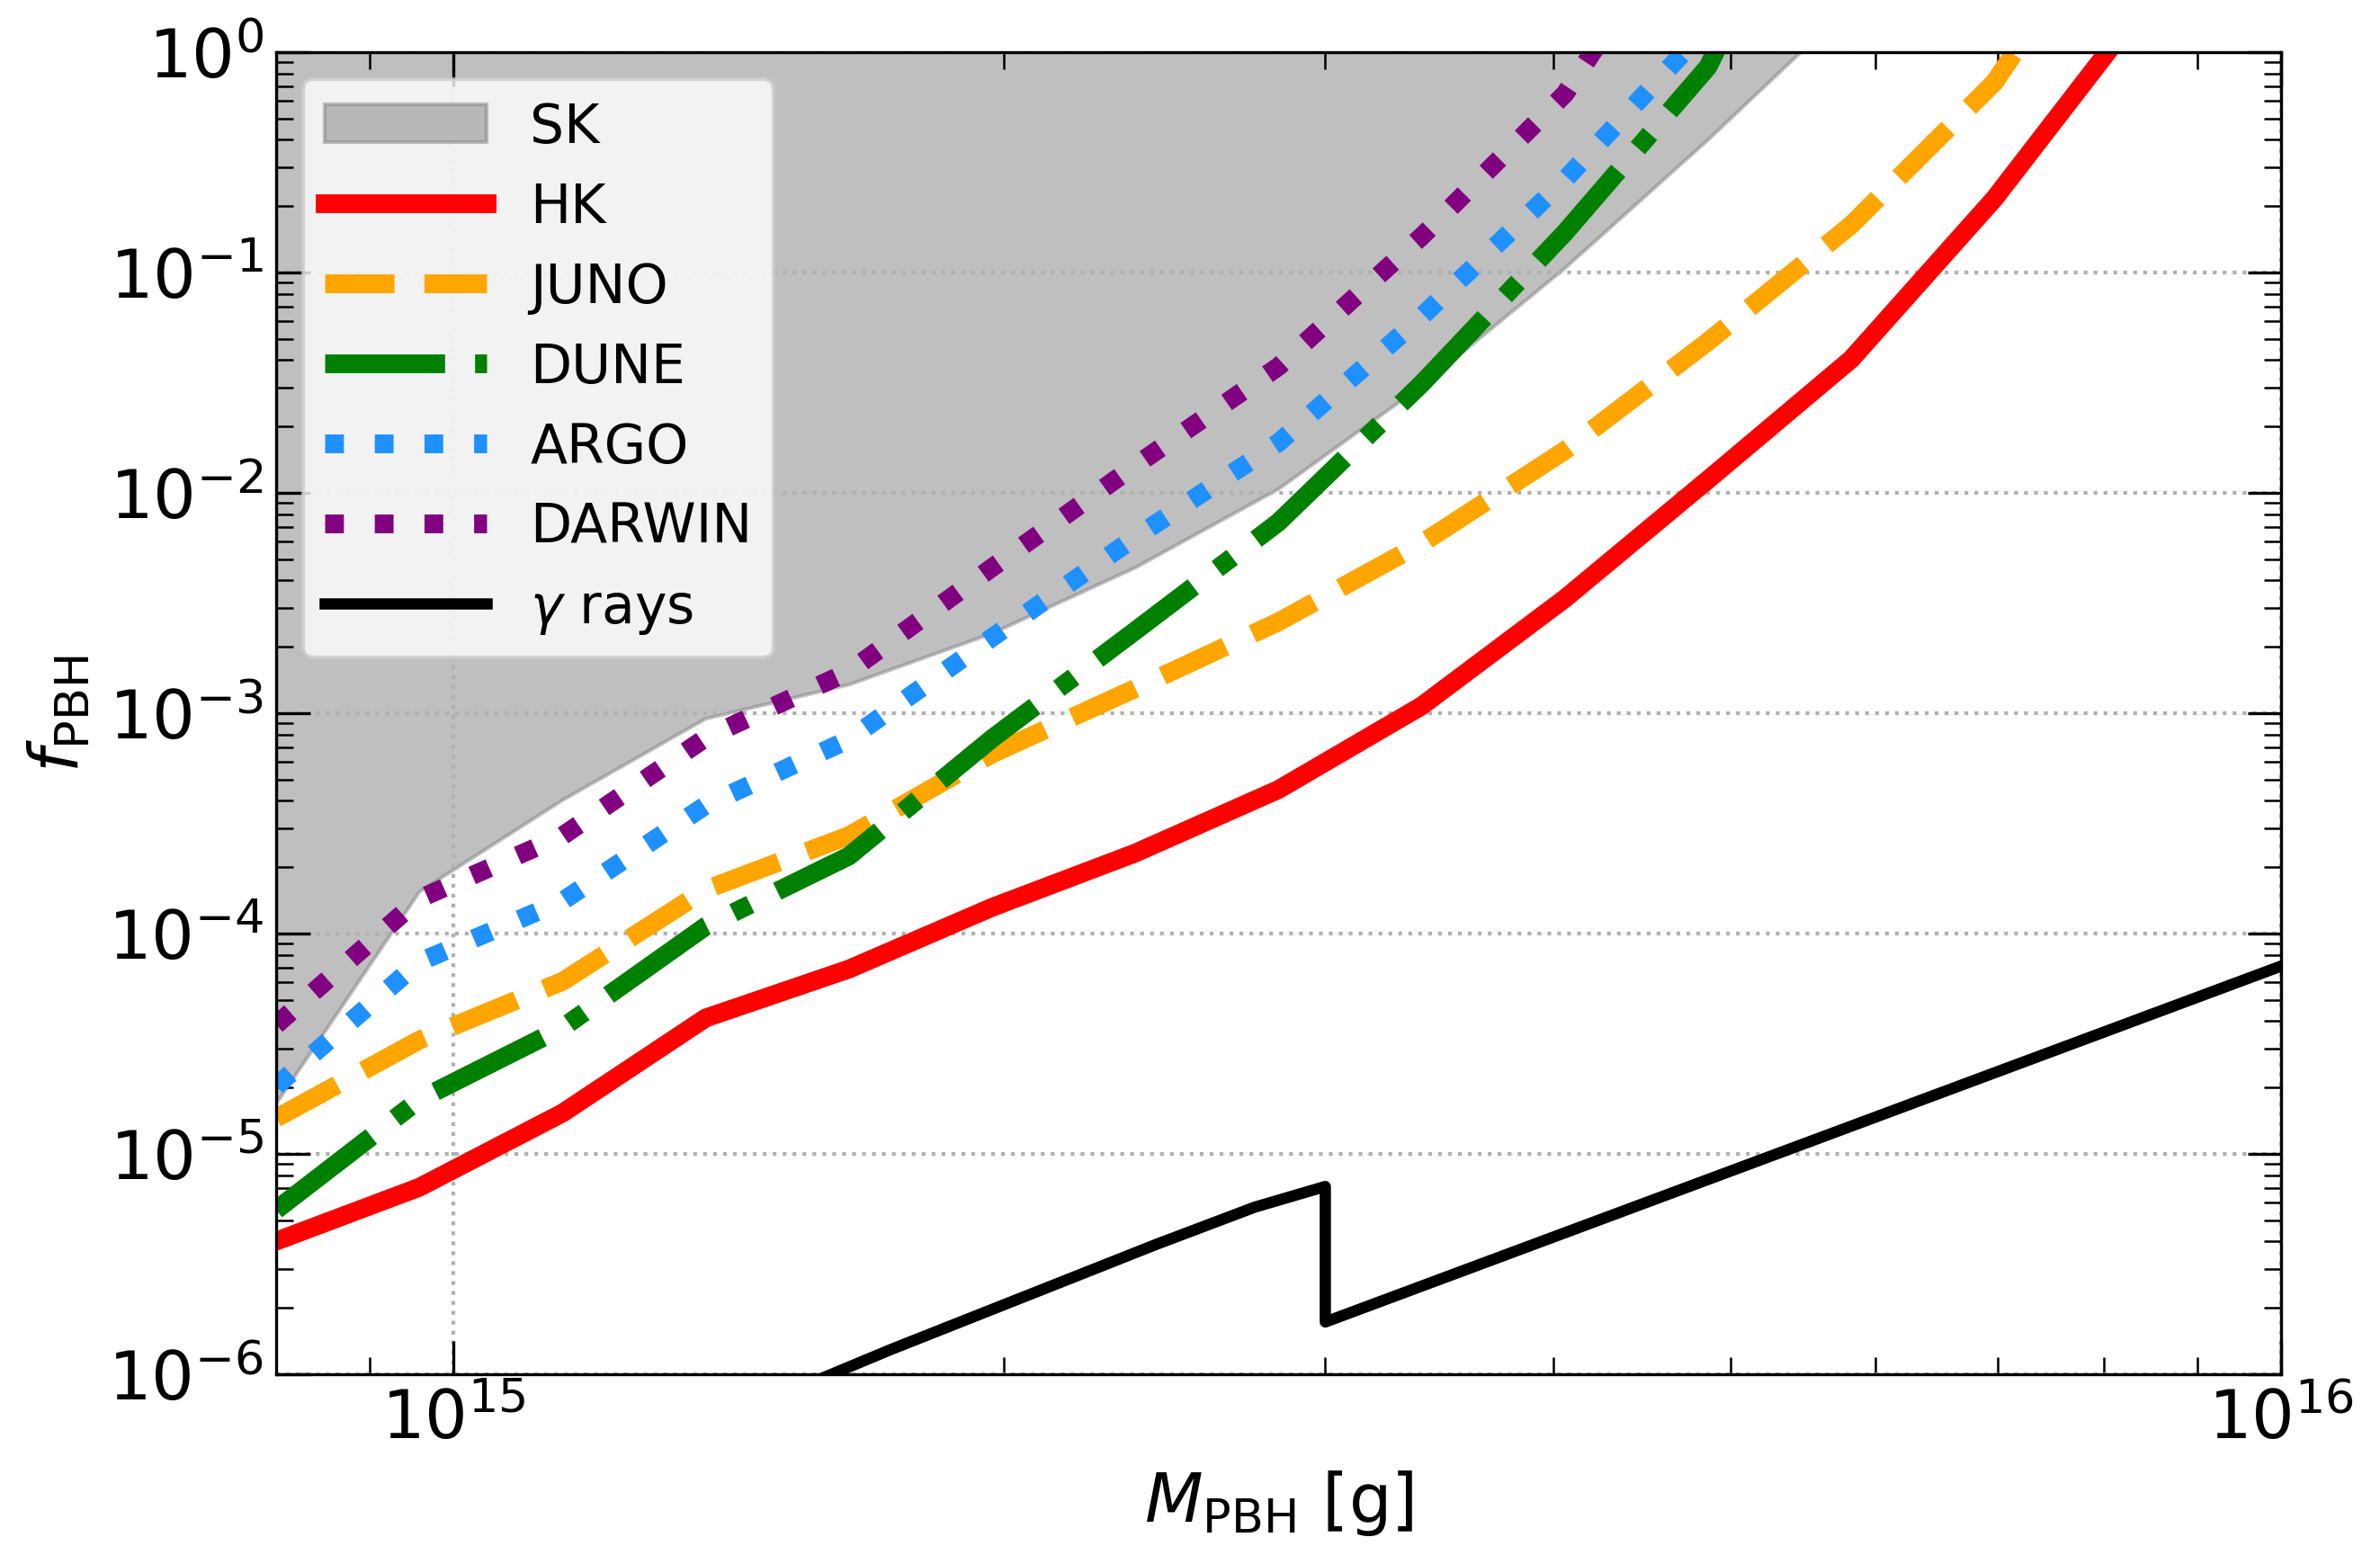
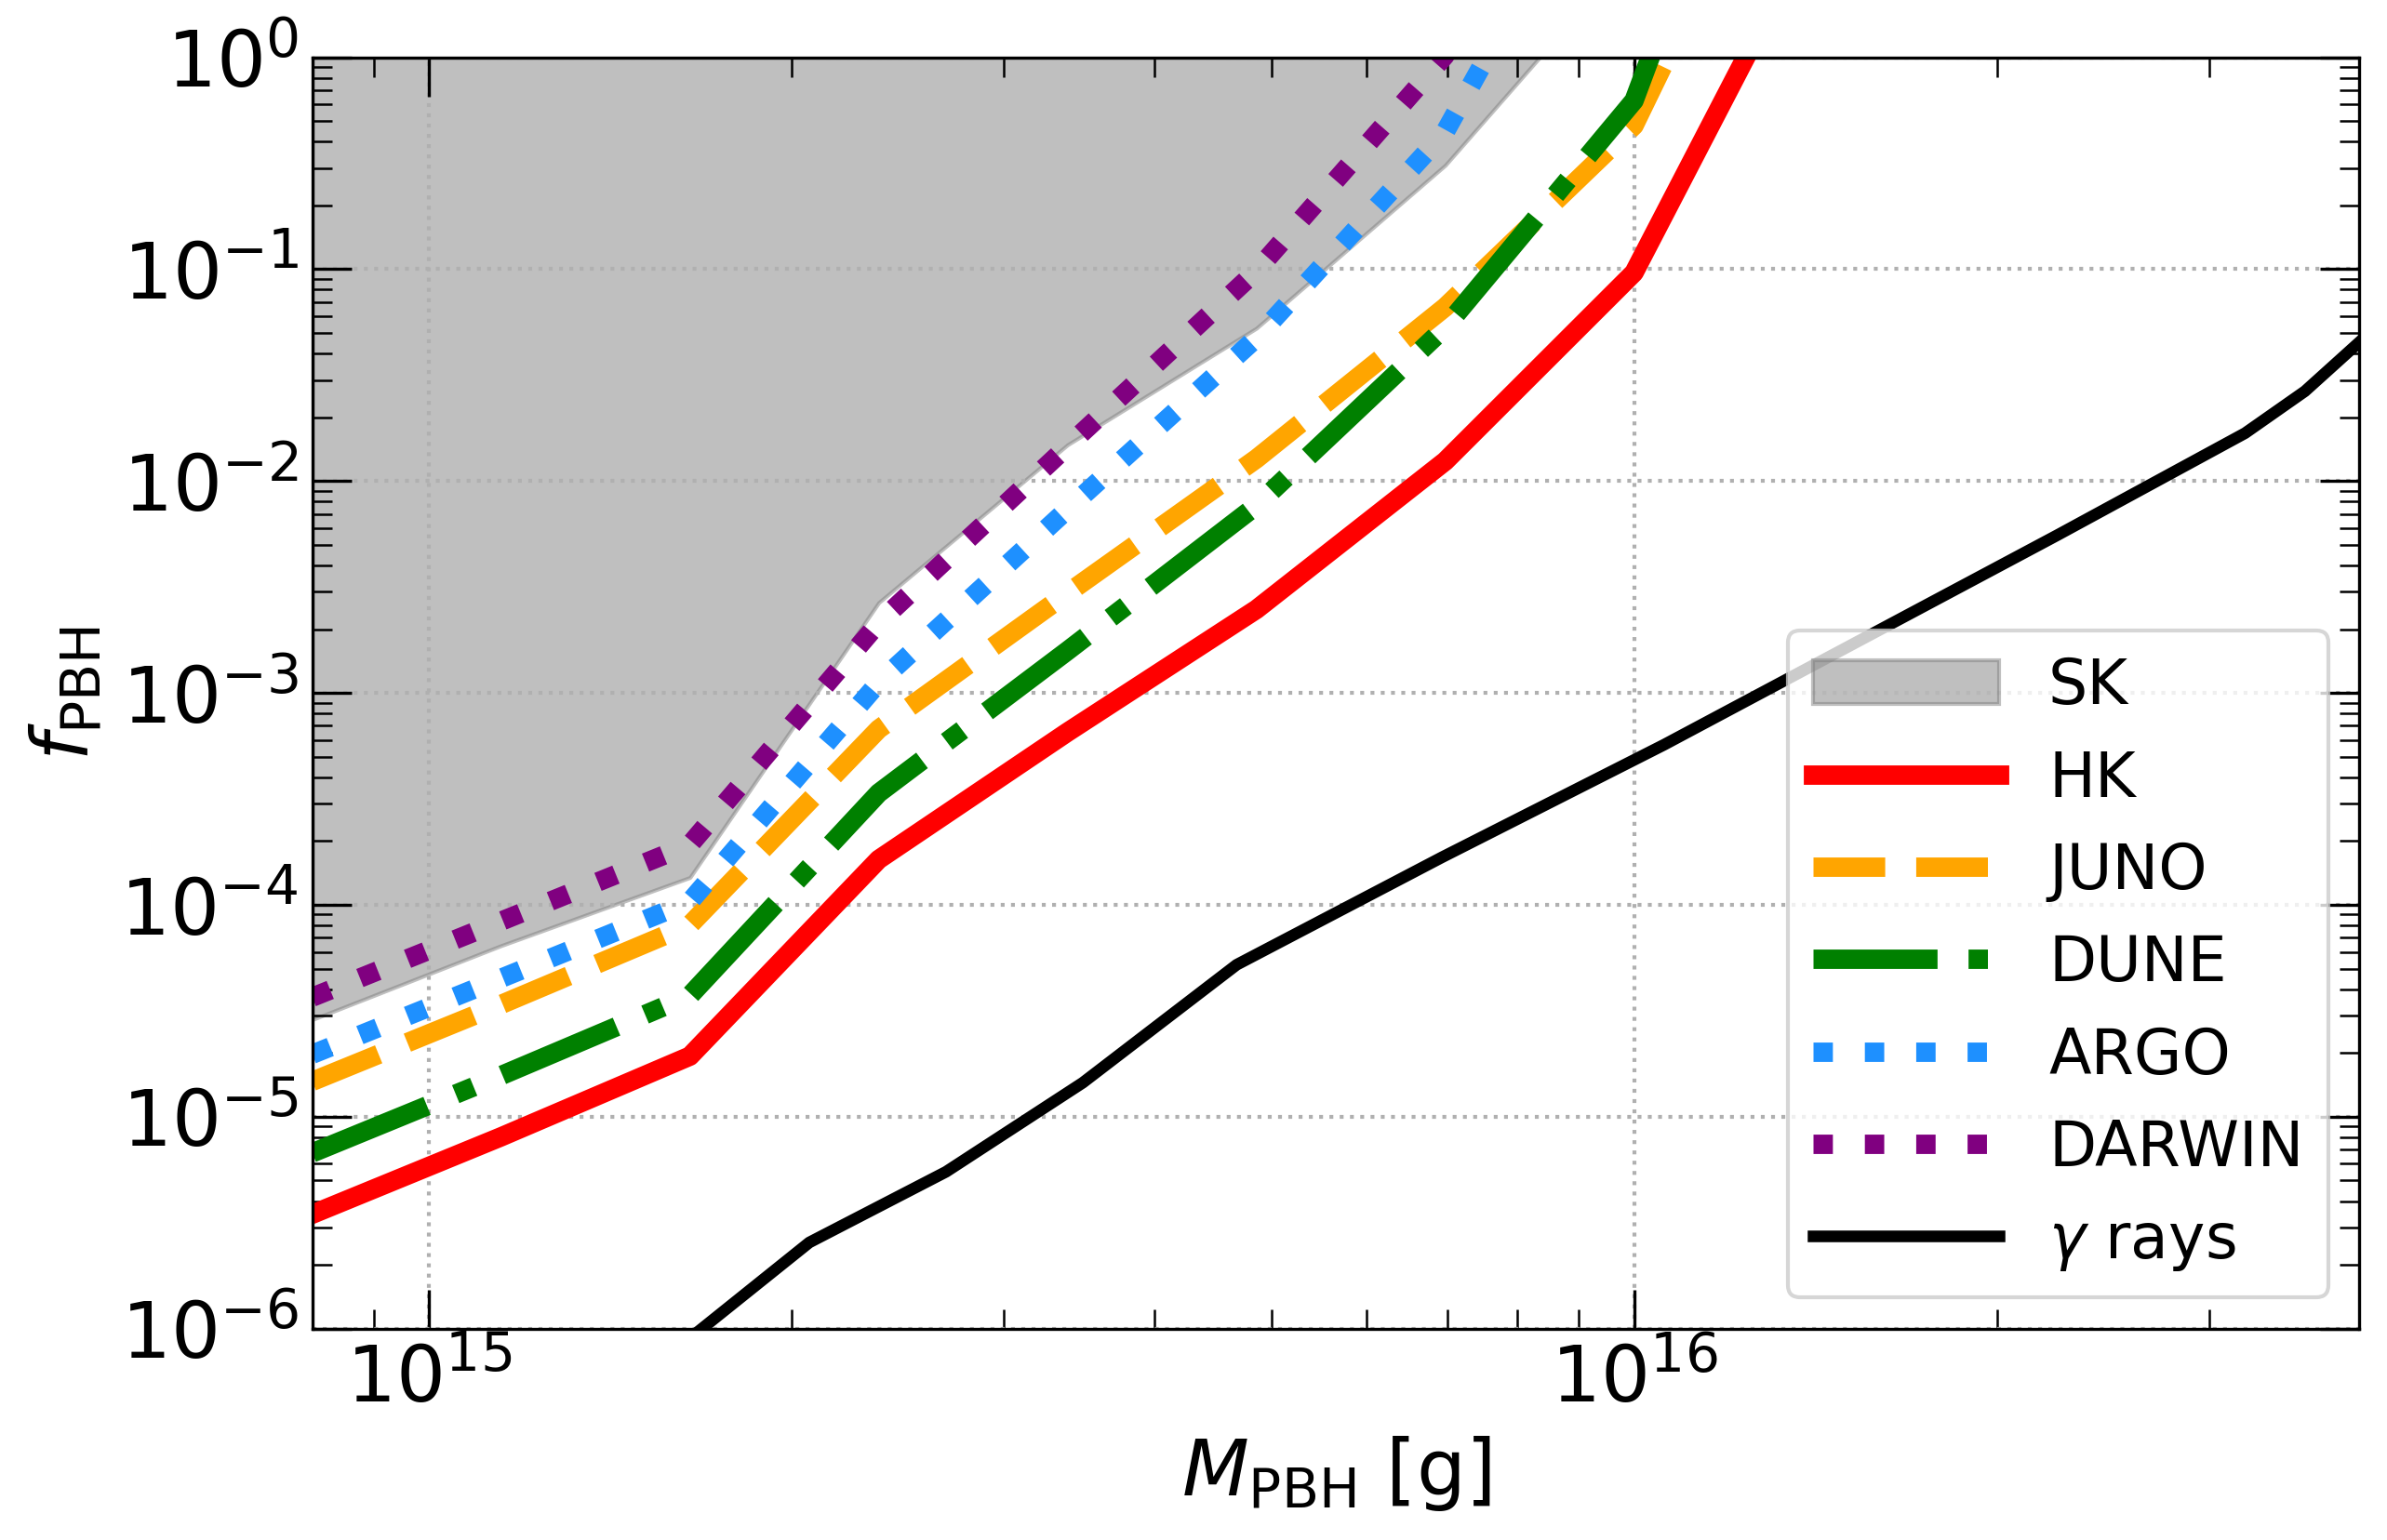
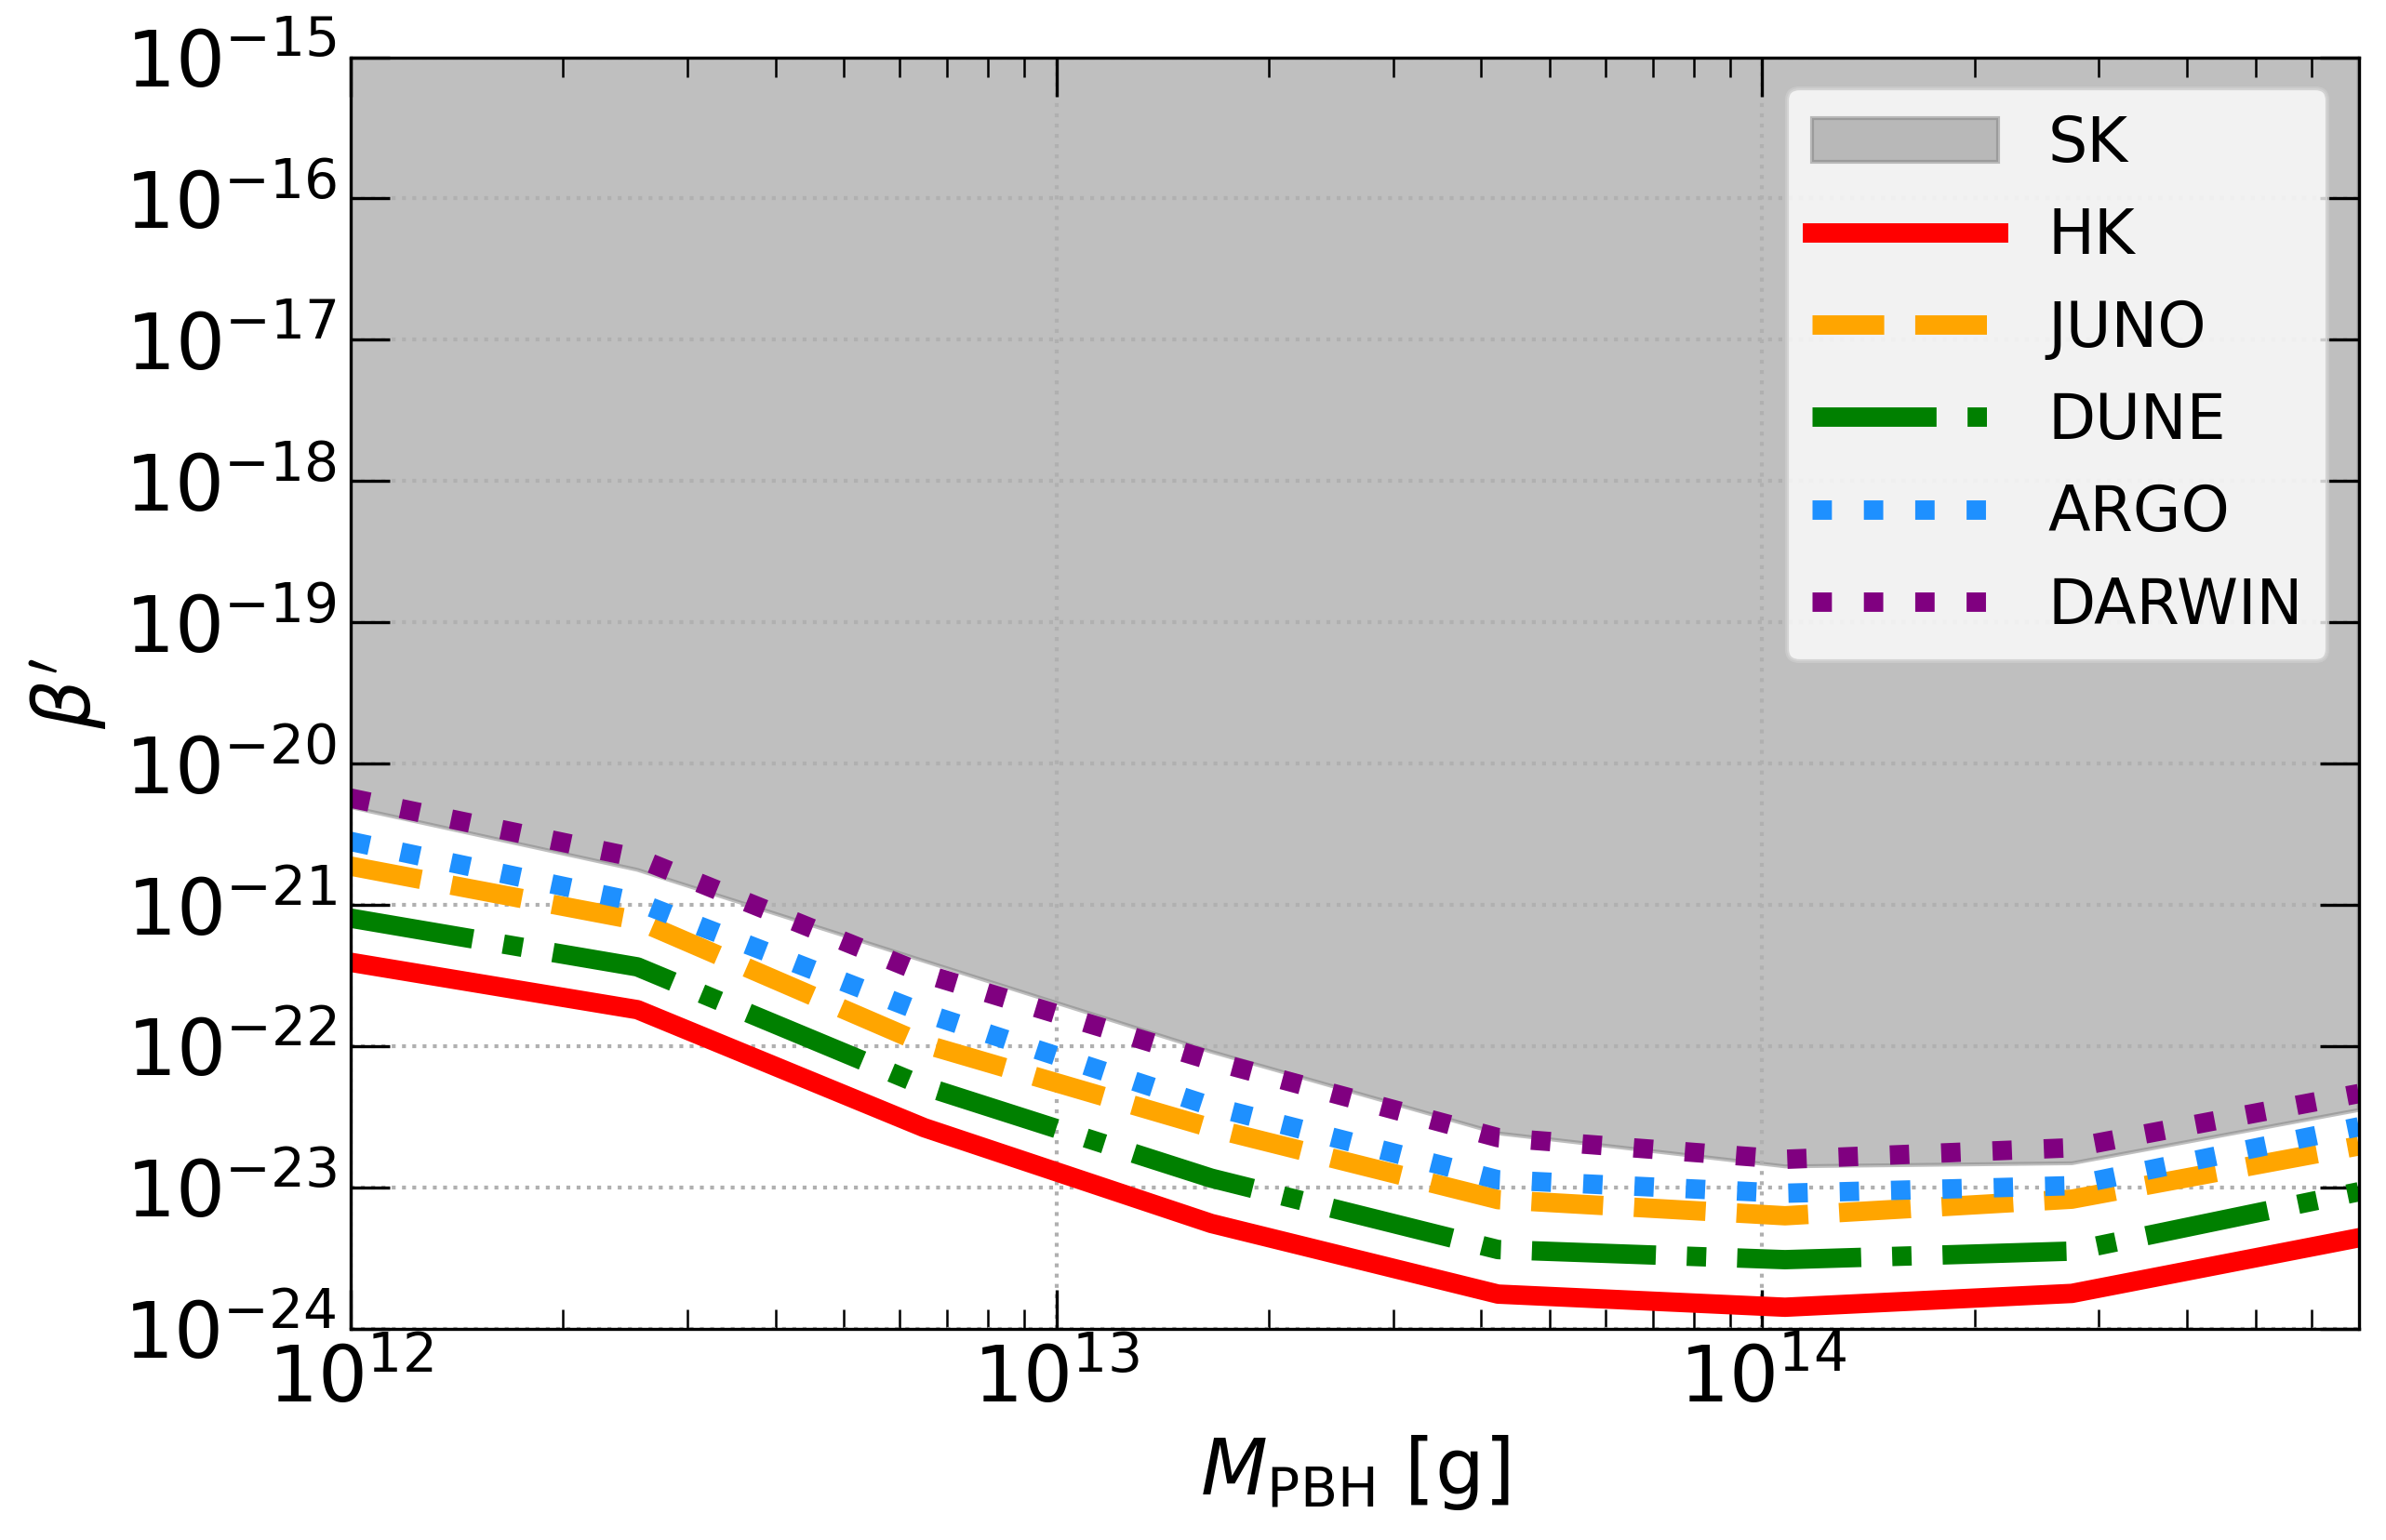
For all detectors we consider, we compute the CL () limits on the fraction of PBHs as DM, , as a function of the PBH mass, which are shown in Fig. 6 for a monochromatic mass distribution and in Fig. 7 for log-normal mass distributions. Current bounds from -ray observations [48, 62] are also depicted in Fig. 6. In the case of a log-normal mass distribution with , the most stringent bounds in the mass range we consider come from CMB anisotropies [52] and lie in the interval (i.e., about three or four orders of magnitude more restrictive than future expectations for HK). For a log-normal mass distribution with , CMB limits lie between those of the monochromatic and the log-normal distribution with [52] and are similar to those from -ray observations of the isotropic extragalactic background [46].
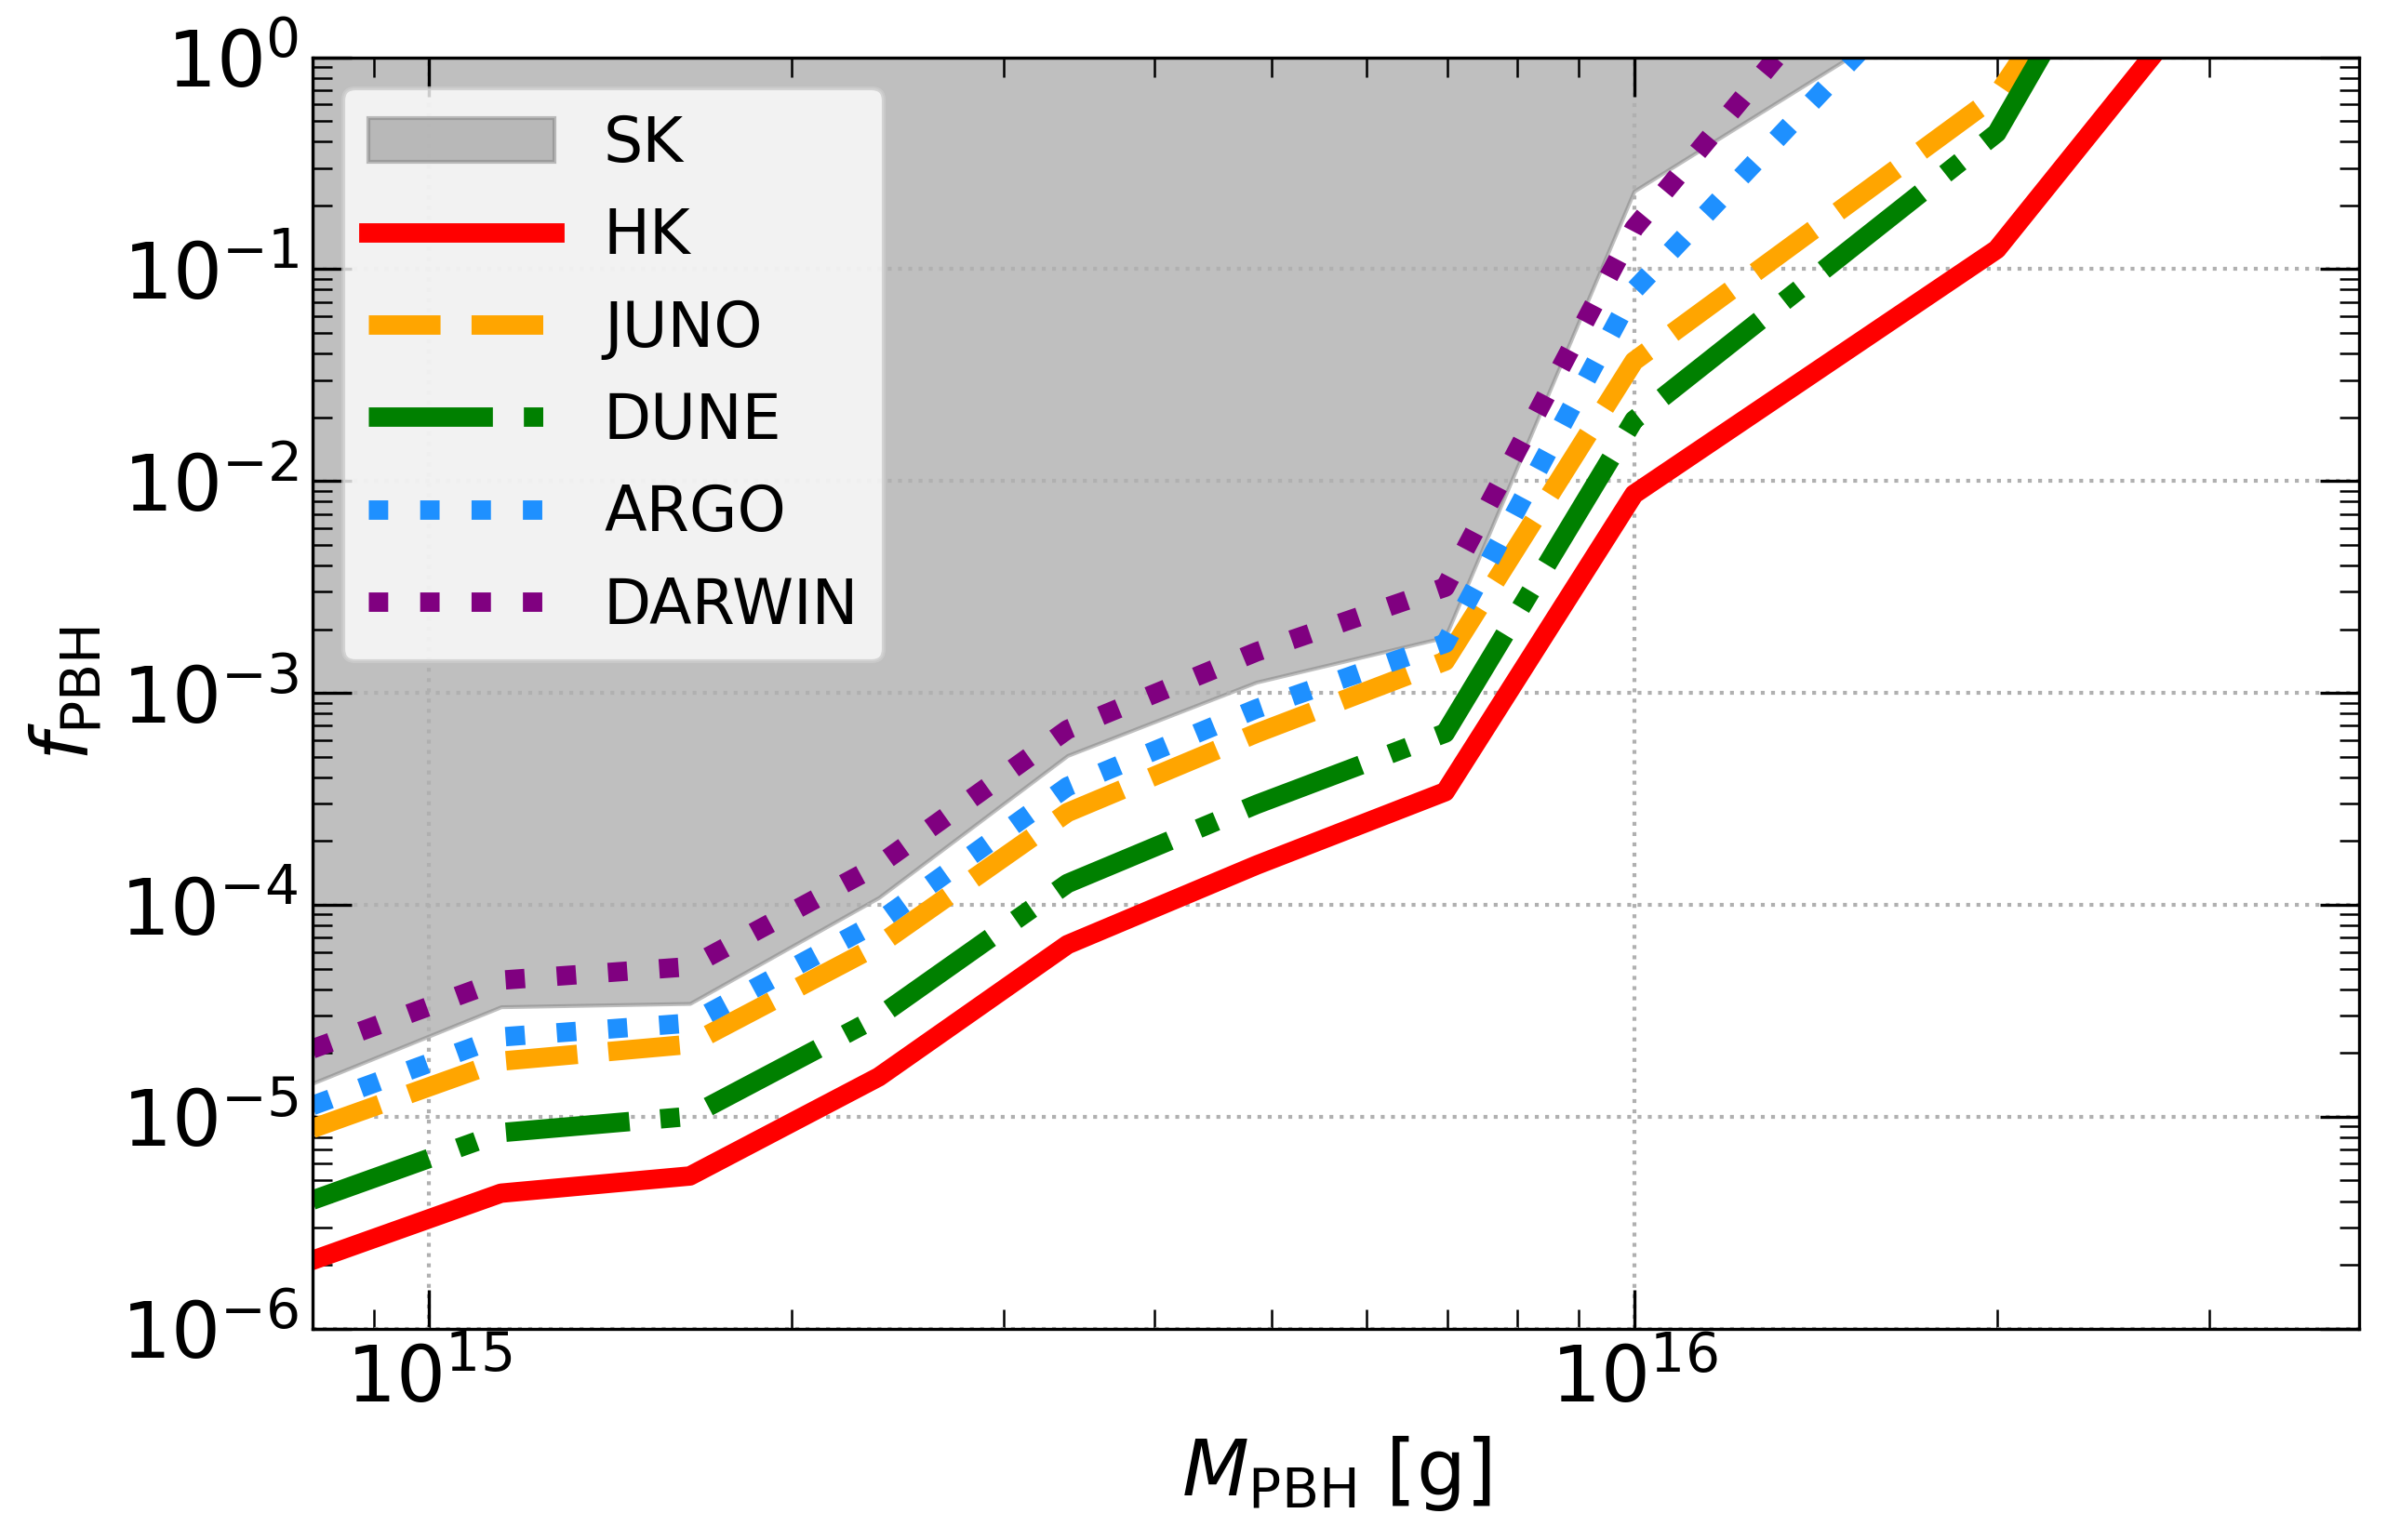
Clearly, HK will outperform the other detectors we consider, mainly due to its much larger mass. Nonetheless, different methods of detection and backgrounds result in distinct bounds, even with similar exposures. It is the case of JUNO, which, for a similar exposure, would improve the current bound from SK by a factor of a few. Likewise, it is important to remark that the relative sensitivity of each detector also depends on the PBH mass. For instance, for a monochromatic mass distribution, DUNE will be able to obtain more stringent bounds than JUNO for g, while for g the bounds from JUNO are expected to be more restrictive. These differences can be understood from the signal and background event spectra, which differ for each channel and detector: JUNO becomes more sensitive than DUNE to spectra peaked at lower energies, which correspond to larger PBH masses, due to its better neutrino energy resolution. On another hand, although the expected limits from DM detectors are weaker due to their smaller size, a detector times smaller than SK as ARGO could reach limits comparable to (and even slightly better than) current bounds from SK data. Finally, as shown in Fig. 7, for log-normal mass distributions, the limits are more restrictive (except for g) and extend to more massive PBHs the broader the mass distribution, in analogy to limits from the isotropic extragalactic -ray background [46]. Furthermore, a wider mass spectrum implies that a wider detection range is sensitive to the neutrino flux, so that JUNO becomes less competitive than DUNE up to larger masses.
In all these analyses, the dominant backgrounds above the chosen energy threshold are produced by solar and atmospheric neutrinos. Nevertheless, the DSNB flux is a guaranteed, yet uncertain, background for the signal from PBH evaporation. Therefore, we have also checked the effect of adding this extra background component by recomputing all the bounds. Within current limits on the DSNB flux [99], its addition would worsen future limits on the PBH abundance by less than a factor of two in the case of neutrino detectors, and by much less () in the case of DM detectors, in the entire mass range we consider. The differences are more important for the most massive non-evaporated PBHs. Yet, given the small impact of the (uncertain) DSNB flux on the results, we do not show explicitly these limits, which are quite similar to the ones we depict, that are slightly more optimistic.
As mentioned above, other studies in the literature have already presented forecasts for some of the detectors discussed here. We are in reasonably good agreement with all of them, although some differences arise. Projected sensitivities for the JUNO detector, for the case of monochromatic mass distributions, were recently obtained [100]. The constraints are slightly more stringent than ours, which could be due to a couple of differing points in the analyses: in Ref. [100] the total integrated number of events within an energy range (different for each PBH mass being tested) was used, rather than accounting for the spectral information; and the neutrino fluxes are about a factor of two larger than ours (which are in agreement with those in Ref. [101]) in the relevant energy range. On another hand, Ref. [101] estimated the sensitivity of the DUNE detector to neutrinos from non-evaporated PBHs, for the same mass distributions considered in our work. There are several differences between our treatment and the one followed in Ref. [101], such as the characterization of the detector properties, in particular the energy resolution and efficiency; the statistical analysis, as we do not include systematic uncertainties on the background and we do not include the contribution from the DSNB either; and the energy threshold, which we take at a slightly higher value (19 MeV rather than 16 MeV). Yet, our results for non-evaporated PBHs are in good agreement with those in Ref. [101]. Likewise, for a monochromatic mass distribution, forecast limits for liquid xenon detectors such as DARWIN were obtained in Ref. [103], whose analysis also presents some differences with respect to ours: we include the energy resolution of the detectors and our energy range is wider; Ref. [103] includes systematic uncertainties on the normalization of backgrounds, and the DSNB is also included; and the neutrino fluxes seem to be larger than ours.161616This could be due their adding the output of BlackHawk for primary and secondary spectra (see footnote 3). All in all, our results for 10 years with DARWIN are slightly less stringent, as they are very similar to those for 200 ktonyear in Ref. [103].
6.2 Sensitivity for evaporated PBHs
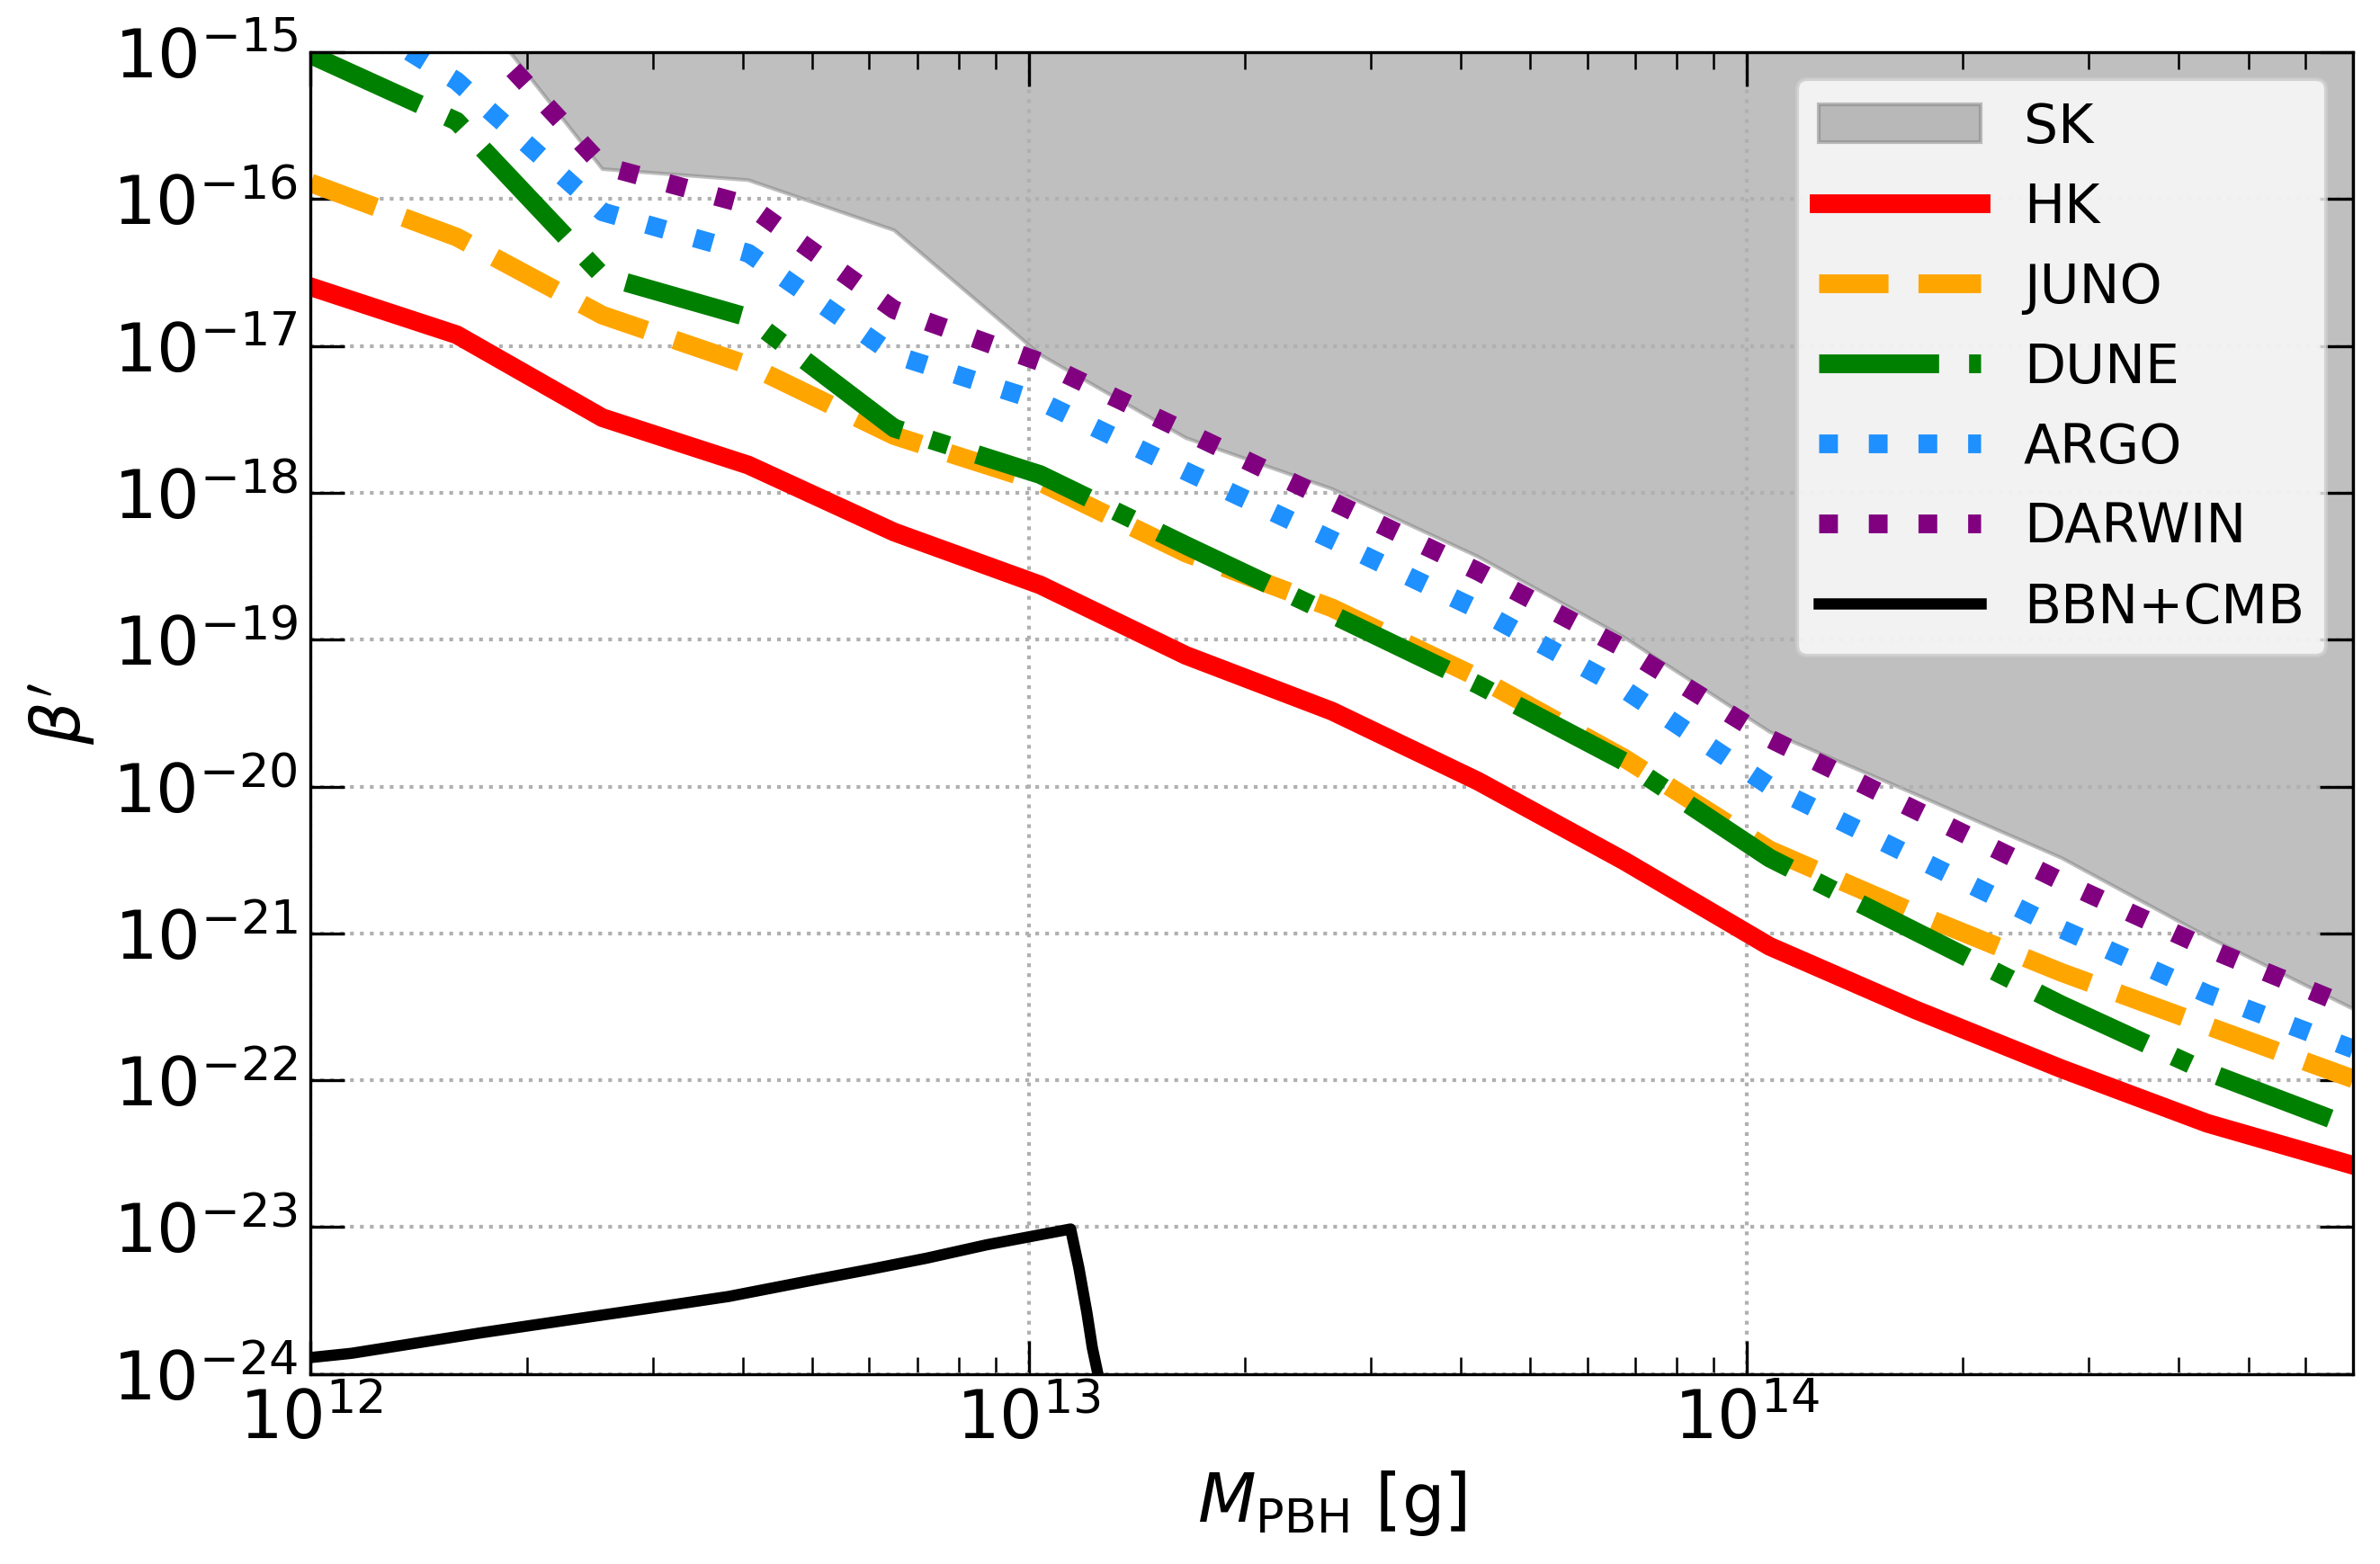
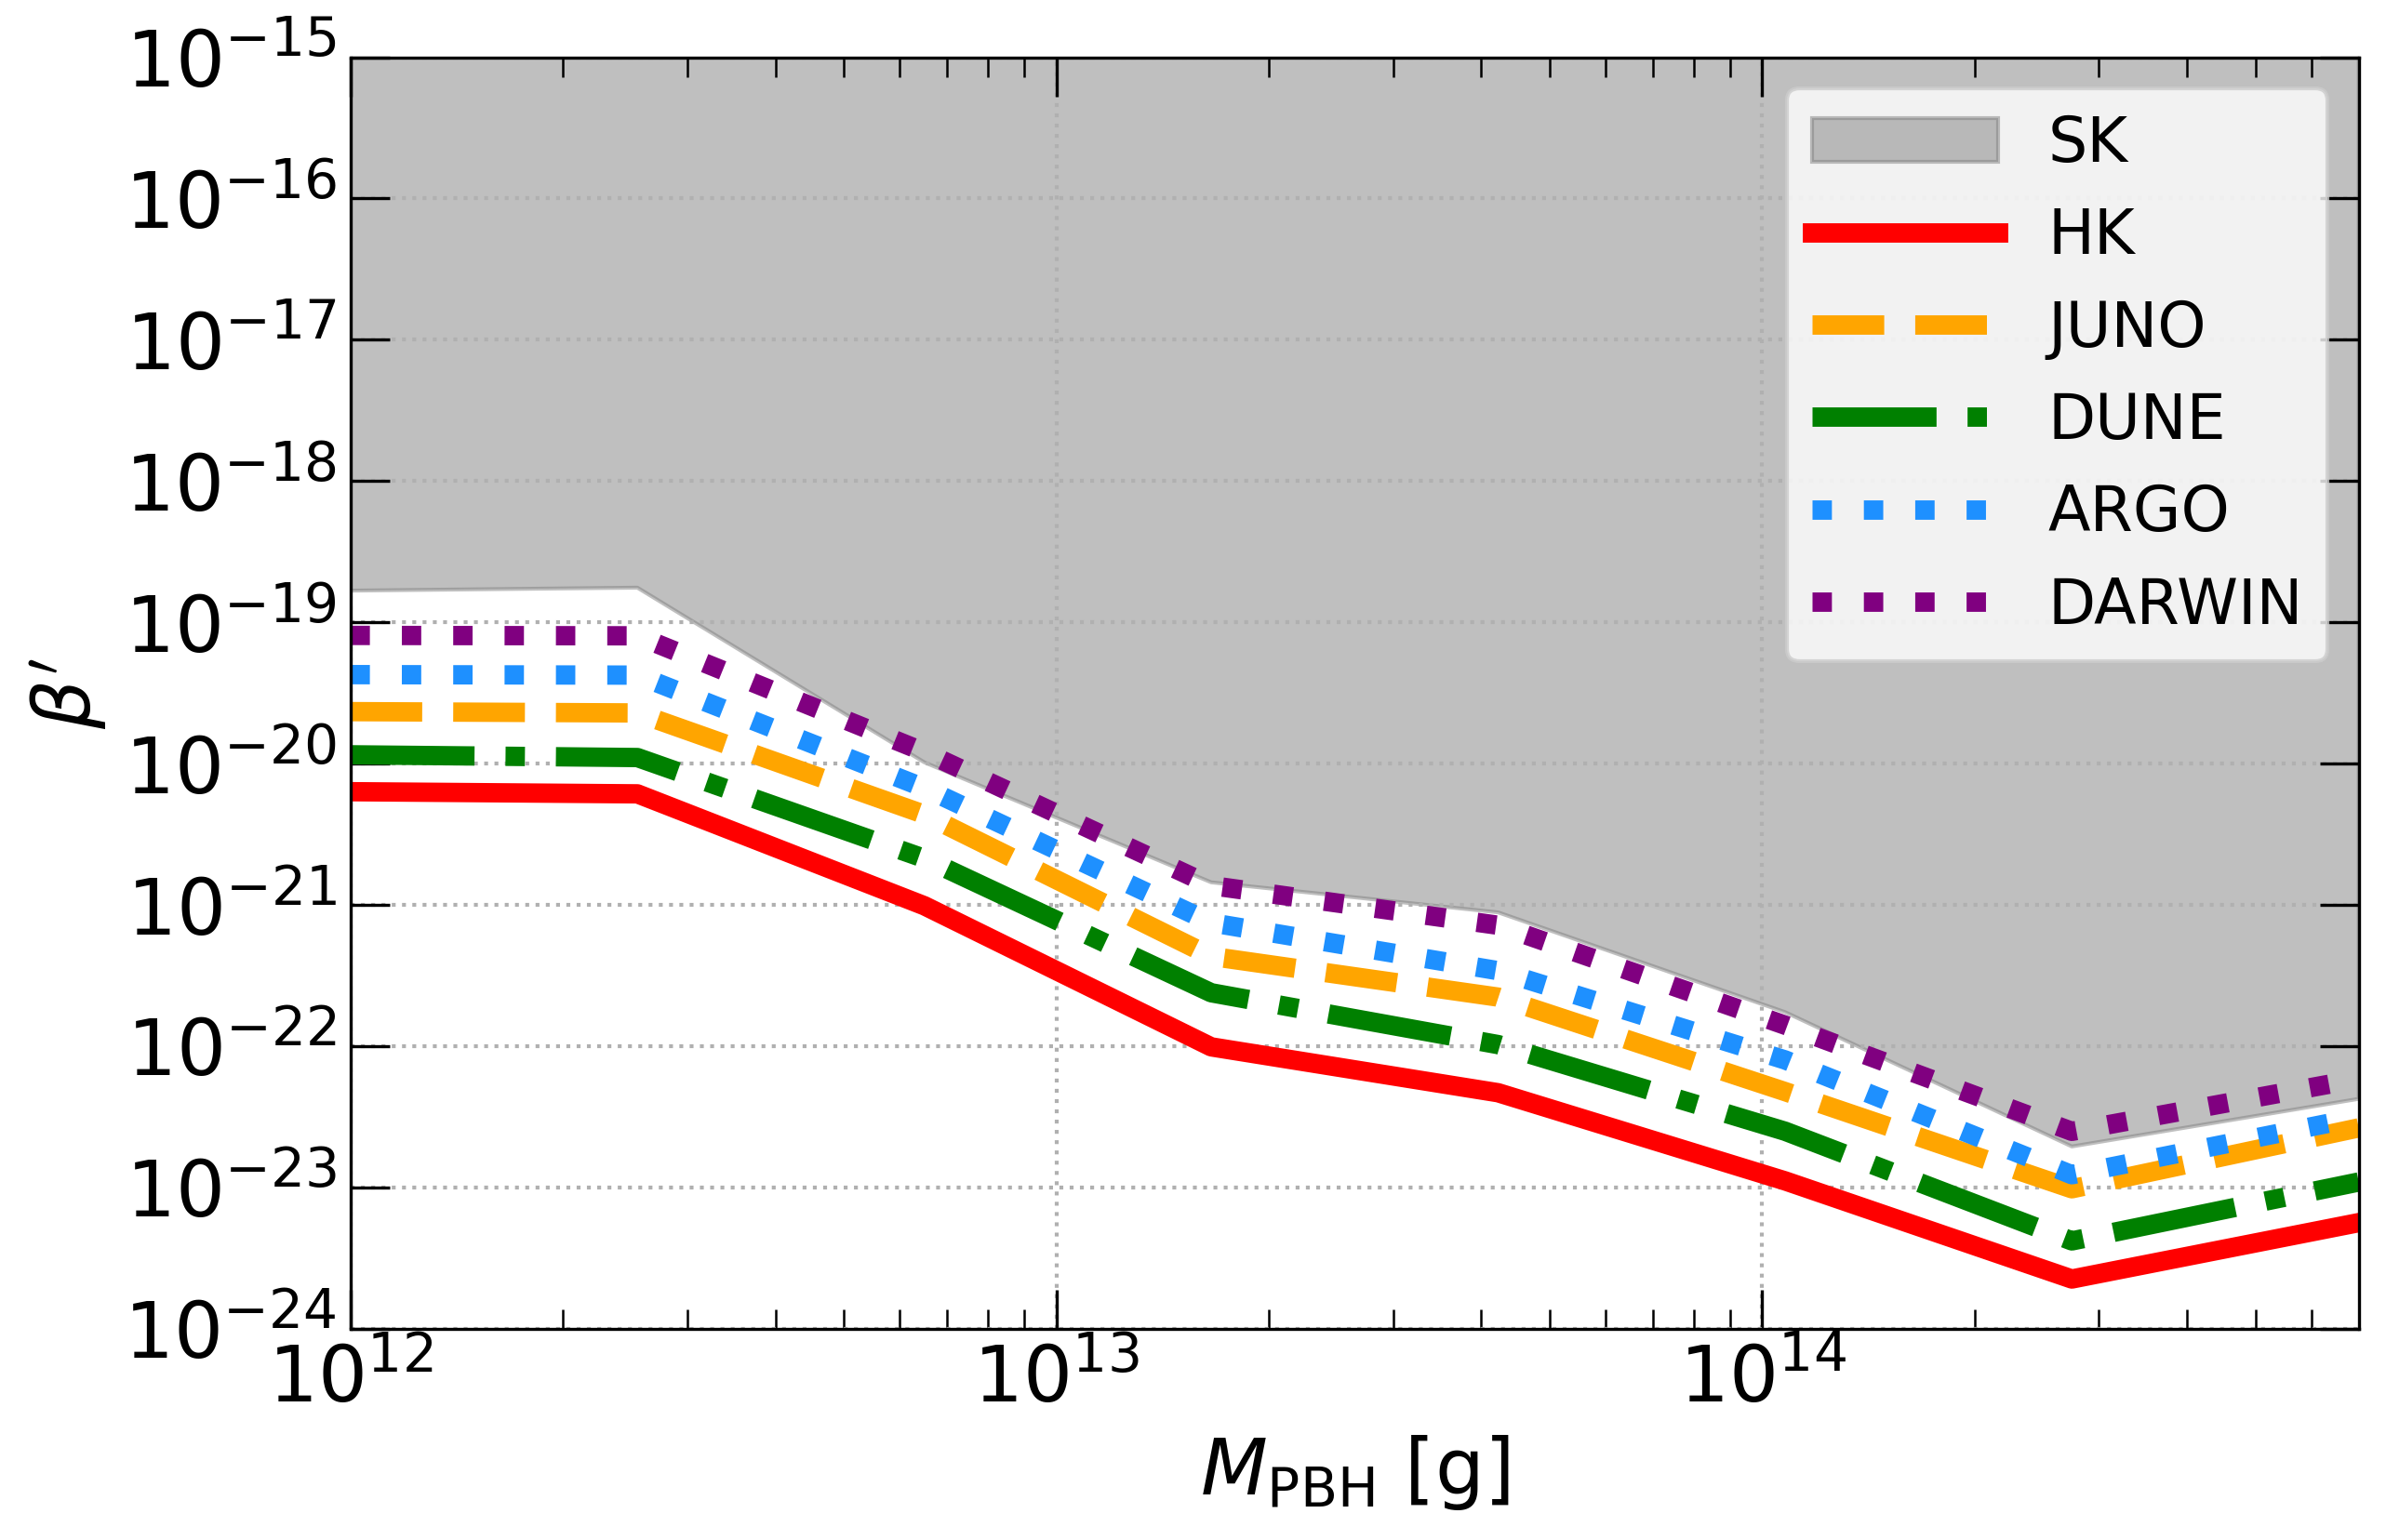
PBHs with masses below would have already completely evaporated today, and thus cannot form part of the DM now. It is customary, thus, to constrain their abundance at any time via their initial abundance , or the modified parameter , defined in Eq. (2.5). For monochromatic and log-normal mass distributions, CL () forecast limits on the initial abundance versus PBH mass are depicted in Figs. 8 and 9, respectively. In Fig. 8, we also show the most stringent bounds for the monochromatic case, which are obtained from BBN abundances and CMB anisotropies [52]. For g, the most stringent limits come from -ray observations of the isotropic extragalactic background [48], although they are below the range shown in the figures, reaching for . For log-normal mass distributions with and , CMB limits are the most important ones and, for the mass range we consider, lie in the interval for and for [52], which are several orders of magnitude more stringent than future expectations for HK.
One can see differences among detectors analogous to those illustrated in Figs. 6 and 9. Exposure is again the key property for constraining the PBH abundance, being HK the detector with the best sensitivity. Nevertheless, different channels also vary the mass dependence on the bounds. For instance, as discussed for the case of non-evaporated PBHs, JUNO is slightly more sensitive than DUNE to lower energies, so JUNO is slightly more constraining than DUNE for the smallest masses, whereas for g DUNE would be expected to obtain more restrictive limits.
In this PBH mass range, we have also checked the impact of adding the DSNB flux as another background component. The differences are similar to those obtained for non-evaporated PBHs, in this case being more important for the least massive PBHs, but the limits never worsen more than a factor of two in the entire mass range we consider. Therefore, given the small differences, as for non-evaporated PBHs, we do not include the (uncertain) DSNB flux on the results we show.
Finally, note that the only previous constraints on evaporated PBHs () using neutrino detectors were obtained in Ref. [44] for monochromatic mass distributions and with early SK limits on the DSNB. Here, we improve over those results for a monochromatic mass distribution (see Sec. 4) and also obtain results for extended mass distributions for several future neutrino detectors. The limits from these extended mass distributions can be several orders of magnitude more stringent than for the monochromatic case.
7 Conclusions
The existence of PBHs formed in the early Universe from large inhomogeneities is an exciting possibility. If they exist, during their evaporation, PBHs would unavoidably Hawking radiate all types of particles, and in particular, neutrinos. In this work, we have evaluated constraints on the abundance of comet-mass PBHs from current and future measurements of this neutrino flux. Specifically, we have considered non-rotating PBHs with monochromatic and extended (log-normal) mass distributions, covering a large PBH mass range, spanning from g to g.
Low mass PBHs (less massive than g), with lifetimes shorter than the age of the Universe, would have already fully evaporated, leaving behind a relic emission of plausibly detectable neutrinos. On another hand, PBHs with lifetimes longer than the age of the Universe would be present today, contributing to a fraction of the total DM abundance. Both, evaporated and non-evaporated PBHs could be probed by their neutrino emission, and limits on either the initial or current abundance of such objects could be set (or a positive signal inferred) by comparing the neutrino-induced events in neutrino detectors with the expected backgrounds. Previous estimates with actual data considered the limit on the integrated DSNB flux obtained from SK data and set bounds on the maximum fraction of DM in the form of PBHs by imposing the integrated flux of neutrinos from PBHs (in a given energy range) to be smaller [44, 60]. Here, we have revisited and improved upon those analyses, including in detail the spectral information of the potential PBH signal and properly accounting for the backgrounds. Thus, we provide more detailed bounds on the PBH abundance from SK data. In addition to non-evaporating PBHs, we have also considered the potential neutrino flux from fully evaporated PBHs, and we have set limits on their initial fraction of the total energy density. The updated bounds from SK on the PBH abundance as a function of the mass for monochromatic and log-normal mass distributions, both in the case of fully evaporated and non-evaporated PBHs are depicted in Fig. 4.
Furthermore, several future neutrino experiments, such as HK, JUNO, and DUNE, have been shown to provide high sensitivities which would outperform current constraints from SK, using different detection channels and in some cases, with larger exposures. DM direct detection experiments able to reach the so-called neutrino floor, such as ARGO and DARWIN, are however unlikely to significantly improve the current bounds from SK, given their smaller relative masses. These current and future neutrino limits on the abundance of PBHs are depicted in Figs. 6–9, for monochromatic and log-normal mass distributions.
In this way, we have studied current and future neutrino limits on the abundance of non-rotating PBHs and have provided a general picture of these results by comparing the limits and sensitivies of different types of detectors. Finally note, however, that both, current and projected constraints, are expected to be weaker than current limits from X-ray and -ray observations [44, 45, 46, 47, 48, 58, 59, 60, 61, 62] (see, e.g., Refs. [62, 195] for forecasts of future limits), from the primordial abundance of light elements [51, 44, 52] and from CMB anisotropies [53, 54, 55, 56, 57, 52], either for PBHs already evaporated or for PBHs constituting a fraction of DM. Nevertheless, we stress that the present study provides an independent and complementary way of testing the abundance of PBHs.
Data availability
The code employed in this article to compute the neutrino events and the forecasts for future experiments, nuHawkHunter [171], is publicly available on GitHub \faGithub.171717https://github.com/vmmunoza/nuHawkHunter
Acknowledgments
We thank Jérémy Auffinger for his help with the BlackHawk code. We thank Peter Denton, Valentina de Romeri, Pablo Martínez-Miravé, Joannis Papavassiliou, Anna Suliga and Mariam Tórtola for enlightening discussions. NB received funding from the Patrimonio Autónomo - Fondo Nacional de Financiamiento para la Ciencia, la Tecnología y la Innovación Francisco José de Caldas (MinCiencias - Colombia) grants 80740-465-2020 and 80740-492-2021. NB and SPR are supported by the Spanish MCIN/AEI/10.13039/501100011033 grant PID2020-113334GB-I00. The work of VM is supported by CONICYT PFCHA/DOCTORADO BECAS CHILE/2018 - 72180000. SPR is also partially supported by the Portuguese FCT (CERN/FIS-PAR/0004/2019). PVD acknowledges support from the Generalitat Valenciana through the GenT program (CIDEGENT/2018/019, CPI-21-108). This project has also received funding/support from the European Union’s Horizon 2020 research and innovation program under the Marie Skłodowska-Curie grant agreement No 860881-HIDDeN.
References
- [1] Y.B..N. Zel’dovich, I. D., The hypothesis of cores retarded during expansion and the hot cosmological model, Soviet Astron. AJ (Engl. Transl.), 10 (1967) 602.
- [2] S. Hawking, Gravitationally collapsed objects of very low mass, Mon. Not. Roy. Astron. Soc. 152 (1971) 75.
- [3] LIGO Scientific, Virgo collaboration, Observation of gravitational waves from a binary black hole merger, Phys. Rev. Lett. 116 (2016) 061102 [1602.03837].
- [4] V. De Luca, G. Franciolini, P. Pani and A. Riotto, Primordial black holes confront LIGO/Virgo data: current situation, JCAP 06 (2020) 044 [2005.05641].
- [5] A. Hall, A.D. Gow and C.T. Byrnes, Bayesian analysis of LIGO-Virgo mergers: primordial vs. astrophysical black hole populations, Phys. Rev. D 102 (2020) 123524 [2008.13704].
- [6] J. García-Bellido, J.F. Nuño Siles and E. Ruiz Morales, Bayesian analysis of the spin distribution of LIGO/Virgo black holes, Phys. Dark Univ. 31 (2021) 100791 [2010.13811].
- [7] K.W.K. Wong et al., Constraining the primordial black hole scenario with Bayesian inference and machine learning: the GWTC-2 gravitational wave catalog, Phys. Rev. D 103 (2021) 023026 [2011.01865].
- [8] G. Hütsi, M. Raidal, V. Vaskonen and H. Veermäe, Two populations of LIGO-Virgo black holes, JCAP 03 (2021) 068 [2012.02786].
- [9] V. De Luca, G. Franciolini, P. Pani and A. Riotto, Bayesian evidence for both astrophysical and primordial black holes: mapping the GWTC-2 catalog to third-generation detectors, JCAP 05 (2021) 003 [2102.03809].
- [10] Macho collaboration, MACHO project limits on black hole dark matter in the 1-30 M⊙ range, Astrophys. J. Lett. 550 (2001) L169 [astro-ph/0011506].
- [11] EROS-2 collaboration, Limits on the MACHO content of the galactic halo from the EROS-2 survey of the Magellanic Clouds, Astron. Astrophys. 469 (2007) 387 [astro-ph/0607207].
- [12] K. Griest, A.M. Cieplak and M.J. Lehner, Experimental limits on primordial black hole dark matter from the first 2 yr of Kepler data, Astrophys. J. 786 (2014) 158 [1307.5798].
- [13] M. Oguri, J.M. Diego, N. Kaiser, P.L. Kelly and T. Broadhurst, Understanding caustic crossings in giant arcs: characteristic scales, event rates, and constraints on compact dark matter, Phys. Rev. D 97 (2018) 023518 [1710.00148].
- [14] H. Niikura, M. Takada, S. Yokoyama, T. Sumi and S. Masaki, Constraints on Earth-mass primordial black holes from OGLE 5-year microlensing events, Phys. Rev. D 99 (2019) 083503 [1901.07120].
- [15] D. Croon, D. McKeen, N. Raj and Z. Wang, Subaru-HSC through a different lens: microlensing by extended dark matter structures, Phys. Rev. D 102 (2020) 083021 [2007.12697].
- [16] V. Poulin, P.D. Serpico, F. Calore, S. Clesse and K. Kohri, CMB bounds on disk-accreting massive primordial black holes, Phys. Rev. D96 (2017) 083524 [1707.04206].
- [17] P.D. Serpico, V. Poulin, D. Inman and K. Kohri, Cosmic microwave background bounds on primordial black holes including dark matter halo accretion, Phys. Rev. Res. 2 (2020) 023204 [2002.10771].
- [18] A. Hektor, G. Hutsi, L. Marzola, M. Raidal, V. Vaskonen and H. Veermäe, Constraining primordial black holes with the EDGES 21-cm absorption signal, Phys. Rev. D98 (2018) 023503 [1803.09697].
- [19] M.A. Monroy-Rodríguez and C. Allen, The end of the MACHO era revisited: new limits on MACHO masses from halo wide binaries, Astrophys. J. 790 (2014) 159 [1406.5169].
- [20] T.D. Brandt, Constraints on MACHO dark matter from compact stellar systems in ultra-faint dwarf galaxies, Astrophys. J. Lett. 824 (2016) L31 [1605.03665].
- [21] R. Murgia, G. Scelfo, M. Viel and A. Raccanelli, Lyman- forest constraints on primordial black holes as dark matter, Phys. Rev. Lett. 123 (2019) 071102 [1903.10509].
- [22] M. Raidal, V. Vaskonen and H. Veermäe, Gravitational Waves from Primordial Black Hole Mergers, JCAP 09 (2017) 037 [1707.01480].
- [23] Y. Ali-Haïmoud, E.D. Kovetz and M. Kamionkowski, Merger rate of primordial black-hole binaries, Phys. Rev. D 96 (2017) 123523 [1709.06576].
- [24] B.J. Kavanagh, D. Gaggero and G. Bertone, Merger rate of a subdominant population of primordial black holes, Phys. Rev. D 98 (2018) 023536 [1805.09034].
- [25] M. Raidal, C. Spethmann, V. Vaskonen and H. Veermäe, Formation and Evolution of Primordial Black Hole Binaries in the Early Universe, JCAP 02 (2019) 018 [1812.01930].
- [26] Z.-C. Chen and Q.-G. Huang, Distinguishing primordial black holes from astrophysical black holes by Einstein Telescope and Cosmic Explorer, JCAP 08 (2020) 039 [1904.02396].
- [27] LIGO Scientific, Virgo collaboration, Search for subsolar mass ultracompact binaries in advanced LIGO’s second observing run, Phys. Rev. Lett. 123 (2019) 161102 [1904.08976].
- [28] V. Vaskonen and H. Veermäe, Lower bound on the primordial black hole merger rate, Phys. Rev. D 101 (2020) 043015 [1908.09752].
- [29] H.-K. Guo, J. Shu and Y. Zhao, Using LISA-like gravitational wave detectors to search for primordial black holes, Phys. Rev. D 99 (2019) 023001 [1709.03500].
- [30] S. Jung and C.S. Shin, Gravitational-wave fringes at LIGO: detecting compact dark matter by gravitational lensing, Phys. Rev. Lett. 122 (2019) 041103 [1712.01396].
- [31] N. Bartolo, V. De Luca, G. Franciolini, M. Peloso, D. Racco and A. Riotto, Testing primordial black holes as dark matter with LISA, Phys. Rev. D 99 (2019) 103521 [1810.12224].
- [32] O. Pujolas, V. Vaskonen and H. Veermäe, Prospects for probing gravitational waves from primordial black hole binaries, Phys. Rev. D 104 (2021) 083521 [2107.03379].
- [33] J. Urrutia and V. Vaskonen, Lensing of gravitational waves as a probe of compact dark matter, Mon. Not. Roy. Astron. Soc. 509 (2021) 1358 [2109.03213].
- [34] T. Nakama, B. Carr and J. Silk, Limits on primordial black holes from distortions in cosmic microwave background, Phys. Rev. D 97 (2018) 043525 [1710.06945].
- [35] O. Mena, S. Palomares-Ruiz, P. Villanueva-Domingo and S.J. Witte, Constraining the primordial black hole abundance with 21-cm cosmology, Phys. Rev. D 100 (2019) 043540 [1906.07735].
- [36] P. Villanueva-Domingo and K. Ichiki, 21 cm forest constraints on primordial black holes, Publications of the Astronomical Society of Japan (2022) [2104.10695].
- [37] M. Sasaki, T. Suyama, T. Tanaka and S. Yokoyama, Primordial black holes - perspectives in gravitational wave astronomy, Class. Quant. Grav. 35 (2018) 063001 [1801.05235].
- [38] A.M. Green and B.J. Kavanagh, Primordial black holes as a dark matter candidate, J. Phys. G 48 (2021) 4 [2007.10722].
- [39] B. Carr, K. Kohri, Y. Sendouda and J. Yokoyama, Constraints on primordial black holes, Rept. Prog. Phys. 84 (2021) 116902 [2002.12778].
- [40] B. Carr and F. Kuhnel, Primordial black holes as dark matter: recent developments, Ann. Rev. Nucl. Part. Sci. 70 (2020) 355 [2006.02838].
- [41] P. Villanueva-Domingo, O. Mena and S. Palomares-Ruiz, A brief review on primordial black holes as dark matter, Front. Astron. Space Sci. 8 (2021) 87 [2103.12087].
- [42] S.W. Hawking, Black hole explosions, Nature 248 (1974) 30.
- [43] S. Hawking, Particle creation by black holes, Commun. Math. Phys. 43 (1975) 199.
- [44] B. Carr, K. Kohri, Y. Sendouda and J. Yokoyama, New cosmological constraints on primordial black holes, Phys. Rev. D 81 (2010) 104019 [0912.5297].
- [45] G. Ballesteros, J. Coronado-Blázquez and D. Gaggero, X-ray and gamma-ray limits on the primordial black hole abundance from Hawking radiation, Phys. Lett. B 808 (2020) 135624 [1906.10113].
- [46] A. Arbey, J. Auffinger and J. Silk, Constraining primordial black hole masses with the isotropic gamma ray background, Phys. Rev. D 101 (2020) 023010 [1906.04750].
- [47] J. Iguaz, P.D. Serpico and T. Siegert, Isotropic X-ray bound on primordial black hole dark matter, Phys. Rev. D 103 (2021) 103025 [2104.03145].
- [48] S. Chen, H.-H. Zhang and G. Long, Revisiting the constraints on primordial black hole abundance with the isotropic gamma-ray background, Phys. Rev. D 105 (2022) 063008 [2112.15463].
- [49] M.R. Mosbech and Z.S.C. Picker, Effects of Hawking evaporation on PBH distributions, 2203.05743.
- [50] B. Dutta, A. Kar and L.E. Strigari, Constraints on MeV dark matter and primordial black holes: Inverse Compton signals at the SKA, JCAP 03 (2021) 011 [2010.05977].
- [51] K. Kohri and J. Yokoyama, Primordial black holes and primordial nucleosynthesis. 1. Effects of hadron injection from low mass holes, Phys. Rev. D 61 (2000) 023501 [astro-ph/9908160].
- [52] S.K. Acharya and R. Khatri, CMB and BBN constraints on evaporating primordial black holes revisited, JCAP 06 (2020) 018 [2002.00898].
- [53] V. Poulin, J. Lesgourgues and P.D. Serpico, Cosmological constraints on exotic injection of electromagnetic energy, JCAP 03 (2017) 043 [1610.10051].
- [54] S. Clark, B. Dutta, Y. Gao, L.E. Strigari and S. Watson, Planck constraint on relic primordial black holes, Phys. Rev. D 95 (2017) 083006 [1612.07738].
- [55] P. Stöcker, M. Krämer, J. Lesgourgues and V. Poulin, Exotic energy injection with ExoCLASS: Application to the Higgs portal model and evaporating black holes, JCAP 03 (2018) 018 [1801.01871].
- [56] H. Poulter, Y. Ali-Haïmoud, J. Hamann, M. White and A.G. Williams, CMB constraints on ultra-light primordial black holes with extended mass distributions, 1907.06485.
- [57] M. Lucca, N. Schöneberg, D.C. Hooper, J. Lesgourgues and J. Chluba, The synergy between CMB spectral distortions and anisotropies, JCAP 02 (2020) 026 [1910.04619].
- [58] W. DeRocco and P.W. Graham, Constraining primordial black hole abundance with the galactic 511 keV line, Phys. Rev. Lett. 123 (2019) 251102 [1906.07740].
- [59] R. Laha, Primordial black holes as a dark matter candidate are severely constrained by the galactic center 511 keV -ray line, Phys. Rev. Lett. 123 (2019) 251101 [1906.09994].
- [60] B. Dasgupta, R. Laha and A. Ray, Neutrino and positron constraints on spinning primordial black hole dark matter, Phys. Rev. Lett. 125 (2020) 101101 [1912.01014].
- [61] R. Laha, J.B. Muñoz and T.R. Slatyer, INTEGRAL constraints on primordial black holes and particle dark matter, Phys. Rev. D 101 (2020) 123514 [2004.00627].
- [62] A. Coogan, L. Morrison and S. Profumo, Direct detection of Hawking radiation from asteroid-mass primordial black holes, Phys. Rev. Lett. 126 (2021) 171101 [2010.04797].
- [63] M. Boudaud and M. Cirelli, Voyager 1 further constrain primordial black holes as dark matter, Phys. Rev. Lett. 122 (2019) 041104 [1807.03075].
- [64] S. Clark, B. Dutta, Y. Gao, Y.-Z. Ma and L.E. Strigari, 21 cm limits on decaying dark matter and primordial black holes, Phys. Rev. D 98 (2018) 043006 [1803.09390].
- [65] A. Halder and M. Pandey, Probing the effects of primordial black holes on 21-cm EDGES signal along with interacting dark energy and dark matter–baryon scattering, Mon. Not. Roy. Astron. Soc. 508 (2021) 3446 [2101.05228].
- [66] A. Halder and S. Banerjee, Bounds on abundance of primordial black hole and dark matter from EDGES 21-cm signal, Phys. Rev. D 103 (2021) 063044 [2102.00959].
- [67] S. Mittal, A. Ray, G. Kulkarni and B. Dasgupta, Constraining primordial black holes as dark matter using the global 21-cm signal with X-ray heating and excess radio background, JCAP 03 (2022) 030 [2107.02190].
- [68] P.K. Natwariya, A.C. Nayak and T. Srivastava, Constraining spinning primordial black holes with global 21-cm signal, Mon. Not. Roy. Astron. Soc. 510 (2021) 4236 [2107.12358].
- [69] J. Cang, Y. Gao and Y.-Z. Ma, 21-cm constraints on spinning primordial black holes, JCAP 03 (2022) 012 [2108.13256].
- [70] A.K. Saha and R. Laha, Sensitivities on nonspinning and spinning primordial black hole dark matter with global 21-cm troughs, Phys. Rev. D 105 (2022) 103026 [2112.10794].
- [71] Kamiokande-II collaboration, Observation of a neutrino burst from the supernova SN 1987a, Phys. Rev. Lett. 58 (1987) 1490.
- [72] IMB collaboration, Neutrinos from SN1987A in the IMB detector, Nucl. Instrum. Meth. A 264 (1988) 28.
- [73] E.N. Alekseev, L.N. Alekseeva, I.V. Krivosheina and V.I. Volchenko, Detection of the neutrino signal from SN1987A in the LMC using the Inr Baksan underground scintillation telescope, Phys. Lett. B 205 (1988) 209.
- [74] A. Mirizzi, I. Tamborra, H.-T. Janka, N. Saviano, K. Scholberg, R. Bollig et al., Supernova neutrinos: production, oscillations and detection, Riv. Nuovo Cim. 39 (2016) 1 [1508.00785].
- [75] S. Horiuchi and J.P. Kneller, What can be learned from a future supernova neutrino detection?, J. Phys. G 45 (2018) 043002 [1709.01515].
- [76] J.F. Beacom, The diffuse supernova neutrino background, Ann. Rev. Nucl. Part. Sci. 60 (2010) 439 [1004.3311].
- [77] C. Lunardini, Diffuse supernova neutrinos at underground laboratories, Astropart. Phys. 79 (2016) 49 [1007.3252].
- [78] P. Meszaros, Astrophysical sources of high energy neutrinos in the IceCube era, Ann. Rev. Nucl. Part. Sci. 67 (2017) 45 [1708.03577].
- [79] F. Halzen and A. Kheirandish, IceCube and high-energy cosmic neutrinos, 2202.00694.
- [80] Hyper-Kamiokande collaboration, Hyper-Kamiokande design report, 1805.04163.
- [81] JUNO collaboration, JUNO conceptual design report, 1508.07166.
- [82] DUNE collaboration, Deep Underground Neutrino Experiment (DUNE). Far detector technical design report, Volume I: Introduction to DUNE, JINST 15 (2020) T08008 [2002.02967].
- [83] DARWIN collaboration, DARWIN: towards the ultimate dark matter detector, JCAP 11 (2016) 017 [1606.07001].
- [84] DarkSide 20k collaboration, Sensitivity of future liquid argon dark matter search experiments to core-collapse supernova neutrinos, JCAP 03 (2021) 043 [2011.07819].
- [85] D. McKeen and N. Raj, Monochromatic dark neutrinos and boosted dark matter in noble liquid direct detection, Phys. Rev. D 99 (2019) 103003 [1812.05102].
- [86] G.B. Gelmini, V. Takhistov and S.J. Witte, Geoneutrinos in large direct detection experiments, Phys. Rev. D 99 (2019) 093009 [1812.05550].
- [87] N. Raj, V. Takhistov and S.J. Witte, Presupernova neutrinos in large dark matter direct detection experiments, Phys. Rev. D 101 (2020) 043008 [1905.09283].
- [88] N. Raj, Neutrinos from Type Ia and failed core-collapse supernovae at dark matter detectors, Phys. Rev. Lett. 124 (2020) 141802 [1907.05533].
- [89] V. Muñoz, V. Takhistov, S.J. Witte and G.M. Fuller, Exploring the origin of supermassive black holes with coherent neutrino scattering, JCAP 11 (2021) 020 [2102.00885].
- [90] A.M. Suliga, J.F. Beacom and I. Tamborra, Towards probing the diffuse supernova neutrino background in all flavors, Phys. Rev. D 105 (2022) 043008 [2112.09168].
- [91] F. Halzen, B. Keszthelyi and E. Zas, Neutrinos from primordial black holes, Phys. Rev. D 52 (1995) 3239 [hep-ph/9502268].
- [92] E.V. Bugaev and K.V. Konishchev, Constraints on diffuse neutrino background from primordial black holes, Phys. Rev. D 65 (2002) 123005 [astro-ph/0005295].
- [93] E.V. Bugaev and K.V. Konishchev, Extragalactic neutrino background from PBHs evaporation, astro-ph/0103265.
- [94] E.V. Bugaev and K.V. Konishchev, Neutrino background spectra from primordial black hole evaporations: dependence on the initial mass spectrum, astro-ph/0202519.
- [95] E.V. Bugaev and K.V. Konishchev, Cosmological constraints from evaporations of primordial black holes, Phys. Rev. D 66 (2002) 084004 [astro-ph/0206082].
- [96] E.V. Bugaev and K.V. Konishchev, Search for solar antineutrinos and constraints on the neutrino background from PBHs, astro-ph/0412640.
- [97] Super-Kamiokande collaboration, Search for supernova relic neutrinos at Super-Kamiokande, Phys. Rev. Lett. 90 (2003) 061101 [hep-ex/0209028].
- [98] Super-Kamiokande collaboration, Supernova relic neutrino search at Super-Kamiokande, Phys. Rev. D 85 (2012) 052007 [1111.5031].
- [99] Super-Kamiokande collaboration, Diffuse supernova neutrino background search at Super-Kamiokande, Phys. Rev. D 104 (2021) 122002 [2109.11174].
- [100] S. Wang, D.-M. Xia, X. Zhang, S. Zhou and Z. Chang, Constraining primordial black holes as dark matter at JUNO, Phys. Rev. D 103 (2021) 043010 [2010.16053].
- [101] V. De Romeri, P. Martínez-Miravé and M. Tórtola, Signatures of primordial black hole dark matter at DUNE and THEIA, JCAP 10 (2021) 051 [2106.05013].
- [102] A. Capanema, A. Esmaeili and A. Esmaili, Evaporating primordial black holes in gamma ray and neutrino telescopes, JCAP 12 (2021) 051 [2110.05637].
- [103] R. Calabrese, D.F.G. Fiorillo, G. Miele, S. Morisi and A. Palazzo, Primordial black hole dark matter evaporating on the neutrino floor, Phys. Lett. B 829 (2022) 137050 [2106.02492].
- [104] K.R. Bays, Search for the diffuse supernova neutrino background at Super-kamiokande, Ph.D. thesis, UC, Irvine, 2012.
- [105] B.J. Carr, The Primordial black hole mass spectrum, Astrophys. J. 201 (1975) 1.
- [106] M.W. Choptuik, Universality and scaling in gravitational collapse of a massless scalar field, Phys. Rev. Lett. 70 (1993) 9.
- [107] C.R. Evans and J.S. Coleman, Observation of critical phenomena and selfsimilarity in the gravitational collapse of radiation fluid, Phys. Rev. Lett. 72 (1994) 1782 [gr-qc/9402041].
- [108] J.C. Niemeyer and K. Jedamzik, Near-critical gravitational collapse and the initial mass function of primordial black holes, Phys. Rev. Lett. 80 (1998) 5481 [astro-ph/9709072].
- [109] J.C. Niemeyer and K. Jedamzik, Dynamics of primordial black hole formation, Phys. Rev. D 59 (1999) 124013 [astro-ph/9901292].
- [110] I. Musco, J.C. Miller and L. Rezzolla, Computations of primordial black hole formation, Class. Quant. Grav. 22 (2005) 1405 [gr-qc/0412063].
- [111] J.L. Zagorac, R. Easther and N. Padmanabhan, GUT-scale primordial black holes: mergers and gravitational waves, JCAP 06 (2019) 052 [1903.05053].
- [112] D. Hooper, G. Krnjaic and S.D. McDermott, Dark radiation and superheavy dark matter from black hole domination, JHEP 08 (2019) 001 [1905.01301].
- [113] D. Hooper, G. Krnjaic, J. March-Russell, S.D. McDermott and R. Petrossian-Byrne, Hot gravitons and gravitational waves from Kerr black holes in the early Universe, 2004.00618.
- [114] H. Bondi, On spherically symmetrical accretion, Mon. Not. Roy. Astron. Soc. 112 (1952) 195.
- [115] B. Nayak and L.P. Singh, Accretion, primordial black holes and standard cosmology, Pramana 76 (2011) 173 [0905.3243].
- [116] I. Masina, Dark matter and dark radiation from evaporating primordial black holes, Eur. Phys. J. Plus 135 (2020) 552 [2004.04740].
- [117] M. Drees, F. Hajkarim and E.R. Schmitz, The effects of QCD equation of state on the relic density of WIMP dark matter, JCAP 06 (2015) 025 [1503.03513].
- [118] S. Clesse and J. García-Bellido, Massive primordial black holes from hybrid inflation as dark matter and the seeds of galaxies, Phys. Rev. D 92 (2015) 023524 [1501.07565].
- [119] B. Carr, F. Kuhnel and M. Sandstad, Primordial black holes as dark matter, Phys. Rev. D 94 (2016) 083504 [1607.06077].
- [120] A.M. Green, Microlensing and dynamical constraints on primordial black hole dark matter with an extended mass function, Phys. Rev. D 94 (2016) 063530 [1609.01143].
- [121] F. Kühnel and K. Freese, Constraints on primordial black holes with extended mass functions, Phys. Rev. D 95 (2017) 083508 [1701.07223].
- [122] B. Carr, M. Raidal, T. Tenkanen, V. Vaskonen and H. Veermäe, Primordial black hole constraints for extended mass functions, Phys. Rev. D 96 (2017) 023514 [1705.05567].
- [123] N. Bellomo, J.L. Bernal, A. Raccanelli and L. Verde, Primordial black holes as sark matter: converting constraints from monochromatic to extended mass distributions, JCAP 01 (2018) 004 [1709.07467].
- [124] S.W. Hawking, I.G. Moss and J.M. Stewart, Bubble collisions in the very early Universe, Phys. Rev. D 26 (1982) 2681.
- [125] B.J. Carr, J. Gilbert and J.E. Lidsey, Black hole relics and inflation: limits on blue perturbation spectra, Phys. Rev. D 50 (1994) 4853 [astro-ph/9405027].
- [126] J. Garcia-Bellido, A.D. Linde and D. Wands, Density perturbations and black hole formation in hybrid inflation, Phys. Rev. D 54 (1996) 6040 [astro-ph/9605094].
- [127] J. Yokoyama, Cosmological constraints on primordial black holes produced in the near critical gravitational collapse, Phys. Rev. D 58 (1998) 107502 [gr-qc/9804041].
- [128] M. Drees and E. Erfani, Running-mass inflation model and primordial black holes, JCAP 04 (2011) 005 [1102.2340].
- [129] K. Kohri, C.-M. Lin and T. Matsuda, Primordial black holes from the inflating curvaton, Phys. Rev. D 87 (2013) 103527 [1211.2371].
- [130] F. Kühnel, C. Rampf and M. Sandstad, Effects of critical collapse on primordial black-hole mass spectra, Eur. Phys. J. C 76 (2016) 93 [1512.00488].
- [131] H. Deng and A. Vilenkin, Primordial black hole formation by vacuum bubbles, JCAP 12 (2017) 044 [1710.02865].
- [132] A. Dolgov and J. Silk, Baryon isocurvature fluctuations at small scales and baryonic dark matter, Phys. Rev. D 47 (1993) 4244.
- [133] K. Kannike, L. Marzola, M. Raidal and H. Veermäe, Single field double inflation and primordial black holes, JCAP 09 (2017) 020 [1705.06225].
- [134] S.A. Teukolsky and W.H. Press, Perturbations of a rotating black hole. III - Interaction of the hole with gravitational and electromagnet ic radiation, Astrophys. J. 193 (1974) 443.
- [135] D.N. Page, Particle emission rates from a black hole: massless particles from an uncharged, nonrotating hole, Phys. Rev. D 13 (1976) 198.
- [136] D.N. Page, Particle emission rates from a black hole. 2. Massless particles from a rotating hole, Phys. Rev. D 14 (1976) 3260.
- [137] D.N. Page, Particle emission rates from a black hole. 3. Charged leptons from a nonrotating hole, Phys. Rev. D 16 (1977) 2402.
- [138] A. Arbey and J. Auffinger, BlackHawk: a public code for calculating the Hawking evaporation spectra of any black hole distribution, Eur. Phys. J. C 79 (2019) 693 [1905.04268].
- [139] J. Auffinger and A. Arbey, BlackHawk: a tool for computing black hole evaporation, PoS TOOLS2020 (2021) 024 [2012.12902].
- [140] A. Arbey and J. Auffinger, Physics beyond the Standard Model with BlackHawk v2.0, Eur. Phys. J. C 81 (2021) 910 [2108.02737].
- [141] T. Sjöstrand et al., An introduction to PYTHIA 8.2, Comput. Phys. Commun. 191 (2015) 159 [1410.3012].
- [142] J. Bellm et al., Herwig 7.0/Herwig++ 3.0 release note, Eur. Phys. J. C 76 (2016) 196 [1512.01178].
- [143] A. Coogan, L. Morrison and S. Profumo, Hazma: a Python toolkit for studying indirect detection of sub-GeV dark matter, JCAP 01 (2020) 056 [1907.11846].
- [144] J.H. MacGibbon and B.R. Webber, Quark and gluon jet emission from primordial black holes: The instantaneous spectra, Phys. Rev. D 41 (1990) 3052.
- [145] J.H. MacGibbon, Quark and gluon jet emission from primordial black holes. 2. The emission over the black-hole lifetime, Phys. Rev. D 44 (1991) 376.
- [146] J.H. MacGibbon, B.J. Carr and D.N. Page, Do evaporating black holes form photospheres?, Phys. Rev. D 78 (2008) 064043 [0709.2380].
- [147] C. Lunardini and Y.F. Perez-Gonzalez, Dirac and Majorana neutrino signatures of primordial black holes, JCAP 08 (2020) 014 [1910.07864].
- [148] GRAVITY collaboration, Improved GRAVITY astrometric accuracy from modeling optical aberrations, Astron. Astrophys. 647 (2021) A59 [2101.12098].
- [149] V.V. Bobylev and A.T. Bajkova, A new estimate of the best value for the solar galactocentric distance, Astron. Rept. Prog. Phys. 65 (2021) 498 [2105.08562].
- [150] N.W. Evans, J.L. Sanders and A. Geringer-Sameth, Simple J-factors and D-factors for indirect dark matter detection, Phys. Rev. D 93 (2016) 103512 [1604.05599].
- [151] J.F. Navarro, C.S. Frenk and S.D. White, The structure of cold dark matter halos, Astrophys. J. 462 (1996) 563 [astro-ph/9508025].
- [152] J.F. Navarro, C.S. Frenk and S.D. White, A universal density profile from hierarchical clustering, Astrophys. J. 490 (1997) 493 [astro-ph/9611107].
- [153] M. Benito, F. Iocco and A. Cuoco, Uncertainties in the galactic dark matter distribution: an update, Phys. Dark Univ. 32 (2021) 100826 [2009.13523].
- [154] P.F. de Salas and A. Widmark, Dark matter local density determination: recent observations and future prospects, Rept. Prog. Phys. 84 (2021) 104901 [2012.11477].
- [155] M. Benito, A. Cuoco and F. Iocco, Handling the uncertainties in the galactic dark matter distribution for particle dark matter searches, JCAP 03 (2019) 033 [1901.02460].
- [156] P.F. de Salas et al., 2020 global reassessment of the neutrino oscillation picture, JHEP 02 (2021) 071 [2006.11237].
- [157] I. Esteban, M.C. Gonzalez-Garcia, M. Maltoni, T. Schwetz and A. Zhou, The fate of hints: updated global analysis of three-flavor neutrino oscillations, JHEP 09 (2020) 178 [2007.14792].
- [158] F. Capozzi, E. Di Valentino, E. Lisi, A. Marrone, A. Melchiorri and A. Palazzo, Global constraints on absolute neutrino masses and their ordering, Phys. Rev. D 95 (2017) 096014 [2003.08511].
- [159] W.C. Haxton, R.G. Hamish Robertson and A.M. Serenelli, Solar neutrinos: status and prospects, Ann. Rev. Astron. Astrophys. 51 (2013) 21 [1208.5723].
- [160] G. Battistoni, A. Ferrari, T. Montaruli and P.R. Sala, The atmospheric neutrino flux below 100 MeV: The FLUKA results, Astropart. Phys. 23 (2005) 526.
- [161] Super-Kamiokande collaboration, Supernova relic neutrino search with neutron tagging at Super-Kamiokande-IV, Astropart. Phys. 60 (2015) 41 [1311.3738].
- [162] N. Bernal, J. Martín-Albo and S. Palomares-Ruiz, A novel way of constraining WIMPs annihilations in the Sun: MeV neutrinos, JCAP 08 (2013) 011 [1208.0834].
- [163] P. Vogel and J.F. Beacom, Angular distribution of neutron inverse beta decay, , Phys. Rev. D 60 (1999) 053003 [hep-ph/9903554].
- [164] A. Strumia and F. Vissani, Precise quasielastic neutrino/nucleon cross-section, Phys. Lett. B 564 (2003) 42 [astro-ph/0302055].
- [165] R. Smith and E. Moniz, Neutrino reactions on nuclear targets, Nucl. Phys. B 43 (1972) 605.
- [166] Super-Kamiokande collaboration, Solar neutrino measurements in Super-Kamiokande-I, Phys. Rev. D 73 (2006) 112001 [hep-ex/0508053].
- [167] Super-Kamiokande collaboration, Solar neutrino measurements in Super-Kamiokande-II, Phys. Rev. D 78 (2008) 032002 [0803.4312].
- [168] Super-Kamiokande collaboration, Solar neutrino results in Super-Kamiokande-III, Phys. Rev. D 83 (2011) 052010 [1010.0118].
- [169] P. Haenggi, R.D. Viollier, U. Raff and K. Alder, Muon decay in orbit, Phys. Lett. B 51 (1974) 119.
- [170] M. Honda, M. Sajjad Athar, T. Kajita, K. Kasahara and S. Midorikawa, Atmospheric neutrino flux calculation using the NRLMSISE-00 atmospheric model, Phys. Rev. D 92 (2015) 023004 [1502.03916].
- [171] P. Villanueva-Domingo and V. Muñoz-Albornoz, nuhawkhunter, Mar., 2022. 10.5281/zenodo.6380867.
- [172] Super-Kamiokande collaboration, The Super-Kamiokande detector, Nucl. Instrum. Meth. A 501 (2003) 418.
- [173] J.F. Beacom and M.R. Vagins, GADZOOKS! Anti-neutrino spectroscopy with large water Cherenkov detectors, Phys. Rev. Lett. 93 (2004) 171101 [hep-ph/0309300].
- [174] L. Marti et al., Evaluation of gadolinium’s action on water Cherenkov detector systems with EGADS, Nucl. Instrum. Meth. A 959 (2020) 163549 [1908.11532].
- [175] Super-Kamiokande collaboration, First gadolinium loading to Super-Kamiokande, Nucl. Instrum. Meth. A 1027 (2022) 166248 [2109.00360].
- [176] JUNO collaboration, Neutrino physics with JUNO, J. Phys. G 43 (2016) 030401 [1507.05613].
- [177] J.-S. Lu, Y.-F. Li and S. Zhou, Getting the most from the detection of galactic supernova neutrinos in future large liquid-scintillator detectors, Phys. Rev. D 94 (2016) 023006 [1605.07803].
- [178] R. Möllenberg et al., Detecting the diffuse supernova neutrino background with LENA, Phys. Rev. D 91 (2015) 032005 [1409.2240].
- [179] KamLAND collaboration, A study of extraterrestrial antineutrino sources with the KamLAND detector, Astrophys. J. 745 (2012) 193 [1105.3516].
- [180] M. Wurm et al., Detection potential for the diffuse supernova neutrino background in the large liquid-scintillator detector LENA, Phys. Rev. D 75 (2007) 023007 [astro-ph/0701305].
- [181] DUNE collaboration, Deep Underground Neutrino Experiment (DUNE). Far detector technical design report, Volume II: DUNE Physics, 2002.03005.
- [182] A. Ankowski et al., Supernova Physics at DUNE, in Supernova Physics at DUNE, 8, 2016 [1608.07853].
- [183] K. Møller, A.M. Suliga, I. Tamborra and P.B. Denton, Measuring the supernova unknowns at the next-generation neutrino telescopes through the diffuse neutrino background, JCAP 05 (2018) 066 [1804.03157].
- [184] I. Gil Botella and A. Rubbia, Oscillation effects on supernova neutrino rates and spectra and detection of the shock breakout in a liquid argon TPC, JCAP 10 (2003) 009 [hep-ph/0307244].
- [185] A.G. Cocco, A. Ereditato, G. Fiorillo, G. Mangano and V. Pettorino, Supernova relic neutrinos in liquid argon detectors, JCAP 12 (2004) 002 [hep-ph/0408031].
- [186] F. Capozzi, S.W. Li, G. Zhu and J.F. Beacom, DUNE as the next-generation solar neutrino experiment, Phys. Rev. Lett. 123 (2019) 131803 [1808.08232].
- [187] G. Zhu, S.W. Li and J.F. Beacom, Developing the MeV potential of DUNE: detailed considerations of muon-induced spallation and other backgrounds, Phys. Rev. C 99 (2019) 055810 [1811.07912].
- [188] D.Z. Freedman, D.N. Schramm and D.L. Tubbs, The weak neutral current and its effects in stellar collapse, Ann. Rev. Nucl. Part. Sci. 27 (1977) 167.
- [189] R.H. Helm, Inelastic and elastic scattering of 187-MeV electrons from selected even-even nuclei, Phys. Rev. 104 (1956) 1466.
- [190] J.D. Lewin and P.F. Smith, Review of mathematics, numerical factors, and corrections for dark matter experiments based on elastic nuclear recoil, Astropart. Phys. 6 (1996) 87.
- [191] Particle Data Group collaboration, Review of Particle Physics, PTEP 2020 (2020) 083C01.
- [192] M. Schumann, L. Baudis, L. Bütikofer, A. Kish and M. Selvi, Dark matter sensitivity of multi-ton liquid xenon detectors, JCAP 10 (2015) 016 [1506.08309].
- [193] Z.S.C. Picker, Navigating the asteroid field: new evaporation constraints for primordial black holes as dark matter, 2103.02815.
- [194] S. Xavier, A. Sunny and S. Shankaranarayanan, Exact model for evaporating primordial black holes in a cosmological spacetime, Phys. Rev. D 105 (2022) 104038 [2110.14379].
- [195] A. Ray, R. Laha, J.B. Muñoz and R. Caputo, Near future MeV telescopes can discover asteroid-mass primordial black hole dark matter, Phys. Rev. D 104 (2021) 023516 [2102.06714].