Pegasus IV: Discovery and Spectroscopic Confirmation of an Ultra-Faint Dwarf Galaxy in the Constellation Pegasus
Abstract
We report the discovery of Pegasus IV, an ultra-faint dwarf galaxy found in archival data from the Dark Energy Camera processed by the DECam Local Volume Exploration Survey. Pegasus IV is a compact, ultra-faint stellar system ( pc; mag) located at a heliocentric distance of . Based on spectra of seven non-variable member stars observed with Magellan/IMACS, we confidently resolve Pegasus IV’s velocity dispersion, measuring (after excluding three velocity outliers); this implies a mass-to-light ratio of for the system. From the five stars with the highest signal-to-noise spectra, we also measure a systemic metallicity of dex, making Pegasus IV one of the most metal-poor ultra-faint dwarfs. We tentatively resolve a non-zero metallicity dispersion for the system. These measurements provide strong evidence that Pegasus IV is a dark-matter-dominated dwarf galaxy, rather than a star cluster. We measure Pegasus IV’s proper motion using data from Gaia Early Data Release 3, finding (. When combined with our measured systemic velocity, this proper motion suggests that Pegasus IV is on an elliptical, retrograde orbit, and is currently near its orbital apocenter. Lastly, we identify three potential RR Lyrae variable stars within Pegasus IV, including one candidate member located more than ten half-light radii away from the system’s centroid. The discovery of yet another ultra-faint dwarf galaxy strongly suggests that the census of Milky Way satellites is still incomplete, even within 100 kpc.
FERMILAB-PUB-22-211-PPD
1 Introduction
Ultra-faint dwarf galaxies represent some of the most extreme galaxies in the known universe: they are the smallest, least luminous, least metal-enriched, and most dark-matter dominated galaxies yet discovered (e.g., Muñoz et al., 2006; McConnachie, 2012; Simon, 2019). These systems were formed at high redshift, likely before the epoch of reionization, and thus serve as well-preserved “fossils” that trace the assembly and chemical enrichment histories of their host galaxies (e.g., Bullock & Johnston, 2005; Bovill & Ricotti, 2009; Frebel, 2010; Frebel et al., 2014; Brown et al., 2014). By virtue of their high dark matter content and comparatively minimal baryonic components, these systems are pristine laboratories for studying the nature of dark matter itself. For example, nearby ultra-faint dwarf galaxies are promising sites for the indirect detection of dark matter annihilation or decay through gamma-ray signals (e.g., Ackermann et al., 2014; Albert et al., 2017; Strigari, 2018), and the kinematics of stars in these galaxies offer the ability to test the cold dark matter paradigm’s prediction for the inner density profile of dark matter halos (e.g., Burkert, 1995; Zoutendijk et al., 2021a, b). Additionally, the number and distribution of these systems around the Milky Way can also be leveraged to gain further insight into dark matter microphysics (e.g., Lovell et al., 2012; Bullock & Boylan-Kolchin, 2017; Nadler et al., 2021).
The considerable wealth of information about galaxy formation and dark matter encoded in ultra-faint dwarf galaxies has motivated extensive efforts toward their discovery and characterization. Although these galaxies are expected to be the most common class of galaxy by number, their extremely low luminosity has limited their study to the very local universe, where these systems have been discovered exclusively as resolved satellites of the Milky Way, the Magellanic Clouds, and the closest galaxies in the Local Volume (within ). Dedicated searches using deep, wide-area photometric catalogs from digital sky surveys have proven to be extremely successful, resulting in the discovery of more than 60 of these systems to date (e.g., Willman et al., 2005; Zucker et al., 2006; Walsh et al., 2007; Belokurov et al., 2007, 2014; Kim et al., 2015a; Bechtol et al., 2015; Koposov et al., 2015a; Drlica-Wagner et al., 2015; Laevens et al., 2015; Torrealba et al., 2016; Koposov et al., 2018; Torrealba et al., 2019b). In turn, the characterization of these systems has benefited from follow-up spectroscopy, which can provide robust measurements of the metallicity and mass-to-light ratios of these systems (e.g., Kleyna et al., 2005; Simon & Geha, 2007; Kirby et al., 2008; Collins et al., 2013; Simon et al., 2020; Jenkins et al., 2021).
Despite the explosion of discoveries in the last two decades, cold dark matter simulations predict that numerous ultra-faint Milky Way satellites remain to be discovered, even in regions of sky covered by previous sky surveys (e.g., Hargis et al., 2014; Newton et al., 2018; Nadler et al., 2020; Manwadkar & Kravtsov, 2021). This prediction has recently been affirmed by the discovery of three new Milky Way satellite galaxies by the Hyper Suprime-Cam Subaru Strategic Program (Homma et al., 2016, 2018, 2019) and four additional satellites (including both dwarf galaxy candidates and globular clusters) by the DECam Local Volume Exploration (DELVE; Drlica-Wagner et al. 2021; Mau et al. 2020; Cerny et al. 2021a, b).
In this work, we present the discovery and characterization of yet another ultra-faint Milky Way satellite by DELVE. This new system, Pegasus IV, lies at the very northern edge of sky accessible to the Dark Energy Camera (DECam; Flaugher et al. 2015) in a region previously covered at a shallower depth by the Sloan Digital Sky Survey (SDSS; York et al. 2000 and the Panoramic Survey Telescope and Rapid Response System 1 survey (PS1; Chambers et al. 2016). We use medium-resolution Magellan/IMACS spectroscopy to measure the metallicities and line-of-sight velocities of candidate member stars. We resolve a stellar velocity dispersion and confirm that this system is a dark-matter-dominated ultra-faint dwarf galaxy.
This paper is organized as follows. In Section 2, we describe the DELVE survey, its photometric catalogs, and our ongoing search for undiscovered ultra-faint stellar systems. We also introduce the newly discovered system Pegasus IV. In Section 3, we characterize the morphology and stellar population of Pegasus IV through maximum-likelihood fits to DELVE photometric data. In Section 4, we measure the velocities of stars in the field of Pegasus IV and use the resolved velocity dispersion to infer its mass and dark matter content. We also measure [Fe/H] metallicities and find tentative evidence for a metallicity spread. In Section 5, we discuss the implications of these results for the Pegasus IV’s classification, leverage Gaia proper motions and our velocity measurements to constrain its orbit, and highlight the presence of three RR Lyrae variable stars. In Section 6, we summarize these results and describe avenues for future study.
2 DELVE Data and Satellite Search
2.1 DELVE Data
The DELVE survey is an ongoing multi-component observational campaign seeking to achieve deep, contiguous coverage of the high-Galactic-latitude southern sky in the bands by combining 126 nights of new observations with existing public archival DECam data. DELVE is split into three main survey components dedicated to studying the resolved stellar substructures and satellite populations of the Milky Way (DELVE-WIDE), the Magellanic Clouds (DELVE-MC), and four nearby galaxies with stellar mass similar to the Magellanic Clouds (DELVE-DEEP). To date, DELVE has taken new exposures toward this goal, and is expected to finish collecting observations in the 2022B semester. A more detailed description of the DELVE science goals, observing strategy, and progress can be found in Drlica-Wagner et al. (2021).
For this work, we used a new internal photometric catalog for DELVE-WIDE covering nearly the entire sky accessible to DECam with and , excluding the Dark Energy Survey footprint. This new catalog will be described in detail in a forthcoming paper (A. Drlica-Wagner et al. in prep.); we describe the critical components here. We began by selecting all available DELVE and publicly-available exposures with exposure times between and seconds and effective exposure time scale factors (see Neilsen et al., 2015). After this selection, we were left with a total of exposures, the largest contributors to which were the Dark Energy Camera Legacy Survey (DECaLS; Dey et al. 2019), the DECam eROSITA Survey (DeROSITAS)111http://astro.userena.cl/derositas/, and DELVE itself. DELVE-WIDE primarily collects band observations, and the data come primarily from the former two survey programs.
We processed all exposures consistently using the DES Data Management Pipeline (DESDM; Morganson et al. 2018), which reduces and detrends DECam images using custom seasonally-averaged bias and flat images, and performs background subtraction. Automated source detection and point-spread-function photometry was performed on individual reduced CCD images using SourceExtractor (Bertin & Arnouts, 1996) and PSFEx (Bertin, 2011). Stellar positions were then calibrated against Gaia Data Release 2 (Gaia Collaboration et al., 2018) using SCAMP (Bertin, 2006), and the photometry was calibrated on a CCD-by-CCD basis using zeropoints derived from the ATLAS Refcat2 catalog (Tonry et al., 2018) that were transformed into the DECam photometric system (see Appendix B of Drlica-Wagner et al. 2021). Lastly, the resulting calibrated SourceExtractor catalogs for each individual CCD image were merged into a unified multi-band object catalog following the procedure introduced in Drlica-Wagner et al. (2015).
Reddening due to interstellar dust was calculated for each object in the resultant catalog from a bilinear interpolation of the maps of Schlegel et al. (1998) with the rescaling from Schlafly & Finkbeiner (2011). Bandpass-specific extinctions were then derived using the coefficients used for DES DR1 (Abbott et al., 2018). Hereafter, we utilize the subscript “0” to denote extinction-corrected magnitudes.
2.2 Satellite Search
We performed a matched-filter search for old, metal-poor stellar systems in the DELVE-WIDE catalog described above using the simple algorithm222https://github.com/DarkEnergySurvey/simple (Bechtol et al., 2015), which has been succesfully leveraged to discover more than twenty Milky Way satellites to date. We began by dividing the DELVE-WIDE catalog described in Section 2.1 into HEALPix (Górski et al., 2005) pixels at ( per pixel). For each pixel, we selected stars consistent with an old ), metal poor () PARSEC isochrone (Bressan et al., 2012), which we scanned in distance modulus from 16.0 mag to 23.0 mag in intervals of 0.5 mag. Specifically, at each step in the distance modulus grid, we selected all stars with colors consistent with the isochrone locus in color–magnitude space following . Stars were defined as sources satisfying the criterion
where the variable SPREAD_MODEL and its associated error, SPREADERR_MODEL, are calculated from a likelihood ratio between the best-fitting local PSF model and a more extended model derived from the same PSF model that is additionally convolved with a circular exponential disk model (Desai et al., 2012). After these selections, the resulting filtered stellar density field was smoothed by a Gaussian kernel, and local density peaks were identified by iteratively raising a density threshold until fewer than ten distinct peaks remained. Lastly, we computed the Poisson significance of each peak relative to the local background field. Informed by previous searches using simple, we inspected diagnostic plots for all candidates above a significance threshold of .

2.3 Discovery of Pegasus IV
During visual inspection of the search results produced by simple, we identified a candidate stellar system near () at a significance of .333This significance was an underestimate, as a result of a relatively poor initial distance modulus fit from simple Our ugali likelihood analysis (Section 3) later suggested a test statistic (TS) of , corresponding to a Gaussian significance of . Within the candidate pool, this system was exceptional because it appeared to display seven stars at spanning a range of photometric color – a feature indicative of a blue horizontal branch. Querying this candidate’s centroid in the SIMBAD database (Wenger et al., 2000) revealed the existence of two RR Lyrae variable stars within a radius of , both of which were independently identified by the PS1 RR Lyrae catalog (Sesar et al., 2017) and the Gaia DR2 variability catalogs (Holl et al., 2018; Clementini et al., 2019).
These identifications strongly merited further investigation of the candidate system. However, the relatively shallow depth of the discovery data was found to be insufficient to draw firm conclusions about the nature and properties of this system. Therefore, we obtained additional imaging of the candidate system during regular DELVE observing and in DECam engineering time in August 2021. These newer observations consisted of second exposures centered on the candidate, improving the depth by mag in each band compared to the discovery data. These deeper exposures were then incorporated into a newer iteration of the DELVE catalog (prepared identically to the catalog described in Section 2.1), and this newer catalog was used for all analyses and figures in the following sections.
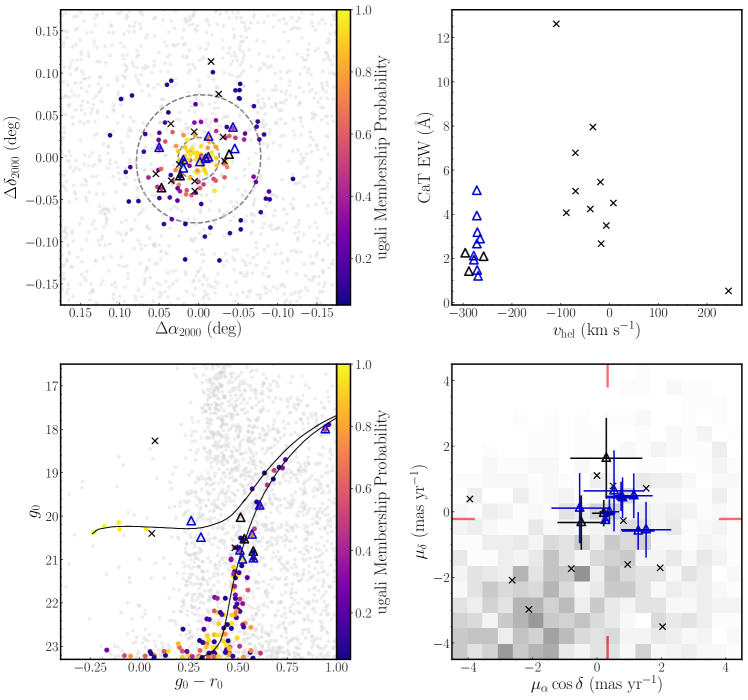
In Figure 1, we present diagnostic plots for the candidate stellar system similar to those generated for each overdensity identified by simple. These include the smoothed distribution of isochrone-filtered stars and galaxies (leftmost and center-left panels, respectively), a background-subtracted Hess diagram (center-right panel), and a radial profile for the system (rightmost panel), including the best-fit Plummer (1911) model derived in Section 3.
Our analyses described in the following sections strongly suggest that this system is an ultra-faint dwarf galaxy, rather than a star cluster. Therefore, following the historical naming convention for confirmed dwarf galaxy satellites of the Milky Way, we refer to the system as Pegasus IV throughout this work.
.
3 Morphological Properties of Pegasus IV
To determine Pegasus IV’s morphological properties and the nature of its stellar population, we used the maximum likelihood approach implemented in the Ultra-faint GAlaxy LIkelihood toolkit (ugali 444https://github.com/DarkEnergySurvey/ugali/; Bechtol et al. 2015; Drlica-Wagner et al. 2020). Pegasus IV’s structure was modelled with a Plummer (1911) stellar density profile, and a Bressan et al. (2012) isochrone was fit to its observed color–magnitude diagram. We simultaneously constrained the centroid coordinates (), angular semi-major axis length (), ellipticity (), position angle East of North (P.A.) of the Plummer profile and the distance modulus , age (), and metallicity () of the isochrone, in addition to the stellar richness (), which measures the total number of observable stars in the system. To do so, we explored this multi-dimensional parameter space using the affine-invariant Markov Chain Monte Carlo sampler emcee (Foreman-Mackey et al., 2013), and derived parameter estimates and uncertainties from the median and 16th/84th percentiles of the resulting posterior distributions. Although we later measured a spectroscopic metallicity for the system, we did not fix the metallicity for this parameter fit, both to maintain consistency with the literature and to avoid potential systematic offsets in metallicity between isochrone models and the spectroscopic metallicities.
We report the values associated with each of these parameters, in addition to several properties derived from these results, above the first divider in Table 1. These extra derived properties include the system’s azimuthally-averaged angular half-light radius (), defined as and the system’s absolute magnitude (), integrated stellar luminosity (), and stellar mass (). The absolute V-band magnitude was derived following Martin et al. (2008), and both the stellar mass and stellar luminosity were computed by integrating along the best-fit isochrone assuming a Chabrier (2001) initial mass function.
The results from this parameter fit suggested that Pegasus IV is a relatively small ( 41 pc), round (ellipticity consistent with zero) stellar system at a heliocentric distance of kpc. In the top left panel of Figure 2, we plot the spatial distribution of stars in a small region centered on Pegasus IV. Stars with ugali membership probabilities are colored by their membership probability; stars below this threshold are plotted in gray. Ellipses denoting and are plotted with a gray dashed line. The bottom left panel displays a color–magnitude diagram covering the same area, with the same color scheme. The best-fit Bressan et al. (2012) isochrone ( dex) from the ugali fit is shown as a solid black line. While this isochrone is more metal-rich than the spectroscopic metallicity we derive in the following sections, we note that the posterior distribution for the metallicity was bounded below at ( dex), corresponding to the lowest metallicity in the Bressan et al. (2012) library. The upper limit on Pegasus IV’s metallicity from the ugali fit was dex (at 95% confidence), and thus our later identification of a lower metallicity for the system is not surprising.
| Parameter | Description | Value | Units | Section |
|---|---|---|---|---|
| Centroid Right Ascension | deg | 3 | ||
| Centroid Declination | deg | 3 | ||
| Angular Semi-Major Axis Length | arcmin | 3 | ||
| Physical Semi-Major Axis Length | pc | 3 | ||
| Azimuthally-Averaged Angular Half-Light Radius | arcmin | 3 | ||
| Azimuthally-Averaged Physical Half-Light Radius | pc | 3 | ||
| Ellipticity | aaThe posterior distribution peaked near . We therefore quote an upper limit at the 95% confidence level. | … | 3 | |
| Position Angle of Major Axis (East of North) | deg | 3 | ||
| Distance Modulus | bbFollowing Drlica-Wagner et al. (2015), we assume a systematic uncertainty of mag on the distance modulus to account for uncertainties in isochrone modeling. | mag | 3, 5.5 | |
| Heliocentric Distance | kpc | 3 | ||
| Age | ccThe posterior distribution peaked near , corresponding to the oldest age in our PARSEC isochrone grid. We therefore quote a lower limit at the 95% confidence level. | 3 | ||
| Absolute (Integrated) -band Magnitude | ddThe uncertainty in the absolute visual magnitude was calculated following Martin et al. (2008) and does not include the uncertainty on the distance. | mag | 3 | |
| Luminosity | 3 | |||
| Stellar Mass | 3 | |||
| Mean Reddening Within the Half-Light Radius | 0.06 | mag | 3 | |
| Number of Spectroscopic Members | … | 4.4 | ||
| Systemic Radial Velocity in Heliocentric Frame | km s-1 | 4.5 | ||
| Systemic Radial Velocity in the Galactic Standard of Rest | km s-1 | 4.5 | ||
| Velocity Dispersion | km s-1 | 4.5 | ||
| Dynamical Mass within | 4.5 | |||
| Mass-to-Light Ratio within | 4.5 | |||
| Mean Spectroscopic Metallicity | dex | 4.6 | ||
| Metallicity Dispersion among Spectroscopic Members | dex | 4.6 | ||
| Proper Motion in Right Ascension | mas yr-1 | 4.7 | ||
| Proper Motion in Declination | mas yr-1 | 4.7 | ||
| Galactocentric Distance | 89 | 5.2 | ||
| Orbital Apocenter | 5.2 | |||
| Orbital Pericenter | 5.2 | |||
| Orbital Eccentricity | … | 5.2 | ||
| Integrated -factor within a solid angle of 0.2∘ | GeV2cm-5 | 5.4 | ||
| Integrated -factor within a solid angle of 0.5∘ | GeV2cm-5 | 5.4 |
4 Stellar Velocities and Metallicities from Magellan/IMACS Spectroscopy
4.1 Observations and Data Reduction
To confirm that Pegasus IV is a bound stellar system, and to determine its kinematic and dynamical properties, we observed the system with the 6.5m Magellan-Baade Telescope and the Inamori-Magellan Areal Camera and Spectrograph (IMACS; Dressler et al. 2011) on a two-night observing run spanning September 12–13, 2021. Following previous studies of ultra-faint dwarf galaxies using IMACS, we used the instrument’s f/4 camera and the 1200 mm grating blazed at (e.g., Simon et al., 2017). The resulting spectra spanned a wavelength range of Åat , sufficient for precise velocity and metallicity measurements from the Calcium Triplet (CaT) absorption feature centered at roughly Å.
We observed a single multislit mask centered on the system, which featured 32 slits. Targets were chosen in the following order. Firstly, we selected red giant branch (RGB) and horizontal branch (HB) stars consistent with a Dotter (2016) isochrone with age Gyr and metallicity in our DECam photometry, informed by past studies of ultra-faint dwarf galaxies. We then added bright stars that we identified as possible members on the basis of a preliminary mixture model analysis of their proper motions in EDR3 (see Section 4.7). Lastly, to fill remaining available space on the slitmask, we added several stars from Gaia that lacked DECam photometry.
Due to the northern declination of Pegasus IV () and the southern latitude of Las Campanas Observatory, we were only able to observe Pegasus IV at airmass with Magellan/IMACS for a little over an hour on each night. On each night, we collected two science exposures (1800s + 2400s), followed by (Kr, Ar, Ne, He) arc lamp calibration frames and flat frames. The typical seeing for these observations was on September 12 and on September 13.
We reduced the IMACS spectroscopic observations following the procedure described by Simon et al. (2017). In brief, this process first involved using the Cosmos reduction pipeline (Dressler et al., 2011; Oemler et al., 2017) to map slits on the IMACS detector plane and achieve a preliminary wavelength solution based on the arc lamp data. Then, a modified version of the DEEP2 data reduction pipeline (Cooper et al., 2012; Newman et al., 2013) was used to extract and calibrate the one-dimensional spectrum for each star. We then combined the spectra from the four exposures using inverse-variance weighting.
4.2 Velocity Measurements
We measured stellar radial velocities from the IMACS spectra following the method introduced in Li et al. (2017). This method involves fitting the reduced spectrum of each star with velocity templates by shifting the template through a range of velocities to find the velocity that maximizes the likelihood
| (1) |
Here, and represent a normalized spectrum and its corresponding variance, and represents a normalized velocity template spectrum. Because we measured velocities specifically from the CaT absorption feature, we set the wavelength bounds of the spectral fit to be and . All of our IMACS spectra were fit with three velocity templates: HD122563, a very metal-poor RGB star; HD26297, a more metal-rich RGB star; and HD161817, a blue horizontal branch star. We report the velocity measurement from the template that produced the largest likelihood at the best-fit velocity.
For each spectrum-template combination, we ran the MCMC sampler implemented by emcee to sample the likelihood function above. To ensure robust sampling, we used 25 walkers each taking 2000 steps, with the first 500 steps for each walker discarded as burn-in. Then, for each star, we took the median and the standard deviation (after clipping) of the velocity posterior distribution for the best-fit template as the measured velocity and velocity error respectively.
We next applied a telluric correction to this measured velocity to account for the miscentering of stars within slits, which can lead to small () offsets in the measured velocities of stars (see e.g., Sohn et al. 2007). To derive the correction for each spectrum, we re-ran the identical template-fitting MCMC procedure described above except with a telluric template, setting and . The median and standard deviation of the resulting posterior distribution then provided the magnitude of the telluric correction and its associated variance .
The corrected velocity of each star, , was calculated as with an associated uncertainty of . The error is purely statistical in nature, and is directly correlated with the of each individual spectrum. Informed by previous studies that considered the repeatability of IMACS velocities between successive nights (e.g., Simon et al., 2017; Li et al., 2018), we also added a systematic error term in quadrature to each velocity measurement error.
In summary, the above steps resulted in velocities for each star, each with a single associated uncertainty. These velocities were then transformed into the heliocentric frame. For the rest of this work, we denote the resulting heliocentric velocities as . In total, we were able to measure reliable velocities for 23 unique stars at .
4.3 Metallicity Measurements
We measured the metallicity of red giant branch member stars in Pegasus IV through the equivalent widths (EWs) of the CaT lines. We modelled each of the three CaT lines for each star with a Gaussian-plus-Lorentzian profile (e.g., Hendricks et al., 2014; Simon et al., 2015), and converted their summed EWs to metallicities using the calibration relation from Carrera et al. (2013). This relation requires an absolute V-band magnitude for each star, and thus we first converted from the DELVE -band photometry to this system using the relation provided in Bechtol et al. (2015), and then subtracted the distance modulus derived from the ugali fit (Section 3). The resulting error on the metallicity for each star was fully propagated from a combination of four sources: (1) uncertainty in the EW measurements, including a systematic uncertainty floor (Li et al., 2018); (2) uncertainties in the coefficients from the Carrera et al. (2013) relation; (3) uncertainties in the DELVE photometry, and (4) uncertainty associated with the distance modulus from ugali. The first of these sources of error is dominant for all but the brightest star.
In general, accurate CaT EW measurements require higher signal-to-noise than accurate velocity measurements. Visual inspection of the spectra for stars in our sample revealed that the CaT fits for stars with low signal-to-noise were of poor quality, and thus we opted to impose a cut for metallicity measurements. In total, we measured metallicities for 11 stars above this threshold.
4.4 Spectroscopic Membership Determination
From the 23 spectra with for which we measured velocities, we identified a clear clustering of twelve stars with radial velocities , including nine within the narrower range of (see top right panel of Figure 2). These twelve stars were separated in velocity from all other measured stars with by a gap of , and were all located within of our derived centroid for Pegasus IV. We summarize the key properties of these 12 stars in Table 2.
To assess which stars among this sample of 12 were plausible Pegasus IV members as opposed to Milky Way contaminants, we subjectively inspected these stars’ proper motions from Gaia EDR3, locations in color–magnitude space from the DELVE photometry, and heliocentric velocities and metallicities from the IMACS spectroscopy (where possible). We found that all 12 stars displayed self-consistent proper motions (within ) and were photometrically consistent with an old, metal-poor isochrone (see bottom panels of Figure 2). Thus, we found no reason to reject any stars as members on the basis of color or proper motion information.
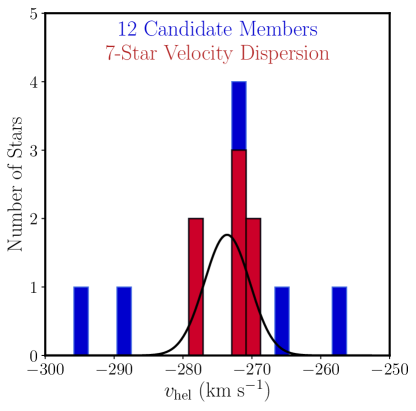
The velocities of these 12 stars appeared to show a considerable spread, ranging from . As can be seen in Figure 3, nine of these stars lay within of the apparent mode near . The remaining three stars fell significantly outside of this range, lying at . Even if Pegasus IV truly exhibits a large velocity dispersion, these stars’ separation from the peak of the observed velocity distribution suggested that they are either non-members or are binary star members of Pegasus IV that were observed at an orbital phase that places them far from their center-of-mass velocity.555No detectable variation in velocity for binary stars is expected in our data between the two successive nights of our observations.
The first of the aforementioned velocity outliers (at ) was found to have dex – consistent with the mean metallicity of this system (see Section 4.6). In general, isolated halo stars at this metallicity are relatively rare (e.g, Schörck et al., 2009; Youakim et al., 2020). Thus, we presume that this star is a candidate binary member star of Pegasus IV, rather than a non-member, but emphasize that this assumption has a significant impact on the measured velocity dispersion (see Section 4.5). We further caution that the metallicity estimate for this star assumes that the star is located at the distance of Pegasus IV, and will be underestimated should the star prove to be an foreground contaminant. In contrast to the case of the velocity dispersion, however, this star has only a small effect on our estimation of Pegasus IV’s metallicity dispersion (see Section 4.6).
For the remaining two velocity outliers, both of which appeared to lie along the RGB of our best-fit isochrone, we were unable to confidently distinguish whether these stars are binary members or foreground non-members in the absence of multi-epoch velocity measurements. To assess the likelihood that these two stars could be Milky Way foreground contaminants, we ran a simulation using the web interface to the Besançon Galactic model (Robin et al., 2003). We first queried the model to produce a catalog of stellar magnitudes and kinematic measurements for simulated stars within a deg2 region centered on Pegasus IV. We then transformed the resultant magnitudes from the SDSS photometric system to the DECam photometric system using the equations provided by Drlica-Wagner et al. (2018). Then, we computed the expected surface density of Milky Way stars within a radius that were consistent with the RGB of our target selection isochrone, had heliocentric radial velocities , and had small proper motions ( in each direction). After multiplying this surface density by the area of the region that the IMACS slitmask covered ( arcmin2), we found that foreground star is expected in our spectroscopic sample within this velocity range. Our observation of two stars with outlying radial velocities is slightly inconsistent with this prediction, potentially suggesting that one or both of these stars is a binary member of Pegasus IV. We reiterate that the membership status of these two stars remains highly uncertain.
Lastly, to assess whether the brightest star was indeed a member star despite its relatively high metallicity ( dex; first row of Table 2), we measured the equivalent width of its Mg I absorption line. As described by Battaglia & Starkenburg (2012), this line can be used in conjunction with the CaT to discriminate between foreground Milky Way contaminants (primarily main-sequence stars) and dwarf galaxy members (red giants). Fitting the Mg I line with a Gaussian profile, we calculated the equivalent width to be (statistical error only). Given the star’s CaT equivalent width of , this confidently places the star in the red giant regime defined by Equation 1 of Battaglia & Starkenburg (2012), and thus we concluded that it is very likely that this star is a true RGB member of Pegasus IV.666We opted not to conduct a similar analysis on the remaining candidate member stars because of their significantly lower S/N. Furthermore, Battaglia & Starkenburg (2012) suggest that the contaminant/giant populations become less distinguishable in the Mg EW / CaT EW plane for stars with metallicities approaching dex, which would render this approach ineffective for the remaining stars for which we measured metallicities.
In summary, we identified nine clear spectroscopic member stars, in addition to one candidate binary member and two potential members with considerably uncertain status. Of the nine clear members, seven are RGB stars, and two appear to lie on the HB. The clear members are shown as blue triangles in Figure 2, while the potential members with uncertain status are shown as black triangles. One of the two spectroscopically-observed HB stars is classified as a RR-Lyrae-type variable in the PS1 and Gaia RR Lyrae catalogs (see Section 5.5), and the other appears to show some signs of photometric variability in our data. We include all 12 of these stars in Table 2 as candidate members, but include a comment in the final column to highlight each of the uncertain cases.
| Gaia EDR3 SourceID | R.A. | Decl. | S/N | [Fe/H] | Comment | |||
|---|---|---|---|---|---|---|---|---|
| (deg) | (deg) | (mag) | (mag) | (km/s) | (dex) | |||
| 1796890071833434112 | 328.52536 | 26.62094 | 18.01 | 17.07 | 52.4 | -271.9 1.0 | -2.03 0.11 | RGB |
| 1796887219975171328 | 328.59498 | 26.63219 | 19.77 | 19.16 | 10.6 | -278.1 1.3 | -2.85 0.36 | RGB |
| 1796888907896667520 | 328.48786 | 26.63070 | …aaThis star was not in the DELVE photometric catalog, as it was obscured by a charge-bleed artifact caused by a nearby bright star. For the purpose of deriving this star’s [Fe/H] metallicity, we instead calculated a -band magnitude for this star using the Gaia EDR3 photometry and assumed a conservative error of mag. This magnitude was then used in the Carrera et al. (2013) relation. | …aaThis star was not in the DELVE photometric catalog, as it was obscured by a charge-bleed artifact caused by a nearby bright star. For the purpose of deriving this star’s [Fe/H] metallicity, we instead calculated a -band magnitude for this star using the Gaia EDR3 photometry and assumed a conservative error of mag. This magnitude was then used in the Carrera et al. (2013) relation. | 7.9 | -277.9 1.7 | -2.89 0.35 | RGB |
| 1796888834882857216 | 328.49587 | 26.62398 | 20.05 | 19.54 | 7.8 | -257.9 2.0 | -2.80bbThis metallicity assumes that the star is a member of Pegasus IV, and therefore that its distance is kpc. 0.33 | Binary/Non-member? |
| 1796890381071133568 | 328.52503 | 26.64546 | 20.44 | 19.87 | 5.5 | -269.2 2.2 | -3.32 0.38 | RGB |
| 1796890071833414784 | 328.53716 | 26.61518 | 20.13 | 19.87 | 4.7 | -265.1 1.8 | … | HB; Variable? |
| 1796886807658193536 | 328.59171 | 26.58421 | 20.54 | 20.01 | 4.6 | -295.6 2.5 | … | Non-member? |
| 1796887082536156928 | 328.56077 | 26.60775 | 20.51 | 20.20 | 3.6 | -271.8 3.7 | … | HB; RR Lyrae |
| 1796891171345139456 | 328.49033 | 26.65611 | 20.80 | 20.29 | 3.5 | -271.2 4.15 | … | RGB |
| 1796887048176397952 | 328.56543 | 26.59852 | 20.83 | 20.25 | 3.5 | -288.1 2.82 | … | Non-member? |
| 1796887151255658752 | 328.56076 | 26.61745 | 20.98 | 20.40 | 3.3 | -270.7 3.23 | … | RGB |
| 1796890071833423872 | 328.52913 | 26.61916 | 21.00 | 20.49 | 3.2 | -271.75 3.69 | … | RGB |
Note. — R.A. and Decl. coordinates are taken from EDR3. The -band photometric measurements are taken from DELVE (with one exception; see below), and correspond to AB magnitudes in the DECam photometric system. The reported signal-to-noise ratios () refer to the IMACS spectroscopic data. We intend to release an extended version of this table that includes spectroscopically-observed non-members upon publication.
4.5 Velocity Dispersion and Mass
To constrain the systemic velocity () and velocity dispersion () of Pegasus IV, we sampled the two-parameter Gaussian likelihood function defined by Equation 8 of Walker et al. (2006) using emcee. We applied a uniform prior on with range , and a uniform prior on with range . For our primary kinematic measurements, we included only the seven clear (non-outlier) RGB member stars described in Section 4.4. We excluded the two candidate variable stars on the HB from our kinematic sample, since the pulsation of variable stars causes their apparent velocities to vary over time.
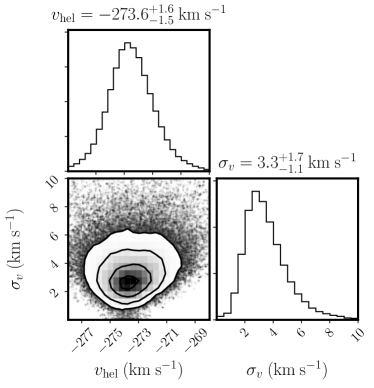
Using these seven stars, and applying the priors described above, we measured Pegasus IV’s systemic velocity to be with a velocity dispersion of . The resulting posterior probability distributions from the MCMC sampling are shown in the left panel of Figure 4, and the best-fit model is depicted in black over the velocity histogram in Figure 3. To assess the impact of our prior on this measurement, we also explored adopting a flat prior on , rather than . Holding all else constant, this change of prior resulted in changes to the systemic velocity and velocity dispersion that were significantly smaller than the quoted errors of our primary measurements.
Our measured velocity dispersion of is clearly non-zero, implying that we confidently resolved the internal dynamics of Pegasus IV. However, the value of this dispersion was found to be sensitive to the exact member used in our velocity dispersion fit. In particular, we observed that including the metal-poor outlier at (while retaining our default priors) raised the velocity dispersion to , consistent within of the measured dispersion from our nominal seven-star sample. Similarly, including all 12 candidate member stars would raise the velocity dispersion to (after relaxing the prior to [-3,3]). Given that adopting these alternate member samples only increased the resulting velocity dispersion, our primary results derived from the seven-star sample can be considered as the most conservative estimate of the dark matter content of Pegasus IV. This ensures that our ultimate conclusion that Pegasus IV is a dark-matter dominated dwarf galaxy (see Section 5.1) is insensitive to assumptions about the nature of these apparent velocity outliers.
Therefore, under the assumption that Pegasus IV is a dispersion-supported system in dynamical equilbrium, we proceeded to estimate the system’s dynamical mass using the mass estimator introduced in Equation 2 of Wolf et al. (2010):
| (2) |
Using our measured dispersion from the nominal seven-star sample and the half-light radius from Section 3, we found Pegasus IV’s enclosed mass within to be . The mass-to-light ratio within one half-light radius is therefore .

4.6 Metallicity and Metallicity Spread
To measure Pegasus IV’s mean metallicity () and metallicity dispersion , we applied a simple Gaussian likelihood model that was nearly identical to the model used for the velocity and velocity dispersion. We adopted a uniform prior on with range , and again performed MCMC sampling using emcee. By default, we opted only to use the five stars with (including the binary candidate at ).777The spectra and corresponding CaT fits for each of these stars are shown in Appendix Section A. For these stars, we found dex and metallicity dispersion dex. The resulting posterior probability distributions are shown in the righthand panel of Figure 4.
Given the small sample of stars with (five in total), we performed a jacknife test (Efron, 1982) to assess the robustness of our measured metallicity and metallicity dispersion. We removed individual stars , one at a time, and re-ran the MCMC sampling. After doing so, we found that the brightest, most metal-rich star (first row of Table 2) had a particularly strong influence on the metallicity and metallicity dispersion. Removing this star resulted in a more metal-poor systemic mean metallicity of dex and a much smaller dispersion of dex, in tension with the five-star measurement. By contrast, removing each of the three stars at dex (second, third, and fourth row of Table 2) minimally affected the mean metallicity and minorly increased the measured dispersion (well-within the uncertainties on the five-star sample dispersion). Lastly, removing the most-metal poor star (fifth row of Table 2, dex) increased the mean metallicity to dex and resulted in a slightly smaller dispersion of dex. Both of these are consistent within of the five-star result.
These results, in aggregate, suggest that Pegasus IV is a metal-poor stellar system with a tentative detection of a non-zero metallicity dispersion. The magnitude of the dispersion is highly contingent on the membership of the brightest star. Since our measurement of the Mg I line for this star gives no reason to doubt its membership, we opt to report the metallicity and corresponding dispersion from the five-star sample, namely, dex and , but we emphasize that the value of our measured dispersion is tentative and should be interpreted cautiously due to the small sample size. We also note that this includes the star with velocity of , which we assumed to be a true member, but excluded in our kinematic analysis given the likelihood that this star is an unresolved binary.
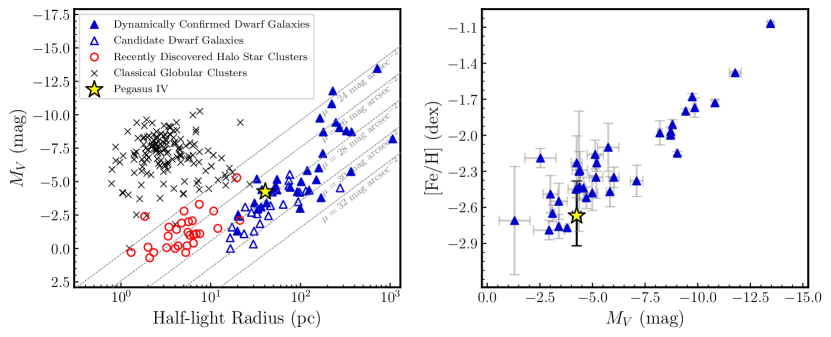
Regardless of the input stellar sample, the mean metallicity of Pegasus IV places it among the most metal-poor ultra-faint dwarfs known, which include Reticulum III, Bootes II, Tucana II, Horologium I, Draco II, and Reticulum II, the metallicities of which range from dex. Our measurement suggests that Pegasus IV is slightly more metal-poor than other dwarf galaxies of similar absolute magnitude (see right panel of Figure 5), but this difference does not appear to be statistically significant.
Our measured metallicity dispersion ( dex), while relatively uncertain, is comparable to the dispersions observed in other ultra-faint dwarf galaxies at similar absolute magnitude, i.e., Columba I, Coma Berenices I, Leo V, Pisces II, and Ursa Major II, which have dex, respectively (Fritz et al., 2019; Simon, 2019; Jenkins et al., 2021; Kirby et al., 2015). Pegasus IV’s metallicity dispersion can also be compared to the intrinsic iron abundance spreads observed in the Milky Way’s (bright) globular cluster population, which Bailin (2019) found to have a median metallicity dispersion of dex across a sample of 55 clusters with high-resolution spectra.
4.7 Proper Motion
We computed the systemic proper motion of Pegasus IV using the precise astrometry provided by Gaia EDR3 (Gaia Collaboration et al., 2021). We analyzed three different proper motion models to measure the systemic proper motion. The first was a mixture model composed of dwarf and Milky Way components and utilizes spatial position and proper motion (Pace & Li, 2019). This model was run prior to the acquisition of both deeper photometry and spectroscopy, and its results informed our spectroscopic target selection. It was run with preliminary spatial parameters and only used stars with DECam photometry. With this model, we found and . The model also reports the number of probable members with proper motion measurements, which was found to be stars. Due to the color–magnitude selection window, this model missed the brightest member, which explains the worse precision compared to the following models.
The second proper motion model was similar to the first, but used only a fixed sample of spectroscopic members as input. We used a multi-variate Gaussian distribution to model the dwarf, and we sampled the posterior probability using emcee. With this model, we found , , assuming a fixed sample of stars (consisting of the seven stars used for the dynamical analysis, in addition to the two spectroscopically-observed variable star candidates). The third model used a similar mixture model, but built on Pace & Li (2019) by incorporating spectroscopic information. We pre-assigned the membership of stars with spectroscopy, which assists in determining both the dwarf and Milky Way proper motion distributions. We did not exclude stars missing DECam photometry and instead applied a loose Gaia color–magnitude selection for these stars. With this model, we found and , and . The proper motion from this model is almost identical to the spectroscopic-member-only results from the second model, likely because the additional members are generally faint (mostly HB stars) and do not significantly influence the measurement. We note that the majority of the systemic proper motion precision comes from the brightest member. The proper motion error of this star is (similar to the systemic proper motion error) and its inclusion decreases the systemic proper motion error by . We opted to use the systemic proper motion derived from the spectroscopic members as our preferred measurement for further analysis of Pegasus IV’s kinematics, since this measurement is least likely to be biased by contaminant stars. We do note, however, that differences have been observed between dwarf galaxy proper motions derived from spectroscopic samples and those derived without (e.g., Massari & Helmi 2018).
5 Discussion
5.1 Classification of Pegasus IV
Recent discoveries of ultra-faint Milky Way satellites have broadly consisted of two classes of objects: dark-matter-dominated dwarf galaxies and likely baryon-dominated halo star clusters. We find that Pegasus IV is significantly more consistent with the former class of objects on the basis of its size, mass-to-light ratio, and metallicity dispersion. Specifically, Pegasus IV’s half-light radius is larger than the population of known globular clusters (see left panel of Figure 5). More conclusively, Pegasus IV’s large mass-to-light ratio () is inconsistent with the known population of halo star clusters, which typically exhibit mass-to-light ratios of (e.g., Dalgleish et al., 2020). Lastly, the system’s tentatively-resolved metallicity dispersion suggests that it has undergone multiple generations of star formation and/or that its gravitational potential well is deep enough to have retained supernova ejecta, both of which are indicative of a dark-matter-dominated dwarf galaxy (e.g., Willman & Strader, 2012).
We note that the conclusion that Pegasus IV is an ultra-faint dwarf galaxy could be further tested in the future through higher-resolution spectroscopic observations of its bright member stars. Such spectra would allow for measurements of the galaxy’s element and neutron-capture element abundances, both of which can independently offer further insight into the classification of this system (e.g, Ji et al., 2019). Alternately, deeper medium resolution spectra could provide iron abundances for a large sample of stars, allowing for a more robust measurement of the system’s metallicity dispersion.
5.2 Orbit
To determine Pegasus IV’s orbital properties, we integrated 500 realizations of its orbit using the gala Python package (Price-Whelan, 2017). For each realization, we determined Pegasus IV’s initial conditions by sampling from the error distributions of its observed position and kinematics (Table 1), which we approximated as Gaussian for all parameters. We then rewound Pegasus IV’s orbit back in time for 5 in the presence of gala’s default Milky Way model, which includes a spherical nucleus and bulge, a Miyamoto-Nagai disk (Miyamoto & Nagai, 1975), and a spherical Navarro-Frenk-White dark matter halo (NFW; Navarro et al. 1996).
At the conclusion of each integration, we recorded gala’s estimate for Pegasus IV’s apocenter (), pericenter (), eccentricity (), orbital angular momentum perpendicular to the Galactic disk (), and total energy (). From the median, 16th, and 84th percentile of the distributions for these quantities across the 500 realizations, we find:
-
•
-
•
-
•
-
•
.
In Figure 6, we depict the last of Pegasus IV’s orbit (in various projections) assuming the velocity, distance, and proper motions reported in Table 1 as initial conditions. Notably, the model predicted that Pegasus IV passed its apocenter within the last and experienced its last pericentric passage ago.
To contextualize Pegasus IV’s proximity to its orbital apocenter, we computed the ratio: following Fritz et al. (2018). This ratio quantifies a satellite’s proximity to its pericenter () or apocenter (). Assuming Pegasus IV’s distance to the Galactic center is and adopting the apocenter/pericenter distances given above, we found . This value for the ratio places Pegasus IV in a regime that is underpopulated compared to the predictions from simple orbital dynamics (for example, see Figure 5 of Li et al. 2021b). Our discovery of Pegasus IV in a previously-surveyed region of the sky may support the hypothesis that the dearth of known Milky Way satellite galaxies observed near their apocenters () is an observational selection effect (e.g., Simon, 2018; Fritz et al., 2018; Li et al., 2021b).

5.3 Association with Local Group Structures
A number of recently discovered ultra-faint dwarf galaxies have been proposed to be associated with the Large Magellanic Cloud (LMC; e.g., Koposov et al., 2015a; Drlica-Wagner et al., 2015; Patel et al., 2020; Erkal & Belokurov, 2020; Correa Magnus & Vasiliev, 2022). To assess whether Pegasus IV is a satellite of the LMC, we rewound the system in the combined presence of the LMC and Milky Way potential using the technique described in Erkal & Belokurov (2020). For the Milky Way potential, we used the potential fits of McMillan (2017). We note that we did not select the highest likelihood potential but instead sampled the Milky Way from the posterior chains of McMillan (2017) to account for uncertainties in the potential. We modeled the LMC as a Hernquist profile (Hernquist, 1990) with a mass of and a scale radius of kpc, motivated by the results of Erkal et al. (2019). In these simulations, we treated the LMC and Milky Way as particles sourcing their respective potentials and thus account for the reflex motion of the Milky Way in response to the LMC (e.g. Gómez et al., 2015). We modeled the dynamical friction of the Milky Way on the LMC using the approximations in Jethwa et al. (2016). For the LMC’s present-day proper motions, distance, and radial velocity we used values provided by Kallivayalil et al. (2013), Pietrzyński et al. (2019), and van der Marel et al. (2002), respectively.
In order to account for uncertainties, we Monte Carlo sampled the present-day observables of Pegasus IV, the Milky Way potential, and the LMC’s present-day observables 10,000 times and rewound the satellite for 5 Gyr.888This model produced estimates for Pegasus IV’s apocenter and pericenter that agreed with the results from the Milky-Way-potential-only integration (Section 5.2) to well within the quoted uncertainties reported in Table 1. We computed the energy of Pegasus IV relative to the LMC 5 Gyr ago (as in Erkal & Belokurov, 2020), and found that Pegasus IV has a 0.07% chance of having originally been energetically bound to the LMC, suggesting that it is not an LMC satellite. We also considered the approach of Patel et al. (2020) and determined the closest passage of Pegasus IV to the LMC and compared their relative speed to the escape speed of the LMC. With this approach, we found that Pegasus IV passes the LMC at kpc, with a relative speed of km/s. This is times the escape speed of the LMC, which also suggests that Pegasus IV is not an LMC satellite.
A substantial fraction of the known Milky Way satellite galaxies lie on a thin, co-rotating plane nearly perpendicular to the Milky Way’s stellar disk dubbed the Vast Polar Structure (VPOS; Pawlowski et al., 2012, 2015; Fritz et al., 2018; Li et al., 2021a). Adopting the same VPOS parameters as Li et al. (2021a), namely the assumed normal ( and angular tolerance , we found it unlikely that Pegasus IV is a VPOS member. The observed angle between the VPOS and the satellite’s orbital pole is and the probability that the orbital pole lies within of the VPOS normal is %. While this does not rule out the possibility that Pegasus IV is a VPOS member, the currently available phase space measurements do not favor this scenario.
Lastly, we considered whether Pegasus IV might be associated with debris from the Sagittarius dwarf spheroidal galaxy (Sgr) and its extended stellar stream. Considering the Sgr model and associated coordinate system from Law & Majewski (2010), we found that Pegasus IV is located at an angle of from the Sgr debris plane. We found a comparably large separation when considering the newer Sgr model from Vasiliev et al. (2021), who additionally incorporated the impact of the LMC when modelling Sgr’s debris stream. We therefore conclude that Pegasus IV is unlikely to be associated with Sgr.
5.4 Astrophysical J-factor/D-factor
The Milky Way dwarf spheroidal satellite galaxies are excellent targets for searches for dark matter annihilation or decay products due to their close proximity, astrophysical backgrounds, and large mass-to-light ratios (e.g., Ackermann et al., 2015). The astrophysical component of the dark matter flux from annihilation (decay) is known as the J-factor (D-factor) and depends on the squared (linear) dark matter density along the line of sight.
Our framework to calculate J-factors and D-factors follows Pace & Strigari (2019) and is similar to other previous analyses of dwarf spheroidal galaxies (e.g., Bonnivard et al., 2015; Geringer-Sameth et al., 2015). Briefly, we solved for the velocity dispersion in the spherical Jeans equations and compared it to the velocity dispersion from the spectroscopic members to determine the dark matter density profile. We assumed the dark-matter-dominated mass follows an NFW profile, while the stellar distribution follows a Plummer profile. We assumed that stellar anisotropy is constant with radius. We used the results derived in Section 3 for the distance, structural parameters (, ), and associated uncertainties, which were transformed into Gaussian priors. For more details, see Pace & Strigari (2019).
We applied this methodology to the same seven star (non-variable) member sample used for our dynamical analysis in Section 4.5. We calculated integrated J-factors of for solid angles of in logarithmic units of . The integrated D-factors are for solid angles of in logarithmic units of . The predicted J-factor is based on velocity dispersion, heliocentric distance, and half-light radius scaling relations and agrees with the full dynamical analysis (Pace & Strigari, 2019). This J-factor is not large compared to other ultra-faint dwarfs due primarily to the relatively large distance of Pegasus IV. We note that if Pegasus IV were located at its pericenter (), its J-factor would be comparable to the largest J-factors measured for other dwarf galaxies: .
5.5 Distance from Two RR Lyrae Variable Stars
RR-Lyrae-type variable stars (RRLs) are excellent tracers of old, metal-poor stellar populations in the Milky Way halo, and have been identified in nearly every ultra-faint dwarf galaxy (e.g., Greco et al., 2008; Boettcher et al., 2013; Medina et al., 2017; Joo et al., 2018; Martínez-Vázquez et al., 2019; Joo et al., 2019; Vivas et al., 2020; Martínez-Vázquez et al., 2021). According to the empirical relation derived by Martínez-Vázquez et al. (2019), ultra-faint dwarf galaxies with the same absolute magnitude as Pegasus IV () are expected to have between 2 and 4 RRLs.
As introduced in Section 2.3, we identified two RRLs in the Gaia and PS1 RRL catalogs within a two arcminute radius of Pegasus IV’s centroid at the time of discovery. The first of these stars (Gaia DR2/EDR3 SOURCE_ID: 1796887082536156928; Gaia mag) was labelled as an RRab star in both catalogs with a period of 0.7088 days (averaging between the individual catalogs, which agreed at the level of 0.0001 days). This star was identified as a spectroscopic member in Section 4.4 on the basis of its radial velocity. The second of these stars (Gaia DR2/EDR3 SOURCE_ID: 1796890209272433792; mag) was labelled as an RRc-type variable with period 0.31373 days (again averaging between Gaia and PS1, which agreed within 0.00001 days for this star); we do not have a spectrum for this star.
Under the assumption that these stars were bona fide RRL member stars of Pegasus IV, we estimated their absolute magnitudes using the empirical calibration given in Muraveva et al. (2018):
| (3) |
Assuming that the (unknown) RRL metallicities are sampled from the Pegasus IV metallicity distribution function (MDF), which we approximate as a Gaussian centered on dex with variance dex, we found that the expected absolute magnitude of the two stars is mag, where the uncertainties include contributions from both the sampled RRL metallicity and the errors associated with the coefficients in the Muraveva et al. (2018) relation. From this absolute magnitude, the resulting distance modulus for each of the RRLs was then derived from
| (4) |
where is the ratio of total-to-selective absorption for the Gaia filter, which we assumed to be (Wang & Chen, 2019). Taking mag for both stars (Table 1), we found: from the first RRL and for the second, neglecting the errors on and as they were subdominant to the error on . The average of these distance moduli is , in excellent agreement with the distance modulus derived from isochrone-fitting, (Section 3).
5.6 A Distant RRL Member?
The Gaia and PS1 RR Lyrae catalogs include an additional RRL located at (), corresponding to a 15.8’ separation from Pegasus IV’s centroid, or roughly ten half-light radii ( kpc). This star (Gaia DR2/EDR3 SOURCE_ID: 1796879729552126080; Gaia mag) was flagged in the PS1 catalog as an RRc with a period days. Its Gaia EDR3 proper motion ( is consistent with the systemic mean proper motion derived in Section 4.7: . The distance modulus of this star according to the Muraveva et al. (2018) relation is , lying between the distance moduli derived for the other two RRLs discussed in the previous section, and in equally good agreement with the distance modulus derived through isochrone fitting.
These properties suggest that this RRL may be related to Pegasus IV, despite its extreme angular separation. To quantify the possibility that this star is a field RR Lyrae, as opposed to a true Pegasus IV member, we integrated the RR Lyrae number density radial profile given in Medina et al. (2018) between galactocentric distances of 80 to 100 kpc. We found that only 0.0075 RR Lyrae stars are expected in a 0.25 region around Pegasus IV. Thus, it is very unlikely that this star is a field star, as opposed to a true Pegasus IV member.
RRLs with large angular separations have been observed in the vicinity of several ultra-faint dwarf galaxies (e.g, Vivas et al., 2020; Stringer et al., 2021), and have been proposed to be tidally-stripped members of these galaxies.999We also note that Chiti et al. (2021) discoverd and confirmed multiple member stars at extremely large separations from the Tucana II dwarf galaxy, highlighting that yet more member stars may be discoverable in the outskirts of Pegasus IV. To assess whether tidal stripping is needed to explain the position of this RRL relative to Pegasus IV, we calculated the system’s Jacobi radius following Equation 8.91 of Binney & Tremaine (2008). As explained by Binney & Tremaine (2008), the Jacobi radius approximately corresponds to the expected maximum observed extent of a satellite system in a circular orbit. Adopting the dynamical and structural properties from Table 1, and assuming the simple power-law Milky Way potential from Eadie & Harris (2016), we found that the Jacobi radius for Pegasus IV is kpc – larger than the projected separation of this RRL from the main body of Pegasus IV ( kpc). However, if we instead perform this calculation assuming that Pegasus IV is at its pericenter distance ( kpc), the Jacobi radius is found to be kpc, smaller than the observed projected separation. We note, though, that these Jacobi radii are significant underestimates, as they are calculated using the dynamical mass within in absence of a total mass estimate for Pegasus IV.
This latter Jacobi radius estimate admits the possibility that the distant RRL was tidally stripped from the main body of Pegasus IV at a previous pericentric passage, although the close clustering of the confirmed spectroscopic members somewhat disfavors this interpretation. Ultimately, it is difficult to confirm or dispute this star’s connection to Pegasus IV without a radial velocity measurement. Wider-area spectroscopic member samples may allow for searches for features suggestive of tidal disruption (e.g., velocity gradients), which would add credence to the tidal origin of this distant star if present. Improved distance estimation for each of the RRLs may also offer further insight into the consistency of this star with the majority of Pegasus IV’s members.
Lastly, we note also that there may be yet more RRL members of Pegasus IV, as the Gaia and PS1 RRL catalogs are incomplete at faint magnitudes (e.g., Mateu et al., 2020). Our team has recently obtained deeper Gemini North / GMOS imaging of Pegasus IV (GN-2021B-FT-111; PI: C. Martinez-Vazquez). We therefore defer a more extensive search for RRLs in the central region of Pegasus IV to a future study leveraging these data. These new data will also help disambiguate the nature of the second spectroscopically-observed horizontal branch star, which appeared to show some signs of variability in the sparsely sampled DELVE data.
6 Summary
We have presented the discovery of Pegasus IV, an ultra-faint dwarf galaxy found in a wide-area search of DELVE data. Through a maximum-likelihood fit to the system’s morphology and observed color–magnitude diagram, we found that Pegasus IV is an old, metal-poor stellar system with a half-light radius of and an absolute magnitude . With Magellan/IMACS medium-resolution spectra for a small sample of member stars, we resolved the internal kinematics of the system, finding a velocity dispersion of , implying a mass-to-light ratio for the system of . We used the CaT absorption lines in the same spectra to derive iron abundances for five stars, which suggested that Pegasus IV is very metal-poor () and exhibits a metallicity spread that further suggests its nature as a dwarf galaxy. We also measured Pegasus IV’s proper motion using data from Gaia EDR3, which, in conjunction with the system’s measured velocity of , suggested that Pegasus IV is on a retrograde orbit, and just passed its orbital apocenter. Lastly, we constrained the distance to Pegasus IV using a metallicity–absolute magnitude relation for two RR Lyrae stars found in the system, confirming that the system is located at a heliocentric distance of as determined through isochrone fitting.
Our discovery of Pegasus IV in data from DECam is consistent with the prediction that many ultra-faint Milky Way satellites remain to be discovered, not only in previously unsearched regions, but also in regions of sky previously covered by current-generation surveys. Survey efforts including DELVE-WIDE will likely continue to play an important role in this ongoing satellite census. Illustratively, Manwadkar & Kravtsov (2021) recently forecasted that DELVE-WIDE may discover ultra-faint dwarf galaxies with and across its nominal footprint (; ), assuming that DELVE will achieve comparable sensitivity to searches over third-year Dark Energy Survey data (DES Y3; Drlica-Wagner et al. 2020). Furthermore, the upcoming Vera C. Rubin Observatory Legacy Survey of Space and Time (Ivezić et al., 2019) is expected to discover hundreds of ultra-faint dwarf galaxies both around the Milky Way and beyond (e.g., Hargis et al., 2014; Mutlu-Pakdil et al., 2021; Trujillo et al., 2021; Manwadkar & Kravtsov, 2021). This growing sample of ultra-faint dwarf galaxies will undoubtedly provide new constraints on the properties of dark matter and will offer key insight into the process of galaxy formation on the smallest scales.
7 Acknowledgments
The DELVE project is partially supported by Fermilab LDRD project L2019-011 and the NASA Fermi Guest Investigator Program Cycle 9 No. 91201. WC gratefully acknowledges support from the University of Chicago Quad Undergraduate Research Scholars program and from the Carnegie Astrophysics Summer Student Internship (CASSI) program, during which training in spectroscopic data analysis was acquired. ABP acknowledges support from NSF grant AST-1813881. BMP is supported by an NSF Astronomy and Astrophysics Postdoctoral Fellowship under award AST-2001663. This research received support from the National Science Foundation (NSF) under grant no. NSF DGE-1656518 through the NSF Graduate Research Fellowship received by SM. R. R. M. gratefully acknowledges support by the ANID BASAL project FB210003. JAC-B acknowledges support from ANID FONDECYT Regular 1220083.
This project used data obtained with the Dark Energy Camera (DECam), which was constructed by the Dark Energy Survey (DES) collaboration. Funding for the DES Projects has been provided by the DOE and NSF (USA), MISE (Spain), STFC (UK), HEFCE (UK), NCSA (UIUC), KICP (U. Chicago), CCAPP (Ohio State), MIFPA (Texas A&M University), CNPQ, FAPERJ, FINEP (Brazil), MINECO (Spain), DFG (Germany), and the collaborating institutions in the Dark Energy Survey, which are Argonne Lab, UC Santa Cruz, University of Cambridge, CIEMAT-Madrid, University of Chicago, University College London, DES-Brazil Consortium, University of Edinburgh, ETH Zürich, Fermilab, University of Illinois, ICE (IEEC-CSIC), IFAE Barcelona, Lawrence Berkeley Lab, LMU München, and the associated Excellence Cluster Universe, University of Michigan, NSF’s National Optical-Infrared Astronomy Research Laboratory, University of Nottingham, Ohio State University, OzDES Membership Consortium University of Pennsylvania, University of Portsmouth, SLAC National Lab, Stanford University, University of Sussex, and Texas A&M University.
This work has made use of data from the European Space Agency (ESA) mission Gaia (https://www.cosmos.esa.int/gaia), processed by the Gaia Data Processing and Analysis Consortium (DPAC, https://www.cosmos.esa.int/web/gaia/dpac/consortium). Funding for the DPAC has been provided by national institutions, in particular the institutions participating in the Gaia Multilateral Agreement.
Based on observations at Cerro Tololo Inter-American Observatory, NSF’s National Optical-Infrared Astronomy Research Laboratory (2019A-0305; PI: Drlica-Wagner), which is operated by the Association of Universities for Research in Astronomy (AURA) under a cooperative agreement with the National Science Foundation.
This research has made use of NASA’s Astrophysics Data System Bibliographic Services.
This manuscript has been authored by Fermi Research Alliance, LLC, under contract No. DE-AC02-07CH11359 with the US Department of Energy, Office of Science, Office of High Energy Physics. The United States Government retains and the publisher, by accepting the article for publication, acknowledges that the United States Government retains a non-exclusive, paid-up, irrevocable, worldwide license to publish or reproduce the published form of this manuscript, or allow others to do so, for United States Government purposes.
Blanco, Gaia, Magellan-IMACS
References
- Abbott et al. (2018) Abbott, T. M. C., Abdalla, F. B., Allam, S., et al. 2018, ApJS, 239, 18
- Ackermann et al. (2014) Ackermann, M., Albert, A., Anderson, B., et al. 2014, Phys. Rev. D, 89, 042001. https://link.aps.org/doi/10.1103/PhysRevD.89.042001
- Ackermann et al. (2015) Ackermann, M., Albert, A., Anderson, B., et al. 2015, Phys. Rev. Lett., 115, 231301
- Albert et al. (2017) Albert, A., Anderson, B., Bechtol, K., et al. 2017, ApJ, 834, 110
- Bailin (2019) Bailin, J. 2019, ApJS, 245, 5
- Balbinot et al. (2013) Balbinot, E., Santiago, B. X., da Costa, L., et al. 2013, ApJ, 767, 101
- Battaglia & Starkenburg (2012) Battaglia, G., & Starkenburg, E. 2012, A&A, 539, A123
- Bechtol et al. (2015) Bechtol, K., Drlica-Wagner, A., Balbinot, E., et al. 2015, ApJ, 807, 50
- Belokurov et al. (2014) Belokurov, V., Irwin, M. J., Koposov, S. E., et al. 2014, MNRAS, 441, 2124
- Belokurov et al. (2007) Belokurov, V., Zucker, D. B., Evans, N. W., et al. 2007, ApJ, 654, 897
- Bertin (2006) Bertin, E. 2006, in Astronomical Society of the Pacific Conference Series, Vol. 351, Astronomical Data Analysis Software and Systems XV, ed. C. Gabriel, C. Arviset, D. Ponz, & S. Enrique, 112
- Bertin (2011) Bertin, E. 2011, in Astronomical Society of the Pacific Conference Series, Vol. 442, Astronomical Data Analysis Software and Systems XX, ed. I. N. Evans, A. Accomazzi, D. J. Mink, & A. H. Rots, San Francisco, CA, 435
- Bertin & Arnouts (1996) Bertin, E., & Arnouts, S. 1996, A&AS, 117, 393
- Binney & Tremaine (2008) Binney, J., & Tremaine, S. 2008, Galactic Dynamics: Second Edition
- Boettcher et al. (2013) Boettcher, E., Willman, B., Fadely, R., et al. 2013, AJ, 146, 94
- Bonnivard et al. (2015) Bonnivard, V., Combet, C., Maurin, D., & Walker, M. G. 2015, MNRAS, 446, 3002
- Bovill & Ricotti (2009) Bovill, M. S., & Ricotti, M. 2009, ApJ, 693, 1859
- Bressan et al. (2012) Bressan, A., Marigo, P., Girardi, L., et al. 2012, MNRAS, 427, 127
- Brown et al. (2014) Brown, T. M., Tumlinson, J., Geha, M., et al. 2014, ApJ, 796, 91
- Bullock & Boylan-Kolchin (2017) Bullock, J. S., & Boylan-Kolchin, M. 2017, ARA&A, 55, 343
- Bullock & Johnston (2005) Bullock, J. S., & Johnston, K. V. 2005, ApJ, 635, 931
- Burkert (1995) Burkert, A. 1995, ApJ, 447, L25
- Caldwell et al. (2017) Caldwell, N., Walker, M. G., Mateo, M., et al. 2017, ApJ, 839, 20
- Cantu et al. (2021) Cantu, S. A., Pace, A. B., Marshall, J., et al. 2021, ApJ, 916, 81
- Carlin et al. (2009) Carlin, J. L., Grillmair, C. J., Muñoz, R. R., Nidever, D. L., & Majewski, S. R. 2009, ApJ, 702, L9
- Carlin et al. (2017) Carlin, J. L., Sand, D. J., Muñoz, R. R., et al. 2017, AJ, 154, 267
- Carrera et al. (2013) Carrera, R., Pancino, E., Gallart, C., & del Pino, A. 2013, MNRAS, 434, 1681
- Cerny et al. (2021a) Cerny, W., Pace, A. B., Drlica-Wagner, A., et al. 2021a, ApJ, 910, 18
- Cerny et al. (2021b) —. 2021b, ApJ, 920, L44
- Chabrier (2001) Chabrier, G. 2001, ApJ, 554, 1274
- Chambers et al. (2016) Chambers, K. C., Magnier, E. A., Metcalfe, N., et al. 2016, arXiv e-prints, arXiv:1612.05560
- Chiti et al. (2021) Chiti, A., Frebel, A., Simon, J. D., et al. 2021, Nature Astronomy, 5, 392
- Clementini et al. (2019) Clementini, G., Ripepi, V., Molinaro, R., et al. 2019, A&A, 622, A60
- Collins et al. (2013) Collins, M. L. M., Chapman, S. C., Rich, R. M., et al. 2013, ApJ, 768, 172
- Conn et al. (2018) Conn, B. C., Jerjen, H., Kim, D., & Schirmer, M. 2018, ApJ, 852, 68
- Cooper et al. (2012) Cooper, M. C., Newman, J. A., Davis, M., Finkbeiner, D. P., & Gerke, B. F. 2012, spec2d: DEEP2 DEIMOS Spectral Pipeline, , , ascl:1203.003
- Correa Magnus & Vasiliev (2022) Correa Magnus, L., & Vasiliev, E. 2022, MNRAS, 511, 2610
- Crnojević et al. (2016) Crnojević, D., Sand, D. J., Zaritsky, D., et al. 2016, ApJ, 824, L14
- Dalgleish et al. (2020) Dalgleish, H., Kamann, S., Usher, C., et al. 2020, MNRAS, 492, 3859
- Desai et al. (2012) Desai, S., Armstrong, R., Mohr, J. J., et al. 2012, ApJ, 757, 83
- Dey et al. (2019) Dey, A., Schlegel, D. J., Lang, D., et al. 2019, AJ, 157, 168
- Dotter (2016) Dotter, A. 2016, ApJS, 222, 8
- Dressler et al. (2011) Dressler, A., Bigelow, B., Hare, T., et al. 2011, PASP, 123, 288
- Drlica-Wagner et al. (2015) Drlica-Wagner, A., Bechtol, K., Rykoff, E. S., et al. 2015, ApJ, 813, 109
- Drlica-Wagner et al. (2018) Drlica-Wagner, A., Sevilla-Noarbe, I., Rykoff, E. S., et al. 2018, ApJS, 235, 33
- Drlica-Wagner et al. (2020) Drlica-Wagner, A., Bechtol, K., Mau, S., et al. 2020, ApJ, 893, 47
- Drlica-Wagner et al. (2021) Drlica-Wagner, A., Carlin, J. L., Nidever, D. L., et al. 2021, ApJS, 256, 2
- Eadie & Harris (2016) Eadie, G. M., & Harris, W. E. 2016, ApJ, 829, 108
- Efron (1982) Efron, B. 1982, The Jackknife, the Bootstrap and other resampling plans
- Erkal & Belokurov (2020) Erkal, D., & Belokurov, V. A. 2020, MNRAS, 495, 2554
- Erkal et al. (2019) Erkal, D., Belokurov, V., Laporte, C. F. P., et al. 2019, MNRAS, 487, 2685
- Fadely et al. (2011) Fadely, R., Willman, B., Geha, M., et al. 2011, AJ, 142, 88
- Flaugher et al. (2015) Flaugher, B., Diehl, H. T., Honscheid, K., et al. 2015, AJ, 150, 150
- Foreman-Mackey et al. (2013) Foreman-Mackey, D., Hogg, D. W., Lang, D., & Goodman, J. 2013, PASP, 125, 306
- Frebel (2010) Frebel, A. 2010, Astronomische Nachrichten, 331, 474
- Frebel et al. (2014) Frebel, A., Simon, J. D., & Kirby, E. N. 2014, ApJ, 786, 74
- Fritz et al. (2018) Fritz, T. K., Battaglia, G., Pawlowski, M. S., et al. 2018, A&A, 619, A103
- Fritz et al. (2019) Fritz, T. K., Carrera, R., Battaglia, G., & Taibi, S. 2019, A&A, 623, A129
- Gaia Collaboration et al. (2018) Gaia Collaboration, Brown, A. G. A., Vallenari, A., et al. 2018, A&A, 616, A1
- Gaia Collaboration et al. (2021) —. 2021, A&A, 649, A1
- Gatto et al. (2021) Gatto, M., Ripepi, V., Bellazzini, M., et al. 2021, Research Notes of the American Astronomical Society, 5, 159
- Geringer-Sameth et al. (2015) Geringer-Sameth, A., Koushiappas, S. M., & Walker, M. 2015, ApJ, 801, 74
- Gómez et al. (2015) Gómez, F. A., Besla, G., Carpintero, D. D., et al. 2015, ApJ, 802, 128
- Górski et al. (2005) Górski, K. M., Hivon, E., Banday, A. J., et al. 2005, ApJ, 622, 759
- Greco et al. (2008) Greco, C., Dall’Ora, M., Clementini, G., et al. 2008, ApJ, 675, L73
- Hargis et al. (2014) Hargis, J. R., Willman, B., & Peter, A. H. G. 2014, ApJ, 795, L13
- Harris (1996) Harris, W. E. 1996, AJ, 112, 1487
- Hendricks et al. (2014) Hendricks, B., Koch, A., Walker, M., et al. 2014, A&A, 572, A82
- Hernquist (1990) Hernquist, L. 1990, ApJ, 356, 359
- Holl et al. (2018) Holl, B., Audard, M., Nienartowicz, K., et al. 2018, A&A, 618, A30
- Homma et al. (2016) Homma, D., Chiba, M., Okamoto, S., et al. 2016, ApJ, 832, 21
- Homma et al. (2018) —. 2018, PASJ, 70, S18
- Homma et al. (2019) Homma, D., Chiba, M., Komiyama, Y., et al. 2019, PASJ, 71, 94
- Ivezić et al. (2019) Ivezić, Ž., Kahn, S. M., Tyson, J. A., et al. 2019, ApJ, 873, 111
- Jenkins et al. (2021) Jenkins, S. A., Li, T. S., Pace, A. B., et al. 2021, ApJ, 920, 92
- Jethwa et al. (2016) Jethwa, P., Erkal, D., & Belokurov, V. 2016, MNRAS, 461, 2212
- Ji et al. (2019) Ji, A. P., Simon, J. D., Frebel, A., Venn, K. A., & Hansen, T. T. 2019, ApJ, 870, 83
- Joo et al. (2018) Joo, S.-J., Kyeong, J., Yang, S.-C., et al. 2018, ApJ, 861, 23
- Joo et al. (2019) —. 2019, ApJ, 875, 120
- Kallivayalil et al. (2013) Kallivayalil, N., van der Marel, R. P., Besla, G., Anderson, J., & Alcock, C. 2013, ApJ, 764, 161
- Kim & Jerjen (2015) Kim, D., & Jerjen, H. 2015, ApJ, 808, L39
- Kim et al. (2015a) Kim, D., Jerjen, H., Mackey, D., Da Costa, G. S., & Milone, A. P. 2015a, ApJ, 804, L44
- Kim et al. (2016a) —. 2016a, ApJ, 820, 119
- Kim et al. (2015b) Kim, D., Jerjen, H., Milone, A. P., Mackey, D., & Da Costa, G. S. 2015b, ApJ, 803, 63
- Kim et al. (2016b) Kim, D., Jerjen, H., Geha, M., et al. 2016b, ApJ, 833, 16
- Kirby et al. (2015) Kirby, E. N., Simon, J. D., & Cohen, J. G. 2015, ApJ, 810, 56
- Kirby et al. (2008) Kirby, E. N., Simon, J. D., Geha, M., Guhathakurta, P., & Frebel, A. 2008, ApJ, 685, L43
- Kleyna et al. (2005) Kleyna, J. T., Wilkinson, M. I., Evans, N. W., & Gilmore, G. 2005, ApJ, 630, L141
- Koposov et al. (2015a) Koposov, S. E., Belokurov, V., Torrealba, G., & Evans, N. W. 2015a, ApJ, 805, 130
- Koposov et al. (2015b) Koposov, S. E., Casey, A. R., Belokurov, V., et al. 2015b, ApJ, 811, 62
- Koposov et al. (2018) Koposov, S. E., Walker, M. G., Belokurov, V., et al. 2018, MNRAS, 479, 5343
- Laevens et al. (2015) Laevens, B. P. M., Martin, N. F., Ibata, R. A., et al. 2015, ApJ, 802, L18
- Law & Majewski (2010) Law, D. R., & Majewski, S. R. 2010, ApJ, 714, 229
- Li et al. (2021a) Li, H., Hammer, F., Babusiaux, C., et al. 2021a, ApJ, 916, 8
- Li et al. (2017) Li, T. S., Simon, J. D., Drlica-Wagner, A., et al. 2017, ApJ, 838, 8
- Li et al. (2018) Li, T. S., Simon, J. D., Pace, A. B., et al. 2018, ApJ, 857, 145
- Li et al. (2021b) Li, T. S., Ji, A. P., Pace, A. B., et al. 2021b, arXiv e-prints, arXiv:2110.06950
- Longeard et al. (2019) Longeard, N., Martin, N., Ibata, R. A., et al. 2019, MNRAS, 490, 1498
- Longeard et al. (2018) Longeard, N., Martin, N., Starkenburg, E., et al. 2018, MNRAS, 480, 2609
- Longeard et al. (2021) Longeard, N., Jablonka, P., Arentsen, A., et al. 2021, arXiv e-prints, arXiv:2107.10849
- Lovell et al. (2012) Lovell, M. R., Eke, V., Frenk, C. S., et al. 2012, MNRAS, 420, 2318
- Luque et al. (2017) Luque, E., Pieres, A., Santiago, B., et al. 2017, MNRAS, 468, 97
- Luque et al. (2018) Luque, E., Santiago, B., Pieres, A., et al. 2018, MNRAS, 478, 2006
- Manwadkar & Kravtsov (2021) Manwadkar, V., & Kravtsov, A. 2021, arXiv e-prints, arXiv:2112.04511
- Martin et al. (2008) Martin, N. F., de Jong, J. T. A., & Rix, H.-W. 2008, ApJ, 684, 1075
- Martin et al. (2015) Martin, N. F., Nidever, D. L., Besla, G., et al. 2015, ApJ, 804, L5
- Martin et al. (2016) Martin, N. F., Jungbluth, V., Nidever, D. L., et al. 2016, ApJ, 830, L10
- Martínez-Vázquez et al. (2019) Martínez-Vázquez, C. E., Vivas, A. K., Gurevich, M., et al. 2019, MNRAS, 490, 2183
- Martínez-Vázquez et al. (2021) Martínez-Vázquez, C. E., Cerny, W., Vivas, A. K., et al. 2021, AJ, 162, 253
- Massari & Helmi (2018) Massari, D., & Helmi, A. 2018, A&A, 620, A155
- Mateu et al. (2020) Mateu, C., Holl, B., De Ridder, J., & Rimoldini, L. 2020, MNRAS, 496, 3291
- Mau et al. (2019) Mau, S., Drlica-Wagner, A., Bechtol, K., et al. 2019, ApJ, 875, 154
- Mau et al. (2020) Mau, S., Cerny, W., Pace, A. B., et al. 2020, ApJ, 890, 136
- McConnachie (2012) McConnachie, A. W. 2012, AJ, 144, 4
- McMillan (2017) McMillan, P. J. 2017, MNRAS, 465, 76
- Medina et al. (2017) Medina, G. E., Muñoz, R. R., Vivas, A. K., et al. 2017, ApJ, 845, L10
- Medina et al. (2018) —. 2018, ApJ, 855, 43
- Miyamoto & Nagai (1975) Miyamoto, M., & Nagai, R. 1975, PASJ, 27, 533
- Morganson et al. (2018) Morganson, E., Gruendl, R. A., Menanteau, F., et al. 2018, PASP, 130, 074501
- Moskowitz & Walker (2020) Moskowitz, A. G., & Walker, M. G. 2020, ApJ, 892, 27
- Muñoz et al. (2006) Muñoz, R. R., Carlin, J. L., Frinchaboy, P. M., et al. 2006, ApJ, 650, L51
- Muñoz et al. (2018) Muñoz, R. R., Côté, P., Santana, F. A., et al. 2018, ApJ, 860, 66
- Muraveva et al. (2018) Muraveva, T., Delgado, H. E., Clementini, G., Sarro, L. M., & Garofalo, A. 2018, MNRAS, 481, 1195
- Mutlu-Pakdil et al. (2018) Mutlu-Pakdil, B., Sand, D. J., Carlin, J. L., et al. 2018, ApJ, 863, 25
- Mutlu-Pakdil et al. (2021) Mutlu-Pakdil, B., Sand, D. J., Crnojević, D., et al. 2021, ApJ, 918, 88
- Nadler et al. (2020) Nadler, E. O., Wechsler, R. H., Bechtol, K., et al. 2020, ApJ, 893, 48
- Nadler et al. (2021) Nadler, E. O., Drlica-Wagner, A., Bechtol, K., et al. 2021, Phys. Rev. Lett., 126, 091101
- Navarro et al. (1996) Navarro, J. F., Frenk, C. S., & White, S. D. M. 1996, ApJ, 462, 563
- Neilsen et al. (2015) Neilsen, E., Bernstein, G., Gruendl, R., & Kent, S. 2015, “Limiting magnitude, , , and image quality in DES Year 1”, Tech. Rep. FERMILAB-TM-2610-AE-CD, Fermi National Accelerator Laboratory
- Newman et al. (2013) Newman, J. A., Cooper, M. C., Davis, M., et al. 2013, ApJS, 208, 5
- Newton et al. (2018) Newton, O., Cautun, M., Jenkins, A., Frenk, C. S., & Helly, J. C. 2018, MNRAS, 479, 2853
- Oemler et al. (2017) Oemler, A., Clardy, K., Kelson, D., Walth, G., & Villanueva, E. 2017, COSMOS: Carnegie Observatories System for MultiObject Spectroscopy, , , ascl:1705.001
- Pace & Li (2019) Pace, A. B., & Li, T. S. 2019, ApJ, 875, 77
- Pace & Strigari (2019) Pace, A. B., & Strigari, L. E. 2019, MNRAS, 482, 3480
- Pace et al. (2020) Pace, A. B., Kaplinghat, M., Kirby, E., et al. 2020, MNRAS, 495, 3022
- Patel et al. (2020) Patel, E., Kallivayalil, N., Garavito-Camargo, N., et al. 2020, ApJ, 893, 121
- Pawlowski et al. (2015) Pawlowski, M. S., McGaugh, S. S., & Jerjen, H. 2015, MNRAS, 453, 1047
- Pawlowski et al. (2012) Pawlowski, M. S., Pflamm-Altenburg, J., & Kroupa, P. 2012, MNRAS, 423, 1109
- Pietrzyński et al. (2019) Pietrzyński, G., Graczyk, D., Gallenne, A., et al. 2019, Nature, 567, 200
- Plummer (1911) Plummer, H. C. 1911, MNRAS, 71, 460
- Price-Whelan (2017) Price-Whelan, A. M. 2017, The Journal of Open Source Software, 2, 388
- Robin et al. (2003) Robin, A. C., Reylé, C., Derrière, S., & Picaud, S. 2003, A&A, 409, 523
- Schlafly & Finkbeiner (2011) Schlafly, E. F., & Finkbeiner, D. P. 2011, ApJ, 737, 103
- Schlegel et al. (1998) Schlegel, D. J., Finkbeiner, D. P., & Davis, M. 1998, ApJ, 500, 525
- Schörck et al. (2009) Schörck, T., Christlieb, N., Cohen, J. G., et al. 2009, A&A, 507, 817
- Sesar et al. (2017) Sesar, B., Hernitschek, N., Mitrović, S., et al. 2017, AJ, 153, 204
- Simon (2018) Simon, J. D. 2018, The Astrophysical Journal, 863, 89. https://doi.org/10.3847/1538-4357/aacdfb
- Simon (2019) Simon, J. D. 2019, ARA&A, 57, 375
- Simon & Geha (2007) Simon, J. D., & Geha, M. 2007, ApJ, 670, 313
- Simon et al. (2015) Simon, J. D., Drlica-Wagner, A., Li, T. S., et al. 2015, ApJ, 808, 95
- Simon et al. (2017) Simon, J. D., Li, T. S., Drlica-Wagner, A., et al. 2017, ApJ, 838, 11
- Simon et al. (2020) Simon, J. D., Li, T. S., Erkal, D., et al. 2020, ApJ, 892, 137
- Sohn et al. (2007) Sohn, S. T., Majewski, S. R., Muñoz, R. R., et al. 2007, ApJ, 663, 960
- Strigari (2018) Strigari, L. E. 2018, Reports on Progress in Physics, 81, 056901
- Stringer et al. (2021) Stringer, K. M., Drlica-Wagner, A., Macri, L., et al. 2021, ApJ, 911, 109
- Tonry et al. (2018) Tonry, J. L., Denneau, L., Flewelling, H., et al. 2018, ApJ, 867, 105
- Torrealba et al. (2019a) Torrealba, G., Belokurov, V., & Koposov, S. E. 2019a, MNRAS, 484, 2181
- Torrealba et al. (2016) Torrealba, G., Koposov, S. E., Belokurov, V., et al. 2016, MNRAS, 463, 712
- Torrealba et al. (2018) Torrealba, G., Belokurov, V., Koposov, S. E., et al. 2018, MNRAS, 475, 5085
- Torrealba et al. (2019b) —. 2019b, MNRAS, 488, 2743
- Trujillo et al. (2021) Trujillo, I., D’Onofrio, M., Zaritsky, D., et al. 2021, A&A, 654, A40
- van der Marel et al. (2002) van der Marel, R. P., Alves, D. R., Hardy, E., & Suntzeff, N. B. 2002, AJ, 124, 2639
- Vasiliev et al. (2021) Vasiliev, E., Belokurov, V., & Erkal, D. 2021, MNRAS, 501, 2279
- Vivas et al. (2020) Vivas, A. K., Martínez-Vázquez, C., & Walker, A. R. 2020, ApJS, 247, 35
- Walker et al. (2006) Walker, M. G., Mateo, M., Olszewski, E. W., et al. 2006, AJ, 131, 2114
- Walsh et al. (2007) Walsh, S. M., Jerjen, H., & Willman, B. 2007, ApJ, 662, L83
- Wang et al. (2019) Wang, M. Y., de Boer, T., Pieres, A., et al. 2019, ApJ, 881, 118
- Wang & Chen (2019) Wang, S., & Chen, X. 2019, The Astrophysical Journal, 877, 116. https://doi.org/10.3847/1538-4357/ab1c61
- Weisz et al. (2016) Weisz, D. R., Koposov, S. E., Dolphin, A. E., et al. 2016, ApJ, 822, 32
- Wenger et al. (2000) Wenger, M., Ochsenbein, F., Egret, D., et al. 2000, A&AS, 143, 9
- Willman et al. (2011) Willman, B., Geha, M., Strader, J., et al. 2011, AJ, 142, 128
- Willman & Strader (2012) Willman, B., & Strader, J. 2012, The Astronomical Journal, 144, 76. https://doi.org/10.1088%2F0004-6256%2F144%2F3%2F76
- Willman et al. (2005) Willman, B., Blanton, M. R., West, A. A., et al. 2005, AJ, 129, 2692
- Wolf et al. (2010) Wolf, J., Martinez, G. D., Bullock, J. S., et al. 2010, MNRAS, 406, 1220
- York et al. (2000) York, D. G., Adelman, J., Anderson, John E., J., et al. 2000, AJ, 120, 1579
- Youakim et al. (2020) Youakim, K., Starkenburg, E., Martin, N. F., et al. 2020, MNRAS, 492, 4986
- Zoutendijk et al. (2021a) Zoutendijk, S. L., Brinchmann, J., Bouché, N. F., et al. 2021a, A&A, 651, A80
- Zoutendijk et al. (2021b) Zoutendijk, S. L., Júlio, M. P., Brinchmann, J., et al. 2021b, arXiv e-prints, arXiv:2112.09374
- Zucker et al. (2006) Zucker, D. B., Belokurov, V., Evans, N. W., et al. 2006, ApJ, 650, L41
Appendix A CaT Fits for Member Stars with Measured Metallicities
On the following page, we show our fits to the Calcium Triplet lines of the 5 stars for which we reported metallicities (top 5 rows of Table 2). In each panel, we specifically plot the normalized spectrum of each star in blue, the best-fit model in black, and include the residuals for these fits in orange. For some stars, rectangular features in the spectra (associated with chip gaps) and/or residual emission-like or absorption-like features (associated with imperfect sky line subtraction) are visible. We note that wavelength ranges with chip gaps were masked during the fitting process, and therefore exerted no influence on the resulting fits.
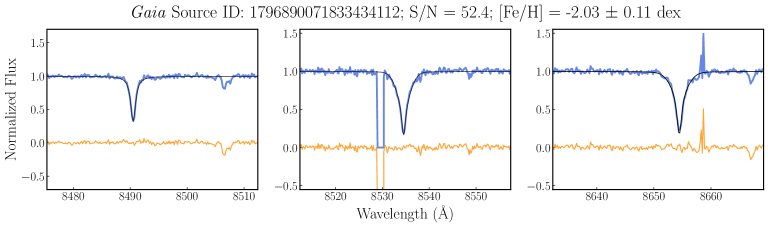
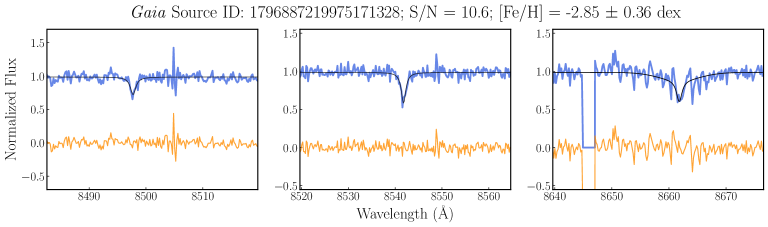
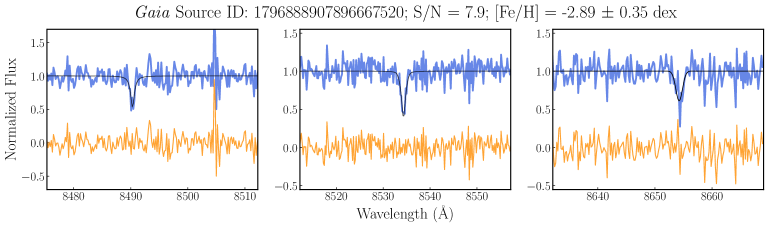
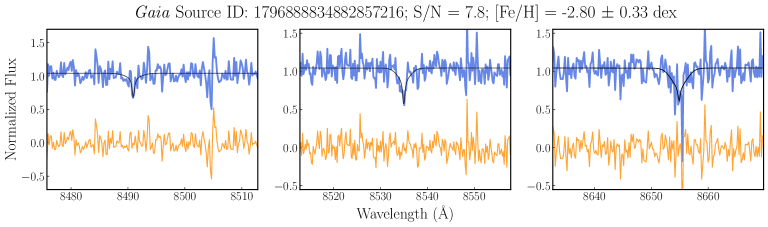
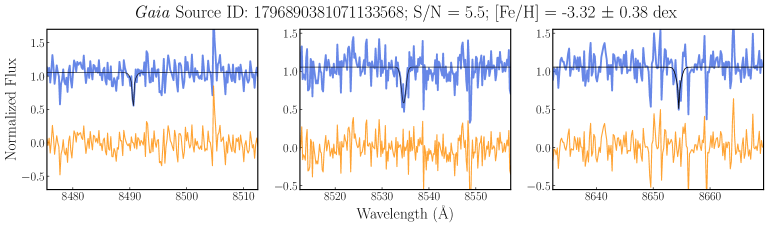
Appendix B References for Literature Data Presented in Figure 5
The left panel of Figure 5 shows the populations of “classical” Milky Way globular clusters, recently discovered halo star clusters, and dwarf galaxies in the - plane. The globular cluster measurements are taken from Harris (1996, 2010 edition). The faint star cluster measurements are taken from Fadely et al. (2011); Balbinot et al. (2013); Kim et al. (2015b, 2016a); Weisz et al. (2016); Martin et al. (2016); Luque et al. (2017); Muñoz et al. (2018); Luque et al. (2018); Conn et al. (2018); Longeard et al. (2019); Torrealba et al. (2019a); Mau et al. (2019); Homma et al. (2019); Mau et al. (2020); Gatto et al. (2021). We also include the DELVE 2 stellar system (Cerny et al., 2021a) in this category, although this system’s true classification remains unknown.
The dwarf galaxy measurements for the same panel are taken from McConnachie (2012); Koposov et al. (2015a); Martin et al. (2015); Kim & Jerjen (2015); Kim et al. (2016b); Crnojević et al. (2016); Torrealba et al. (2016); Carlin et al. (2017); Muñoz et al. (2018); Torrealba et al. (2018); Homma et al. (2018); Mutlu-Pakdil et al. (2018); Longeard et al. (2018); Torrealba et al. (2019b); Homma et al. (2019); Wang et al. (2019); Simon et al. (2020); Moskowitz & Walker (2020); Mau et al. (2020); Cantu et al. (2021); Cerny et al. (2021b).
The right panel of the same figure shows the plane, including only dynamically-confirmed Milky Way dwarf galaxies (solid blue triangles in the left panel). The metallicity measurements for these systems are taken from Carlin et al. (2009); Simon et al. (2015); Willman et al. (2011); Koposov et al. (2015b); Kirby et al. (2015); Torrealba et al. (2016); Kim et al. (2016b); Li et al. (2017); Caldwell et al. (2017); Li et al. (2018); Koposov et al. (2018); Torrealba et al. (2019b); Simon (2019); Simon et al. (2020); Pace et al. (2020); Chiti et al. (2021); Jenkins et al. (2021); Longeard et al. (2021).