Accretion Variability as a Guide to Stellar Mass Assembly
Abstract
Variable accretion in young stellar objects reveals itself photometrically and spectroscopically over a continuum of timescales and amplitudes. Most dramatic are the large outbursts (e.g., FU Ori, V1647 Ori, and EX Lup type events), but more frequent are the less coherent, smaller burst-like variations in accretion rate. Improving our understanding of time-variable accretion directly addresses the fundamental question of how stars gain their masses. We review variability phenomena, as characterized from observations across the wavelength spectrum, and how those observations probe underlying physical conditions. The diversity of observed lightcurves and spectra at optical and infrared wavelengths defies a simple classification of outbursts and bursts into well-defined categories. Mid-infrared and submillimeter wavelengths are sensitive to lower-temperature phenomena and more embedded, younger sources, and it is currently unclear if observed flux variations probe similar or distinct physics relative to the shorter wavelengths. We highlight unresolved issues and emphasize the value of spectroscopy, multiwavelength studies, and ultimately patience in using variable accretion to understand stellar mass assembly.
objoidxoindObject Index
1 INTRODUCTION
Young stellar objects (YSOs) vary both photometrically and spectroscopically on a range of timescales and amplitudes. While some variability patterns trace the rotation of the young active star or the effects of intervening dust, changes in overall luminosity are mainly due to changes in the rate of accretion from the disk to the star that are caused by temporal changes in the star-disk connection and in the flow of gas through the disk. It is not always easy to disentangle the signatures of variable accretion from those of other effects such as changing extinction, even with multiwavelength observations. Still, by attempting to probe variable accretion rates, observers are beginning to answer the fundamental question of how stars gain their masses.
Understanding how accretion rates vary is important in the protostellar phase, when the stellar mass is mostly built up, as well as in the pre-main sequence (T Tauri) phase, when accretion rates from the disk are relatively small but important to disk evolution and planet formation. Although accretion bursts occur with durations as short as hours, large but rare accretion outbursts that last for months to decades play an outsized role in stellar growth and disk evolution. There are also potentially long-lasting consequences for the disk chemistry and for the evolution of the stellar radius. While the more common accretion variability with moderate duration and amplitude may not significantly influence stellar mass assembly, its observability still provides a quantifiable window to the underlying physics of disk accretion. In this chapter, we review variable accretion, with an emphasis on outburst behavior but also including lower-amplitude phenomena that can be characterized as routine accretion variability. We focus on observational diagnostics that constrain disk accretion physics and the implications of these phenomena for stellar mass assembly over the first few Myr of stellar evolution.
Some of the questions currently at the forefront of research on stellar mass assembly are: What is the role of variable accretion in building stellar mass and determining the observed properties of protostars? Do all stars experience large-amplitude accretion outbursts as they form, or do these require special circumstances? What triggers large accretion events? What switches them off or temporarily stops them? How can variability be used to evaluate the instabilities that lead to bursts? How well are we measuring “accretion luminosity” from monochromatic observations? How does variability influence chemical or mineralogical processes that affect the formation of planets?
A wide range of variably accreting sources with diverse and sometimes unique properties has been discovered, particularly in the years since Protostars & Planets VI. At that time (Audard et al., 2014), there was emphasis on two major classes: The FU Ori stars as major outbursts that last for decades to centuries and may or may not recur, and the EX Lup stars as less energetic outbursts that last for months to about a year and are observed to recur. Ongoing research shows that the peak luminosity and subsequent evolution of the lightcurve vary significantly among members of each class. Additionally, many outbursting YSOs have peculiar properties and do not fit into these two classical categories, in terms of their lightcurves or spectroscopic properties.
Outburst types are classified from lightcurves and/or spectra, but not always consistently. Even stars that are broadly accepted to be FU Ori outbursts cover a wide range of luminosities, spanning two or more orders of magnitude. We discuss and evaluate the (f)utility of the widespread practice of assigning accretion bursts into a small number of seemingly non-distinct categories. This is a particularly important and timely exercise as the parameter space over which outbursts are detected is expanding, e.g., in time, in survey volume, and in wavelength.
We begin in § 2 by introducing the parameters we wish to constrain and what is learned from various diagnostics. In § 3, we discuss the ability to understand stellar mass assembly from analysis of protostar luminosities, concluding that we must look beyond them to distinguish among accretion models.
In § 4, we review what is known about photometric and spectroscopic variability and its impact on mass accretion. We discuss typical low-state accretion and stochastic events in pre-main sequence stars and protostars and review the literature for large outbursts. We close the section with a discussion of indirect signatures of outbursts.
In § 5, we focus on unresolved issues. We discuss theoretical notions as to what causes accretion variability and what ends outbursts, consider evidence for distinct characteristics of FU Ori type disks, and note that accurate outburst rate determination is challenging. We close the section with a discussion of best practices for follow-up classification. We summarize the review in § 6.
2 SETTING THE SCENE FOR STUDIES OF MASS ASSEMBLY
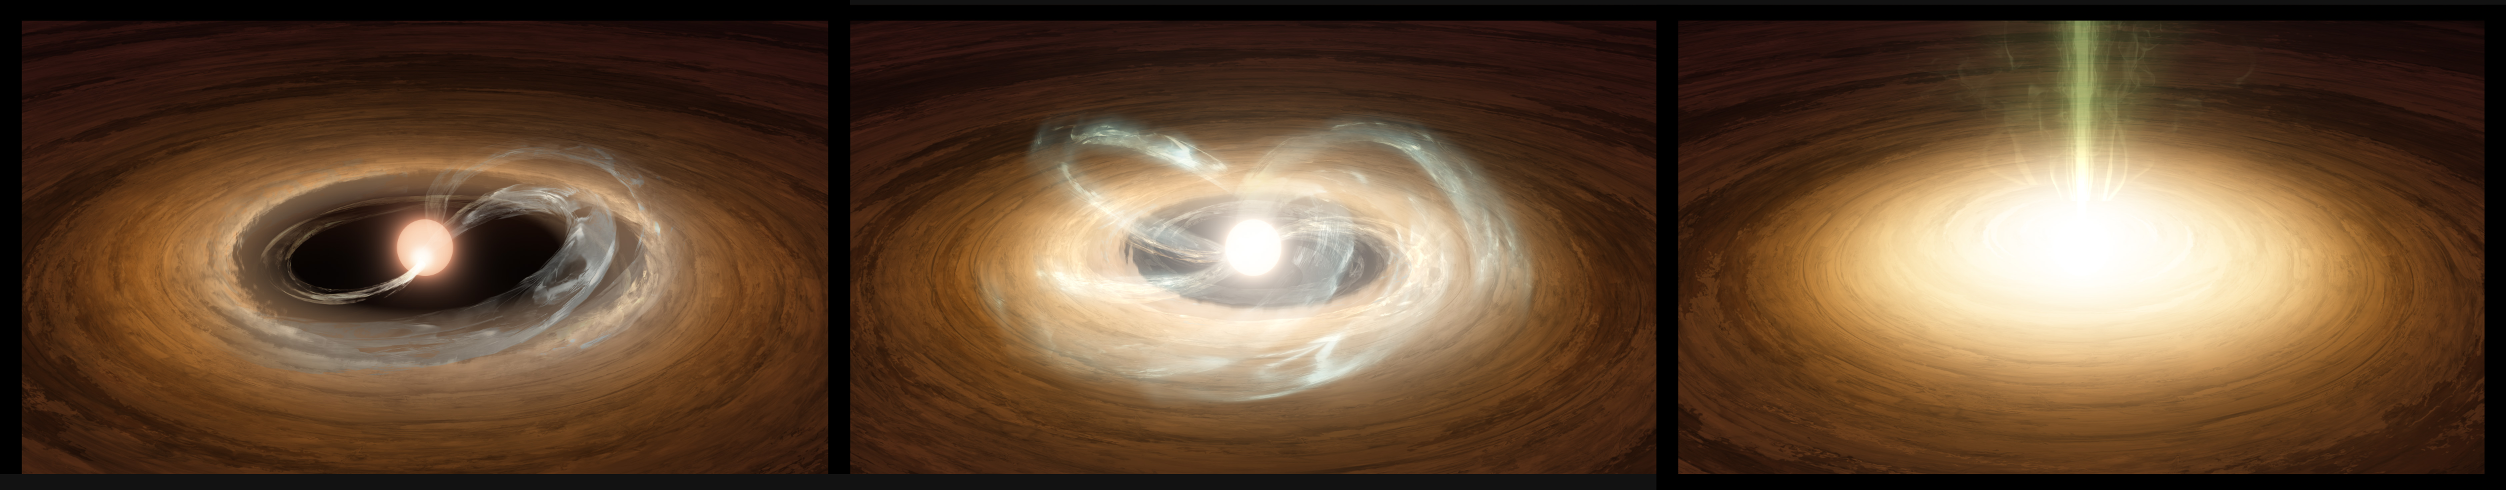
Stars acquire mass initially via the roughly spherical collapse of a fragmented molecular cloud core to form a protostar, and then through accretion via a disk that persists well into the optically visible pre-main sequence evolutionary phases of the central source. The accretion process at all stages is observed to be variable in time, as traced by time-series observations, on a wide range of timescales. The relative importance of these different accretion states in building up the central stellar mass, however, is currently poorly understood. To set the scene for this review, Figure 1 illustrates how an accreting disk transitions from routine magnetospheric accretion to outburst accretion and is accompanied by a rise in luminosity.
We begin with an overview of what we aim to constrain when observing accreting YSOs. Observational studies use complex techniques to extract as much information as possible from limited data sets, so we first establish what parameters are most important to measure. We then take a look at what is learned from various diagnostics, beginning with the stellar magnetosphere and moving outward to the circumstellar envelope.
2.1 Physical Parameters to Be Constrained
Given the fundamental stellar parameters of mass and radius and the evolution of the mass in time under the influence of disk accretion, , the resulting system luminosity , the sum of the photospheric and accretion luminosities, can be expressed as
| (1) |
assuming that all accretion energy is radiated away. Clearly, this quantity evolves in time. A central theme of our discussion is thus: “How do stars acquire the masses we believe they have, on timescales corresponding to the ages we believe they are, with the luminosities at which they are observed?” In order to address this question, we need to consider what variables actually matter, and then consider how we can constrain them and their evolution through observables.
From the equation above we have radiative parameters such as and , which relate to the observables. Although important in determining , the factor varies by only factors of several as a function of , as well as over time during the late protostellar and early pre-main sequence evolutionary phases. Furthermore, for protostars we are generally in a position of not having good estimates of , , or beyond reasonable assumptions. So although these variables do change on long timescales as a result of accretion, and in the case of also normal pre-main sequence contraction, they are not our focus here.
The disk property is key, with other disk parameters such as its mass and radius also of clear importance for understanding the mass reservoir that is available for accretion. There is no a priori reason to expect that the disk efficiently processes accreting material, either that falling in from an envelope (Kuffmeier et al., 2018), or that moving radially inward due to viscous accretion and other disk instabilities (Bai, 2011). The potential mismatch (as observed, for example, between envelope infall and disk accretion rates by Kóspál et al., 2017b) suggests that instabilities are to be expected. They could be regularly occurring and possibly periodic, or irregularly occurring as discrete episodic events (Armitage, 2015).
Finally, as we are interested in understanding the accumulation of stellar mass and the role of variable mass accretion history in that process, there is also of course time . As in many areas of astronomy, we can consider populations of young stellar objects to follow the distribution of accretion properties as a function of estimated population age. However, we also have the fortune of being able to observe variable accretion in action, with an increasing number of systems observed to undergo accretion rate changes. These span the range from detailed monitoring of the hour-to-day-to-week standard accretion processes (e.g., Sousa et al., 2016; Manara et al., 2021; Robinson and Espaillat, 2019), to large-scale time-domain surveys (Gaia; ASAS-SN; ZTF; ATLAS) that are capable of detecting outbursts in the act, and following their evolution from quiescence to outburst and back to low-state accretion again.
In order to understand the relevance to stellar mass assembly of the different accretion modes, we need to constrain parameters beyond instantaneous measurements of presumed steady-state or time-averaged accretion rates. Specifically, we also need to measure burst and outburst amplitudes, peak accretion rates, durations, and repeat cadences, but most importantly per event, for all events. To probe the physics operating within accretion disks we need detailed lightcurves that include rise shapes and decay shapes, as well as spectroscopic sampling at key phases. Spectra add further precision to our understanding of the outburst physics by quantifying disk temperature, which can be used to quasi-independently estimate . Long-wavelength and spatially resolved observations can also constrain the reservoir disk mass, radial size, and vertical thickness, as well as detailed spatial structure.
The recent observational literature on variable accretion can be described along four main avenues: characterization of typical variability types, timescales, and amplitudes as a function of observed wavelength; monitoring over years to decades of large samples of YSOs for statistical studies of outburst frequency; dedicated searches for recent burst and outburst candidates among the sea of variable YSOs (and other astronomical objects); and careful quantitative measurements of the properties of individual sources known to be in an outburst state. Such a mix of studies is necessary to further our understanding of accretion outburst physics.
2.2 Diagnostics of Accretion Heating and Cooling
Changes in the accretion rate may be measured through a variety of diagnostics. Direct diagnostics of accretion (see Chapter by Manara et al. in this volume) involve measurements of heated gas that is shocked as it decelerates and merges with the stellar photosphere. The primary diagnostics are the ultraviolet continuum and various emission lines throughout the ultraviolet and optical, which are measurable in low-extinction cases with favorable system geometry; proxy lines in the red optical and infrared are used for more embedded sources. In other cases, we are prevented from detecting the star directly and must rely on reprocessed emission that emerges at infrared or millimeter wavelengths. This section steps through the different physical components of an accreting protostar and how they are detected, to set the stage for how accretion variability is measured.
Magnetospheric accretion: For classical T Tauri stars, accreting gas is channeled by stellar magnetic fields from the disk onto the star. The accretion shock itself is mostly or entirely buried beneath the photosphere, with X-rays heating the nearby photosphere. The energy from the heated photosphere and the accretion funnel flow produces hydrogen recombination and continuum, along with line emission, both best measured at optical and ultraviolet wavelengths. Inner disk warps, often associated with the magnetospheric flow, may block the stellar light and/or radiation from the accretion flow. Accretion rates are measured through either modeling of continuum excess emission, requiring detailed knowledge of stellar parameters, accretion geometry, and temperature structure, or via proxy emission line diagnostics where extinction-corrected line fluxes are calibrated to the accretion shock models (see reviews by Hartmann et al. 2016 and Manara et al., in this volume). Changes in accretion can be tracked through changes in continuum brightness or in line fluxes.
The passively heated dust disk: The dust temperature in the disk declines from the dust sublimation temperature of K at small radii to K at large radii. For low-accretion disks, the heating is passive, with the reprocessing of starlight at the disk surface dominating over the energy liberated locally by the diffusion of material through the disk. The disk temperature is thus highest at the surface. The innermost dust is warmest and emits in the near and mid infrared. The outer disk is cold and dominates the long-wavelength emission.
The viscously heated gas disk: For rapidly accreting disks, viscous processes heat the disk to temperatures that can be higher than the star’s, over areas much larger than the star. The system luminosity thus becomes dominated by the accretion. If the accretion rate is high enough, the accretion flow in the innermost disk region may overwhelm the magnetic pressure and crush the magnetosphere, disrupting the magnetospheric flow. Viscously heated disks are most commonly measured at optical and infrared wavelengths, with shorter wavelengths tracing hotter disk material close to the star. Accretion rates are measured through models that make the simple assumption that luminosity correlates with accretion rate. Transitions from a typical low-state accretion disk to a high-state viscously heated disk are seen as large increases in brightness, typically detected at optical and infrared wavelengths. Changes in brightness can be directly converted to changes in accretion rate, once possible accompanying changes in extinction are taken into account.
Envelope emission: In the case of protostars, the bulk of the inner envelope mass is heated by the star, while the exterior is heated by the interstellar radiation field. Since the envelope does not extend as close to the star as the disk does, the envelope is cooler than the disk and emits at longer wavelengths, with a peak in the far IR. The large dust reservoir acts as a bolometer, and thus changes in the protostellar luminosity, e.g., due to accretion from the disk onto the star, vary the degree of dust heating and hence the wavelength response of the re-emission. Accretion rates are measured through radiative transfer modeling of spectral energy distributions. Changes in protostellar accretion rates may thus be detected via changes in long-wavelength emission from the envelope.
3 STELLAR MASS ASSEMBLY AS PROBED BY LUMINOSITIES
In this section, we review what is known about the luminosities of protostars and pre-main sequence stars and how to interpret them. We use the term “protostar” to refer to YSOs (including the central protostellar object and a disk, if already formed) that are still embedded in envelopes with significant envelope infall and accretion rates (the so-called Class 0 and Class I objects), whereas we use the term “pre-main sequence star” to refer to YSOs (and associated disks) that are beyond the embedded phase of evolution, with at most only residual envelopes remaining (the so-called Class II and Class III objects).
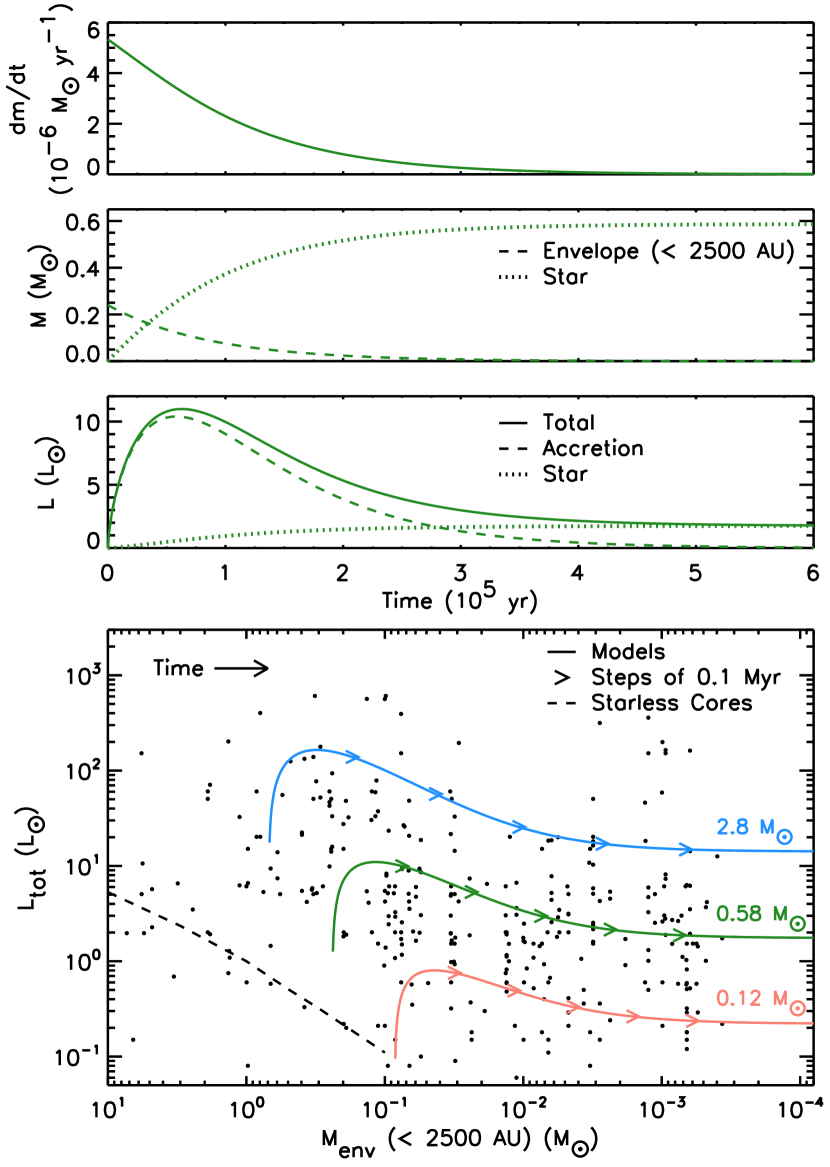
Figure 2 shows the connection between accretion and luminosity during the protostellar stage of evolution, using observations and analytic models from Fischer et al. (2017). For the envelope infall rate illustrated in the first panel, the second panel shows how the mass of the envelope within 2500 au of the star decreases and the mass of the star increases over time. The third panel shows how, for this model, the accretion luminosity peaks early and falls off with time (Equation 1 above), while the stellar luminosity slowly increases as the star gains mass. The figure is meant only as illustrative of the connections between masses, mass accretion rates, and luminosities.
In an analysis of protostars identified in the Taurus-Auriga region, Kenyon et al. (1990) found that protostars are underluminous, in a statistical sense, compared to expectations based on simple accretion arguments (see also Kenyon et al., 1994; Kenyon and Hartmann, 1995). The popular phrase “luminosity problem” originally referred to this discrepancy. The articulation of the issue was that for an assumed star formation time of 105 yr, an average accretion rate of yr-1 is required to form a 1 star. Adopting as the mean mass of a 1 star over its formation, assuming a constant accretion rate, and further adopting and yr-1, Equation 1 gives , where the inequality acknowledges that including photospheric luminosity would only increase this value. However, Kenyon et al. (1990) found the observed luminosities of protostars in Taurus-Auriga to be typically around 1 and thus underluminous compared to expectations. Two of the possible resolutions proposed by Kenyon et al. include longer star formation times and episodic accretion, where long periods of slow accretion are punctuated by short bursts of rapid accretion. For the latter solution, averaged over their lifetimes protostars would still feature the requisite high mean accretion rates but would typically be observed during their low-accretion states.
Revised measurements of protostellar lifetimes are indeed longer than the 105 yr assumed by Kenyon et al. Results from Spitzer Space Telescope mid-infrared surveys of nearby star-forming regions give protostellar lifetimes of 0.5 Myr (Evans et al., 2009; Dunham et al., 2014, 2015), 5 longer. Although there remains some debate on the validity of these longer ages (see, e.g., Kristensen and Dunham, 2018), if the 0.5 Myr lifteimes for envelopes are correct, they reduce the required accretion rates by the same factor, thus reducing the predicted protostellar luminosities to .
These surveys and others have consistently shown mean luminosities of samples of protostars to be a few (with medians of about 1 ); extinction corrections tend to increase the luminosities. Thus the original discrepancy between predicted and observed luminosities of a factor of 50 or more is now reduced to a factor of 2 to 10, within the uncertainties from both observations and assumptions. Based on this reduction, Offner and McKee (2011) claimed that the original luminosity problem has been resolved.
We now consider episodic accretion, the second resolution proposed by Kenyon et al. The models with constant accretion rates that motivated the identification of the luminosity problem cannot reproduce the observed distribution of protostellar luminosities, but a variety of other accretion scenarios have been shown to be plausible. Reviewing the state of these attempts for Protostars & Planets VI, Dunham et al. (2014) showed that accretion scenarios that spend much of their time at relatively low accretion rates, and less time at relatively high accretion rates, provide good matches to the observed luminosity distributions. These scenarios include models with accretion rates that generally decline with time, increase with instantaneous and/or final protostellar mass, and/or are dominated by large-amplitude stochastic fluctuations; i.e., episodic accretion (e.g., Myers, 2009, 2010; Offner and McKee, 2011; Dunham and Vorobyov, 2012).
Since Protostars & Planets VI, there has been relatively little work that explicitly addresses this topic. The finding that a broad range of time-dependent accretion rates, not necessarily episodic in nature, can match observed protostellar luminosities was further reinforced by Fischer et al. (2017). They found that protostellar luminosities in Orion span a similarly large range of values at each evolutionary stage, but with median values that decline from 2.3 for Class 0 protostars to 0.87 for Class I protostars. They showed that this decline in luminosity coupled with a large spread can be explained by envelope masses and accretion rates that decline exponentially with time to form a range of stellar masses (Figure 2). This result that episodic accretion is not necessarily required matches those from the theoretical studies cited in the previous paragraph, except now with a large sample of protostars at each evolutionary stage and a more complete comparison with model luminosities that removes some of the uncertainty over the validity of earlier results.
Protostellar luminosities and their dependence on evolutionary state are now well characterized but do not, by themselves, definitively distinguish among different accretion scenarios. Accretion scenarios with short-term, large-amplitude stochastic variability (possibly including episodic bursts), scenarios with long-term, small-amplitude secular variability, or scenarios with a combination of both have all been shown to provide viable matches to the observed luminosities of protostars.
The finding that alternative time-dependent accretion models match observed luminosity distributions should not be taken as evidence that episodic accretion does not happen at all, or even that stellar growth is dominated by smooth accretion rather than large outbursts. Indeed, there is substantial empirical evidence for accretion variability, as will be discussed in this chapter. Instead, they show that episodic accretion is not specifically required to explain the observed luminosities of protostars, as there are alternative accretion scenarios that are equally effective at matching the observed luminosities of protostars.
To match observations, these families of models typically require protostellar mass distributions that differ from standard initial mass functions (McKee and Offner, 2010). For example, it can be inferred from Figure 2 that Fischer et al. (2017) form stars with masses skewed to larger values than a typical IMF predicts. They suggest that this may be due to one or more of episodic accretion, poorly known ratios, or incompleteness to low masses at the distance to Orion. To distinguish among models that give good matches to luminosity distributions, it will be necessary to measure protostellar masses by fitting molecular line data from protoplanetary disks (e.g., Okoda et al., 2018; Tobin et al., 2020).
Improvements in sensitivity and sample size alongside more detailed modeling over the last three decades have mostly resolved the initial concern that the mean predicted and observed protostellar luminosities differ by large factors. Despite this apparent resolution of the original luminosity problem, there is still discussion in the current literature of a luminosity problem, but with a notably different meaning. The phrase now generally refers to the fact that, instead of simply being too low on average, protostellar luminosities span an enormous range that encompasses 3–4 orders of magnitude at both young (Class 0) and older (Class I) evolutionary stages. Further, there is a large population of very low luminosity objects with . These details are challenging to explain with simple accretion scenarios that feature constant accretion rates (e.g., Enoch et al., 2009; Kryukova et al., 2012; Fischer et al., 2017), and the viability of various accretion scenarios proposed as resolutions remains uncertain.
We suggest that the field distinguish between the historical “protostellar luminosity problem” of predicted luminosities being too high and the current “protostellar luminosity spread.” This suggestion is motivated by the following considerations:
-
1.
Using the same phrase for two distinct issues has the potential to cause confusion in the literature;
-
2.
Updated measurements of protostellar luminosities and lifetimes have reduced the magnitude of the originally noted conflict between observations and expectations;
-
3.
Several models have been developed that provide good matches to the observed luminosity spreads;
-
4.
The problem now is to distinguish among these models. Which are correct, if any?
Luminosities alone do not seem to provide enough diagnostic power to distinguish among these models. Further progress depends on testing the existing theories with measurements of other system properties, including protostellar masses, protostellar radii, and the accretion rates of more deeply embedded sources, to evaluate mass transport versus time.
4 OBSERVATIONS OF DISK ACCRETION
This section, the heart of the review, discusses what we know about variable accretion. We synthesize variability studies during typical accretion and during bursts in pre-main sequence stars and in protostars. We close by discussing indirect tracers of variable accretion.
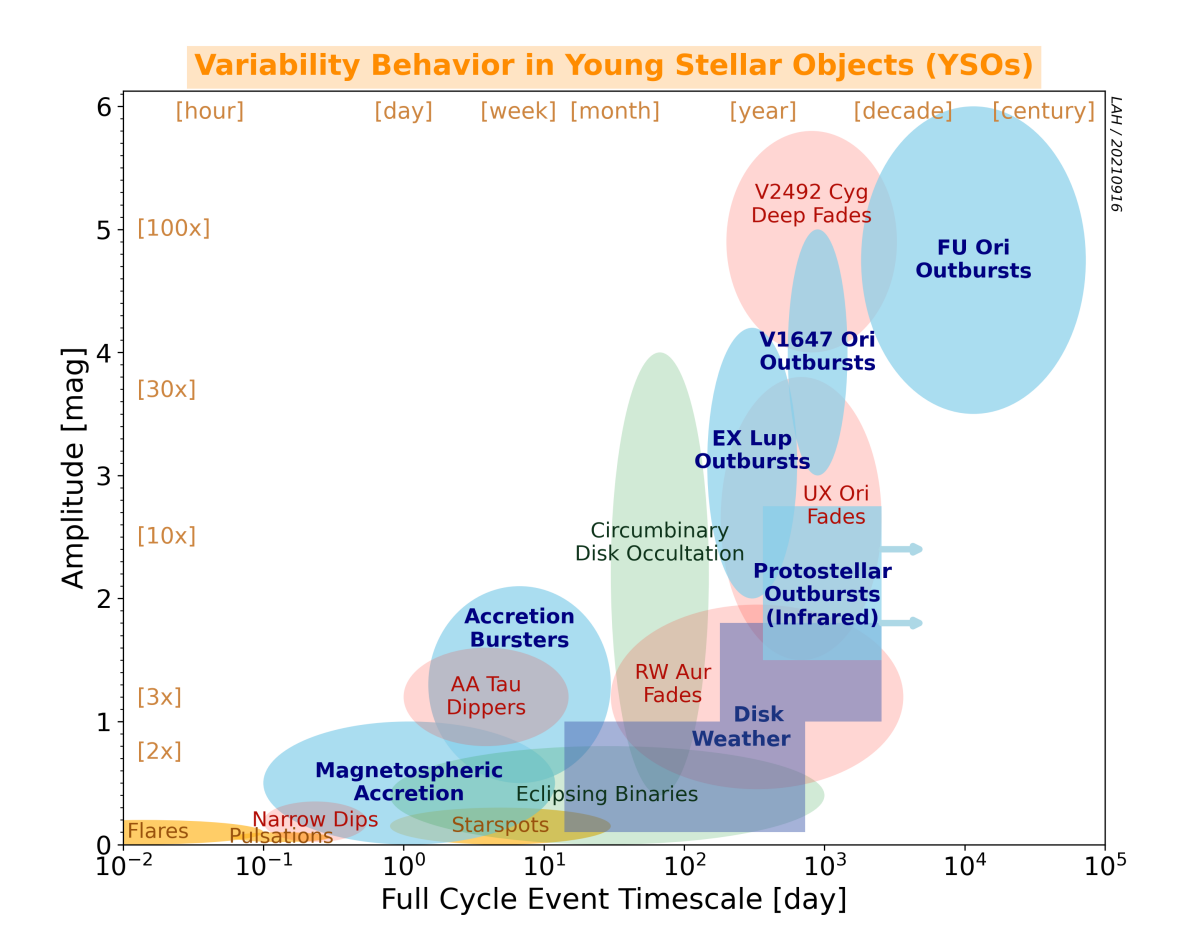
Table 1 provides an overview of the nomenclature used in this review. Entries above the horizontal line refer to conceptual categories of variability. Entries below the line refer to observed phenomena that correlate to varying degrees with the conceptual categories. Figure 3 plots amplitude versus timescale for various kinds of accretion-related variability as well as other types of variability for context.
| Term | Explanation |
|---|---|
| Routine Variability | Changes typically 1–2 mag (factors of several) often accompanied by changes in emission line morphology and strength. In optical/near-IR, typical timescales are hours to days, similar to dynamical/rotational timescales of the star, magnetosphere, and very inner disk. Behavior may be quasi-periodic or stochastic and includes short-duration accretion flares and extinction dips. In mid-IR/sub-mm, variations over days to years are consistent with inner-disk viscous timescales. Examples: most Class II classical T Tauri and Herbig Ae/Be stars, as well as Class I YSOs. |
| Burst | Distinct, discrete brightness increase, typically 1–2.5 mag (factors of few to ten), with sustained but modest duration 1 week to typically 1 year. Examples: DO Tau, EX Lup (2011). |
| Outburst | Large brightness increase, typically 2.5–6 mag (factors of tens), taking months to years to develop, with a duration of many years to decades. Examples: EX Lup (2008), V1647 Ori, FU Ori. |
| EX Lup event | Sometimes called EXors, these bursts have amplitudes of several mag, last for several months, and may recur after a few years. Spectra resemble T Tauri stars with atypically high accretion. |
| V1647 Ori event | These have amplitudes and durations as well as spectral characteristics intermediate between those of EX Lup bursts and FU Ori outbursts. |
| FU Ori event | Sometimes called FUors, these are outbursts with sustained increases in bolometric luminosity. Flux from the disk greatly exceeds flux from the star at optical wavelengths. They have long decay timescales similar to human lifetimes. A viscously heated disk dominates the spectrum, and the effective temperature associated with the spectrum decreases with increasing wavelength. |
| FUor candidate | Has an observed apparent outburst, but lacks spectroscopic confirmation of FU Ori status. Some FUor candidates wind up being extinction clearing rather than accretion outbursts. |
| FUor-like | A source with a spectrum having the characteristic wavelength-dependent absorption features of FU Ori stars, but no actual outburst was observed. |
4.1 Variable Accretion at Late and Early Times
Most stellar growth occurs when the protostar is still deeply embedded in its envelope. As gas in the disk flows to the star, the disk is quickly replenished by accretion from the envelope onto the disk. However, the stages in the stellar growth that are most readily visible occur after the young star has shed its envelope and has reached nearly final mass. Measured accretion rates and disk survival timescales are consistent with 1–10% of the final stellar mass accreted during this last stage of stellar assembly (see analyses by, e.g., Rosotti et al. 2017, Mulders et al. 2017, and Manara et al. 2019). Disk masses are typically less than 1% of the stellar mass, though highly uncertain, and the disk can no longer access a larger reservoir of gas.
In this section, we begin by describing commonly observed changes in accretion at this very last stage of stellar growth. This variability is readily detected on timescales that are easy to probe and at visible wavelengths, where accretion is most directly measured. We then discuss the bursts and outbursts, events most commonly observed at or near the end stages of the main stellar accretion phase. The largest outbursts, potentially for some YSOs the last major event in stellar growth and disk draining, occur rarely and may persist for longer than a century. These descriptions establish the classes and physics of accretion variability (see also Table 1 and Figure 3), which we extend to observations of younger sources where possible. We close with a consideration of the more challenging problem of measuring accretion variability during the main stage of stellar assembly, when dusty protostellar envelopes prevent the UV/optical studies that have enabled so much progress at later stages.
4.1.1 Typical Low-State Routine Variability during Pre-Main Sequence Evolutionary Phases


In the historical framework for interpreting typical variability behavior of accreting systems, established by, e.g., Herbst et al. (1994), the extinction, accretion, and star spot coverage can all vary with time. Spots are periodically modulated by the stellar rotation, extinction often occurs in sharp drops that can be either short-lived or have a long duration, and accretion variability can be seen in sharp bursts that last hours to days, or as smooth changes on roughly weeklong to much longer timescales. Physical interpretations that attempt to characterize these phenomena from photometry alone are often degenerate.
In the past decade, space-based optical observatories (CoRoT, MOST, K2, and TESS) have produced precise lightcurves from rapid (sub-hour) cadence monitoring extending over months, revealing new variability types and refining existing empirical variability classes. The highly structured lightcurves allow us to distinguish between accretion, spots, and extinction as the source of variability, and to infer accretion, star, and disk properties from the shape of those changes.
Variability in the magnetospheric accretion process is mostly driven by how much mass is loaded from the disk onto the accretion flow, apparently a stochastic process. Discrete accretion bursts occur frequently, with amplitudes ranging from 10–700% and durations of 1–10 days, repeated once every few to tens of days (Stauffer et al. 2014; Cody et al. 2017, see also Figure 4). In some cases, short bursts are seen on top of smooth changes over months. The brightness changes in these bursts are the consequence of stochastic instabilities in the star-disk connection (Stauffer et al., 2016). For close binaries, accretion pulses are triggered by interactions between the stars and their disks (Tofflemire et al., 2017), as expected from models (e.g., Muñoz and Lai, 2016).
Changes in accretion rate tend to be dominated by short-timescale bursts coupled with rotational modulation. Sergison et al. (2020) found in -band imaging that while most variability power is on the day timescale, consistent with the space-based lightcurves, some power is also found on yr timescales. Venuti et al. (2015) found similar results with - and -band monitoring of NGC 2264 over 7 years, with most power on short timescales. Likewise, Rigon et al. (2017) find that most accretors are dominated by low-level ( mag) variations on short timescales of days to weeks, consistent with rotational modulation; longer timescale excursions are typically larger and rare.
Spectroscopic monitoring campaigns typically show levels and timescales of variability similar to the photometry (e.g., Mendigutía et al. 2013; Costigan et al. 2014; Pouilly et al. 2021). Time-domain optical and ultraviolet spectroscopy, as well as X-ray lightcurves, are powerful for measuring the physical conditions and dynamics of the accretion flows (e.g., Alencar et al., 2012; Espaillat et al., 2021; Campbell-White et al., 2021; Sousa et al., 2021). They thereby help us in interpreting accretion rate variations inferred from multi-band photometric variability (e.g., Venuti et al., 2021; Zsidi et al., 2022). Evidence of correlation between optical photometric fluctuations and X-ray behavior related to accretion was provided by Guarcello et al. (2019).
Spectroscopic monitoring with polarimetry has revealed that magnetic accretion structures for fully convective low-mass stars are dipole-like (e.g., Alencar et al., 2012), though complicated by higher-order fields (Gregory and Donati, 2011). By combining K2 photometry with and H monitoring of the Lagoon Nebula, Venuti et al. (2021) found that the variability properties of low-mass stars are consistent with such dipole-like structures, while earlier-type stars have complex, higher-order fields that yield a smoother distribution of starspots. Models of lightcurves similarly indicate that dipole accretion structures tend to exhibit more flares or stochastic bursts that last for hours (Robinson et al., 2021). The interpretation of short-timescale variability signatures is generally consistent with the 3D MHD simulations (Romanova et al., 2012; Blinova et al., 2016), which predict stable and unstable regimes depending on the accretion rate and the strength and morphology of the magnetic field. Simulations of accretion onto stars with weak magnetic fields may also produce variability (Takasao et al., 2019).
While the accretion measurements diagnose where the flow hits the star, when viewed at a nearly edge-on inclination () the connection between the funnel flow and the disk can be identified through brief dips in lightcurves. Stars that exhibit these are called dippers (or AA Tau-like stars). The funnel flow warps the base of the disk, and dust in this warp obscures the star as it rotates into our line of sight (Bouvier et al., 2007). These quasi-periodic dips are detected in % of lightcurves, last for hours to days, and are associated with changes in line-of-sight optical extinction of mag (Cody and Hillenbrand, 2010; Stauffer et al., 2015; Roggero et al., 2021). Dippers are also identified in near-infrared (Rice et al., 2015) and mid-infrared (Morales-Calderón et al., 2011) lightcurves. Simple models of the wavelength-dependent photometric effects include dusty dipolar accretion flows (McGinnis et al., 2015; Kesseli et al., 2016).
For some stars, these extinction events are deep and do not repeat on a particular timescale, indicating the presence of large, unstable disk warps that quickly form and then disperse (e.g., Rodriguez et al., 2017; Guo et al., 2018). Some dippers have outer disks that are resolved with ALMA to have low inclinations, pointing to a misalignment between inner and outer disks (Ansdell et al., 2016; Loomis et al., 2017; Davies, 2019). Longer-term extinction events, or fades, are traditionally called RW Aur type systems, or UX Ori stars for objects that experience a blueing effect in their deep fades. These fades can persist for a decade or longer, with PV Cep a well-known example, and AA Tau a recent example. These extinction events may be caused by the rotational modulation of a warp at a large distance from the star (Bouvier et al., 2013) or by an increase in the geometrical height of the inner disk (Covey et al. 2021; see also changes in mid-IR emission due to changing disk height in Espaillat et al. 2011 and dynamics modeled by Flaherty et al. 2016). Dusty winds have also been suggested as a possible explanation for this behavior (Petrov et al., 2015).
The descriptions of these variable phenomena have been developed primarily from optical monitoring. Recent infrared monitoring studies (e.g., Rice et al., 2015; Rebull et al., 2015; Wolk et al., 2015, 2018) confirmed that the short-timescale phenomena seen in optical lightcurves also manifest in the near- and mid-infrared, with clear bursters and dippers. Variability amplitudes were demonstrated to be larger for more embedded (protostellar) sources. In addition, optical, near-infrared, and mid-infrared variability are not uniform. Many objects show completely uncorrelated variability, including both high activity in the optical but low in the mid-infrared, or the inverse of high mid-infrared variability but only small changes in the optical (Morales-Calderón et al., 2011; Cody et al., 2014). Dippers usually become redder in the dip, but in some cases there is bluer-when-fainter behavior, perhaps a consequence of a change in inner disk structure and scattering (McGinnis et al., 2015). The implications for the physics of variable accretion are unclear at present, but some optical variability appears to be exclusive to the hot accretion zone, while mid-infrared variability is exclusive to the disk and in many cases seems not to either influence or reflect the hot processes occurring closer to the star.
4.1.2 Discrete Accretion Bursts and Outbursts
Beyond the standard routine accretion variability observed for most YSOs, described above, distinct brightening events in young stars come in a range of amplitudes, durations, and propensities to repeat. Figure 3 plots amplitudes versus timescales, illustrating the significant increase in burst brightness (corresponding to increase in accretion rate) from EX Lup to V1647 Ori to FU Ori type outbursts; see also Table 1. The observed diversity, however, defies classification into a small number of well-defined categories and may better reflect a continuum of empirical measurements. That said, there is a historical framework of classification that we use to frame our discussion. In what follows, we describe the lightcurves and spectra that typify each of these historical categories.
EX Lup bursts and outbursts: Several decades ago, when the outburst phenomenon was first appreciated, objects with moderately large, 2.5–5 mag optical outbursts that last for a few months to a few years, and repeat, were identified. After the prototype EX Lupi (and to rhyme with “FUor”), these objects were named EXors (Herbig, 1989).
The lightcurves show significant variety. EX Lup, for instance, while typically bursting at 1–3 mag, has displayed two more major 5 mag outbursts, in 1955–56 and in 2008 (Ábrahám et al., 2009, 2019). VY Tau, on the other hand, showed repeated 3–5 mag outbursts for several decades until 1972, stayed in quiescence for 40 years, then resumed activity with 1.5 mag bursts in 2012–2013 (Herbig, 1990; Dodin et al., 2016), and has been quiet since. Due to their extended durations and lengthy dormant periods, the duty cycle of EX Lup outbursts is not yet established.
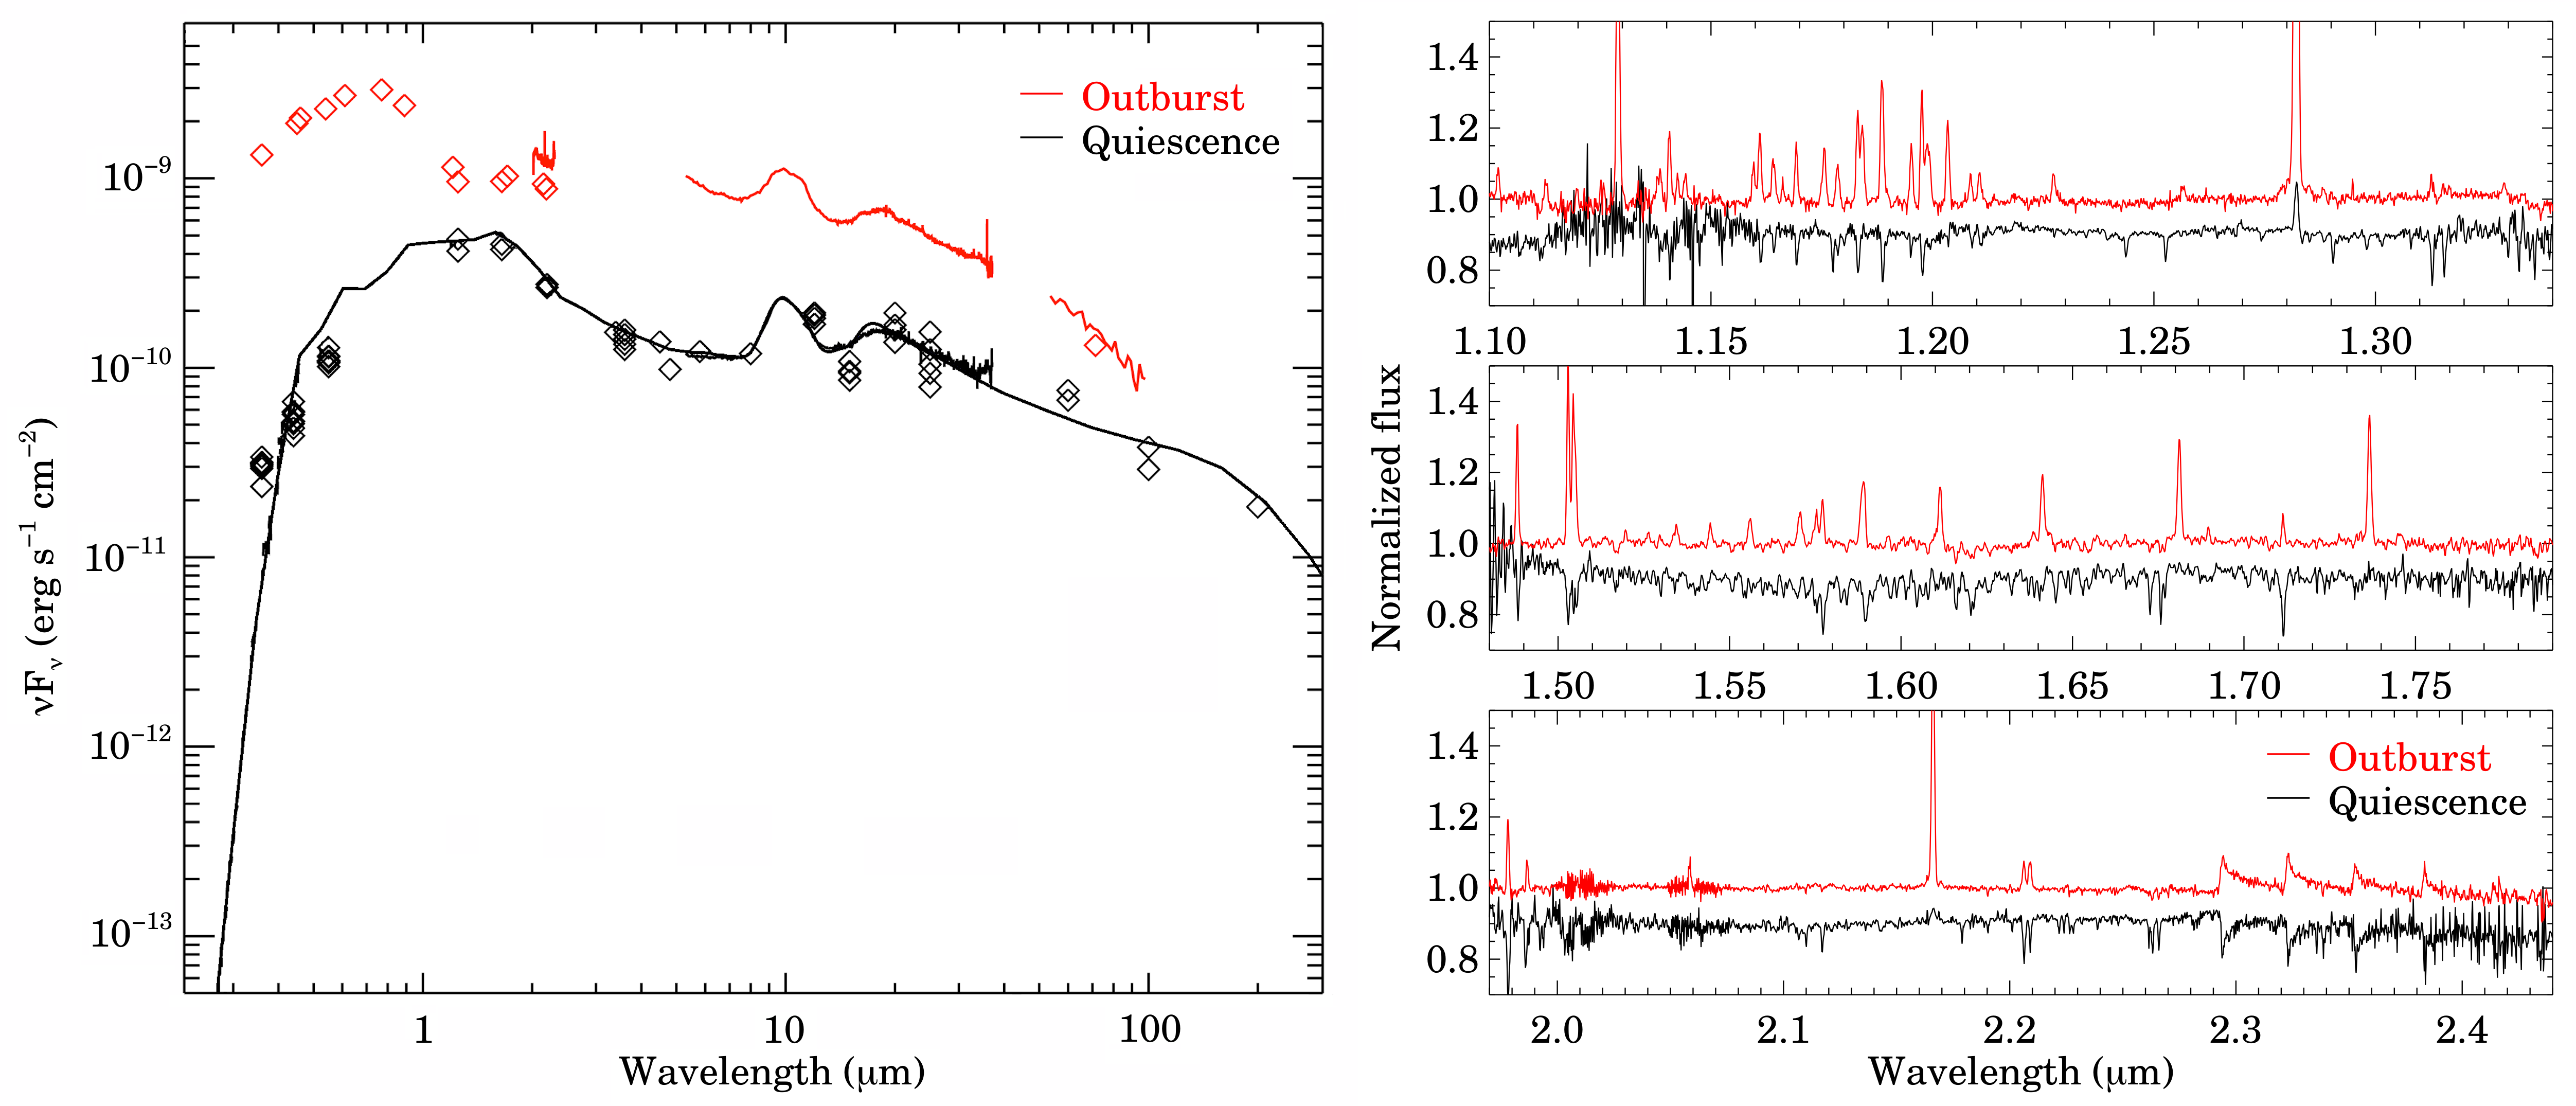
Spectroscopically, in quiescence, metallic lines such as those of Na, Ca, K, Fe, Ti, and Si, as well as the CO bandhead feature are typically seen in absorption in optical and near-infrared spectra, and the stars appear like regular late-type young stellar photospheres. In outburst, when the disk increases in luminosity and can outshine the stellar photosphere, most absorption lines turn into emission, and many emission lines become stronger (Lorenzetti et al. 2009; Rigliaco et al. 2020; see also Figure 5).
EX Lup type objects in outburst indicate ongoing magnetospheric accretion from the disk onto the star. Therefore, not only the luminosity increase, but also their emission line fluxes (e.g., Paschen or Brackett ) can be used to estimate accretion rates. The peak is on the order of a few times yr-1 in outburst (e.g., Aspin et al., 2010; Juhász et al., 2012). The relatively short timescale of the outbursts allows detailed studies of the differences between the high and low accretion states.
For example, Sicilia-Aguilar et al. (2012, 2015) used optical spectra of EX Lup in outburst and in quiescence to suggest very stable accretion channels, with similar structure but different throughput, at different times: yr-1 in outburst and around yr-1 in quiescence (Sipos et al. 2009; see also Figure 5). V1118 Ori is another example of a repeating burster with different spectroscopic presentation in its low and high states (Herbig, 2008; Giannini et al., 2020). An increasingly large number of YSO bursts are being discovered with the spectroscopic characteristics of EX Lup type objects, with ESO H-99 (Hodapp et al., 2019) a recent example.
V1647 Ori outbursts: The discovery of the outburst of V1647 Ori in 2004 revealed that some objects do not fit well into the two traditional categories of EX Lup and FU Ori type objects, even though these groups already encompass objects with a wide range of properties. V1647 Ori has displayed multiple eruptions, with a duration longer than typical for EX Lup objects but shorter than typical for FUors (Ninan et al., 2013). Some of the spectral characteristics of V1647 Ori also resemble those of FUors, like water absorption, weak metals, and He 1 absorption, while others are more characteristic of EX Lup type objects in the high state, including Pa and the CO overtone bandhead in emission (Briceño et al., 2004; Acosta-Pulido et al., 2007). V1647 Ori is also more deeply embedded than typical EX Lup type objects, and in this regard is similar to the younger FUors (Mosoni et al., 2013).
Since the discovery of V1647 Ori, and especially over the past decade, a wide range of bursting and outbursting YSOs has been established. As amplitudes overlap between the outburst categories (Figure 3), and do not always go hand-in-hand with exhibited spectral properties, the prospects for definitive classification seem to be dimming rather than brightening. Some examples follow.
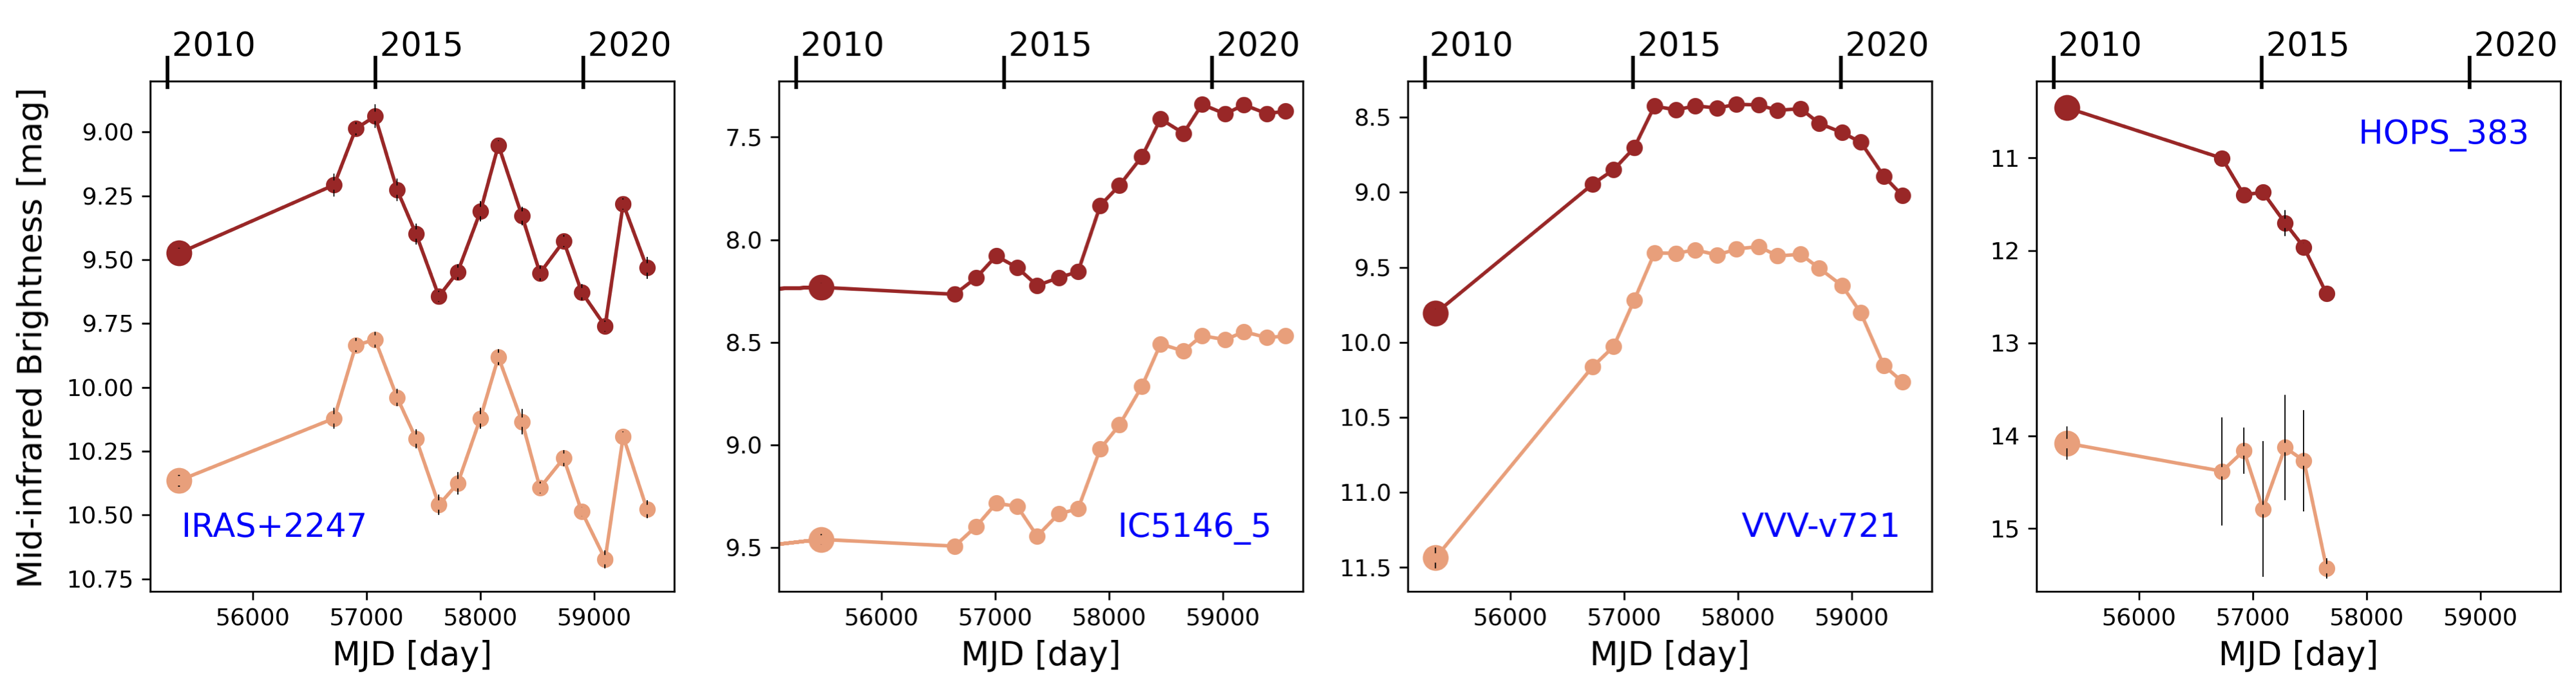
The V1647 Ori analogy can be made for objects that are spectroscopically quite similar to EX Lup sources, but with much more slowly developing bursts, such as Gaia19bey (Hodapp et al., 2020), or with longer duration outbursts than typical of EX Lup type objects, such as ASAS-13db (Sicilia-Aguilar et al., 2017). The V1647 Ori category is, furthermore, a convenient place to park sources that are not quite as extreme in amplitude as FUors, yet have a more complicated spectral appearance than the emission-dominated spectra of outbursting EX Lup stars. Gaia19ajj (Hillenbrand et al., 2019a) is one such example with a large-amplitude rise and mixed spectrum. Another interesting case is that of VVV-v721 (Guo et al., 2020), which had a top-hat-like lightcurve similar to that of V1647 Ori (Figure 7) yet exhibited FU Ori-like absorption features.
A similarly vexing source, in an even more embedded Class 0 phase, is HOPS 383, for which no spectrum could be obtained. Almost uniquely, this outburst was identified via its brightening by a factor of 35 at 24 \micron and a factor of 8 near 5 \micron (Safron et al., 2015). Follow-up at near-infrared (Fischer and Hillenbrand, 2017), mid-infrared (Grosso et al., 2020, see also Figure 7), and sub-mm (Lee et al., 2021b) wavelengths suggested it had declined within several years. It is most likely V1647 Ori-like.
At present, the V1647 Ori category (Contreras Peña et al., 2017b) is not well defined, and the group is established perhaps more via what the objects are not, than by any unifying physics describing what they are. It is unclear if the grouping should include all objects with the lightcurve properties of V1647 Ori, regardless of their spectral presentation, or if it should contain only sources which have the exact mix between EX Lup and FU Ori properties in both lightcurves and outburst spectra that V1647 Ori itself does.
Both the EX Lup and the V1647 Ori prototypes have repeating bursts/outbursts. A subset of the moderate-amplitude accretion brightenings that fall under these categories seem to feature not only repeated brightenings, but quasi-regular brightenings due to accretion changes. Examples include V371 Ser (Hodapp et al., 2012; Lee et al., 2020), V2492 Cyg (Covey et al., 2011; Hillenbrand et al., 2013; Kóspál et al., 2013), and V347 Aur (Dahm and Hillenbrand, 2020). It is currently unclear if these sources are undergoing more cyclic rather than stochastic disk instabilities like EX Lup and V1647 Ori exhibit, or if their quasi-periodic bursts relate to orbiting companions.
FU Ori outbursts: One distinction between FU Ori outbursts and the other flavors of accretion bursts described above is that the accretion rates are high enough to switch the accretion geometry from the typically dominant magnetospheric flow to one in which the accretion breaks through the magnetospheric barrier and reaches the star in roughly the equatorial plane (Hartmann et al., 2016). Bohdan Paczyński in 1975 (as noted by Trimble, 1976) first suggested instabilities in a circumstellar accretion disk as a possible explanation for the outbursts of FU Ori and V1057 Cyg, the two FUors known at that time. As additional outbursting young stars were discovered in subsequent years (V1515 Cyg, Wenzel and Gessner 1975; V1735 Cyg, Elias 1978; V346 Nor, Reipurth and Krautter 1983), more evidence accumulated in favor of the enhanced accretion disk model (Hartmann and Kenyon, 1985).
FUors in outburst have several common spectroscopic characteristics that are widely interpreted as forming in a viscously heated accretion disk that dominates the spectrum. In the optical, these include absorption spectra similar to an F or G supergiant, broad blueshifted absorption lines indicating strong and variable winds, a P Cygni (or pure absorption) profile for the H line, and strong Li absorption at 6707 Å (Hartmann and Kenyon, 1996). In the infrared, they resemble K or M giants or supergiants, with strong CO bandhead absorption, weak metal absorption, water and TiO or VO absorption bands, along with strong blueshifted He 1 absorption (Connelley and Reipurth, 2018). High-resolution spectra show decreasing line width with increasing wavelength in some FUors (FU Ori and V1057 Cyg in Kenyon et al. 1988; V960 Mon in Park et al. 2020).
Both the linewidth behavior and wavelength-dependent spectral type can be understood in terms of a rapidly accreting disk that overshines the central protostar at all wavelengths. In this picture, the absorption lines form in a disk that is heated from the midplane and has a cooler “atmosphere.” Longer wavelengths trace colder, more distant, more slowly rotating disk regions, leading to a wavelength-dependent Keplerian broadening of the lines. For FU Ori itself, interferometric observations (Labdon et al., 2021) have directly measured the expected profile expected from a disk.
FUor lightcurves show a large variety in the rise, peak duration, and decay. Considering the initial outbursts, among the classical examples, FU Ori and V1057 Cyg increased their brightness within about a year, while V1515 Cyg was brightening slowly for two decades (Hartmann and Kenyon, 1996). As additional FU Ori stars beyond the first three have been identified, the rise times have been generally only poorly constrained. However, during the past decade, wide-field, moderate cadence, continuous photometric monitoring surveys have increased the number of identified FU Ori-like events. The rise times have continued to exhibit dispersion, ranging from months (e.g., HBC 722; Semkov et al. 2010; Miller et al. 2011) to years (e.g., V900 Mon; Reipurth et al. 2012).
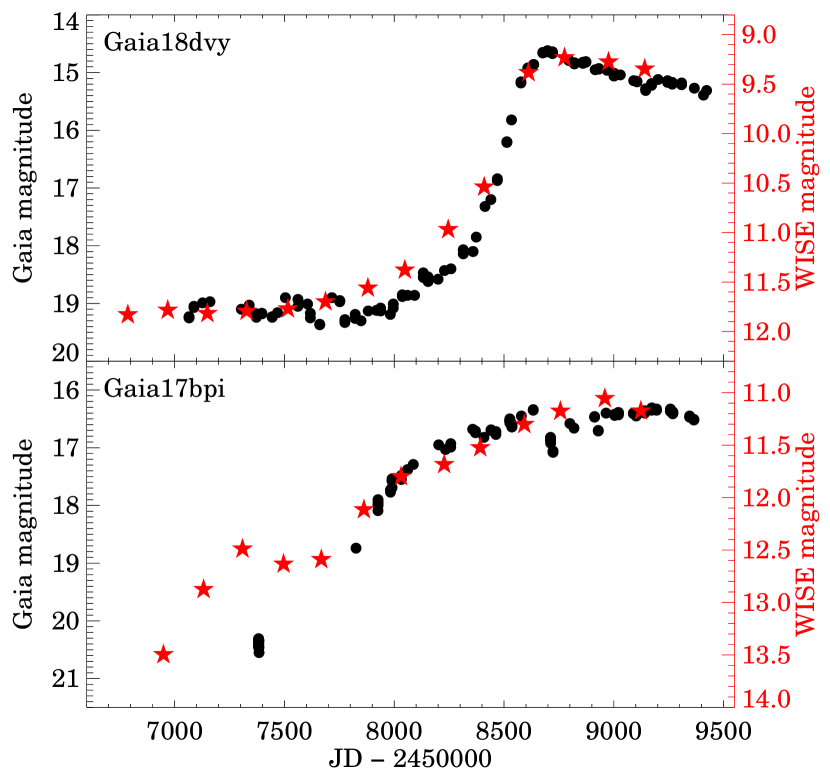
Intriguingly, the outbursting sources Gaia17bpi and Gaia18dvy have been suggested to have increased their brightness in the mid-infrared some months to years before their large-amplitude optical increases (see Figure 6; Hillenbrand et al., 2018; Szegedi-Elek et al., 2020). As infrared monitoring is a relatively recent development, the ubiquity, or lack thereof, of this phenomenon is currently unknown. One interpretation is that FU Ori outbursts perhaps begin in a cooler region of the disk and propagate inward such that the hotter optical outburst is observed later.
While the lightcurve shapes show a large variety, FUor outbursts have in common a detected, sustained increase in bolometric luminosity and long decay timescale, perhaps exceeding typical human lifetimes. The luminosities, however, span a large range. Many of the FUors discovered in the twentieth century have luminosities of several 100 , while other more recently discovered ones have luminosities of only 10–50 .
Under the assumption that the luminosity increase is purely due to accretion, and that the luminosity is dominated by the disk, the corresponding accretion rate can be derived by matching the luminosity in fitting an SED, which requires understanding the source distance and extinction. Some FUors have peak accretion rates in excess of yr-1 (e.g., V582 Aur, Zsidi et al. 2019; V1057 Cyg, Szabó et al. 2021), while others only reach yr-1 (e.g., V2775 Ori, Caratti o Garatti et al. 2011; HBC 722, Kóspál et al. 2016; Gaia17bpi, Rodriguez and Hillenbrand 2022). These numbers should be treated with caution as they depend on the (sometimes) poorly constrained stellar mass and disk geometry. Nevertheless, they probably reflect a real spread in FU Ori accretion rates. The strongest, longest outbursts may significantly and rapidly increase the mass of the protostar.
Regarding decay times, FU Ori has faded by only about 1 mag since its outburst more than 80 years ago (Kenyon et al., 2000), while V1057 Cyg and V1515 Cyg have faded by 2–4 mag in just a few decades (Szabó et al., 2021, 2022). As they have faded, these objects have maintained their multi-temperature, disk-broadened spectral appearance. The fading is not always monotonic, as would be expected if disk cooling were the only physical effect.
The decay lightcurves for some FUors include short-timescale variability. Flickering seen in precise space-based photometry has been interpreted as brightness asymmetries due to rotating inhomogeneities in the inner disk (FU Ori, Siwak et al. 2018; Bran 76, Siwak et al. 2020; HOPS 383, Morales-Calderón et al. 2011). Periodic variability is sometimes interpreted as a possible consequence of binarity (V1057 Cyg, Kopatskaya et al. 2013; V960 Mon, Hackstein et al. 2015). Sharp drops in brightness have been identified via multi-filter photometry to follow the interstellar reddening path, and hence interpreted as dust condensations (e.g., Clarke et al., 2005, for V1057 Cyg and V1515 Cyg).
We note that some objects that have been considered likely FUors early on during their outbursts – albeit without exhibiting all confirming spectroscopic signatures of the class – later undergo a significant decrease or halt in their accretion. Recent examples include V899 Mon (Ninan et al., 2015; Park et al., 2021a), V346 Nor (Kraus et al., 2016; Kóspál et al., 2017a), V960 Mon (Park et al., 2020), and OO Ser (Kóspál et al., 2007), all of which faded monotonically back to their presumed quiescent brightness over about 5 years following their peaks. These sources may be more appropriately considered as V1647 Ori type sources, even though they exhibited early signs of FU Ori-like spectra. Alternately, they may simply be short-lived FU Ori type outbursts. In these cases, the accretion fades carry information about the structure of the circumstellar matter and put constraints on how the accretion proceeds in these outbursting systems, which we can not yet access for the longer-lived FU Ori outburst objects.
The diversity of optical/infrared outbursts: Despite the wide range of behaviors already described above, several recently identified outbursting objects have exhibited even more unusual rise times, amplitudes, or spectra.
Herczeg et al. (2016) presented the case of an object with an FU Ori-like absorption and wind spectrum, but which rose to peak brightness in 24 hours and decayed on a few-month timescale. In the case of WISE 14226115 (Lucas et al., 2020), the outburst amplitude is an “exceptional” 8 mag in the near- and mid-infrared. This source is not optically visible, with a -band spectrum that is completely featureless, lacking either emission or absorption. For PTF 14jg (Hillenbrand et al., 2019b), the relatively short rise and large-amplitude event showed an absorption spectrum that is atypically hot for an outbursting YSO and a featureless spectrum in the band. The latter two objects faded on timescales of 5–10 years. These examples illustrate the widening range of outburst phenomenology, labeled peculiar by Connelley and Reipurth (2018), to be explained beyond the already diverse EX Lup, V1647 Ori, and FU Ori classes. On the other hand, these three specific outstanding sources may not be YSOs at all, despite their apparent association with star-forming regions.
As implied throughout our discussion, there is significant diversity in lightcurve shapes and spectroscopic presentation of YSO outbursts. Precious few sources seem to fit the classical definition of an FU Ori lightcurve and spectrum. More examples are known of the repeating EX Lup type events. The majority of sources recently discovered in outburst appear to have “mixed” characteristics, exhibiting absorption and emission features in their spectra that are not entirely aligned with the expectations. For example, some objects with disk-like absorption spectra in the blue optical do not seem purely FU Ori-like, since they also show emission line features at redder wavelengths. The intermediate V1647 Ori category is a convenient bin for such hybrids, though it may be the case in the future that further sub-classification efforts will be possible, once a larger sample of well-characterized quiescence-to-peak-to-quiescence outbursts is available.
Another axis of diversity is in the multiwavelength amplitudes of the accretion bursts and outbursts. EX Lup type objects have long been appreciated to have blue outbursts, with larger amplitudes at shorter wavelengths (e.g., Giannini et al., 2020). This color change is to be expected in the scenario of moderate enhancements in the magnetospheric accretion rate, with more mass infalling at similar velocities, resulting in higher temperatures and hence bluer optical colors. For the FU Ori outbursts, the expectation is of a globally enhanced accretion rate, involving more of the disk, and resulting in an increased bolometric luminosity across a broader range of wavelengths. There is limited empirical color information in the pre-outburst states, though with evidence for colors becoming slightly bluer (few tenths of a magnitude), at least temporarily, during the outbursts near peak (Szegedi-Elek et al., 2020).
Finally, the well-studied bursts and outbursts discussed above have systematically larger amplitudes, measured in the optical, than do those bursting sources identified through mid-infrared variability (discussed next). In the scenario where is temporarily enhanced only in the inner few tenths of an au of the disk, the limited area of the hot accretion zone may naturally explain this amplitude discrepancy. We note the importance of more detailed theoretical modeling showing what the multiwavelength lightcurves of accretion outbursts should look like, in order to constrain the outburst mechanisms.
4.1.3 Variable Accretion in Protostars Revealed via Long-Wavelength Monitoring
The historical description of accretion outbursts developed mostly through optical monitoring and follow-up spectroscopy. However, during the main stages of stellar growth, protostars are embedded in an optically thick envelope and located deep within their parent cloud. Their growth and any accretion variability are detectable primarily at infrared and radio wavelengths, with observations that pierce through the opaque dust.
While variability at long wavelengths has been established to be common, the interpretation and generalization are still challenging. Several surveys at longer wavelengths have been designed to statistically evaluate changes in accretion rate. Offner and McKee (2011) estimated that 25% of a star’s main-sequence mass could be accumulated in protostellar outbursts, and Fischer et al. (2019) found a similar fraction by considering the estimated durations, amplitudes, and duty cycles of protostellar outbursts in Orion. Mid-IR monitoring (see Figure 7 for examples) and submillimeter surveys for bursts are still in their infancy compared to optical studies, but they have the potential to give a systematic understanding of mass assembly at early times.
The VVV Survey -band monitoring has revealed a large number of candidate outbursting protostars, primarily in the galactic plane (Contreras Peña et al., 2017a, b; Guo et al., 2020). Such studies require additional spectroscopic confirmation to discriminate between young stars and the many contaminants in the monitoring regions. The outbursting YSOs, a much less biased sample than the historical set of outbursts, demonstrate the diversity in outburst duration and amplitude. Most diverge from the FU Ori/EX Lup classification system, with some resembling the intermediate duration of V1647 Ori. Reaching conclusions as to the overall outburst frequency and variability level by evolutionary stage remains challenging, because the parent population is unknown.
Mid-IR surveys, particularly the all-sky monitoring of NEOWISE, have enabled outburst searches on carefully selected samples of protostars. Mid-IR searches for large changes were initially carried out by comparing two epochs of Spitzer and/or WISE observations, spanning up to six years (Scholz et al., 2013; Rebull et al., 2014; Fischer et al., 2019). More robust lightcurve characterization and statistics were enabled by including 10 data points spanning 5–7 yr (Lucas et al., 2020; Park et al., 2021b; Zakri et al., 2022). Among the identified protostars in Park et al. (2021b), 35% show continuous stochasticity at the 6 month cadence without a discernible timescale and another 20% have years or longer apparently secular events with moderate, factor of two changes in brightness; only a few percent show identifiable discrete short-timescale (1 yr) events. While much of the observed mid-IR variability has similar characteristics to the optical/near-IR pre-main sequence routine accretion variability (§ 4.1.1), for protostars there appears to be a stronger long-timescale, low-amplitude component, likely associated with disk accretion physics.
The mid-IR studies commonly set a threshold of 1 or 2 mag to distinguish departures from routine variability. This is consistent with our definition of “bursts” but not “outbursts” in Table 1, which is built on optical observation. In the infrared, flux differences between FUor objects and typical protoplanetary disks are lower than in the optical (see Hillenbrand and Rodriguez, 2022, for illustration). At least two stars with only a 2 mag brightening in the 3–5 \micron range (which would correspond to 4 mag in the near-infrared) show the near-IR spectral characteristics of FU Ori stars (V2775 Ori, Fischer et al. 2012 and Gaia18dvy, Szegedi-Elek et al. 2020).
Typical burst/outburst intervals for embedded protostars have been estimated to be 1000 yr from investigating the objects that changed by 2 mag across Spitzer and WISE epochs separated by 6.5 yr (Fischer et al., 2019) and sustained over at least several epochs in 7 years of NEOWISE monitoring (Park et al., 2021b). On the other hand, Rebull et al. (2014) did not note any large bursts in a large sample when comparing between epochs separated by 6–7 years. Findings depend upon classification choices, including whether to interpret a fading star as a candidate (as implemented by Park et al., 2021b) and what to call a burst or an outburst. The frequency of once per 1000 yr appears to be much higher than the frequency in older disks (Hillenbrand and Findeisen, 2015; Contreras Peña et al., 2019), but comparisons are not consistent across studies, with large uncertainties in both the types of objects being detected and in the parent samples. Additionally, candidates identified from lightcurves require subsequent confirmation.
An important caveat to the outburst frequency is that understanding the nature and cause of the burst requires a spectrum, which is difficult or impossible for deeply embedded sources but feasible for flat-spectrum or late Class I protostars. At mid-IR wavelengths, the radiative transfer can be complicated, since the measured emission may vary due to geometric changes in the inner disk, and the change in disk emission may not directly correlate with a change in accretion rate. Infrared emission may also escape through outflow cavities, where the envelope opacity is lower, providing opportunities to identify variability in reflected light (e.g., Muzerolle et al., 2013; Yoon et al., 2022) but introducing challenges in interpretation.
At submillimeter wavelengths, variability is cleanly interpreted as a temperature change in the dust following the variable protostar luminosity, since radiative transfer complications should be negligible when measuring volumes (Johnstone et al., 2013; Baek et al., 2020). Studies that combine sub-mm and IR observations confirm the close correlation between sub-mm and protostellar emission for individual objects (Safron et al., 2015; Lee et al., 2020; Szabó et al., 2021) and across small samples (Contreras Peña et al., 2020).
Monthly cadence monitoring in the sub-mm reveals long-term, many-year, secular variability trends on 20% of sources at the 10–30% level (Johnstone et al., 2018; Lee et al., 2021b). The sub-mm brightness changes primarily reflect a change in the equilibrium temperature of the dust in the enshrouding envelope, which responds to source luminosity changes only weakly, with (Johnstone et al., 2013; MacFarlane et al., 2019). Thus, the sub-mm brightness variations indicate significantly larger fractional changes in protostellar luminosity of 1.5–3 as demonstrated for a sample of sub-mm variables through comparison with mid-IR variability (Contreras Peña et al., 2020).
The statistics on long-term, many-year, sub-mm variations are similar to those found by the mid-IR surveys discussed above; however, the sub-mm observations fail to uncover a class of continuously stochastic sources, either due to the poor sub-mm measurement sensitivity or possibly a smoothing out of the lightcurve by the finite, month-long equilibration time of the protostellar envelope (Johnstone et al., 2013). These surveys have only recently become possible with techniques based on relative brightness measurements and are still limited to small numbers of protostars (Mairs et al., 2017). As a consequence, large outbursts have not yet been discovered at sub-mm wavelengths. Nevertheless, for a few sources the sub-mm lightcurves are allowing for physical interpretation. Several bursting systems previously identified at shorter wavelengths show correlated long-term sub-mm behaviour (e.g., V1647 Ori, HOPS 383, V371 Ser; Lee et al., 2021b), with V371 Ser (EC 53) showing an 18 month sub-mm periodicity (Yoo et al., 2017; Lee et al., 2020) that is also seen in the near-IR as discussed in § 4.1.2.
Long-wavelength observations are also beginning to uncover brightness variations in high-mass star-forming regions. As massive star evolution proceeds more quickly – at all evolutionary stages – than the development of low-mass stars, the protostellar and pre-main sequence stages for remain entirely heavily embedded. The known outbursts in this mass range are rare. Examples include the variable high-mass protostar NGC6334I-MM1, which brightened in the mm, but is challenging to study since it is both saturated in mid-IR imaging from WISE/NEOWISE and invisible in the red-optical to 22 mag (Hunter et al., 2017). Other outbursts are found in S255 (Caratti o Garatti et al., 2017) and M17 (Chen et al., 2021). For high-mass protostars, a potential indirect indicator of accretion variability is Class II methanol maser flaring (e.g., MacLeod et al., 2018). G358.930.03-MM1 was initially noticed due to such a maser burst (Sugiyama et al., 2019) and was later confirmed to have undergone a far-IR brightness increase by a factor of a few (Stecklum et al., 2021). For this source, the wave of radiation generated methanol maser emission from the disk, which was used to measure a precise protostellar mass (Burns et al., 2020). Several candidate bursts have also been identified on massive protostars with NEOWISE monitoring (Uchiyama and Ichikawa, 2019). Magakian et al. (2019) even identified an optical outburst of a Class I source inferred to be a B star.
4.2 Indirect Signatures of Variable Accretion
4.2.1 Spectra Indicative of Viscous Accretion Disks
FU Ori outbursts persist for decades, perhaps even centuries. However, the brightness increase associated with any particular outburst may have been missed. Nevertheless, stars in an FU Ori outburst state should show the unique spectral absorption signatures that arise from a disk photosphere, in particular the temperature dependence with wavelength, the line profiles consistent with disk rotation, as well as a disk-like ultraviolet, optical, and near-infrared spectral energy distribution (see § 4.1.2 for more details).
L1551 IRS 5 and Bran 76 (V646 Pup) are examples of YSOs that share spectral characteristics with FUors, but no known outburst has been observed (Harris and Beichman, 1980; Reipurth et al., 2002). Such sources are known as FUor-like objects (Aspin and Reipurth, 2003; Greene et al., 2008) and must be associated with strong disk accretion, likely in temporary outburst. Often such objects are faint and red, with only low-resolution spectra that render them difficult to distinguish them from late-type stars (Connelley and Reipurth, 2018). Only 10–15 FUor-like objects have been identified.
4.2.2 Chemical Tracers of Outbursts
When a protostar undergoes a large accretion burst, the increased luminosity will heat the disk and envelope above the quiescent temperature, leaving a temporary or lasting mark on the chemical structure (see review by Jørgensen et al., 2020). Some molecules will be dissociated and ices destroyed in the outburst, with recombination and reformation timescales that depend on the specific species and local density. The chemistry in the envelope and disk offers a historical record of outbursts in the most recent few millennia.
For envelopes, Visser et al. (2015) found that for a factor of 100 increase in luminosity, CO evaporates throughout the envelope, leading to an increased abundance of HCO+, decreased abundance of N2H+, and a water snowline expanded by a factor of 10. The warmer envelope also leads to the evaporation of complex organic molecules (Taquet et al., 2016). These models provide a framework for interpreting measurements of CO snowlines. These are often located beyond the distance of the snowline expected from the present-day luminosity, as expected for recent bursts (e.g., Lee, 2007; Jørgensen et al., 2015; Frimann et al., 2017). Hsieh et al. (2019) leveraged the differential reformation timescales of 1,000 years for H2O ice and 10,000 years for CO ice to infer past luminosities of 10–100 for a sample of Class 0/I sources in Perseus. These luminosities are much higher than present-day values and, if interpreted as bursts, these events occur once every 2400 yr for Class 0 objects and once every 8000 yr for Class I objects. The Class I protostellar binary L1551 IRS 5 is a possible example of a disk/envelope structure with complex chemistry, including complex organic molecules, driven by an FUor-like outburst of the northern component (Bianchi et al., 2020).
For protoplanetary disks, the chemical effects are also significant but do not persist for as long as in the envelope. Timescales are shorter in the dense inner disk and longer in the outer disk. Rab et al. (2017) found that CO sublimates during the outburst, then once the YSO is back in quiescence the CO freezes out in an inside-out manner that produces distinct observational signatures, such as a two-component Gaussian intensity profile post-outburst. For a 200 outburst luminosity lasting 50 years, Molyarova et al. (2018) found that gas-phase abundances of molecules significantly increased due to the outburst, mainly because of the sublimation of their ices. The abundances of CO, NH3, C2H6, and C3H4 return nearly instantaneously, while H2CO and NH2OH remain in the gas phase for 10–103 yr after the end of the outburst.
Despite significant uncertainties related to interpretation of chemical diagnostics, the prediction that complex organic molecules will evaporate off of grains at high temperatures during outbursts has been confirmed for the inner disk of the outbursting star V883 Ori (e.g., van ’t Hoff et al., 2018; Lee et al., 2019). These indirect probes provide a powerful diagnostic of the temperature history of protostars and can be used to identify stars that experienced outbursts at relatively recent times (Anderl et al., 2020).
4.2.3 Outburst Signatures in Outflows
Outflows driven by young stars can be used as an indirect tracer of accretion variability. Since the mass ejection originates from disk accretion, any variability in the accretion process should lead to corresponding variability in the ejection process. This can manifest as clumpy structures in the jets and outflows, where individual clumps may plausibly be tied to different accretion/ejection events, with the clump spacings and kinematics together used to estimate the duration between individual accretion (and ejection) bursts. While this idea has been around for at least three decades (Reipurth, 1989) and was reviewed in the previous Protostars & Planets VI (Dunham et al., 2014; Frank et al., 2014), improved facilities have led to a proliferation of outflow characterization in recent years, including a known FUor (Kóspál et al., 2008).
Typical durations between bursts inferred from outflow signatures of variability are a few hundred to a few thousand years (e.g., Plunkett et al., 2015; Zhang et al., 2019; Nony et al., 2020; Vazzano et al., 2021). There are substantial uncertainties inherent in this type of analysis, including projection effects on both the clump spacings and observed velocities, assumptions related to whether detected clumps are locally entrained or ejected from the driving source, and assumptions related to the history of the velocity of the outflowing material. Furthermore, Vorobyov et al. (2018) showed in models that longer burst durations could also be present but undetected in outflow clumps due to the large distances that such clumps would travel over such long durations.
While it is now clear that some outflows exhibit signatures of variability in ejection properties, the connection to accretion events is reasonable but mostly speculative, with only a few tentative connections that have been identified (e.g., Ellerbroek et al., 2014; Garufi et al., 2019). Wind absorption features are one of the defining characteristics of FUor outbursts (Herbig et al., 2003; Sicilia-Aguilar et al., 2020; Szabó et al., 2021), including enhanced emission from a bipolar wind associated with an outburst of Z CMa (Benisty et al., 2010). However, it is unclear how or even whether the wind from the inner disk translates to enhanced molecular outflows. Significant progress has been made in linking maser emission from outflows to outbursts for high-mass stars (Burns et al., 2016), with the prospect of developing a scaling relationship, but these may not be applicable to low-mass stars or to bursts in the distant past.
Outflows offer a rich historical archive of accretion history over timescales of thousands of years. However, to exploit this archive, large uniform surveys are needed to firmly establish and quantify the relationship between outflow variability and accretion variability.
5 UNRESOLVED ISSUES
5.1 What Drives Accretion Variability?
Directly observed and indirectly inferred evidence argue for unstable mass accretion through the disk during protostellar assembly. In contrast, short-duration events are likely driven by instabilities in the flow from the very inner disk onto the forming star, with the observed variability probing the mechanisms responsible for this mass transfer (§ 4.1.1). Intermediate between these two extremes, the observed moderate-amplitude years-to-decade-long secular variability apparently common in protostars (§ 4.1.3) probes inner-disk viscous accretion times and thus may yield useful constraints on the physical processes mediating inner disk accretion.
Whether these accretion variations are located along a continuum of instabilities, as perhaps indicated by the intermediate events, or whether the large and small bursts are distinct phenomena, remains unclear. The present observational classification schemes are insufficient and the statistics are too poor to precisely populate the amplitude-timescale diagram (see Figure 3). While this question is still ill-formed observationally, one can instead describe the problem in terms of the physics that governs the outbursts of different sizes and amplitudes. To consider that question, in this section we describe the physics that may trigger and end outbursts. We also look at systematic differences between FU Ori disks and other YSO accretion disks.
5.1.1 Potential Accretion Variability Mechanisms
Fundamentally, the observed timescales associated with accretion variability, whether episodic, periodic, or stochastic, depend on the physical conditions within the disk and the processes responsible for producing the unstable flows. Furthermore, the amplitude of the variability depends on the ability of the process to extract energy and angular momentum from the disk. For events at disk radius and modulated by gravity, the local dynamical time,
| (2) |
ranges from mere days, near the inner disk edge at several , to centuries, for material located in the outer disk. On the other hand, if diffusive evolution of the disk material is important, as for example implied by the viscous -disk prescription for mass transport within the disk, then the diffusion time,
| (3) |
sets the timescale, with the disk scale height, the typical steady-state , and . Thus, even in the very inner disk the expectation is that viscous diffusion requires a minimum timescale of years. Furthermore, a thermal timescale, , lies intermediate to the dynamical and diffusion times;
| (4) |
corresponding to months near the inner disk edge. Finally, at intermediate distances, disk accretion may be driven by magnetocentrifugal disk winds (Bai, 2017; Lesur, 2021, see also chapters by Manara et al. and Pascucci et al. in this volume). Radial scaling arguments for the evolution of episodic events associated with such accretion do not yet exist; however, the relevant event timescales are likely to be intermediate between and .
From the above argument, days-to-weeks timescales for observed variability are driven by the very inner disk, the disk-star interaction, or the accreting star. On these timescales we also observe non-accretion-driven brightness changes by stellar rotation (star spots) or chromospheric activity, and potentially inner disk warping capable of producing short-timescale variations in optical depth. Variable accretion may be induced by instabilities in the accretion columns connecting the star with the disk, but unless a feedback mechanism is invoked, the observed time-averaged mass accretion onto the star should be determined by the steady-state flow through the inner disk. Possible feedback mechanisms at the star-disk interaction region include magnetic gating of the disk mass flow, leading to quasi-periodic accretion (e.g., D’Angelo and Spruit, 2012), and reversal of the stellar magnetic field driven by dynamos (Armitage, 2016). On somewhat larger scales, convective or thermal instabilities within the inner disk, driven by and coupled to the varying accretion luminosity, can produce periodic or episodic mass flow onto the star (e.g., Kadam et al., 2019, 2020; Pavlyuchenkov et al., 2020).
Longer-timescale accretion variability is expected to be driven by the mismatch between steady-state mass flow through the disk and local regions where the flow becomes stalled. For example, the magneto-rotational instability (MRI) is a favored mechanism for interchange of energy and angular momentum across inner disk material, leading to diffusive spreading of the disk but requiring a moderate level of ionization to couple to the disk magnetic field. The star provides ionizing radiation to the very inner disk (e.g., Flock et al., 2017), and cosmic rays may work at larger distances (e.g., Bae et al., 2014), but in between there is likely to be a region incapable of efficient MRI-induced transport (e.g., Zhu et al., 2010). This bottleneck, at radii where the accretion rate may be less efficient, disconnects the inner disk from a large reservoir of mass in the outer disk, and thus inner-disk viscous spreading dumps an ever decreasing amount of material onto the star, while the mass in the outer disk grows, spreads, and piles ever more material at the outer edge of this blockage. Potential solutions to this flow stagnation have been proposed in the literature, all of which lead to episodic mass accretion events – in particular, heating-induced ionization within the blockage due to gravitational instabilities near its outer edge lead to episodic runaway events that efficiently transport material into the inner disk (e.g., Armitage et al., 2001; Martin and Lubow, 2011). Indeed, for FU Ori outbursts, the observed disk temperatures are high enough ( K) for thermal ionization to activate MRI (Gammie, 1996; Desch and Turner, 2015) over a large area of the inner disk, allowing for efficient accretion.
Alternatively, outer-disk gravitational instability can either induce fragmentation into clumps, which may then scatter on dynamical timescales into the inner disk and potentially be tidally disrupted and viscously diffuse onto the star (e.g., Vorobyov et al., 2021), or it can induce inner-disk MRI and large accretion events (Zhu et al., 2009; Bae et al., 2014). At the earliest stages of protostellar evolution, accretion from the envelope onto the disk should also lead to disk instabilities and perhaps non-steady accretion (Bae et al., 2015; Lesur et al., 2015).
Observations of bursting and outbursting pre-main sequence stars provide time-dependent evidence of the changing conditions within the disk, including measurements of the disk radial temperature distribution and sequencing of the heating within the disk – inner to outer versus outer to inner – important constraints for the theoretical models. Likewise, statistical consideration of both the bursts/outbursts and the lower-amplitude routine accretion variability observed on inner-disk viscous timescales across all YSOs, protostellar and pre-main sequence, should restrict the range of possible accretion disk models.
5.1.2 Means of Ending Outbursts
Once an accretion burst or outburst has begun, its duration depends on the ability of the disk to continue supplying material at an enhanced rate. Mechanisms that rely on inner disk instabilities therefore have a shorter potential lifetime before exhaustion of the available disk material. Alternatively, for instabilities driven further out in the disk, both the timescales and mass reservoirs will be significant. The theoretical models discussed above primarily produce episodic accretion events due to an imposed mismatch in the accretion onto the disk and the steady-state throughput of the disk. In such cases, after each burst is complete, there will be an extended lull as the disk refills and returns to the unstable state. For example, Banzatti et al. (2015) found weaker molecular emission from EX Lup after the burst compared to an in-burst spectrum, possibly the consequence of a decrease in molecular column density, i.e., the inner disk rapidly drained of material. During the last stage of stellar assembly, however, it is possible that a disk instability reduces the remaining disk mass significantly in a single, last, gulp.
Some targets exhibit brief periods of quiescence in the middle of their outbursts. V1647 Ori and V899 Mon showed breaks of a few months to a year (Ninan et al., 2015). In both cases, the second outburst was much longer than the first outburst and the break. The decay timescale of the first outburst was also significantly faster than the decay timescale of the second outburst. This may indicate that additional complexities are at work in ending some outbursts.
There is thus a rich potential for identifying outburst mechanisms through a quantitative understanding of their amplitudes, lifetimes, and, for those that repeat, their cadences. Complicating matters for observers, as noted at the start of this section, the viscous timescales within the disk are long, even at the very inner disk edge. Furthermore, the majority of the theoretical models show significant non-linear disk behavior mixed in with each burst. Thus, the triggering of an instability leads to a diverse string of accretion events, with a correspondingly broad spectrum of individual amplitudes and timescales.
It is therefore unlikely that any one observed accretion outburst system can be unambiguously associated with a specific underlying instability mechanism from its lightcurve alone. This degeneracy may be weakened through the aid of key observational diagnostics measuring the physical state of the protostar and disk.
5.1.3 Why Are FU Ori Disks More Massive and Smaller Than Other YSO Accretion Disks?
In the enhanced disk accretion model, an important aspect is that there should be a mechanism that stops the material from falling onto the star continuously, leading to an accumulation of material in the inner disk; and also a mechanism to quickly increase the low, quiescent accretion by orders of magnitude, leading to an eventual depletion of the inner disk, which may be replenished later. Until recently, very few observational constraints existed for the spatial and velocity structure of the circumstellar disks and envelopes of young eruptive stars. Millimeter interferometers provide this crucial information. Using ALMA observations of the millimeter lines of various CO isotopologues, Kóspál et al. (2017b) found that the infall rate from the envelope onto the disk in V346 Nor is a factor of a few higher than the quiescent accretion rate from the disk onto the star, hinting at a mismatch between the infall and accretion rates that models indicate can create a mass buildup and eventually cause an eruption (Zhu et al., 2010).
Millimeter continuum observations of young eruptive stars with ALMA and SMA revealed that FU Ori disks are significantly more massive than EX Lup type disks, and that they are more compact than what is typical for normal T Tauri disks (Cieza et al., 2018; Liu et al., 2018). Radiative transfer modeling of ALMA 1.3 mm continuum observations of a sample of FUors and FUor-like objects revealed that disk masses are significantly larger than what was obtained from the measured millimeter fluxes assuming optically thin emission, suggesting that FUor disks are at least partially optically thick at this wavelength and suggesting that substantial amounts of mass may be hidden in their disks (Kóspál et al., 2021). When compared with samples of regular Class II and Class I sources modeled in the same way, FUor disks were found to be systematically more massive and smaller in size. A significant fraction of FUor disks may even be gravitationally unstable. The small, massive disks imply significant mass reservoirs at small radii, i.e., in regions with small enough viscous timescales, which may provide an explanation for the eruptive nature of these objects.
That FUor disks appear distinctly more massive and smaller than typical T Tauri disks raises intriguing questions. Is it possible that there is a phase during the circumstellar disk evolution when the disk structure deviates from the typical one so that it can produce outbursts? Is it possible that FUor eruptions happen in normal disks, but the outburst itself modifies the disk structure? Is it possible that some disks are born with smaller radius and larger mass than usual, and later they follow a particular evolutionary path that leads to episodic eruptions? To answer these questions and determine if all YSOs go through FUor eruptions will require a well-understood framework for the initial distribution and evolution of gas and dust in disks from formation to the Class II stage.
5.2 Why Is the Rate of True FU Ori Outbursts Still Poorly Constrained?
Assuming that all YSOs undergo FU Ori outbursts, attempts from optical discoveries place the FU Ori outburst rate at one per yr (e.g., Contreras Peña et al., 2019), while evaluations from the mid-IR yield outburst rates of one per yr (Fischer et al., 2019; Park et al., 2021b). These numbers seem to confirm our expectations, from simple arguments and from theory, that protostars have a higher frequency of outbursts in the primary growth stages, when the disk is still being fed by the envelope. Despite this clean story, the rate of true FU Ori outbursts remains highly uncertain. The rate requires an accurate number of events divided by the total number of young stellar objects that could have been detected to burst, with sufficient statistics to be confident in the result (Hillenbrand and Findeisen, 2015). One further needs to consider evolutionary stage if we want to measure a time dependence.
The numerator requires a sufficient number of outbursts for a statistically meaningful result and an accurate classification of those outbursts. True FUor outbursts are exceedingly rare and must be distinguished from other, far more frequent large-amplitude variability in the galactic plane (CVs, symbiotic stars, AGB pulsations) as well as from other flavors of large-amplitude but non-outburst variability that characterizes some young stars. Contreras Peña et al. (2019) found six among a large sample of Class II stars observed in epochs separated by 55 yrs, distinguishing them from 133 other young stellar objects with large changes, and 15,000 (possible) Class II stars that did not show such large changes. Studies over substantially longer timescales with increased samples are not obviously feasible.
The numerator is even more challenging to measure for protostars. The threshold of brightness change to identify candidate FUor outbursts is typically mag in the mid-IR, compared with 3–5 mag in optical surveys. Once a candidate is identified, the historical lightcurve for context is often not available, and spectroscopic confirmation of a viscous disk may be impossible. Stringent criteria that may be applied for optically bright objects often cannot be applied to faint protostars, leading to looser classifications. The methodological differences and the desire to label an object as an outburst potentially lead to much higher measured rates of outbursts for protostars.
The denominators are also plagued with uncertainty. First, the parent population should be bona fide young stars with disks, which are now possible to define for optically-bright members within kpc using Gaia and WISE (a relatively small population) but challenging for infrared selections. For any time dependence, protostars in the galactic plane remain difficult to distinguish from background AGB stars, despite diagnostics that include emission from dense molecular gas (Heiderman and Evans, 2015), astrometry (e.g., Herczeg et al., 2019), and lightcurve shapes and analysis of maser emission (Lee et al., 2021a). Second, since FUors are 5 mag brighter, they are detectable to a much larger volume than their quiescent counterparts; thus, volume-limited samples severely reduce the statistical significance in the numerator.
5.3 Bridging Theoretical Models and Observational Constraints
The theoretical models and numerical simulations reveal an impressively rich parameter space of physical processes that can produce episodic mass flows onto forming stars (e.g., Vorobyov et al., 2021; Pavlyuchenkov et al., 2020; Maksimova et al., 2020). However, it is very difficult to compare them directly with observations. This is due in part to the sparse measurement sets and short time windows available for most observed variable sources. However, it is also the case that the theoretical models tend to sample possible mechanisms rather than constrain and quantify the range of conditions under which these mechanisms might act. When example outburst lightcurves are produced, they do not seem to match in detail the empirical data in terms of lightcurve profile or duration. Furthermore, the models are not yet fully coupled to the radiative transfer physics necessary to predict observables as a function of wavelength. Observations at infrared wavelengths, both to monitor time-variable emission and to spatially resolve the emitting region, would be extremely desirable to constrain the range of disk radii involved, which in turn has a big impact on theoretical models.
What is needed before the next Protostars and Planets, therefore, is a set of agreed upon measurements that both the theorists and observers can begin to compile. These should include diagnostics of the burst itself such as the rise and decay shapes and timescales. Of particular value will be the full width at half maximum of the burst length as well as the amplitude, or range of potential amplitudes, of the accretion event in both yr-1 and as a percentage of the steady-state accretion rate. Additionally, a clear understanding of how these values vary with physical parameters is essential for meaningful theoretical comparison. On the observational side, quantifying the physical state of each bursting system, including disk and stellar properties, is essential. Furthermore, given the increasing number of monitoring surveys, statistical approaches will play an ever more important role, allowing for consideration of the time between events of various burst strength and whether there is a quasi-repeatability. Within these surveys, the more routine low-amplitude variable accretion, especially the years-to-decades-long secular component, may be as important to monitor as the rare bursts and outbursts.
5.4 What Are the Best Practices for Classifying YSO Bursts and Outbursts?
In the era of all-sky photometric monitoring at multiple wavelengths, the literature is full of discoveries of large-amplitude photometric changes. Automated techniques for identifying YSO outbursts in real time, as well as machine-learning efforts to distinguish them from other families of events, are improving. While progress has been made in the latter (Richards et al., 2012; Jayasinghe et al., 2019; van Roestel et al., 2021; Sánchez-Sáez et al., 2021), the aperiodic nature of YSO variability means that these sources lack patterns in their lightcurves that are similar from object to object, and hence YSOs can easily wind up in the “junk pile.”
Figure 3 highlights that different physical mechanisms may cause variability with similar amplitudes and timescales. Disentangling the physical reason behind the observed photometric changes is not a trivial task. To properly interpret these and assess the significance of each discovery, here we recommend several best practices.
Spectroscopic follow-up is essential. Spectra are required to understand disk and accretion physics, especially at high resolution, where the gas kinematics can be probed. They allow us to distinguish between FU Ori outbursts and variability of lesser amplitude. In the optical and near IR, spectra of young stars tell us primarily about gas temperature. For normally accreting pre-main sequence stars, optical/infrared spectra usually show a stellar photosphere in absorption, plus a superposed continuum and emission lines due to the accretion component. As the accretion rate increases, the spectrum is swamped by the accretion component, so it becomes impossible to detect the photospheric absorption component. In extreme outbursts, with very high accretion rates implying very high luminosities, the observed spectrum becomes that of the hot inner disk, which is in absorption.
In addition to spectroscopic follow-up, near- and mid-infrared interferometry will also be powerful approaches to resolving circumstellar disks at all scales, down to nearly the stellar surface. Such techniques may help relate the inner disk structure to the origin of outbursts.
The importance of spectra illustrates why the variability of optically revealed sources is better understood than that of deeply embedded sources. Photometric and spectroscopic monitoring of the youngest accreting protostars is not yet possible with the cadences available for more evolved ones (or at all), and our understanding of the accretion physics is of necessity less well developed. Spectroscopic capabilities will improve with time, but the requisite information about the most extincted or deeply embedded YSOs may be inaccessible for the foreseeable future.
Besides acquiring and carefully interpreting spectra, additional best practices include investigation into the availability of archival spectroscopic and photometric data. Understanding whether the object has a history of dramatic variability can put the observed burst/outburst in context. It is also important to look at variability across wavelength regimes and whether multiwavelength variability is correlated or uncorrelated. Can a change in extinction be ruled out in favor of a genuine increase in the luminosity?
As noted above, the FU Ori and EX Lup categories are not sufficient to cover all cases of bursting YSOs. Detected outbursts, particularly among protostars, have a broad range of amplitudes, durations, and recurrence timescales, many intermediate to these two cases. Thus, when describing individual sources, the best practice may be for authors to use the more general terms “burst” or “outburst” instead of assigning specific classifications and to carefully describe their selection criteria, when describing searches, or source properties, when describing individual objects. Astronomers are impatient people who are driven to classify. For evaluating the nature of new outbursts, the best practice may be to wait for more data in spite of our impatience. Since the brightening of FU Ori over 85 years ago, we have made some progress in connecting empirical phenomena to physical processes, but there is still much to learn.
6 SUMMARY
We close by emphasizing the main points from our review. First, the critical parameter to determine for each burst is : How much mass was accreted? Second, we must look beyond protostellar luminosities to make additional progress on understanding how stars accrete their masses. Third, traditional classification schemes are imprecise, and members assigned to a given category typically display a surprising range of luminosities, lightcurves, and spectra. Spectroscopy is essential for distinguishing between FU Ori outbursts and variability of lesser amplitude. Fourth, the largest bursts detected in the mid IR generally have smaller amplitudes than the largest bursts detected in the optical. The reason for this and its implications for derived outburst rates are topics for ongoing study. Finally, to further develop our understanding of stellar mass assembly via variable accretion, observers need to carefully monitor individual (out)bursts while also undertaking a systematic investigation into the full range of accretion variability phenomena, while theorists must continue to work toward more precise observational diagnostics.
Acknowledgements.
This project has received funding from the European Research Council (ERC) under the European Union’s Horizon 2020 research and innovation programme under grant agreement No. 716155 (SACCRED). DJ is supported by NRC Canada and by an NSERC Discovery Grant. GJH is supported by the National Natural Science Foundation of China grant 12173003.References
- Ábrahám et al. (2009) Ábrahám P. et al., 2009 Nature, 459, 7244, 224.
- Ábrahám et al. (2019) Ábrahám P. et al., 2019 ApJ, 887, 2, 156.
- Acosta-Pulido et al. (2007) Acosta-Pulido J. A. et al., 2007 AJ, 133, 5, 2020.
- Alencar et al. (2012) Alencar S. H. P. et al., 2012 A&A, 541, A116.
- Anderl et al. (2020) Anderl S. et al., 2020 A&A, 643, A123.
- Ansdell et al. (2016) Ansdell M. et al., 2016 ApJ, 816, 2, 69.
- Armitage (2015) Armitage P. J., 2015 arXiv e-prints, arXiv:1509.06382.
- Armitage (2016) Armitage P. J., 2016 ApJ, 833, 2, L15.
- Armitage et al. (2001) Armitage P. J. et al., 2001 MNRAS, 324, 3, 705.
- Aspin and Reipurth (2003) Aspin C. and Reipurth B., 2003 AJ, 126, 6, 2936.
- Aspin et al. (2010) Aspin C. et al., 2010 ApJ, 719, 1, L50.
- Audard et al. (2014) Audard M. et al., 2014 Protostars and Planets VI (H. Beuther, R. S. Klessen, C. P. Dullemond, and T. Henning), p. 387.
- Bae et al. (2014) Bae J. et al., 2014 ApJ, 795, 1, 61.
- Bae et al. (2015) Bae J. et al., 2015 ApJ, 805, 1, 15.
- Baek et al. (2020) Baek G. et al., 2020 ApJ, 895, 1, 27.
- Bai (2011) Bai X.-N., 2011 ApJ, 739, 1, 50.
- Bai (2017) Bai X.-N., 2017 ApJ, 845, 1, 75.
- Banzatti et al. (2015) Banzatti A. et al., 2015 ApJ, 798, 1, L16.
- Benisty et al. (2010) Benisty M. et al., 2010 A&A, 517, L3.
- Bianchi et al. (2020) Bianchi E. et al., 2020 MNRAS, 498, 1, L87.
- Blinova et al. (2016) Blinova A. A. et al., 2016 MNRAS, 459, 3, 2354.
- Bouvier et al. (2007) Bouvier J. et al., 2007 A&A, 463, 3, 1017.
- Bouvier et al. (2013) Bouvier J. et al., 2013 A&A, 557, A77.
- Briceño et al. (2004) Briceño C. et al., 2004 ApJ, 606, 2, L123.
- Burns et al. (2016) Burns R. A. et al., 2016 MNRAS, 460, 1, 283.
- Burns et al. (2020) Burns R. A. et al., 2020 Nature Astronomy, 4, 506.
- Campbell-White et al. (2021) Campbell-White J. et al., 2021 MNRAS, 507, 3, 3331.
- Caratti o Garatti et al. (2011) Caratti o Garatti A. et al., 2011 A&A, 526, L1.
- Caratti o Garatti et al. (2017) Caratti o Garatti A. et al., 2017 Nature Physics, 13, 3, 276.
- Chen et al. (2021) Chen Z. et al., 2021 ApJ, 922, 1, 90.
- Cieza et al. (2018) Cieza L. A. et al., 2018 MNRAS, 474, 4, 4347.
- Clarke et al. (2005) Clarke C. et al., 2005 MNRAS, 361, 3, 942.
- Cody and Hillenbrand (2010) Cody A. M. and Hillenbrand L. A., 2010 ApJS, 191, 2, 389.
- Cody et al. (2014) Cody A. M. et al., 2014 AJ, 147, 4, 82.
- Cody et al. (2017) Cody A. M. et al., 2017 ApJ, 836, 1, 41.
- Connelley and Reipurth (2018) Connelley M. S. and Reipurth B., 2018 ApJ, 861, 2, 145.
- Contreras Peña et al. (2017a) Contreras Peña C. et al., 2017a MNRAS, 465, 3, 3011.
- Contreras Peña et al. (2017b) Contreras Peña C. et al., 2017b MNRAS, 465, 3, 3039.
- Contreras Peña et al. (2019) Contreras Peña C. et al., 2019 MNRAS, 486, 4, 4590.
- Contreras Peña et al. (2020) Contreras Peña C. et al., 2020 MNRAS, 495, 4, 3614.
- Costigan et al. (2014) Costigan G. et al., 2014 MNRAS, 440, 4, 3444.
- Covey et al. (2011) Covey K. R. et al., 2011 AJ, 141, 2, 40.
- Covey et al. (2021) Covey K. R. et al., 2021 AJ, 161, 2, 61.
- Dahm and Hillenbrand (2020) Dahm S. E. and Hillenbrand L. A., 2020 AJ, 160, 6, 278.
- D’Angelo and Spruit (2012) D’Angelo C. R. and Spruit H. C., 2012 MNRAS, 420, 1, 416.
- Davies (2019) Davies C. L., 2019 MNRAS, 484, 2, 1926.
- Desch and Turner (2015) Desch S. J. and Turner N. J., 2015 ApJ, 811, 2, 156.
- Dodin et al. (2016) Dodin A. V. et al., 2016 Astronomy Letters, 42, 1, 29.
- Dunham and Vorobyov (2012) Dunham M. M. and Vorobyov E. I., 2012 ApJ, 747, 1, 52.
- Dunham et al. (2014) Dunham M. M. et al., 2014 Protostars and Planets VI (H. Beuther, R. S. Klessen, C. P. Dullemond, and T. Henning), p. 195.
- Dunham et al. (2015) Dunham M. M. et al., 2015 ApJS, 220, 1, 11.
- Elias (1978) Elias J. H., 1978 ApJ, 223, 859.
- Ellerbroek et al. (2014) Ellerbroek L. E. et al., 2014 A&A, 563, A87.
- Enoch et al. (2009) Enoch M. L. et al., 2009 ApJ, 692, 2, 973.
- Espaillat et al. (2011) Espaillat C. et al., 2011 ApJ, 728, 1, 49.
- Espaillat et al. (2021) Espaillat C. C. et al., 2021 Nature, 597, 7874, 41.
- Evans et al. (2009) Evans Neal J. I. et al., 2009 ApJS, 181, 2, 321.
- Fischer and Hillenbrand (2017) Fischer W. J. and Hillenbrand L., 2017 The Astronomer’s Telegram, 9969, 1.
- Fischer et al. (2012) Fischer W. J. et al., 2012 ApJ, 756, 1, 99.
- Fischer et al. (2017) Fischer W. J. et al., 2017 ApJ, 840, 2, 69.
- Fischer et al. (2019) Fischer W. J. et al., 2019 ApJ, 872, 2, 183.
- Flaherty et al. (2016) Flaherty K. M. et al., 2016 ApJ, 833, 1, 104.
- Flock et al. (2017) Flock M. et al., 2017 ApJ, 835, 2, 230.
- Frank et al. (2014) Frank A. et al., 2014 Protostars and Planets VI (H. Beuther, R. S. Klessen, C. P. Dullemond, and T. Henning), p. 451.
- Frimann et al. (2017) Frimann S. et al., 2017 A&A, 602, A120.
- Gammie (1996) Gammie C. F., 1996 ApJ, 457, 355.
- Garufi et al. (2019) Garufi A. et al., 2019 A&A, 628, A68.
- Giannini et al. (2020) Giannini T. et al., 2020 A&A, 637, A83.
- Greene et al. (2008) Greene T. P. et al., 2008 AJ, 135, 4, 1421.
- Gregory and Donati (2011) Gregory S. G. and Donati J. F., 2011 Astronomische Nachrichten, 332, 1027.
- Grosso et al. (2020) Grosso N. et al., 2020 A&A, 638, L4.
- Guarcello et al. (2019) Guarcello M. G. et al., 2019 A&A, 628, A74.
- Guo et al. (2018) Guo Z. et al., 2018 ApJ, 852, 1, 56.
- Guo et al. (2020) Guo Z. et al., 2020 MNRAS, 492, 1, 294.
- Hackstein et al. (2015) Hackstein M. et al., 2015 A&A, 582, L12.
- Harris and Beichman (1980) Harris S. and Beichman C., 1980 The formation of a T Tauri star: Observations of the infrared source in L 1551, NASA STI/Recon Technical Report N.
- Hartmann and Kenyon (1985) Hartmann L. and Kenyon S. J., 1985 ApJ, 299, 462.
- Hartmann and Kenyon (1996) Hartmann L. and Kenyon S. J., 1996 ARA&A, 34, 207.
- Hartmann et al. (2016) Hartmann L. et al., 2016 ARA&A, 54, 135.
- Heiderman and Evans (2015) Heiderman A. and Evans Neal J. I., 2015 ApJ, 806, 2, 231.
- Herbig (1989) Herbig G. H., 1989 European Southern Observatory Conference and Workshop Proceedings, vol. 33 of European Southern Observatory Conference and Workshop Proceedings, pp. 233–246.
- Herbig (1990) Herbig G. H., 1990 ApJ, 360, 639.
- Herbig (2008) Herbig G. H., 2008 AJ, 135, 2, 637.
- Herbig et al. (2003) Herbig G. H. et al., 2003 ApJ, 595, 1, 384.
- Herbst et al. (1994) Herbst W. et al., 1994 AJ, 108, 1906.
- Herczeg et al. (2016) Herczeg G. J. et al., 2016 ApJ, 831, 2, 133.
- Herczeg et al. (2019) Herczeg G. J. et al., 2019 ApJ, 878, 2, 111.
- Hillenbrand and Findeisen (2015) Hillenbrand L. A. and Findeisen K. P., 2015 ApJ, 808, 1, 68.
- Hillenbrand and Rodriguez (2022) Hillenbrand L. A. and Rodriguez A. C., 2022 Research Notes of the American Astronomical Society, 6, 1, 6.
- Hillenbrand et al. (2013) Hillenbrand L. A. et al., 2013 AJ, 145, 3, 59.
- Hillenbrand et al. (2018) Hillenbrand L. A. et al., 2018 ApJ, 869, 2, 146.
- Hillenbrand et al. (2019a) Hillenbrand L. A. et al., 2019a AJ, 158, 6, 240.
- Hillenbrand et al. (2019b) Hillenbrand L. A. et al., 2019b ApJ, 874, 1, 82.
- Hodapp et al. (2012) Hodapp K. W. et al., 2012 ApJ, 744, 56.
- Hodapp et al. (2019) Hodapp K. W. et al., 2019 AJ, 158, 6, 241.
- Hodapp et al. (2020) Hodapp K. W. et al., 2020 AJ, 160, 4, 164.
- Hsieh et al. (2019) Hsieh T.-H. et al., 2019 ApJ, 884, 2, 149.
- Hunter et al. (2017) Hunter T. R. et al., 2017 ApJ, 837, 2, L29.
- Jayasinghe et al. (2019) Jayasinghe T. et al., 2019 MNRAS, 486, 2, 1907.
- Johnstone et al. (2013) Johnstone D. et al., 2013 ApJ, 765, 133.
- Johnstone et al. (2018) Johnstone D. et al., 2018 ApJ, 854, 1, 31.
- Jørgensen et al. (2015) Jørgensen J. K. et al., 2015 A&A, 579, A23.
- Jørgensen et al. (2020) Jørgensen J. K. et al., 2020 ARA&A, 58, 727.
- Juhász et al. (2012) Juhász A. et al., 2012 ApJ, 744, 2, 118.
- Kadam et al. (2019) Kadam K. et al., 2019 ApJ, 882, 2, 96.
- Kadam et al. (2020) Kadam K. et al., 2020 ApJ, 895, 1, 41.
- Kenyon and Hartmann (1995) Kenyon S. J. and Hartmann L., 1995 ApJS, 101, 117.
- Kenyon et al. (1988) Kenyon S. J. et al., 1988 ApJ, 325, 231.
- Kenyon et al. (1990) Kenyon S. J. et al., 1990 AJ, 99, 869.
- Kenyon et al. (1994) Kenyon S. J. et al., 1994 AJ, 108, 251.
- Kenyon et al. (2000) Kenyon S. J. et al., 2000 ApJ, 531, 2, 1028.
- Kesseli et al. (2016) Kesseli A. Y. et al., 2016 ApJ, 828, 1, 42.
- Kopatskaya et al. (2013) Kopatskaya E. N. et al., 2013 MNRAS, 434, 1, 38.
- Kóspál et al. (2007) Kóspál Á. et al., 2007 A&A, 470, 1, 211.
- Kóspál et al. (2008) Kóspál Á. et al., 2008 MNRAS, 383, 3, 1015.
- Kóspál et al. (2011) Kóspál Á. et al., 2011 A&A, 527, A133.
- Kóspál et al. (2013) Kóspál Á. et al., 2013 A&A, 551, A62.
- Kóspál et al. (2016) Kóspál Á. et al., 2016 A&A, 596, A52.
- Kóspál et al. (2017a) Kóspál Á. et al., 2017a A&A, 597, L10.
- Kóspál et al. (2017b) Kóspál Á. et al., 2017b ApJ, 843, 1, 45.
- Kóspál et al. (2021) Kóspál Á. et al., 2021 ApJS, 256, 2, 30.
- Kraus et al. (2016) Kraus S. et al., 2016 MNRAS, 462, 1, L61.
- Kristensen and Dunham (2018) Kristensen L. E. and Dunham M. M., 2018 A&A, 618, A158.
- Kryukova et al. (2012) Kryukova E. et al., 2012 AJ, 144, 2, 31.
- Kuffmeier et al. (2018) Kuffmeier M. et al., 2018 MNRAS, 475, 2, 2642.
- Labdon et al. (2021) Labdon A. et al., 2021 A&A, 646, A102.
- Lee (2007) Lee J.-E., 2007 Journal of Korean Astronomical Society, 40, 83.
- Lee et al. (2019) Lee J.-E. et al., 2019 Nature Astronomy, 3, 314.
- Lee et al. (2021a) Lee J.-E. et al., 2021a ApJ, 916, 2, L20.
- Lee et al. (2020) Lee Y.-H. et al., 2020 ApJ, 903, 1, 5.
- Lee et al. (2021b) Lee Y.-H. et al., 2021b ApJ, 920, 2, 119.
- Lesur et al. (2015) Lesur G. et al., 2015 A&A, 582, L9.
- Lesur (2021) Lesur G. R. J., 2021 A&A, 650, A35.
- Liu et al. (2018) Liu H. B. et al., 2018 A&A, 612, A54.
- Loomis et al. (2017) Loomis R. A. et al., 2017 ApJ, 840, 1, 23.
- Lorenzetti et al. (2009) Lorenzetti D. et al., 2009 ApJ, 693, 2, 1056.
- Lucas et al. (2020) Lucas P. W. et al., 2020 MNRAS, 499, 2, 1805.
- MacFarlane et al. (2019) MacFarlane B. et al., 2019 MNRAS, 487, 4, 5106.
- MacLeod et al. (2018) MacLeod G. C. et al., 2018 MNRAS, 478, 1, 1077.
- Magakian et al. (2019) Magakian T. Y. et al., 2019 A&A, 625, A13.
- Mairs et al. (2017) Mairs S. et al., 2017 ApJ, 849, 2, 107.
- Maksimova et al. (2020) Maksimova L. A. et al., 2020 Astronomy Reports, 64, 10, 815.
- Manara et al. (2019) Manara C. F. et al., 2019 A&A, 631, L2.
- Manara et al. (2021) Manara C. F. et al., 2021 A&A, 650, A196.
- Martin and Lubow (2011) Martin R. G. and Lubow S. H., 2011 ApJ, 740, 1, L6.
- McGinnis et al. (2015) McGinnis P. T. et al., 2015 A&A, 577, A11.
- McKee and Offner (2010) McKee C. F. and Offner S. S. R., 2010 ApJ, 716, 1, 167.
- Mendigutía et al. (2013) Mendigutía I. et al., 2013 ApJ, 776, 1, 44.
- Miller et al. (2011) Miller A. A. et al., 2011 ApJ, 730, 2, 80.
- Molyarova et al. (2018) Molyarova T. et al., 2018 ApJ, 866, 1, 46.
- Morales-Calderón et al. (2011) Morales-Calderón M. et al., 2011 ApJ, 733, 1, 50.
- Mosoni et al. (2013) Mosoni L. et al., 2013 A&A, 552, A62.
- Muñoz and Lai (2016) Muñoz D. J. and Lai D., 2016 ApJ, 827, 1, 43.
- Mulders et al. (2017) Mulders G. D. et al., 2017 ApJ, 847, 1, 31.
- Muzerolle et al. (2013) Muzerolle J. et al., 2013 Nature, 493, 7432, 378.
- Myers (2009) Myers P. C., 2009 ApJ, 706, 2, 1341.
- Myers (2010) Myers P. C., 2010 ApJ, 714, 2, 1280.
- Ninan et al. (2013) Ninan J. P. et al., 2013 ApJ, 778, 2, 116.
- Ninan et al. (2015) Ninan J. P. et al., 2015 ApJ, 815, 1, 4.
- Nony et al. (2020) Nony T. et al., 2020 A&A, 636, A38.
- Offner and McKee (2011) Offner S. S. R. and McKee C. F., 2011 ApJ, 736, 1, 53.
- Okoda et al. (2018) Okoda Y. et al., 2018 ApJ, 864, 2, L25.
- Park et al. (2020) Park S. et al., 2020 ApJ, 900, 1, 36.
- Park et al. (2021a) Park S. et al., 2021a ApJ, 923, 2, 171.
- Park et al. (2021b) Park W. et al., 2021b ApJ, 920, 2, 132.
- Pavlyuchenkov et al. (2020) Pavlyuchenkov Y. N. et al., 2020 Astronomy Reports, 64, 1, 1.
- Petrov et al. (2015) Petrov P. P. et al., 2015 A&A, 577, A73.
- Plunkett et al. (2015) Plunkett A. L. et al., 2015 Nature, 527, 7576, 70.
- Pouilly et al. (2021) Pouilly K. et al., 2021 A&A, 656, A50.
- Rab et al. (2017) Rab C. et al., 2017 A&A, 604, A15.
- Rebull et al. (2014) Rebull L. M. et al., 2014 AJ, 148, 5, 92.
- Rebull et al. (2015) Rebull L. M. et al., 2015 AJ, 150, 6, 175.
- Reipurth (1989) Reipurth B., 1989 Nature, 340, 6228, 42.
- Reipurth and Krautter (1983) Reipurth B. and Krautter J., 1983 IAU Circ., 3823, 1.
- Reipurth et al. (2002) Reipurth B. et al., 2002 AJ, 124, 4, 2194.
- Reipurth et al. (2012) Reipurth B. et al., 2012 ApJ, 748, 1, L5.
- Rice et al. (2015) Rice T. S. et al., 2015 AJ, 150, 4, 132.
- Richards et al. (2012) Richards J. W. et al., 2012 ApJS, 203, 2, 32.
- Rigliaco et al. (2020) Rigliaco E. et al., 2020 A&A, 641, A33.
- Rigon et al. (2017) Rigon L. et al., 2017 MNRAS, 465, 4, 3889.
- Robinson and Espaillat (2019) Robinson C. E. and Espaillat C. C., 2019 ApJ, 874, 2, 129.
- Robinson et al. (2021) Robinson C. E. et al., 2021 ApJ, 908, 1, 16.
- Rodriguez and Hillenbrand (2022) Rodriguez A. C. and Hillenbrand L. A., 2022 ApJ, 927, 144.
- Rodriguez et al. (2017) Rodriguez J. E. et al., 2017 ApJ, 848, 2, 97.
- Roggero et al. (2021) Roggero N. et al., 2021 A&A, 651, A44.
- Romanova et al. (2012) Romanova M. M. et al., 2012 MNRAS, 421, 1, 63.
- Rosotti et al. (2017) Rosotti G. P. et al., 2017 MNRAS, 468, 2, 1631.
- Safron et al. (2015) Safron E. J. et al., 2015 ApJ, 800, L5.
- Sánchez-Sáez et al. (2021) Sánchez-Sáez P. et al., 2021 AJ, 161, 3, 141.
- Scholz et al. (2013) Scholz A. et al., 2013 MNRAS, 430, 4, 2910.
- Semkov et al. (2010) Semkov E. H. et al., 2010 A&A, 523, L3.
- Sergison et al. (2020) Sergison D. J. et al., 2020 MNRAS, 491, 4, 5035.
- Sicilia-Aguilar et al. (2012) Sicilia-Aguilar A. et al., 2012 A&A, 544, A93.
- Sicilia-Aguilar et al. (2015) Sicilia-Aguilar A. et al., 2015 A&A, 580, A82.
- Sicilia-Aguilar et al. (2017) Sicilia-Aguilar A. et al., 2017 A&A, 607, A127.
- Sicilia-Aguilar et al. (2020) Sicilia-Aguilar A. et al., 2020 A&A, 643, A29.
- Siess et al. (2000) Siess L. et al., 2000 A&A, 358, 593.
- Sipos et al. (2009) Sipos N. et al., 2009 A&A, 507, 2, 881.
- Siwak et al. (2018) Siwak M. et al., 2018 A&A, 618, A79.
- Siwak et al. (2020) Siwak M. et al., 2020 A&A, 644, A135.
- Sousa et al. (2016) Sousa A. P. et al., 2016 A&A, 586, A47.
- Sousa et al. (2021) Sousa A. P. et al., 2021 A&A, 649, A68.
- Stauffer et al. (2014) Stauffer J. et al., 2014 AJ, 147, 4, 83.
- Stauffer et al. (2015) Stauffer J. et al., 2015 AJ, 149, 4, 130.
- Stauffer et al. (2016) Stauffer J. et al., 2016 AJ, 151, 3, 60.
- Stecklum et al. (2021) Stecklum B. et al., 2021 A&A, 646, A161.
- Sugiyama et al. (2019) Sugiyama K. et al., 2019 The Astronomer’s Telegram, 12446, 1.
- Szabó et al. (2021) Szabó Z. M. et al., 2021 ApJ, 917, 2, 80.
- Szabó et al. (2022) Szabó Z. M. et al., 2022 ApJ, 936, 1, 64.
- Szegedi-Elek et al. (2020) Szegedi-Elek E. et al., 2020 ApJ, 899, 2, 130.
- Takasao et al. (2019) Takasao S. et al., 2019 ApJ, 878, 1, L10.
- Taquet et al. (2016) Taquet V. et al., 2016 ApJ, 821, 1, 46.
- Tobin et al. (2020) Tobin J. J. et al., 2020 ApJ, 905, 2, 162.
- Tofflemire et al. (2017) Tofflemire B. M. et al., 2017 ApJ, 842, 2, L12.
- Trimble (1976) Trimble V., 1976 QJRAS, 17, 25.
- Uchiyama and Ichikawa (2019) Uchiyama M. and Ichikawa K., 2019 ApJ, 883, 1, 6.
- van Roestel et al. (2021) van Roestel J. et al., 2021 AJ, 161, 6, 267.
- van ’t Hoff et al. (2018) van ’t Hoff M. L. R. et al., 2018 ApJ, 864, 1, L23.
- Vazzano et al. (2021) Vazzano M. M. et al., 2021 A&A, 648, A41.
- Venuti et al. (2015) Venuti L. et al., 2015 A&A, 581, A66.
- Venuti et al. (2021) Venuti L. et al., 2021 AJ, 162, 3, 101.
- Visser et al. (2015) Visser R. et al., 2015 A&A, 577, A102.
- Vorobyov et al. (2018) Vorobyov E. I. et al., 2018 A&A, 613, A18.
- Vorobyov et al. (2021) Vorobyov E. I. et al., 2021 A&A, 647, A44.
- Wenzel and Gessner (1975) Wenzel W. and Gessner H., 1975 Zentralinstitut fuer Astrophysik Sternwarte Sonneberg Mitteilungen ueber Veraenderliche Sterne, 7, 23.
- Wolk et al. (2015) Wolk S. J. et al., 2015 AJ, 150, 5, 145.
- Wolk et al. (2018) Wolk S. J. et al., 2018 AJ, 155, 2, 99.
- Yoo et al. (2017) Yoo H. et al., 2017 ApJ, 849, 69.
- Yoon et al. (2022) Yoon S.-Y. et al., 2022 ApJ, 929, 1, 60.
- Zakri et al. (2022) Zakri W. et al., 2022 ApJ, 924, 2, L23.
- Zhang et al. (2019) Zhang Y. et al., 2019 ApJ, 883, 1, 1.
- Zhu et al. (2009) Zhu Z. et al., 2009 ApJ, 694, 2, 1045.
- Zhu et al. (2010) Zhu Z. et al., 2010 ApJ, 713, 2, 1134.
- Zsidi et al. (2019) Zsidi G. et al., 2019 ApJ, 873, 2, 130.
- Zsidi et al. (2022) Zsidi G. et al., 2022 A&A, 660, A108.