The Origin and Evolution of Multiple Star Systems
Abstract
Observational advances over the last decade have enabled high-resolution, interferometric studies of forming multiple systems, statistical surveys of multiplicity in star-forming regions, and new insights into disk evolution and planetary architectures in these systems. In this review, we compile the results of observational and theoretical studies of stellar multiplicity. We summarize the population statistics spanning system evolution from the protostellar phase through the main-sequence phase and evaluate the influence of the local environment. In short, most stars are born in multiple stellar systems, most main sequence stars are members of multiple systems, but most star systems are single. We describe current models for the origin of stellar multiplicity and review the landscape of numerical simulations and evaluate their consistency with observations. We review the properties of disks and discuss the impact of multiplicity on planet formation and system architectures. Finally, we summarize open questions
and discuss the technical requirements for future observational and theoretical progress.
captionbox \restoresymbolCAPTIONBOXcaptionbox
1 INTRODUCTION
The formation of multiple star systems – systems of two or more gravitationally bound stars with separations pc – takes place during the earliest phases of star formation. The majority of such systems form and evolve to their final configuration during the time period spanned by the collapse of dense cores through the end of mass accretion. This review summarizes the current statistics of multiple stars, describes theoretical models and observational evidence for different modes of multiple star formation, and discusses the implications for planet formation and system evolution.
Studying multiple formation has historically been challenging from several perspectives. Dust in star-forming regions absorbs short-wavelengths of light and re-emits at longer wavelengths, requiring high-resolution, radio observations to detect forming stars. Theoretical models, meanwhile, require both large dynamic range (1 au -10 pc) and treatment of non-linear, complex physical processes, including turbulence, radiative feedback, and magnetic effects. Consequently, when the last Protostars and Planets conference occurred in 2013, the mechanisms for multiple formation were largely theoretical and the properties of young multiple systems were poorly constrained.
At that time a major expansion of the Very Large Array (VLA) had just concluded, and only the first cycle of observations by the Atacama Large Millimeter/submillimeter Array (ALMA) had been taken. Since then, the power of these telescopes has revolutionized our understanding of young forming multiples, and stunningly detailed images of disks have provided a comprehensive understanding of the impact of binaries on disks, both in a statistical sense and within individual multiple systems. Meanwhile large-scale, uniform surveys of star-forming regions, clusters, and field stars have generated new insights into the statistics of stellar multiplicity and its dependence on mass, age, metallicity, and cluster density. For already-formed planetary systems, radial velocity (RV) and high-resolution imaging surveys of Kepler and TESS planet hosts have recently revealed that binaries substantially sculpt planet formation, shedding new light on planet formation and migration models. Computational advances in speed and methodology have enabled studies of multiple star formation that span an unprecedented dynamic range, model different star cluster environments, and explore the role of multiple physical effects acting in concert. There is now consensus that most stars both form and reside on the main sequence with at least one stellar companion: single stars are the exception not the rule.
This review begins by introducing key definitions and summarizing the statistics of observed multiple star systems (§2), with a special focus on their configuration and properties at the end of the star formation process. We then proceed with an overview of theoretical models describing the origin and early evolution of multiple star systems in §3. Using the framework of these models, in §4 we examine protostellar multiple systems, assessing how well they confirm or refute theoretical expectations. In §5 we discuss the impact of stellar multiplicity on planet formation and system architectures. §6 summarizes remaining open questions and discusses observational and theoretical prospects for enhancing the understanding of multiple systems over the coming decade. We conclude in §7.
2 OBSERVED STELLAR MULTIPLICITY
Observations show that stellar multiplicity evolves substantially during formation and changes more slowly thereafter. In order to distinguish between primordial multiplicity, the results of dynamical evolution, and the final system configurations for main-sequence (MS) field stars, we separately consider the multiplicity of very young stars, i.e., protostars, and older sources. We adopt the standard convention of grouping young stellar objects (YSOs) according to their spectral energy distribution, i.e., by “Class” as defined by Lada and Wilking (1984) and Adams et al. (1987), whereby younger, more embedded sources have more reddening from an envelope and disk. We caution, however, that the inclination of the source outflow and disk with respect to the line of sight affect the degree of extinction and may shift an older source from a later to an earlier Class or vice versa (Robitaille et al., 2007; Offner et al., 2012a). Thus, while Class provides a rough, if imperfect, measure of sample age it is an unreliable age indicator for individual sources.
In this section, we compile and compare the multiplicity statistics of MS and non-embedded pre-MS stars (mostly Class II/III T Tauri stars) from several surveys (mostly optical and near-IR). These statistics represent the final outcome of the star formation process, providing insight into how stars and planets form and must subsequently evolve, and serve as a critical benchmark for simulations and models. A detailed analysis of embedded Class 0/I binaries observed by the VLA and ALMA is discussed in §4.2.
Many multiplicity properties also vary as a function of the physical distance between sources. In the literature, pair separations are often characterized as “close” or “wide,” however, these terms have no fixed definition. Throughout this review, we define close, intermediate, and wide separations as 10 au, 10 - 300 au and 300 au, respectively, unless otherwise specified.
2.1 Detection Methods and Definitions
No single observational technique provides a complete picture of multiplicity. For MS and T Tauri stars, spectroscopic and eclipsing binaries probe close separations within 10 au (Abt et al., 1990; Latham et al., 2002; Melo, 2003; Sana et al., 2012; Moe et al., 2019; Kounkel et al., 2019). Interferometry, sparse aperture masking, Hubble Space Telescope (HST) imaging, and astrometry reveal binaries across close to intermediate separations of = 1 - 300 au (Reid et al., 2001; Gizis, 2002; Kraus et al., 2008; Raghavan et al., 2010; Dieterich et al., 2012; Rizzuto et al., 2013; Sana et al., 2014; De Furio et al., 2019). Speckle imaging, lucky imaging, and adaptive optics (AO) resolve binaries across intermediate to wide separations of = 10 - 1,000 au (Shatsky and Tokovinin, 2002; Close et al., 2003; Law et al., 2008; Bergfors et al., 2010; Janson et al., 2012; De Rosa et al., 2014; Ward-Duong et al., 2015; Tokovinin and Briceño, 2020). Common proper motion confirms that wide binaries with 300 - 20,000 au are in fact gravitationally bound (Lépine and Bongiorno, 2007; El-Badry and Rix, 2018; Winters et al., 2019; Hartman and Lépine, 2020). Other techniques can identify unresolved binaries, e.g., excess luminosity method or deblending of spectroscopic binaries, but they cannot determine their orbital separations (Hubrig et al., 2001; Bardalez Gagliuffi et al., 2014; Gullikson et al., 2016; Widmark et al., 2018). For volume-limited populations of M-dwarfs (Winters et al., 2019) and solar-type MS stars (Raghavan et al., 2010; Tokovinin, 2014b), the combination of these overlapping techniques provides a 90% complete census of MS companions orbiting the primary.
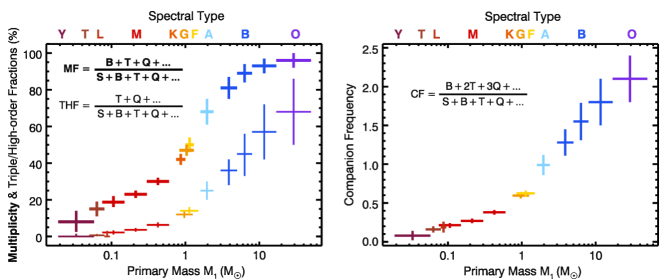
We first define the multiplicity fraction (sometimes called the binary fraction) as the fraction of primaries with at least one companion:
| (1) |
where S, B, T, and Q are the number of single stars, binaries, triples, and quadruples, respectively. Higher ordered multiples are rare but exist, including the two known septuples, AR Cas and Sco, both of which have early-B primaries (Eggleton and Tokovinin, 2008). Similarly, the triple/high-order fraction is:
| (2) |
Meanwhile, the companion frequency is the average frequency of companions per primary:
| (3) |
where is the frequency of companions per decade of orbital separation.
Measurement uncertainties in the multiplicity fraction and triple/high-order fraction follow binomial statistics, while Poisson statistics govern the companion frequency, which can exceed unity (Burgasser et al., 2003; Sana et al., 2014; Moe and Di Stefano, 2017). Here we report multiplicity statistics with respect to volume-limited samples. For magnitude-limited samples, corrections for Malmquist bias, which is sometimes called the Branch bias in the context of binary stars (Branch, 1976), must be applied since unresolved twin binaries are m = 0.75 mag brighter than their single-star counterparts. Systematic uncertainties, such as those associated with correcting for incompleteness, generally dominate the overall error for samples exceeding a few hundred systems. In the following subsections, we compute bias-corrected MF, THF, and CF from various surveys and present the results in Table 1 and Fig. 1.
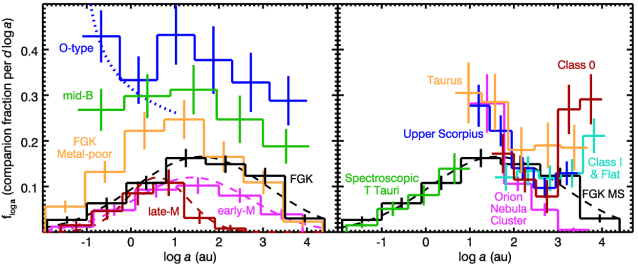
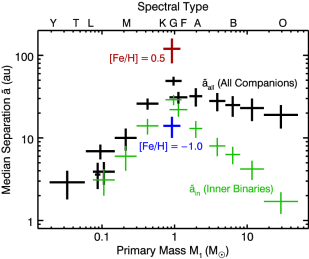
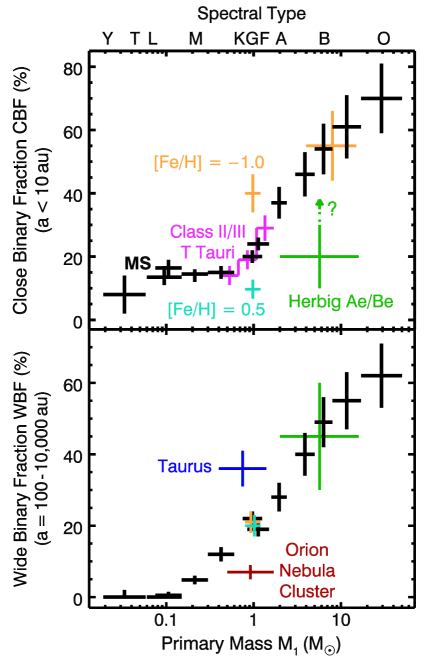
We display the separation distribution of all companions for different stellar populations in Fig. 2. To distinguish the effect of hierarchical triples on the overall separation distribution, we define and as the median separations of all companions and of inner binaries only (excluding outer tertiaries), respectively. Close binaries exhibit different trends with respect to primary mass, mass ratio, metallicity, and environment compared to intermediate and wide separation binaries (see §2.2.7). We therefore define the close binary fraction CBF and wide binary fraction WBF as the fraction of primaries with at least one companion below 10 au and across 100 - 10,000 au, respectively. We display both and in Fig. 3 and both CBF and WBF in Fig. 4 as a function of primary mass and other stellar parameters.
The minimum companion mass or mass ratio = / included in reported multiplicity statistics varies from survey to survey, but typically brown dwarf (BD) primaries include all BD companions, FGKM-dwarfs include only MS companions above 0.075, and OBA stars include MS companions above 0.1. About 20% of companions within 10 au of AFG primaries are white dwarfs (WDs; Moe and Di Stefano 2017; Murphy et al. 2018), and nearly 30% of OB stars are the products of binary evolution (de Mink et al., 2013). In order to compare field MS multiplicity statistics to their pre-MS counterparts, we exclude evolved stars or systems with WD companions when possible.
| CBF (%) | WBF (%) | |||||||||||
|---|---|---|---|---|---|---|---|---|---|---|---|---|
| Survey | () | N | MF (%) | THF (%) | CF | 10 au | = 102 - 104 au | (au) | (au) | 1 au | = 1 - 102 au | 102 au |
| Fontanive et al. (2018) | 0.019 - 0.058 | 47 | 8 6 | 2 | 0.08 0.06 | 8 6 | 2 | 2.9 1.1 | - | - | 4.8 2.2 | - |
| Burgasser (2007) | 0.05 - 0.08 | 162 | 15 4a | 0.6 0.3 | 0.16 0.04a | - | - | - | - | - | - | - |
| Close et al. (2003) | 0.080 - 0.095 | 39 | 19 7a | 3 | 0.19 0.07a | 16 6 | 3 | 3.7 1.3 | - | - | 3.3 1.2 | - |
| Allen et al. (2007) | 0.06 - 0.15 | 361 | 20 4 | 1 | 0.20 0.04 | 14 3 | 0.4 | 6.9 1.4 | - | - | 1.7 0.5 | - |
| Winters et al. (2019): 20 pc | 0.075 - 0.15 | 185 | 19 3 | 2.2 1.1 | 0.21 0.03 | 16 3 | 0.5 0.5 | 3.9 1.2 | 3.1 1.1 | - | - | - |
| Winters et al. (2019): 20 pc | 0.15 - 0.30 | 336 | 23 2 | 3.6 1.0 | 0.27 0.03 | 14 2 | 4.8 1.2 | 10 3 | 6 2 | - | 0.7 0.5 | - |
| Winters et al. (2019): 20 pc | 0.3 - 0.6 | 350 | 30 2 | 6.3 1.4 | 0.38 0.03 | 15 2 | 12 2 | 26 4 | 14 3 | - | 0.1 0.4 | - |
| El-Badry et al. (2019): 200 pc | 0.1 - 0.4 | 5,220 | - | - | - | - | - | - | - | - | - | 0.4 0.3 |
| ” | 0.4 - 0.6 | 12,717 | - | - | - | - | - | - | - | - | - | 0.2 0.3 |
| ” | 0.6 - 0.8 | 9,542 | - | - | - | - | - | - | - | - | - | 0.9 0.2 |
| ” | 0.8 - 1.2 | 11,588 | - | - | - | - | - | - | - | - | - | 1.2 0.2 |
| ” | 1.2 - 2.5 | 3,238 | - | - | - | - | - | - | - | - | - | 1.3 0.3 |
| Raghavan et al. (2010): 25 pc | 0.75 - 1.25 | 454 | 46 3 | 12 2 | 0.60 0.04 | 20 2 | 22 2 | 49 6 | 29 4 | 1.5 0.5 | 0.2 0.4 | 1.0 0.4 |
| ” | 0.75 - 1.00 | 323 | 42 3 | - | - | - | - | - | - | - | - | - |
| ” | 1.00 - 1.25 | 131 | 50 4 | - | - | - | - | - | - | - | - | - |
| Tokovinin (2014b): 67 pc | 0.85 - 1.5 | 4,847 | 47 3 | 14 2 | 0.62 0.04 | 24 2 | 19 2 | 31 5 | 22 4 | 1.7 0.5 | 0.4 0.4 | 0.7 0.4 |
| De Rosa et al. (2014): 75 pc | 1.6 - 2.4 | 435 | - | - | - | - | 28 4 | - | - | - | 1.3 0.4 | 2.2 0.4 |
| Murphy et al. (2018) | 1.4 - 2.3 | 2,224 | - | - | - | - | - | - | - | - | 1.1 0.3 | - |
| Moe and Kratter (2021) | 1.6 - 2.4 | - | 68 7 | 25 5 | 0.99 0.13 | 37 5 | - | 32 8 | 13 3 | - | - | - |
| Moe and Di Stefano (2017)b | 3 - 5 | - | 81 6 | 36 8 | 1.28 0.17 | 46 7 | 40 6 | 28 7 | 8 2 | 0.5 0.6 | 1.0 0.5 | 1.3 0.5 |
| Moe and Di Stefano (2017)b | 5 - 8 | - | 89 5 | 45 11 | 1.55 0.24 | 54 8 | 49 7 | 25 7 | 6.3 1.5 | 0.3 0.5 | 1.7 0.5 | 2.2 0.6 |
| Moe and Di Stefano (2017)b | 8 - 17 | - | 93 4 | 57 15 | 1.8 0.3 | 61 10 | 55 8 | 23 7 | 4.2 1.1 | 0.1 0.4 | 1.6 0.5 | 1.9 0.5 |
| Sana et al.c | 17 - 50 | - | 96 4 | 68 18 | 2.1 0.3 | 70 11 | 62 9 | 19 6 | 1.7 0.5 | 0.1 0.5 | 1.4 0.4 | 2.1 0.5 |
Historically, the mass-ratio distribution has been approximated by a single power-law across 0 1, but larger samples indicate that up to three parameters may be required to accurately fit the distributions (Duchêne and Kraus, 2013; Moe and Di Stefano, 2017; El-Badry et al., 2019). For this review, we wish to easily compare trends, even if the samples are small or incomplete toward small mass ratios. We therefore fit a simplified power-law slope across the truncated interval 0.4 1 where all the compiled surveys are complete (see Table 1).
2.2 Multiplicity Statistics versus Primary Mass
2.2.1 FGK dwarfs
Frequencies: About half of field FGK primaries have MS companions, which follow a broad lognormal separation distribution peaking near = 40 au (Duquennoy and Mayor, 1991; Raghavan et al., 2010; Tokovinin, 2014a, see Figs. 1 - 4). In addition to plotting the separation distribution directly from the Raghavan et al. (2010) data in Fig. 2, we also display a lognormal fit to , where the fit parameters are listed in Table 2.
Across close and intermediate separations, the binary fraction of FGK MS stars in young open clusters are consistent with their field MS counterparts (Bouvier et al., 1997; Patience et al., 2002; Elliott et al., 2014; Deacon and Kraus, 2020; Torres et al., 2021). The CBFs measured in old open clusters also match the field values, albeit the cluster cores exhibit a substantial excess of binaries due to mass segregation (Geller and Mathieu, 2012; Geller et al., 2021b). Meanwhile, Gaia observations reveal a deficit of wide binaries in open clusters, especially those with higher stellar densities, which is likely due to dynamical disruptions (Deacon and Kraus, 2020; Niu et al., 2020).
Mass Ratios: The overall mass-ratio distribution of solar-type binaries is roughly uniform, but closer solar-type binaries systematically favor larger mass ratios (Duquennoy and Mayor, 1991; Raghavan et al., 2010; Tokovinin, 2014b; Moe and Di Stefano, 2017). Specifically, FGK binaries across close and intermediate separations exhibit a 30% and 10% excess fraction of twins with 0.95, respectively, relative to the underlying uniform distribution (Lucy and Ricco, 1979; Tokovinin, 2000; Moe and Di Stefano, 2017). These observations suggest that solar-type binaries within 200 au coevolved in a shared mass reservoir, perhaps a circumbinary disk (see §3.2). El-Badry et al. (2019) also found that wide binaries exhibit a very small but statistically significant excess twin fraction, suggesting some wide companions originate from intermediate separations but then subsequently widen dynamically. Aside from the excess twins, solar-type binaries beyond 200 au are skewed toward smaller mass ratios, but their distribution is still top-heavy compared to random pairings drawn from the IMF (Lépine and Bongiorno, 2007; Moe and Di Stefano, 2017; El-Badry et al., 2019).
There is a dearth of BD companions within 0.5 au to solar-type primaries, which is commonly called the BD desert (Grether and Lineweaver, 2006; Csizmadia et al., 2015; Shahaf and Mazeh, 2019). Meanwhile, across intermediate separations, the roughly uniform mass-ratio distribution of solar-type binaries extends down to the BD-planet boundary near = 13 MJ (Wagner et al., 2019; Nielsen et al., 2019). While the multiplicity fractions of MS stars reported in Table 1 exclude BD companions, only 4% of solar-type stars have BD companions, affecting the integrated multiplicity statistics very little.
Eccentricities: Eccentricity distributions are typically referenced to a thermal distribution defined as , where is the probability of given eccentricity (Ambartsumian, 1937; Heggie, 1975). The average of solar-type binaries increases with orbital separation, transitioning from a sub-thermal (smaller eccentricities) to thermal distribution near 200 au and to super-thermal beyond 1,000 au (Tokovinin and Kiyaeva, 2016; Tokovinin, 2020). The closest binaries are impacted by tides. For MS stars with convective envelopes below the Kraft break ( 6,200 K; 1.2 ), binaries are tidally circularized below 8 days; above the Kraft break, only binaries within 2 days are fully circularized (Meibom and Mathieu, 2005; Abt, 2006; Moe and Di Stefano, 2017; Geller et al., 2021b; Zanazzi and Wu, 2021; Torres et al., 2021).
Triple Statistics: About 14% of solar-type primaries are in triples and higher order multiples (Tokovinin, 2014b, see Fig. 1). The closest binaries within days are found almost exclusively () in triples, whereas only a third of binaries with 20 days have tertiary companions (Tokovinin et al., 2006; Laos et al., 2020). Beyond these periods, Tokovinin (2014b) concluded that the joint distribution of inner periods and outer periods is consistent with both companions being independently drawn from the same overall lognormal period distribution for solar-type binaries, but with the added constraint of dynamical stability. Various theoretical studies have proposed slightly different criteria for dynamical stability in triples (Mardling and Aarseth, 2001; Georgakarakos, 2008). Based on their sample of solar-type triples with reliable orbital solutions, Tokovinin (2004) measured an empirical relation:
| (4) |
where is the eccentricity of the outer tertiary.
Tokovinin (2017) examined the relative orbital orientations of visually resolved triples. For outer tertiaries beyond 1,000 au, they found an equal number of prograde and retrograde orbits with respect to the inner binaries, suggesting isotropic orientations. Meanwhile, the majority of compact solar-type triples within 50 au have prograde configurations, demonstrating a high degree of alignment between the inner and outer orbits. Tokovinin (2017) also found tentative evidence that triples become more misaligned with increasing primary mass. Finally, Borkovits et al. (2016) identified a large population of very compact triples with 10 au. All have mutual inclinations within 60∘, about half of which are nearly coplanar with 20∘. We discuss the special implications of triple star statistics for formation models in §3.3.3.
2.2.2 M-dwarfs
Frequencies: Building on the historical work of Fischer and Marcy (1992), many subsequent studies have employed a variety of detection techniques to fill in the multiplicity parameter space of the most common stars in the galaxy (Close et al., 2003; Gizis et al., 2003; Bouy et al., 2003; Daemgen et al., 2007; Law et al., 2008; Bergfors et al., 2010; Janson et al., 2012; Dieterich et al., 2012; Janson et al., 2014; Ward-Duong et al., 2015). By combining previous samples with their own imaging survey, Winters et al. (2019) provided the most complete census of the multiplicity statistics for a 25-pc volume-limited sample of M-dwarfs primaries. We split their sample into three mass intervals and focus on the 20-pc subset that is relatively complete (see their Figs. 19-20 and results in our Table 1). The multiplicity fraction, triple fraction, and median companion separation all increase with primary mass within the M-dwarf regime (see Figs. 1-3). As shown in Fig. 4, the wide binary fraction dramatically increases from 1% to 12% across primary masses 0.1 - 0.5 . In Fig. 2, we plot the separation distribution of early-M ( = 0.4 - 0.6 ) and late-M ( = 0.075 - 0.15 ) binaries from the 20-pc subset of Winters et al. (2019) along with their best-fit lognormal distributions (see Table 2 for parameters).
Winters et al. (2019) excluded both BD and WD companions from their reported multiplicity statistics but kept records of such systems in their sample. The fraction of M-dwarfs within 20 pc that have observed BD companions is only 2%, which increases slightly to 4% after accounting for incompleteness. Whether or not BD companions are included, the multiplicity fraction of late-M dwarfs is lower than that of early-M dwarfs, which in turn is less than that of solar-type primaries.
Mass ratios: Across intermediate separations, early-M binaries follow a roughly uniform mass-ratio distribution, similar to that of solar-type binaries. Meanwhile, mid-M and late-M binaries are skewed substantially toward equal masses, which is not a selection effect due to incompleteness or exclusion of low-mass companions (Close et al., 2003; Law et al., 2008; Dieterich et al., 2012; Janson et al., 2014). Wide companions ( 100 au) to M-dwarfs are skewed toward slightly smaller masses (Ward-Duong et al., 2015; El-Badry et al., 2019), similar to the separation trend observed in solar-type binaries.
| () | (au) | CF | |
|---|---|---|---|
| 0.075 - 0.15 | 4 | 0.7 | 0.21 |
| 0.3 - 0.6 | 25 | 1.3 | 0.38 |
| 0.75 - 1.25 | 40 | 1.5 | 0.60 |
NOTE - Mean and dispersion of lognormal separation distributions scaled to the companion frequency CF integrated across 2.0 log (au) 4.5 as defined in Eqn. 3.
2.2.3 Brown dwarfs
Frequencies: Although completeness corrections become more challenging with decreasing primary mass, surveys confirm that the MF continues to decline through the BD regime (see Table 1 and Fig. 1). The period-integrated MF is roughly 20% for L/early-T dwarfs and only 8% for late-T/early-Y dwarfs (Reid et al., 2001; Close et al., 2002; Burgasser et al., 2003; Bouy et al., 2003; Close et al., 2003; Gizis et al., 2003; Allen et al., 2007; Burgasser, 2007; Aberasturi et al., 2014; Basri and Reiners, 2006; Joergens, 2008; Blake et al., 2010; Hsu et al., 2021; Fontanive et al., 2018). The vast majority of BD binaries have 1 - 20 au. The binary fraction within au is only 4%, and only a handful of systems have been identified at wide separations (Burgasser, 2007; Allen et al., 2007; Joergens, 2008; Radigan et al., 2009; Faherty et al., 2020). The lognormal separation distribution of BD binaries narrowly peaks near = 3 au, similar to that of late-M binaries (see Fig. 3).
Mass Ratios: BD binaries are extremely skewed toward equal masses, i.e., = 2 - 3 for L/early-T binaries (Burgasser et al., 2003; Close et al., 2003; Allen et al., 2007) and possibly up to 5 for late-T/early-Y binaries (Fontanive et al., 2018). These measurements are not biased by incompleteness to smaller mass ratios, nor do they exclude objects below the deuterium burning limit.
2.2.4 A stars
Frequencies: Moving toward earlier spectral types, we find that the trend of an increasing MF with primary mass continues. The wide binary fraction of A-dwarfs is slightly larger than the solar-type value (De Rosa et al., 2014). Early spectroscopic binary studies of A stars focused on their magnetic and chemical peculiar properties (Abt, 1965, 1983). There has been no recent systematic A-dwarf spectroscopic or eclipsing binary survey, but the upcoming Gaia full third data release will soon remedy this (§6.2). Instead, close binary properties of A stars have been inferred from examining Kepler phase modulations of Scuti stars, which are pulsating late-A/early-F MS stars (Murphy et al., 2018). They found an A-dwarf binary fraction of 14% across 0.6 - 3.5 au, double the G-dwarf value across the same separation interval. Since the data remain incomplete, we use an interpolation from Moe and Kratter (2021) to derive the full bias-corrected multiplicity statistics for A-dwarfs across the entire separation range (see Table 1 and Fig. 1).
Mass ratios: Across intermediate separations, A-dwarf binaries peak near = 0.3 and exhibit a very small but statistically significant excess twin fraction (De Rosa et al., 2014; Moe and Di Stefano, 2017; Murphy et al., 2018). Meanwhile, wide A-type binaries are skewed toward even smaller mass ratios but are still slightly top-heavy compared to random pairings drawn from the IMF (De Rosa et al., 2014; Moe and Di Stefano, 2017).
2.2.5 B stars
Frequencies: Building on the groundbreaking work by Abt et al. (1990), surveys of B-stars show binary fractions that continue to rise with primary mass across all orbital separations (Duchêne et al., 2001; Shatsky and Tokovinin, 2002; Roberts et al., 2007; Rizzuto et al., 2013; Moe and Di Stefano, 2015b; Caballero-Nieves et al., 2020; Banyard et al., 2022). Moe and Di Stefano (2017) combined the data from spectroscopy, eclipsing binaries, long-baseline interferometry, and adaptive optics to compute the statistics reported in Table 1. Both the masses and companion frequencies of B stars span a large interval, increasing from CF = 1.1 for 3 primaries to 1.9 for 16 primaries (see Fig. 1).
The overall separation distribution of companions to mid-B stars roughly follows Öpik’s law, i.e., uniform in log (Öpik, 1924; Kouwenhoven et al., 2007; Kobulnicky and Fryer, 2007; Moe and Di Stefano, 2017). Fig. 2 displays for 0.1 companions to 8 mid-B primaries as reported in Moe and Di Stefano (2017). Early-B inner binaries favor shorter separations with a median of 6 au (Rizzuto et al., 2013; Moe and Di Stefano, 2013, see Fig. 3).
Mass ratios: B-type binaries within 1 au follow a uniform mass-ratio distribution (Abt et al., 1990; Kobulnicky et al., 2014). Companions to B-type stars across intermediate separations of = 1 - 100 au peak near 0.3 (Rizzuto et al., 2013; Gullikson et al., 2016; Moe and Di Stefano, 2017), similar to their A-type counterparts. Wide companions to B-type stars are substantially skewed toward small mass ratios ( 2) but with a slight flattening below 0.3 (Abt et al., 1990; Shatsky and Tokovinin, 2002; Moe and Di Stefano, 2017).
2.2.6 O stars
Frequencies: The total multiplicity fraction of O stars in clusters is MF 90% and the companion frequency is CF = 2.1 0.3 above 0.1 (see Figs. 1 - 4). Hence, the majority of O stars are in triples and higher ordered multiples (THF = 68% 18%). As with solar-type stars, these statistics derive from a wide range of survey methods: spectroscopy, interferometry, sparse aperture masking, AO, lucky imaging, and common proper motion (Turner et al., 2008; Mason et al., 2009; Sana et al., 2012; Chini et al., 2012; Kobulnicky et al., 2014; Sota et al., 2014; Sana et al., 2014; Aldoretta et al., 2015; Moe and Di Stefano, 2017; Maíz Apellániz et al., 2019; Caballero-Nieves et al., 2020). Given the high fraction of triples, we display both the total and inner-binary separation distributions in Fig. 2.
The statistics above describe O stars in young clusters. In contrast, the 20% of O stars that are runaway and/or in the field exhibit a lower binary fraction (Mason et al., 2009; Chini et al., 2012; Lamb et al., 2016). The multiplicity statistics of older field and runaway O stars have been altered by dynamical effects and/or binary evolution (Hoogerwerf et al., 2001). Hence, we consider only cluster O stars, which have multiplicity properties more similar to their primordial distributions.
Mass Ratios: Spectroscopic and eclipsing binary surveys of O stars reveal a fairly uniform mass-ratio distribution within 0.5 au but with a small excess twin fraction (Pinsonneault and Stanek, 2006; Sana et al., 2012; Kobulnicky et al., 2014; Moe and Di Stefano, 2017; Shenar et al., 2022). Nonetheless, the excess twin fraction among O-type binaries within 0.5 au is only 10%, which is lower than the 30% excess twin fraction measured among solar-type binaries across the same separation interval (Moe and Di Stefano, 2017). There is no excess twin fraction among O-type binaries beyond 0.5 au (Sana et al., 2012). Similar to early-B binaries, the mass-ratio distribution of O-type binaries beyond 100 au is skewed steeply toward small mass ratios but with a flattening below 0.3 (Sana et al., 2014; Moe and Di Stefano, 2017).
2.2.7 Summary of observed MS trends
The multiplicity fraction increases monotonically with primary mass from MF 20% for BDs and late-M dwarfs to 50% for solar-type stars to MF 90% for OB stars (see Fig. 1). The triple fraction increases even more dramatically from THF 2% for late-M dwarfs to 14% for FGK dwarfs to nearly 70% for O stars. Similarly, the companion frequency is CF = 0.2 for low-mass stars while OB stars have CF 2.0 companions per primary on average.
Figs. 2-4 illustrate the nuances of the separation distribution with respect to primary mass. BD, M-dwarf, and FGK-dwarf binaries follow lognormal separation distributions, where the peak increases from = 3 au for BD and late-M dwarfs to = 40 au for solar-type stars. Meanwhile, companions to OBA stars roughly follow Öpik’s law, albeit inner binary companions to early-B and especially O stars are skewed toward shorter separations, e.g., 2 au. Interestingly, the close binary fraction is nearly constant at CBF = 15% across = 0.05 - 0.8 but then rapidly increases with primary mass, reaching 70% for O stars. Meanwhile, the wide binary fraction increases dramatically from WBF = 1% for late-M stars to 12% for early-M stars, and then continues to moderately increase up to 60% for OB stars. The different trends in the close versus wide binary fractions can help constrain the various binary formation processes that operate on different scales.
The binary mass-ratio distribution becomes skewed toward more unequal masses with increasing primary mass and increasing orbital separation. It is firmly established that BD and late-M binaries intrinsically favor equal masses. We note that some binary populations favor mass-ratio distributions that deviate from a power-law model: close and intermediate-period solar-type binaries follow uniform distributions with a 30% and 10% excess twin fraction, respectively (see §2.2.1), very close O-type binaries follow a uniform distribution with a 10% excess twin fraction (§2.2.6), and intermediate-period companions to BA primaries peak near = 0.3 (§2.2.4-2.2.5). Finally, wide companions to OBA primaries match the slope = 2.35 expected from random pairings drawn from a Salpeter IMF, but only across the truncated interval = 0.4 - 1.0. The mass-ratio distribution flattens below 0.3, so the overall distribution is slightly top-heavy compared to random pairings from the IMF (see §2.2.4-2.2.6). Observed mass-ratio distributions demonstrate that the component masses in close and intermediate-period binaries coevolved during their prior fragmentation and accretion phases, while the components in wide binaries formed mostly, but not fully, independently (see §3).
2.3 Metallicity Dependence
Since PPVI, the field has seen a substantial change in our understanding of the metallicity dependence of binary statistics. Early surveys of metal-poor halo stars measured a spectroscopic binary fraction that is consistent with the disk population (Latham et al., 2002; Carney et al., 2005). However, it is more difficult to detect spectroscopic binary companions to metal-poor stars, which have weaker absorption lines, and so the bias-corrected close binary fraction of halo stars is definitively larger (Moe et al., 2019). There are now several surveys indicating that the close binary fraction of solar-type stars decreases significantly with metallicity (Grether and Lineweaver, 2007; Rastegaev, 2010; Raghavan et al., 2010; Badenes et al., 2018; Moe et al., 2019; Mazzola et al., 2020). For example, both APOGEE spectroscopic binaries and Kepler eclipsing binaries reveal a close binary fraction that decreases by a factor of four across 1.0 [Fe/H] 0.5 (Moe et al., 2019, see Fig. 4). Mazzola et al. (2020) measured an even steeper anti-correlation between the close binary fraction and chemical abundances of elements like C, O, Mg, and Si.
Meanwhile, the wide binary fraction across = 200 - 1,000 au appears to be metallicity invariant (Moe et al., 2019; El-Badry and Rix, 2019). El-Badry and Rix (2019) utilized their catalog of common-proper-motion binaries from Gaia to demonstrate that a strong metallicity dependence emerges only within 200 au. They measured a factor of three decrease in the fraction of solar-type binaries near = 50 au across [Fe/H] 0.5, nearly the factor of four variation observed within 10 au across the same metallicity interval. Figs. 2 & 3 show that metal-poor solar-type binaries skew toward shorter separations while metal-rich binaries favor long periods. These observations indicate metallicity plays a crucial role in binary fragmentation at high densities and small separations (see §3.4.5).
Finally, the small population of very wide solar-type binaries across = 1,000 - 10,000 au exhibits a non-monotonic metallicity dependence in their companion frequency, peaking near [Fe/H] = 0.0 (Hwang et al., 2021). The deficit of extremely wide companions ( 5,000 au) to older, metal-poor halo stars is at least partially due to dynamical disruption via galactic tides and gravitational perturbations. However, Hwang et al. (2021) argued that disruptions alone cannot explain the metallicity dependence observed in binaries across = 1,000 - 5,000 au, which have larger binding energies. They instead concluded that metal-poor halo stars initially formed in denser clusters, resulting in a smaller very wide binary fraction (see also §2.4). Meanwhile, Hwang et al. (2021) offered multiple theories for the smaller very wide binary fraction of [Fe/H] = 0.5 disk stars, including radial migration within the Milky Way and/or dynamical unfolding of initially unstable triples.
Unlike solar-type stars, the close binary fraction of massive stars does not decrease with metallicity. Both eclipsing and spectroscopic binary surveys of OB stars in the metal-poor Magellanic Clouds reveal a close binary fraction that matches their Milky Way counterparts at solar-metallicity (Moe and Di Stefano, 2013; Sana et al., 2013; Dunstall et al., 2015, see Fig. 4). Moreover, the period and mass-ratio distributions of close OB binaries in the Magellanic Clouds are consistent with the Milky Way distributions (Moe and Di Stefano, 2013; Almeida et al., 2017; Villaseñor et al., 2021). Recent surveys of massive metal-poor stars in older environments indicate a slightly lower binary fraction (Bodensteiner et al., 2021; Neugent, 2021), but this may be due to binary evolution and/or other selection effects.
2.4 Pre-MS Phase
2.4.1 T Tauri stars
Spectroscopic surveys of Class II/III T Tauri stars reveal a close binary fraction that is consistent with their field MS counterparts (Mathieu, 1994; Melo, 2003; Elliott et al., 2014; Prato, 2007; Kounkel et al., 2019). Specifically, Kounkel et al. (2019) measured a bias-corrected close binary fraction that increases from CBF = 12% for mid-M T Tauri stars to CBF = 33% for early-F T Tauri stars (see Fig. 4). They also found that close T Tauri binaries follow the same short-period tail of the lognormal separation distribution as field MS binaries across = 0.1 - 10 au (see Fig. 2). These observations demonstrate that the primary mass dependence and separation distribution of close binaries are largely set by the beginning of the T Tauri stage.
Two recent spectroscopic surveys suggest that the close binary fraction decreases with age across = 2 - 100 Myr (Jaehnig et al., 2017; Zúñiga-Fernández et al., 2021), but we argue these results are due to selection biases. Based on APOGEE observations, Jaehnig et al. (2017) reported completeness-corrected CBF = 12% - 20% for 0.5 pre-MS stars in five different star-forming groups, which is consistent with the early-M dwarf field value. In contrast, they measured only CBF 4% for low-mass MS stars in the 100 Myr old Pleiades cluster. This discrepancy likely arises because the low-mass stars in the Pleiades observed by APOGEE are concentrated toward the periphery of the cluster, which has a lower binary fraction due to mass segregation (Raboud and Mermilliod, 1998). Moreover, the close binary fraction of FGK MS stars in the Pleiades measured from more robust long-term radial velocity monitoring is CBF = 25% 3% (Torres et al., 2021), similar to the corresponding field value (see §2.2.1). Zúñiga-Fernández et al. (2021) recently measured an even larger solar-type close binary fraction of CBF = 30% 6% averaged across three young moving groups with 20 Myr, including Beta Pic, and measured only CBF 10% - 15% in slightly older associations with = 20 - 100 Myr. However, of their ten spectroscopic binaries in Beta Pic, six have slow rotation velocities and/or periods compared to their single star analogs, suggesting they are older non-members (only two have short orbital periods where tides could have reduced the spin). Moreover, four of the ten have 20% probabilities of not being Beta Pic members, while only two of the remaining 32 members have such low reliabilities. After removing likely non-member spectroscopic binaries, the close binary fraction in young comoving groups matches the field value.
Meanwhile, AO and speckle imaging surveys of T Tauri stars in star-forming environments like Taurus, Chamaeleon, Ophiuchus, and Scorpius reveal an excess of companions across = 10 - 200 au (Ghez et al., 1993; Reipurth and Zinnecker, 1993; Leinert et al., 1993; Ghez et al., 1997; Kraus et al., 2011; Tokovinin and Briceño, 2020), which is discontinuous with the spectroscopic binary results (see Fig. 2). It was originally assumed that only low-density environments exhibited such an excess while high-density environments would have a deficit, and therefore the field population derived from a combination of these environments. However, Duchêne et al. (2018) found tentative evidence for the same excess of companions across = 10 - 60 au in the dense Orion Nebula Cluster (ONC). Notably De Furio et al. (2019) found no excess in this separation range for low-mass M-dwarfs in Orion. Thus the discontinuity and excess near = 10 au in most star-forming regions poses a mystery and warrants further study.
Across wide separations of = 100 - 10,000 au, the binary fraction is sensitive to the stellar density of the environment. Fig. 2 shows that the dense Orion Nebula Cluster (ONC) exhibits a deficit of wide companions (Scally et al., 1999; Köhler et al., 2006; Reipurth et al., 2007; Duchêne et al., 2018; Jerabkova et al., 2019). Environments with intermediate density such as Upper Scorpius and the Orion OB1 association are consistent with the field (Brandner et al., 1996; Kraus et al., 2008; Kounkel et al., 2016; Tokovinin and Briceño, 2020; Tokovinin et al., 2020). Finally, low-density star-forming regions like Taurus and Chamealeon exhibit a slight excess of wide companions (Ghez et al., 1993; Reipurth and Zinnecker, 1993; Leinert et al., 1993; Ghez et al., 1997; Kohler and Leinert, 1998; Connelley et al., 2008; Kraus et al., 2011; Joncour et al., 2017). These observations suggest that the majority of wide binaries are dynamically disrupted in extremely dense regions, and that the field MS population derives from a mixed composition of low, intermediate, and high-density environments. Specifically, for every solar-type primary born in a dense ONC environment, a counterpart must be born in a sparse Taurus-like association such that the average of the star-forming environments yields a wide binary fraction similar to Upper Scorpius and the field MS population.
However, within the same star-forming region, there is tentative evidence for the opposite trend between the wide binary fraction and the immediately surrounding stellar density. For example, Kounkel et al. (2016) imaged 129 Class I protostars and 197 Class II/III T Tauri stars across the Orion Molecular Cloud in the near-IR with HST and the InfraRed Telescope Facility. Across = 100 - 1,000 au, they found that protostars and T Tauri stars have very similar wide binary fractions, which are consistent with the field MS population. Surprisingly, Kounkel et al. (2016) found that young stars in sub-regions of higher spatial stellar density exhibited a slightly larger wide binary fraction. Recent ALMA observations of Class 0/I protostars in Orion seem to confirm this result (Tobin et al. 2022; see §4.2.1).
There are noticeable differences between close versus wide T Tauri binaries. Similar to their MS counterparts, T Tauri binaries within 200 au follow a uniform mass-ratio distribution with a small excess twin fraction, while wider companions are skewed toward smaller masses (Kohler and Leinert, 1998; Tokovinin and Briceño, 2020). As discussed in §5.1.1, binaries within 50 au truncate the disk masses, radii, fluxes, and lifetimes compared to single stars and wider binaries (Jensen et al., 1996; Harris et al., 2012; Kraus et al., 2012; Cheetham et al., 2015). Hence, a sample of T Tauri stars selected according to their large disk masses will be systematically biased against close binaries. For example, Kounkel et al. (2019) measured the fraction of Class II and III T Tauri stars that are in double-lined spectroscopic binaries (SB2s), which have large mass ratios 0.6. Compared to the field MS population, they found that Class II stars exhibit a deficit of SB2s while Class III stars have a surplus. Kounkel et al. (2019) concluded that close T Tauri binaries with large mass ratios quickly consume or disrupt their disks, thereby accelerating the Class II phase and extending the duration of the Class III phase compared to single stars and wider binaries.
2.4.2 Herbig Ae/Be stars and Massive YSOs
According to various high-resolution imaging surveys, the wide binary fraction of Herbig Ae/Be stars and massive YSOs in young star-forming environments is WBF = 30% - 60%, increasing with stellar mass (Kouwenhoven et al., 2005; Baines et al., 2006; Wheelwright et al., 2010; Gravity Collaboration et al., 2018; Pomohaci et al., 2019). These values are consistent with their MS analogs in the field and slightly older clusters (see Fig. 4). Wide companions to OB stars in the Trapezium Cluster of the ONC skew toward small mass ratios 0.2, similar to their counterparts in slightly older clusters (Gravity Collaboration et al., 2018). The samples of wide Herbig Ae/Be binaries are not sufficiently large to detect a dependence on surrounding stellar density as measured for T Tauri stars.
Meanwhile, the close binary fraction of Herbig Ae/Be stars and massive YSOs inferred from spectroscopy is only CBF = 10% - 30% (Corporon and Lagrange, 1999; Apai et al., 2007; Sana et al., 2017), considerably lower than the corresponding MS fraction. One interpretation is that 1 Myr old massive stars do not have any close companions, and that the companions at intermediate separations harden on Myr timescales (see also Ramírez-Tannus et al. 2021). An equally compelling explanation is that close companions to massive pre-MS stars shorten disk lifetimes, similar to their T Tauri analogs, and therefore the subset of massive stars within a coeval cluster that retains a disk is less likely to have close companions. Resolving this ambiguity requires a systematic survey for close binary companions to both massive YSOs with disks and normal OBA stars without disks within the same cluster (Bordier et al., 2022). Larger samples of spectroscopic and eclipsing OB binaries in young star-forming environments within the Large Magellanic Cloud reveal a sizeable fraction with close companions (Sana et al., 2013; Moe and Di Stefano, 2015a). For example, Moe and Di Stefano (2015a) discovered 18 early-B MS stars with 1 - 2 pre-MS eclipsing binary companions across = 3 - 8 days, a few of which are as young as 0.6 - 1.0 Myr according to the measured temperatures and inflated radii of the pre-MS companions still on the Hyashi track.
2.5 Overall Multiplicity Statistics
Given the substantial excess of wide companions to YSOs compared to field stars (see §2.4 and §4), most star systems are born as multiples. However, subsequent dynamical disruptions reduce the overall multiplicity fraction, especially for low-mass binaries that have lower binding energies (Kroupa, 1995). As emphasized in Lada (2006), most MS field stars are M-dwarfs and most M-dwarf field stars are single, and thus most MS star systems are single. By weighting our multiplicity statistics with the IMF of primary stars (Kroupa et al., 2013), we compute that only 35% of zero-age MS star systems are multiple, consistent with the conclusion of Lada (2006). Nonetheless, most MS stars are members of multiples after considering the fact that multiples contain two or more stars. For example, given 100 M-dwarfs, only 49 are single, 16 are paired with 16 other M-dwarfs, 12 are binary companions to more massive BAFGK primaries, and 7 are tertiaries in triples and higher-ordered multiples. By weighting our statistics with the IMF, we conclude that 58% of MS stars are members of multiples.
1.75 \plotonePPVII_form_comp_Final
3 MODELS FOR MULTIPLE STAR FORMATION
A successful theory for multiple formation must both reproduce observed multiplicity statistics (§2) and model young, individual sources (§4 and §5). To date, there is no comprehensive, predictive theory for multiple star formation. Models have instead tackled the origin of multiplicity at different spatial scales and explored the influence of different physical processes.
By definition, multiple formation requires two or more events of gravitational collapse that ultimately form a bound stellar system. We define the process by which self-gravitating objects develop substructures that evolve and collapse independently as fragmentation. Hoyle (1953) first proposed star formation through the hierarchical fragmentation of collapsing gas. However, this “classic” star formation paradigm, described only by the interplay of gravity and thermal pressure, produces smooth, isotropic collapse (e.g., Shu, 1977). Some of the first numerical star-formation calculations demonstrated that multiple fragmentation events are not possible under these conditions alone (Larson, 1972).
Observations and theoretical studies have reinforced that this simple picture is a poor representation of how most stars form. Instead, star formation is regulated not only by gravity and thermal pressure but also turbulence and magnetic fields, which introduce rotation and asymmetry, crucial ingredients that facilitate additional collapse events within dense cores, filaments and accretion disks. The high degree of clustering in many star-forming regions also suggests that interactions between stars are important for the evolution of multiple systems.
Current ideas for multiple formation can be divided into three main categories: theories in which multiples form via fragmentation of a core or filament (§3.1), via fragmentation of a massive accretion disk (§3.2) or through dynamical interactions (§3.3). This third mode can also rearrange the hierarchy and multiplicity of systems formed via the prior fragmentation channels. Figure 5 summarizes these mechanisms and provides examples from observations and numerical simulations. §3.4 reviews the landscape of state-of-the-art calculations, approaches the origin of stellar multiplicity holistically and discusses our current understanding of how physics and environment shape multiplicity statistics.
3.1 Core and Filament Fragmentation
Stars form in dense cores, most of which are observed to be embedded within pc filaments in nearby star-forming regions (Könyves et al., 2015). High-resolution observations have discovered even smaller filaments within cores that host forming stars (Pineda et al., 2015, see Fig. 5). Core and filament fragmentation models posit that stellar multiples arise from over-densities that develop and collapse within these parent structures, producing initially widely separated systems ( au). Note that the terms core and filament represent morphological descriptions rather than physical definitions, and here, we define over-densities with small aspect ratios () as cores and structures with higher aspect ratios as filaments. However, we stress that these terms likely represent two limits on a continuous spectrum of initial gas morphologies and physical conditions rather than wholly distinct classes of objects. Below we discuss different processes that regulate the fragmentation of these structures and the predicted signatures of their formation.
3.1.1 Modes of fragmentation
Two proposed drivers of core fragmentation are rotation and turbulence, which produce density and velocity asymmetries. Velocity gradients observed in early observations of dense cores (e.g., Goodman et al., 1993) highlighted the importance of angular momentum in core evolution. Early numerical simulations including solid body rotation demonstrated that rapidly rotating, collapsing cores are prone to fragmentation, thereby leading to binary formation (Larson, 1972). Inutsuka and Miyama (1992) quantified the fragmentation criterion for rotating cores in terms of the initial ratio of thermal to gravitational energy, , and ratio of rotational to gravitational energy, , where produces fragmentation and
|
|
(5) |
Fragmentation also requires , since thermal pressure may otherwise prevent warm cores from fragmenting (Tsuribe and Inutsuka, 1999). These criteria are straightforward, but they fail to encapsulate the complexity of real cores and thus are not readily extended to construct a general theory of binary formation.
While recent high-resolution core observations validate the prevalence of velocity gradients, current interpretation of their physical meaning is nuanced. Gradients may instead signify core formation via converging flows (Chen et al., 2020) or represent the largest turbulent fluctuation in the core (Goodwin et al., 2004). The latter explanation suggests that turbulence, either directly or indirectly, rather than rotation produces multiple star formation (see §3.1.3 for more discussion).
Most current star-formation theories appeal to turbulence to trigger the growth of structure, including the formation of cores and filaments, within molecular clouds. Several groups have developed rigorous, semi-analytic frameworks for star formation through turbulent fragmentation, in which the statistical properties of turbulence, such as the power spectrum and density probability distribution function, determine core masses and regulate gravitational collapse (see review by Lee et al., 2020b). Only one model, which we discuss here, makes quantitative predictions for stellar multiplicity. Guszejnov and Hopkins (2015) use a grid of perturbations to hierarchically compute the fragmentation of a molecular cloud assuming that turbulence both seeds collapse and provides pressure support. This method preserves the spatial relationships of collapsing objects, such that density fluctuations within cores naturally lead to fragmentation and multiple formation (Guszejnov et al., 2017). Sub-regions collapse when the local gravitational energy exceeds the combined turbulent and thermal energy. This may be phrased as a critical density threshold:
|
|
(6) |
where , and are the initial density, radius, and Mach number of the parent cloud, respectively. This formalism assumes turbulent energy scales as and the cloud is isothermal. For supersonic turbulence while for subsonic turbulence , where the transition occurs at the sonic scale, . For a virialized molecular cloud, where pc and pc is the fragment radius, we can write (Guszejnov and Hopkins, 2015):
|
|
|
|||
|
|
|
where the mass of a au radius fragment is for typical cloud parameters. Guszejnov et al. (2017) used this formalism to directly predict multiplicity properties finding relatively good agreement with observed statistics despite their simplistic treatment of turbulence (see §3.4 for more discussion).
Filamentary structure is a natural by-product of turbulence. Dense filaments are prone to sub-fragmentation at regular internals like “beads on a string,” which provides a mechanism to form widely-spaced multiples if filaments are sufficiently dense and compact (see Fig. 5). An isothermal filament collapses if its mass per unit length, , exceeds a critical value. A filament threaded laterally by a magnetic field, , will become unstable when exceeds (Inutsuka and Miyama, 1997; Tomisaka, 2014):
|
|
|
|||
|
|
where is the ratio of thermal to magnetic pressure. Several authors have developed semi-analytic models deriving the spectrum of fragment masses (i.e., the core mass function) from filament properties (Inutsuka, 2001; André et al., 2019). We can apply these arguments to derive expected relationships for multiple formation from filament fragmentation.
In order for density perturbations to grow, analytic arguments suggest that substructures within filaments must have separations of at least 2.5 times the filament full-width half maximum, (Fischera and Martin, 2012). This suggests that fragments that are sufficiently closely spaced to remain bound must form in filaments with widths of pc au. Assuming turbulent support is negligible, a filament fragment will collapse if its mass exceeds the critical Bonnor-Ebert mass (André et al., 2019):
|
|
|
|||
where the filament surface density, , is the ratio of the filament mass-per-length to the width of the filament . Equation 3.1.1 suggests that the formation of closely-spaced fragments with small masses requires a high filament mass-per-length. This implies that strong magnetic fields facilitate the formation of dense, narrow filaments and thus play a critical role in multiples formed via filament fragmentation.
While these expressions are relatively simple and provide intuition for the origin of multiplicity in different theoretical frameworks, they make a variety of simplifying assumptions. Consequently, using these to accurately predict future multiplicity from the properties of a particular observed filament or core is not straight-forward. Moreover, debate in the star-formation community continues on the relative roles of rotation, turbulence and magnetic fields on gas structure formation and evolution. In §3.4, we examine the impact of non-linear physical effects in star-cluster formation calculations and discuss the impact of different processes on multiple formation across all scales.
3.1.2 Predicted signatures
Multiple systems formed from core and filament fragmentation have various characteristics imprinted during formation that shape their statistical distributions and may point to their origins long after the natal gas is dispersed.
Gravitational fragmentation of an isothermal, turbulent cloud is scale free and thus requires additional physics to set the minimum fragmentation scale (Guszejnov et al., 2020). Current theoretical models appeal to either angular momentum, magnetic support or tidal forces to set this minimum scale (Guszejnov et al., 2017; Haugbølle et al., 2018; Lee and Hennebelle, 2018); all of these effectively impose a lower limit of au. Fragments that collapse with separations pc are unlikely to be initially bound and will naturally drift apart. These two constraints limit the initial separations of multiples formed from turbulent fragmentation to au - 0.1 pc. This separation range is consistent with those of multiplies that form in magneto-hydrodynamic simulations of turbulent clouds and cores (Offner et al., 2016; Lee et al., 2019; Kuffmeier et al., 2019). Arc- and bridge-like gas structures, produced by formation in a turbulent environment, may connect the pairs and facilitate accretion (Kuffmeier et al., 2019). Wide embedded and accreting, multiples exist at such separations for a relatively short time period, migrating to au within years (Offner et al., 2016; Lee et al., 2019, see §3.3).
Turbulent fragmentation is only efficient when there is a significant reservoir of gas, i.e., during the embedded phase. Consequently, multiples in such systems, assuming they form from the same parent structure, are expected to have similar ages ( yr). Once collapse commences, gravity curtails the growth of perturbations, limiting the number of objects that can form by this process. Consequently, turbulent fragmentation may only produce two or three members within a core (Offner et al., 2016; Guszejnov et al., 2017; Lee et al., 2019). Since collapse events happen independently and occur while there is a significant gas reservoir, the formation of very low-mass companions () and systems with high mass ratios are expected to be rare (Fisher, 2004).
Due to their wide initial separations, multiples formed from turbulent fragmentation accrete gas with different net angular momentum. This frequently produces misaligned stellar spins, accretion disks and protostellar outflows (Bate, 2018; Offner et al., 2016; Lee et al., 2019). Stellar spins and outflows of wide-separation protostellar pairs formed in magneto-hydrodynamic (MHD) simulations are consistent with a random distribution (Offner et al., 2016; Lee et al., 2019). The misalignment persists to the end of the calculation, suggesting that misaligned spins are a signature of this formation mechanism that may be observable after the birth cloud disperses (see §4.3.4). The relative orientations of protostellar outflows, which are observable before significant dynamical evolution occurs, provide a means to directly probe the initial angular momentum direction (see §4.3.4). However, outflow angles can be difficult to measure for close pairs and in clustered regions; selection effects due to the difficulty of distinguishing aligned protostellar outflows may cause wide pairs to appear preferentially anti-aligned rather than randomly distributed (Offner et al., 2016).
3.1.3 Rotation, turbulence, and angular momentum inheritance
Several authors have drawn a direct line between the angular momentum generated by turbulence and multiplicity properties. Fisher (2004) developed a semi-empirical model relating randomly drawn turbulent velocity fields to binary angular momentum, which in turn set binary periods and separations. This approach, which depends on several input parameters such as the core-to-star formation efficiency correctly predicts that more equal-mass binaries have smaller binary periods and that lower-mass systems have smaller typical binary separations. Jumper and Fisher (2013) extended this model to explore the origin of the “brown dwarf desert,” in which solar mass stars have relatively few brown dwarf companions at short periods (see §2.2.1). They showed that low-mass brown dwarfs have smaller mean separations, where the small fraction of observed wide-separation brown dwarf systems are explained by turbulent stochasticity.
Groups carrying out hydrodynamic calculations of turbulent molecular clouds both with and without magnetic fields have shown that turbulence naturally produces velocity gradients with the magnitude and distribution seen in observations (e.g., Chen et al., 2020). However, numerical studies of fragmentation in collapsing, magnetized cores show poor correlation between the initial degree of rotation and later fragmentation (Kuznetsova et al., 2020). Kuznetsova et al. (2020) instead propose that dynamical torques are more directly responsible for core fragmentation. Ultimately, multi-physics simulations highlight the difficulty of applying simple theoretical models to predict the complex and nonlinear outcomes of star formation.
Non-ideal magnetic effects, which influence angular momentum transport on both core and filament scales, further confuse the relationship between initial gas properties and fragmentation (Zhao et al., 2020). The origin and distribution of angular momentum is in turn crucial for the formation and properties of protostellar disks, which may also host binary formation as we discuss in the next section. In §3.4, we present a more detailed discussion of multiplicity derived from multi-physics calculations of forming clusters, which include all four mechanisms for multiple formation.
3.2 Disk Fragmentation
3.2.1 Summary of the instability
Independent of multiple formation on the scales of cores and filaments, protostellar disks, which form around the individual stars, may also be prone to fragmentation into binary or higher order multiples. The notion that gravitational instability in a shearing disk might produce binaries dates back over 30 years (Adams et al., 1989; Shu et al., 1990; Bonnell, 1994). The physical mechanism at the heart of the instability is the same derived for the development of spiral arms in galaxies by Toomre (1964). The criterion for the growth of the axisymmetric, mode of the instability in razor-thin disks, where gravity overcomes support from thermal pressure on small scales and rotation on large scales is:
| (10) |
where is the disk sound speed, the disk orbital frequency, and the surface density. The second form of the above equation relates the instability to the star-disk-mass ratio, and aspect ratio, , where is the disk scale height, and the order unity scale factor depends on the assumed surface density power law. The Toomre Q criterion formally describes the onset of an instability rather than successful fragmentation of the disk into an independent bound object.
Numerical models of protostellar disk fragmentation often reference a secondary criterion for instability to lead to fragmentation, the so-called “cooling criterion.” An early version of this mandate for disks to cool rapidly was first described by Thompson and Stevenson (1988) but was brought into much clearer focus by Gammie (2001). The constraint that disks radiate away heat on roughly the orbital timescale () is critical for understanding the transition from the so-called gravito-turbulent state to fragmentation in viscously heated disks. For protostellar disks, the cooling constraint is often more easily satisfied than (Kratter and Lodato, 2016). Moreover for thick, massive disks, the critical value for fragmentation drops substantially below unity (Lau and Bertin, 1978) due to the extended vertical distribution of matter. Consequently, the canonical combination of and may be insufficient for predicting the onset of fragmentation in irradiated, massive disks (Tsukamoto et al., 2015; Takahashi et al., 2016).
3.2.2 The onset of instability
As the literature is replete with discussion of the nature of gravitational instability in general, we focus in this review on the likely pathway towards instability that is most relevant for multiple formation. Gravitational instability ( via modes ) is most likely to arise in the outer disk, as , where is the power-law index of temperature , and is the power-law index for surface density . Except for pathological combinations of these indices, declines with radius. At disk radii of several 10s to 100s of au, the disk temperature is primarily set by stellar irradiation, and thus somewhat insensitive to changes in disk properties (Clarke, 2009; Kratter et al., 2008; Rice et al., 2011). Consequently, disks most likely become unstable through an increasing surface density, , that is not matched by an increased temperature. This situation arises when the infall rate onto the disk exceeds the accretion rate through the disk and onto the star (Kratter et al., 2010; Harsono et al., 2011; Zhu et al., 2012). Such high infall rates are likely during the Class 0 phase. This scenario is particularly conducive to the formation of more equal mass binaries (rather than extreme mass-ratio BDs or super Jupiters) because the requirement for rapid infall also provides ample mass supply for the newborn fragment. In fact, for a wide range of disk conditions, the secondary object will out-compete the primary in accretion, driving mass ratios towards unity (Bate and Bonnell, 1997; Ochi et al., 2005; Young and Clarke, 2015). This behavior is consistent with the preference for more equal mass ratios among close binaries (see §2.2). Note that even at arbitrarily high infall rates, the disk mass will not exceed the stellar mass, as global mode instabilities arise and lead to binary formation (Adams et al., 1989). Numerical simulations that invoke disk masses comparable to stellar masses as initial conditions are therefore somewhat unphysical.
An alternate pathway occurs when the disk temperature declines faster than accretion can alter the surface density. A likely candidate for this scenario is stellar luminosity variation due to accretion changes driven by gravitational or other instabilities. A sudden drop in the central luminosity could also precipitate fragmentation, so long as the drop in temperature does not correspond to a rise in the cooling timescale that prohibits fragmentation (Dunham et al., 2014a; Kuffmeier et al., 2018).
3.2.3 Fragment survival and subsequent evolution
In order for gravitational instability and fragmentation to produce binary formation, several benchmarks must be met. Fragments must cool efficiently so that they collapse to sizes well below their Hill radius, , before being sheared apart by interactions with the disk or even other fragments. Soon after formation, they are also subject to inward migration through the disk, which can lead to tidal disruption as the Hill radius shrinks faster than the object (Begelman and Cioffi, 1989; Gammie, 2001; Kratter and Murray-Clay, 2011; Nayakshin, 2010; Boley et al., 2010). Merger with the host star is also possible (Vorobyov and Basu, 2005a; Zhu et al., 2012). We defer a discussion of disk-driven migration in general to §3.3.2. Full modeling of these migration dependencies is crucial for predicting the expected population of binaries (separation, mass ratio) that derive from disk fragmentation plus migration. For example, their analytic model of disk fragmentation followed by inward migration and preferential mass accretion onto the secondary, Tokovinin and Moe (2020) reproduced the observed excess twin fraction and BD desert among close solar-type binaries.
3.3 Capture, Dynamical Evolution, and Migration
The fragmentation modes discussed thus far provide excellent explanations for a large swath of observed binary systems, even if they are not fully predictive analytic models. One glaring omission in these models is the frequency and efficiency of orbital evolution post fragmentation. This omission is particularly acute for the closest binaries ( au), where in-situ fragmentation is all but prohibited by the size of the first hydrostatic core (Larson, 1969). To understand the origin of the closest binaries, as well as early evolution of orbital properties, we review the current models for capture and orbital evolution.
3.3.1 N-body versus gas-mediated capture
As described in §3.1, multiple systems can form at large distances, nearly independently as single stars, but nevertheless be gravitationally bound to each other. Additionally, multiple stars in a star cluster may begin their lives unbound, but due to energy and angular momentum exchange with the surrounding gas cloud or individual circumstellar disks, subsequently become bound and remain so. Other objects (often hierarchical multiples) will alternate between weakly bound and unbound over the first free fall time of the cluster. We dub this process, seen in a range of scales in numerical simulations gas-mediated capture (Ostriker, 1994; Moeckel and Bally, 2007; Bate, 2012; Muñoz et al., 2015; Geller et al., 2021b; Cournoyer-Cloutier et al., 2021). The net frequency of capture via these mechanisms is likely low; these systems would be indistinguishable observationally from those formed via fragmentation, except possibly cases where two disks appear to be on a collision course (see panel d, Fig. 5).
On the other hand, in regions of high stellar density, interactions between truly unbound stars in the absence of gas can lead to the formation of new binaries and partner exchange. The outcome of such interactions is fairly well understood and can be modelled statistically. For example the adage that hard binaries are hardened by such interactions while soft binaries become softer (Heggie, 1975) suggests that very frequent interactions should tend to drive binary separations towards a bimodal rather than unimodal distribution – notably inconsistent with most observations (see Fig. 2). More recent work has emphasized the important contributions of higher order multiples to the overall interaction rates in clusters of moderate density (Geller and Leigh, 2015; Hamers and Samsing, 2020). In particular binary-single and binary-binary interactions can produce a much more diverse set of outcomes, including the formation of very compact binaries (Dorval et al., 2017). While relevant for dense open clusters and globular clusters, these processes are sub-dominant in gas-rich environments. Moreover, even when rapid dynamical instabilities occur that change orbital parameters, system multiplicity, or hierarchy, they rarely lead to the order of magnitude changes in separation that are required to explain very close binaries (e.g., Wall et al., 2019). Orbital hardening is often driven by the ejection of a formerly bound companion; because the ejected object is typically the lowest mass, the total energy and angular momentum removed from the system in such an interaction causes more moderate changes in semi-major axis (Valtonen and Karttunen, 2006; Kratter, 2011).
Partner exchange and shifting hierarchies also occur frequently in gas-rich environments (Bate, 2012; Ryu et al., 2017; Cournoyer-Cloutier et al., 2021). Such interactions are fundamental to shaping the final multiplicity distribution observed for pre-MS and field stars and may even explain some of the evolution between the Class 0 and I phase (see §4.2). Crucial as it may be, there is little fundamental theory to describe this process. Although some theories of multiple formation argue that most if not all objects are born in binaries (Kroupa, 1995, 2008), modern numerical simulations produce some stars that are never bound to another cluster member (Bate, 2012; Lee et al., 2019).
3.3.2 Gas-driven migration
In addition to allowing for capture, gas-rich star-forming environments also facilitate dramatic orbital evolution of binaries from their birth separation. The recent expansion of statistics for the youngest stars lends credence to the notion that binaries form early and thus much of the orbital evolution occurs before the natal cloud disperses (see §4.2). Migration can occur either due to interactions with both bound or unbound low density molecular gas, or with a well defined circumbinary disk.
Gas-dynamical friction: For widely separated bound binaries, the combined action of gas accretion and the generation of a dense trailing wake provide a torque that reduces the semi-major axis. Numerous works have studied this so-called “dynamical-friction force” (Bate and Bonnell, 1997; Ostriker et al., 1999; Stahler, 2010; Lee and Stahler, 2011). Lee et al. (2019) showed that a simple first order differential equation for that includes both accretion and the torque due to dynamical friction with the gas , can explain the observed rate of orbital decay in turbulent MHD simulations. The removal of angular momentum by magnetic breaking also helps to drive inward migration (Zhao and Li, 2013). Thus, so long as the gas cloud is present and stars continue to accrete, gas can efficiently reduce orbital separations from thousands of au to hundreds or even tens of au in well under a Myr.
Though a simple model can explain the observed migration in simulations, it does not easily translate into a generic prediction for the expected orbital evolution for a population of binaries, as it is a function of the local environment. Nevertheless, phenomenological models have had some success in reproducing observed distributions (Tokovinin and Moe, 2020).
Disk-driven migration: Migration of binaries embedded in a shared circumbinary disk also crucially shapes the final orbital and mass ratio distributions. The classic theory for migration suggests that inward migration should dominate (Lubow and Artymowicz, 1996), however this work only includes the torque from a circumbinary disk on point particles and neglects the often substantial torque generated by small individual disks surrounding each star, as well as the contribution from ongoing accretion. Accretion and circumstellar torques in particular push objects in the opposite direction and can lead to substantial outward migration (Muñoz et al., 2019). The net torque including circumbinary disks, circumstellar disks, and ongoing accretion is a function of binary mass ratio, eccentricity, effective viscosity, and aspect ratio (Satsuka et al., 2017; Dempsey et al., 2021). Ongoing work will map this space theoretically, which will inform future population synthesis models. However, it is clear that more extreme mass ratios experience inward migration for typical disk properties. This is somewhat consistent with disk fragmentation simulations that undergo mergers, although numerical viscosity may also play a role (Vorobyov and Basu, 2005b; Zhu et al., 2012). The production of near equal mass binaries at close separations may also derive from this process, as rapid inward migration at high mass ratios is followed by mass equalizing accretion from the circumbinary disk. This process can lead to stalled inward migration and even reverse the migration direction (Tokovinin and Moe, 2020).
3.3.3 Secular evolution
An alternative model for the origin of very close binaries ( days) is Kozai-Lidov (KL) cycles coupled with tidal friction (Kozai, 1962; Lidov, 1962; Fabrycky and Tremaine, 2007). This model posits that binaries with days form from triple star systems with an inclined outer tertiary. Exchange of angular momentum between the orbits can drive long timescale eccentricity-inclination oscillations. When the pericenter of the inner binary is pushed to very close separations, tides begin to circularize the orbit, both shutting off the oscillations and inducing drastic period decay (e.g., Dabringhausen et al., 2022). This model relies on the high fraction of triples amongst the closest binaries (Tokovinin et al., 2006, see §2.2). However, such oscillations cannot account for the population of co-planar, close-in triples identified by Borkovits et al. (2016). A population synthesis study by Moe and Kratter (2018) found that less than half of binaries with days could be plausibly explained by KL cycles. One of the key reasons KL cycles do not reproduce the observed population is that the pre-MS close binary fraction is consistent with that of the field (see §2.4), suggesting that evolutionary mechanisms act on Myr not Gyr timescales: only a tiny fraction of KL susceptible systems have predicted orbital circularization timescales of less than a Gyr. The need for rapid migration likely requires gas-driven migration to efficiently drain energy and angular momentum from binary and triple star orbits.
3.4 Impact of Environment on Multiplicity
@lccccccccccc
\tablecaptionStar Cluster Calculation Statistics
\tablewidth0pc
\tabletypesize
\tablehead
\colhead& Properties\tablenotemarka Statistics\tablenotemarkb
\colheadReference \colheadB \colheadR \colheadO \colheadC \colhead (pc) \colhead ()
\colhead (au) \colheadMF \colheadCF \colhead (au) \colhead (au)
\startdataBate (2019) S 0.808 500 0.5 13
Bate (2019) S 0.808 500 0.5 9
Bate (2019) S 0.808 500 0.5 8
Bate (2019) S 0.808 500 0.5 25
Cunningham
et al. (2018) \tablenotemarkc B 0.65 185 65 37 986
Cunningham
et al. (2018) \tablenotemarkc B 0.65 185 65 126 564
Cunningham
et al. (2018) \tablenotemarkc B 0.65 185 32 22 411
Lee et al. (2019) B 2.0 601 50 449 245
Lee et al. (2019) B 2.0 601 50 1146 1003
Lee et al. (2019) B 2.0 601 50 1316 295
Li et al. (2018) B 4.2 3110 28 87 578
Mathew and
Federrath (2021) B 2.0 775 100 291 560
\enddata
\tablecomments aPhysics included in the simulation: magnetic fields (B), radiative transfer (R), and outflows (O). Column C indicates a spherical (S) or box (B) cloud geometry; , , and indicate the cloud diameter, mass, and minimum gas spatial resolution, respectively. The metallicity, , is noted when it is not solar (). Magnetized runs note the initial ratio of the gas mass to critical mass that can be supported by magnetic fields against collapse (“mass-to-flux ratio”), . , where is the initial uniform magnetic field and is domain length. b All entries except those of Mathew and
Federrath (2021) assume binomial statistics and Poisson statistics to estimate the MF and CF uncertainties, respectively. Uncertainties for the Mathew and
Federrath (2021) values adopt the standard deviation of the 10 runs. Bate (2019) uses closest separation to rank pairs and define stellar systems, while the other results use lowest binding energy to define bound systems. This choice has little impact on MF and CF, which differ by less than . The last two columns list the median semi-major axis, , and median 2D pair separation computed by assigning system multiplicity following Tobin et al. (2022). c Statistics represent the final stellar distribution from a run with driven turbulence and one with identical initial conditions in which turbulence naturally decays.
In past reviews, the limited number of star-cluster formation simulations and the small statistics of formed systems therein have obscured trends in stellar multiplicity with birth environment. Over the past few years computational advances have provided new insights into how molecular cloud properties affect stellar multiplicity by modelling more massive clouds, following larger dynamic ranges, and including more physical processes. While the statistics in such calculations remain modest, especially for very low () and high mass () stars, it is now clear that multiplicity exhibits more variation than the stellar IMF, which is surprisingly insensitive to environment (Offner et al., 2014). In this section, we discuss the relationship between environment, physical processes, and multiplicity inferred from current state-of-the art star-cluster calculations. We present a summary of simulation properties and multiplicity statistics in Table 3.4.
3.4.1 Radiation
Radiative heating from protostars, which predominately influences gas within a few au of the source in the case of low-mass stars, can significantly reduce disk fragmentation (§3.2), thereby reducing the formation of brown dwarfs (Offner et al., 2009; Bate, 2012). Bate (2019) modeled a unmagnetized, collapsing cloud with radiative transfer and a model for the diffuse ISM. The MF, separation distributions, and mass ratios at the final time show good agreement with the multiplicity of MS stars (e.g, see Fig. 6), despite the simulated stars being protostellar, i.e., significantly younger. Surprisingly, the same initial conditions evolved with a barotropic equation of state (Bate, 2012) produced statistically similar multiplicity with only a slightly higher MF for stars with . The relatively small number statistics in the radiative transfer calculation, combined with observational uncertainties, prohibit more rigorous conclusions about the impact of radiation on multiplicity. Note that the Bate (2019) calculations do not explicitly include heating due to stellar accretion and nuclear processes, as the magnetized calculations from Cunningham et al. (2018) and Li et al. (2018) (Table 3.4), and therefore represent a lower limit on the impact of radiation on multiplicity.
Models and simulations focusing on multiple formation via turbulent fragmentation, rather than disk fragmentation, find that radiative transfer has little impact on multiplicity. Core and filament fragmentation produce widely separated multiples, which form beyond the sphere of heating, such that calculations with and without protostellar heating give similar multiplicity statistics. However, even without disks, the statistics of very low-mass objects are over-predicted when heating is neglected, since turbulent fragmentation can proceed to smaller scales (Guszejnov et al., 2017). In simulations with disks, magnetic fields and thermal support due to protostellar heating both act to enhance disk stability and produce little small scale fragmentation (Offner et al., 2016; Cunningham et al., 2018; Guszejnov et al., 2021).
3.4.2 Protostellar outflows
Protostellar outflows launched by accreting protostars entrain and expel dense core gas, both reducing the star formation efficiency of dense gas and injecting significant energy and momentum into the natal cloud environment (Bally, 2016). Numerical simulations suggest that protostellar outflows can explain the offset between the stellar IMF and dense core mass function, helping to set the characteristic stellar mass (Offner and Chaban, 2017; Guszejnov et al., 2021; Mathew and Federrath, 2021). Mathew and Federrath (2021) conducted a suite of MHD turbulent cloud simulations both with and without protostellar outflows. Runs including outflows reproduced the expected trend of increasing multiplicity with stellar mass but under-predicted the multiplicity of low-mass () multiples. This deficit is likely due to the minimum calculation spatial resolution of au, which limits the formation of close separation systems (although disk fragmentation does occur). Comparing the results of magnetized star cluster calculations with and without outflows in Table 3.4 suggests outflows have little direct impact on CF and MF.
3.4.3 Magnetic fields
Magnetic fields provide additional pressure support that reduces gravitational collapse, thereby lowering the star formation rate, while increasing the characteristic stellar mass (Padoan et al., 2014; Guszejnov et al., 2021). While magnetic fields might therefore naively be expected to decrease stellar multiplicity, they may instead enhance multiplicity. Offner et al. (2016) carried out a suite of magnetized turbulent collapse calculations and found that because magnetic fields introduce asymmetry, which inhibits spherical collapse, they enhance turbulent fragmentation. Cunningham et al. (2018) and Lee et al. (2019) followed magnetized turbulent clouds with different mass-to-flux ratios and showed that stronger field calculations produce comparable or higher MFs and CFs (see Table 3.4). Likewise, the MF and CF reported by Li et al. (2018) and Mathew and Federrath (2021) are higher than those of Bate (2019), which do not include magnetic fields. While strong magnetic fields reduce protostar formation overall, they also produce fewer initial high-order systems. Consequently, fewer dynamical interaction occur, which would otherwise eject members and increase the fraction of single stars. This suggests a more subtle relationship between magnetic fields, stellar density and multiplicity.
Magnetic fields treated in the ideal limit of perfect dust-gas coupling transport angular momentum efficiently, which can lead to compact ( au) accretion disks or suppress disk formation altogether (Zhao et al., 2020). Spatial resolution of a few au is required for disk formation in turbulent, ideal MHD calculations. Since no magnetized cluster calculations listed in Table 3.4 adequately resolve disks, multiples in these calculations formed primarily through turbulent fragmentation.
Close binaries are under-represented in the resulting separation distributions, which hints that disk fragmentation, in addition to turbulent fragmentation and dynamical interactions, is required to produce the observed population of close-separation field star binaries. However, Figure 6 shows the resulting separation distributions of stars formed in some MHD calculations are consistent with the observed distribution of wide-separation protostars from Tobin et al. (2022). This comparison is apt because the ages of the simulated stars in these calculations are less than 1 Myr and, like protostars, they are less dynamically evolved than the population of field stars. Note that both simulations and observations of protostars are incomplete for separations below au (see §4.2). Meanwhile the separation distribution from Bate (2019) is similar to the observed field population of solar-type stars and inconsistent with the protostellar distribution despite simulated stellar ages Myr.
Non-ideal magnetic processes are important in regulating angular momentum transport and setting disk properties (Zhao et al., 2020, see also §3.2), however, most calculations of star-cluster formation have assumed ideal MHD. In one exception, Wurster et al. (2019) modeled a suite of 50 magnetized turbulent clouds, including ambipolar diffusion, Ohmic dissipation, and the Hall effect. They find that non-ideal magnetic processes do not inhibit the formation of multiple systems, which form independent of the initial field strength. Nevertheless, small number statistics () prohibit stronger conclusions about the impact of non-ideal effects on multiplicity.
3.4.4 Turbulence
Turbulent properties, such as the Mach number, virial parameter, and type of forcing (e.g., compressive versus solenoidal), influence the gas distribution and star formation rate (Padoan et al., 2014; Federrath, 2015). While the stellar IMF appears to be relatively insensitive to these details (Offner et al., 2014; Guszejnov et al., 2021), the impact of turbulence on stellar multiplicity is less clear, since few simulations have explored the impact of varying turbulence properties on multiplicity. Cunningham et al. (2018) compared multiplicity in turbulent, magnetized clouds and found those with continuous turbulent driving and weaker fields () over-predicted the multiplicity of solar-type stars, albeit the statistics were small. Mignon-Risse et al. (2021) found that the collapse of massive cores with sub-Alfvénic turbulence (), i.e., relatively stronger fields, produced single high-mass systems, while cores with super-Alfvénic turbulence produced binary formation via disk fragmentation, which was driven by higher levels of angular momentum.
A separate class of semi-analytical models focuses on the fundamental interaction between turbulence and gravity; this approach is simpler and computationally cheaper than performing MHD simulations but cannot capture time dependence or the complex spatial relationship between turbulence and density. Despite a variety of approximations, the Guszejnov et al. (2017) turbulence model (see §3.1.1) successfully predicts increasing multiplicity with stellar mass and the relative frequency of mass-ratios for both solar-mass and low-mass stars. Fig. 6 shows that the predicted MF agrees reasonably well with that of field stars, although the model over-predicts the MF of solar-type stars. This suggests that supersonic turbulent properties, such as the lognormal density distribution and power spectrum, together with gravity can explain a variety of observed multiplicity properties. However, Guszejnov et al. (2017) predict that the initial separation distribution peaks at au and has a deficit of close, au, binaries. This underscores that fully matching observations requires treatment of disk fragmentation and/or dynamical evolution (see §3.2).
3.4.5 Metallicity
It has long been understood that the evolution of metallicity from the first Population III stars to today could substantially impact the IMF (Abel et al., 2002). Gas metallicity influences the efficiency of cooling. Reducing the metallicity of the low density, optically thin gas characteristic of star forming cores inhibits cooling via metal lines. On the contrary, for solar metallicity gas that is optically thick, as in protostellar disks, lowering metallicity can promote cooling by reducing the opacity. Bate (2019) carried out four calculations of forming star clusters with metallicity, , ranging from 0.01 to 3 times solar. The calculations included separate treatment for the gas and dust temperatures, but neglected radiative feedback and magnetic fields. While the shape of the stellar IMFs was largely independent of metallicity, the lower metallicity calculations experienced more fragmentation in cores, filaments, and disks due to the higher cooling rate of dense gas. This produced more close binaries (au), which varied from CF= for to for . The close binaries in the lowest metallicity calculation also exhibited a small preference for lower mass ratios, which is likely caused by the enhanced small scale fragmentation. However, Table 3.4 shows that the overall MF and CF values for the four metallicities fall within of one another.
As noted in §2.2.7, observations support a drastic decrease in the close binary fraction as a function of metallicity, with the binary fraction beyond au remaining essentially unchanged (Moe et al., 2019; El-Badry and Rix, 2019). Analytic calculations suggest that the increase in only the close binary fraction is consistent with enhanced disk fragmentation, with wide binary formation mechanisms remaining essentially unchanged (Moe et al., 2019).
2.2 \plottwoSep_dist_v2_xz.pngMF_final.png
4 Observations of Forming Multiple Systems
Observations of multiplicity in the youngest stellar systems are key to understanding their origins. Unlike the pre-MS and MS systems reviewed in §2.2, they have had little time to dynamically change, and therefore their properties more directly reflect the formation conditions.
We define the youngest star systems, hereafter protostars, as stars that are still deeply embedded within a dense envelope of dust and gas that obscures them from direct observation (i.e., Class 0 and I sources). Due to high optical depths from the surrounding material, protostellar multiplicity is best observed via high resolution interferometric observations at (sub)millimeter to radio wavelengths where the surrounding envelope is both optically thin and filtered out such that the circumstellar environment can be detected. At these wavelengths, young stars are primarily detected via thermal dust emission from circumstellar disks , thermal free-free emission from ionizing shocks at the base of jets, or from a combination of these processes (e.g., Segura-Cox et al., 2018; Tychoniec et al., 2018).
In the Protostars & Planets VI review, discussion of protostellar multiplicity centered on infrared observations of Class I systems, since there were few observations of multiplicity in Class 0 systems (Reipurth et al., 2014). These studies tended to have inhomogenous separation distributions, owing to different region distances, and many were limited to separations au, which does not probe the field star separation peak (see Fig. 6). Nevertheless, observations provided tantalizing evidence that the multiplicity fraction of protostars is higher than that of pre-MS and MS stars (Looney et al., 2000; Chen et al., 2013) suggesting that most systems form as multiples.
In this section, we review recent impactful case studies and large surveys using (sub)millimeter continuum observations from interferometers that probe complete populations of both Class 0 and Class I sources in nearby clouds. We describe new emerging trends and discuss their implications for multiple star formation and evolution.
4.1 Starless Cores
Multiplicity can begin prior to the onset of star formation when starless cores and filaments fragment to form multiple density peaks (see §3.1). We define starless cores as those with no detected protostar and independent of whether they are gravitationally bound. Observations of the internal structure of collapsing starless cores are required to understand how and when this mode of multiple formation occurs. Detecting multiple density peaks or extended internal structure within a given starless core does not guarantee multiple formation, however, since the objects must also be self-gravitating and undergoing collapse. Current literature tends to define any compact emission that is detected within a starless core using interferometry as substructure. The presence of two or more substructures suggests that the core is undergoing the first phase of collapse with possible incipient multiple formation, which is our main focus here.
At the time of Protostars & Planets VI, surveys of starless cores had found few cases of substructure (Schnee et al., 2010; Schnee et al., 2012; Lee et al., 2013). The profusion of non-detections placed upper limits on substructure masses of . Deeper studies of a few objects successfully detected substructure: L 183 (Kirk et al., 2009), R CrA SMM1 A (Chen and Arce, 2010), Oph A SM1 (which has since been identified as protostellar, see §4.3.1), and Oph B2-N5 (Nakamura et al., 2012). These deeper studies estimated substructure masses of on sub-1000 au scales, in agreement with the earlier non-detections.
ALMA has enabled large surveys of starless cores on sub-1000 au scales and down to the mass sensitivities of that are necessary to detect substructure (Dunham et al., 2016; Kirk et al., 2017). Dunham et al. (2016) found no substructure in 56 starless cores in Chameleon, whereas Kirk et al. (2017) detected substructure in only two out of 37 starless cores in Ophiuchus. The substructures detected by Kirk et al. (2017) include multiple density peaks in Oph A SM1N (see Fig. 5 and Friesen et al., 2018) and a single substructure in L1689N, a starless core to the east of IRAS 16293-2422 region (Lis et al., 2016). Oph B2-N5 was not detected by Kirk et al. (2017), however, likely due to a combination of lower sensitivities at long wavelengths and loss of emission from spatial filtering compared to Nakamura et al. (2012). In a targeted study, Caselli et al. (2019) detected multiple density peaks in the starless core L1544.
The relatively low substructure detection rate in starless cores implies that the cores have not reached sufficiently high central densities (possibly because collapse is not occurring) or that the timescale over which the substructure is detectable before protostar formation is short. Kirk et al. (2017) reasoned that if the typical starless core lifetime is comparable to the free-fall time then two detections in 37 starless cores implies a substructure timescale on order of 5 kyr assuming a central density of cm-3. Dunham et al. (2016) used synthetic observations of MHD simulations of turbulent cores and Bonnor-Ebert sphere models to constrain the likelihood of detection. They found that substructure is only detectable at their survey resolution toward the end of the starless stage (after Myr) when the central density exceeds cm-3, i.e., when the free-fall time itself is less than 10 kyr.
Assuming typical core properties and that cores fragment on their free-fall timescale, Dunham et al. (2016) expected roughly two cores in the Chameleon sample to show substructure. Most of these cores, however, are gravitationally unbound, suggesting they are less evolved and it is possible some of them will not collapse to form stars at all. By contrast, the cores in Ophiuchus are denser, likely more evolved and therefore are more likely to contain substructure (Kirk et al., 2017). Given the short timescales during which high densities are present prior to protostar formation and the large fraction of unbound cores in star-forming regions, detecting substructure in starless cores is challenging even with ALMA. Future studies will require large samples of cores or targeted observations with a balance of high resolution and moderate scales. Offner et al. (2012b) found that synthetic observations of core fragmentation simulations that combined the main ALMA array with the ACA were key to detecting substructure in starless cores (see also, Dunham et al., 2016).
It is worth noting that of the substructure detections in starless cores, most (4/6) show evidence of multiple density peaks in dust continuum, e.g., as shown in Fig. 5. This occurrence rate is consistent with that of turbulent fragmentation models, which predict that a significant fraction of cores and filaments that do collapse to form stars undergo fragmentation. This sample suggests that when substructure is detected there is a high probability that it shows evidence of multiple formation.
The amount of core turbulence may be an important signpost for targeted studies searching for fragmentation. However, there has been no rigorous study comparing the turbulent properties of structured and unstructured cores. Figure 7 compares the non-thermal velocity dispersion, , to the virial parameter () of starless objects that have detected substructure (black triangles) with the larger starless core populations in Ophiuchus and Chameleon (grey symbols). To first order, a core has supersonic turbulence if and subsonic turbulence if ; it is bound if and unbound if (McKee, 1999). We calculate a virial mass assuming , where is the total velocity dispersion, is the size of the core, and we calculate assuming and the gas is isothermal. We note that all values are taken from the literature where the turbulent properties, temperature, and mass estimates are all calculated differently and thus a thorough consistent study of starless core properties is still needed.
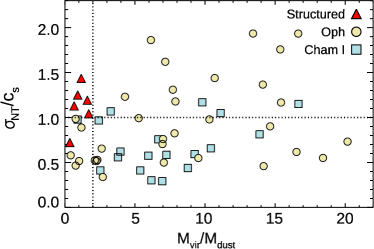
Figure 7 shows that the general starless core populations in Ophiuchus and Chameleon exhibit wide ranges of velocity dispersion and degree of gravitational boundedness, whereas the few cores that have detected internal structures are all bound and most (5/6) have supersonic turbulence. The only subsonic core is L1544, which shows evidence of infall (Keto et al., 2015), indicating that it is collapsing. While cores without detections may still have structure below the observed sensitivity limits, the structured cores have density peaks that are more substantial and more likely to result in multiple star formation (e.g., Dunham et al., 2016). This distinction suggests that bound, turbulent, and collapsing cores are the best candidates for substructure searches.
4.2 Protostellar Multiplicity Statistics
Prior to Protostars & Planets VI the lack of large, unbiased protostellar samples led to overly broad conclusions based on small samples (Looney et al., 2000; Maury et al., 2010). One of the first attempts to create a large sample was by Chen et al. (2013), with an archival study of submillimeter observations toward protostars. This greatly increased the number of characterized systems, but the archival data had non-uniform sensitivity and resolution.
The advent of ALMA and the upgraded VLA have now enabled truly uniform and unbiased surveys of multiplicity in nearby star-forming regions, where global statistics can be determined with high accuracy. Thus far, the protostellar populations of Perseus (Tobin et al., 2016b), Ophiuchus (Encalada et al., 2021), and Orion (Tobin et al., 2020, 2022) have been observed at uniform sensitivities and resolutions. This section reviews the statistical results of these censuses.
4.2.1 Multiplicity and companion frequencies
The MF and CF are key metrics for comparison to more evolved populations, but for a given sample they depend on separation range and protostellar Class, as well as any sample bias. For instance, the archival study of Chen et al. (2013) found MF=0.640.08 and CF=0.910.05 for protostars with a separation range between 50 to 5000 au. However, these values likely missed companions since the typical spatial resolution was 100s of au rather than 50 au.
Recent surveys of Perseus and Orion have well-defined angular resolutions and sensitivities (Tobin et al., 2022). From 20 to 10000 au, the MFs and CFs for the full protostellar samples (Class 0, Class I and Flat Spectrum) are 0.300.03 and 0.440.03, respectively, in Orion and 0.360.06 and 0.520.06, respectively, in Perseus. Both results are consistent within their uncertainties and both surveys have comparable minimum separations set by the angular resolution of the observations. For Class 0 protostars with separations between 20 to 10000 au the MFs and CFs are 0.380.05 and 0.620.05 for Orion and 0.470.09 and 0.740.08 for Perseus, which are consistent despite environmental differences. These results are lower overall with respect to Chen et al. (2013), despite the fact that Tobin et al. (2022) considers a wider range of separations. While the VANDAM surveys discovered a number of new companions with separations 200 au and wider companions at 5,000 au, these were offset by the detection of many additional single systems, thereby reducing the total MF and CF. Previous archival studies were limited to data biased toward the brightest millimeter sources, which also tend to have higher luminosities; Tobin et al. (2022) found that multiple protostar systems, regardless of separation, had systematically higher luminosities than single systems.
Multiplicity statistics change between protostellar classes within the same 20 to 104 au range of separations (Tobin et al., 2016b; Tobin et al., 2022). In Orion, the MFs and CFs of Class I protostars are 0.230.04 and 0.32 0.05, respectively, while for Perseus they are 0.270.09 0.350.09, respectively. Thus, Class I protostars have lower multiplicity than Class 0 protostars for the same separation range. The relative MFs and CFs are 40% and 50% lower for both regions, respectively, having 3 differences.
The MF and CF for Flat Spectrum protostars in Orion are consistent with the Class I statistics. Flat Spectrum protostars were not classified separately for Perseus but are combined with the Class I sample. These differences indicate multiplicity evolution between Classes (see §4.4.2).
Other comprehensive studies of multiplicity have been carried out in Orion at infrared wavelengths, but these studies were limited to 1000 au separations due to contamination on larger scales. Kounkel et al. (2016) measured a CF of 0.14, which includes mostly Class I and Flat Spectrum sources, demonstrating the large variation in MF and CF for different separation ranges and evolutionary stages (see §4.2.2). In this range of separations for a comparable sample of Class I and Flat Spectrum protostars, Orion has a MF and CF of 0.100.02 and 0.110.02 (Tobin et al., 2022), respectively. These are slightly lower but still consistent with the statistics from Kounkel et al. (2016), which is likely because the centimeter/millimeter observations are more incomplete toward Class I/Flat Spectrum protostars than near-infrared observations (Tobin et al., 2022).
Finally, Encalada et al. (2021) characterized the Class I and Flat Spectrum protostellar multiplicity in Ophiuchus for the separation range between 15 au and 1600 au. They found a combined Class I and Flat Spectrum MF and CF of 0.250.09 and CF=0.330.10, respectively, which is consistent with those of Orion and Perseus.
4.2.2 Separation distributions
High spatial resolution, uniform surveys now measure companion separation distributions down to 50 au, similar to studies done for MS stars (see §2). The large sample sizes enable studies as a function of protostellar class, which have distributions that appear distinct from those of MS stars (Figures 2 & 6).
Tobin et al. (2016b) detected an apparent bimodal separation distribution for the full sample of Perseus protostars with peaks at 75 au and 3000 au. The positions of the two peaks indicate both disk and turbulent fragmentation operate. However, the wide-separation feature is mainly produced by the Class 0 sources, and a reanalysis of the Perseus data does not rule-out a log-flat distribution. Orion also exhibits a bimodal separation distribution with similar peak locations (Tobin et al., 2022). The larger samples for Orion alone and the combined Orion and Perseus samples strongly disfavor a log-flat distribution for both Class 0 and Class I protostars.
(Encalada et al., 2021) measured the separation distribution from 15 to 1600 au for Class I and Flat spectrum protostars in Ophiuchus. Despite small numbers, this distribution is quite similar to that of Perseus and Orion and has an average separation of 183 au. The similarity of separation distributions in different star-forming environments suggests multiple systems form via similar physical processes.
4.3 Markers of Binary Formation
4.3.1 Multi-generational systems
MS stars in multiple systems are generally expected to have formed together and have similar ages. Nevertheless, theoretical models predict age differences up to a few Myr between stars in multiple systems. While a few Myr age difference is difficult to identify in MS multiples, it can potentially be observed in younger systems. In this section, we review forming multiple systems that appear to have distinct star formation epochs and discuss the degree of age difference. We use the term non-coeval to describe apparent protostellar age differences.
Murillo et al. (2016) examined the spectral energy distributions (SEDs) of 16 protostellar multiples in Perseus with data from micron to millimeter wavelengths and found that roughly a third of the wider ( au) multiple systems contained members with different Classes. Assuming Class is an accurate proxy for age, the implied age differences are consistent with those predicted ( Myr) by numerical simulations (e.g., Lee et al., 2019).
Recent ALMA observations have identified starless substructures near protostars that may point to core fragmentation after star formation is well underway. Two instances are Oph A SM1 and Oph A N6 (Friesen et al., 2018). Oph A N6 exhibits two peaks, one of which appears protostellar (Friesen et al., 2018). Recent ALMA observations show that one of the peaks in Oph A SM1 is also likely protostellar (Friesen et al., 2014). Oph SM1 appears connected to the structured starless core SM1N to the north (see Fig. 5) and a chain of other protostars to the south (Friesen et al., 2014; Kirk et al., 2017), suggesting that the entire region may be undergoing filamentary fragmentation with an age gradient from north to south.
Another example is B5, a bound elongated core that contains two starless filaments that extend away from a central Class I protostar (Pineda et al., 2011). Pineda et al. (2015) found three dense condensations within these filaments as shown in Fig. 5, which are incipient sites of star formation that could ultimately produce a non-coeval quadruple system. Schmiedeke et al. (2021) showed that the mass per unit length () exceeds the expected critical value required for stability (see 3.1), in agreement with the presence of the embedded condensations. Thus, core and filament gas surrounding young protostars may still fragment, producing age differences comparable to the duration of the protostellar lifetime, i.e., Myr.
4.3.2 Protostellar disk stability
Observations of massive circumbinary and circum-multiple disks provide evidence for the occurrence of disk fragmentation. A number of studies have found extended structures around already formed, tight multiple systems (e.g., Tobin et al., 2016b, a; Lim et al., 2016; Brinch et al., 2016; Takakuwa et al., 2017; Kraus et al., 2017; Harris et al., 2018; Artur de la Villarmois et al., 2018; Alves et al., 2019; Lee et al., 2020a; Tobin et al., 2020), some of which exhibit Keplerian rotation signifying that they are circumbinary disks (e.g., Murillo et al., 2016; Artur de la Villarmois et al., 2019; Reynolds et al., 2021). Direct confirmation of disk fragmentation, however, is difficult since protostars formed by turbulent fragmentation combined with orbital evolution can drive wide companions to closer separations (see §3.3). The Toomre Q parameter provides insight into the actual degree of disk stability (§3.2). In this section, we adopt a critical Toomre Q of ; while this threshold for fragmentation is not universal, the variation is far smaller than the observational error bars (Kratter and Lodato, 2016).
The number of disk stability measurements using the Toomre Q parameter are increasing, although all calculations of Toomre Q should be considered first-order estimates due to uncertain temperatures, dust opacities, and dust-to-gas conversion factors that are necessary to obtain surface densities. Additional diagnostics, such as evidence of disk structure, are therefore necessary to verify instability. The circum-multiple disk of L1448 IRS3B in Perseus (Fig. 5) is a prime candidate for disk fragmentation. The disk geometry and rotation is centered on a close binary system, but a third object is detected in the outer spiral arm ( au from the binary). This tertiary feature also appears protostellar, with a compact source that is driving an outflow (Reynolds et al., 2021). At the radius of the tertiary source the disk has (Tobin et al., 2016a; Reynolds et al., 2021), supporting the theory that this protostar companion was produced by disk fragmentation. Similarly, the Class I protostar HH111 MMS has spiral structure, (Lee et al., 2020a) and a wide companion. Although no fragments are detected toward this disk yet, the similarities to L1448 IRS3B suggest it is a prime candidate for fragmentation.
Nevertheless, most protostellar disks with measured Toomre Q values appear to be stable. Tobin et al. (2020) measured the Toomre Q parameter for 259 disks in Orion that are in either single star systems or in wide binaries, finding that only six were consistent with being gravitationally unstable (see also, Sharma et al., 2020). Moreover, some structured circumbinary disks have large Toomre Q values indicating that they are stable. Reynolds et al. (2021) found hints of spiral structure toward the disk of L1448 IRS3A, a more distant companion to L1448 IRS3B (Tobin et al., 2016a), with . Similarly, Alves et al. (2019) and Diaz-Rodriguez et al. (2022) each found prominent spiral structure in a Class I circumbinary disk and . These cases show that spiral structure alone does not indicate gravitational instability. Alternatively, spiral structure may be caused by dynamical processes such as interactions between the embedded protostars or it may be a remnant of a previously more massive disk from which the stars formed. We note that protostellar disks can accrete material from the surrounding envelope. Thus, this simple picture of gravitational instability is more complicated, since the disk mass and surface density change over time.
The lack of marginally-unstable disks suggests disk instability is either short-lived or rare. In the former case, disks fragment quickly such leaving behind a compact multiple system. In the latter case, if few disks ever become gravitationally unstable then most protostellar companions at separations au must be produced by migration. Further observations tracking fragmentation and disk stability in different cloud environments across multiple evolutionary stages are necessary to distinguish the fractions of close multiples produced in situ within disks versus those produced by migration.
4.3.3 Protostellar disk properties
In this section, we compare protostellar disk properties in systems with multiple and single stars. For simplicity, we exclude systems that have confused disks that are blended with circumbinary structures (see §5.2) or very close companions. Fig. 8 shows cumulative mass and size distributions for protostellar disks in Orion, which is the largest available sample (Tobin et al., 2020). The disks are separated into three populations: single-star systems, close and intermediate multiple systems, and wide multiple systems.
Disks in close and intermediate multiple systems are statistically smaller in mass and size than those in wide multiples with p0.01 from a Kolmogorov-Smirnoff test, whereas disks in single and wide-multiple systems tend to be consistent in both mass and radius. These trends indicate that the proximity of companions in close and intermediate multiple systems affects young disk properties. Wider companions, however, have little to no effect, and disks in those systems appear similar to those of single stars (see §5.1).
2.2
Orion_Class0I_NB_vs_B_140au_det.pdfOrion_radii_Class_0I_B_vs_NB_all.pdf
4.3.4 Protostellar system orientations
Stars that form via turbulent fragmentation should have uncorrelated angular momenta, since these protostars form in distinct, well-separated core substructures, whereas companions produced by disk fragmentation, form in a single plane and should have preferentially aligned angular momentum vectors (Offner et al., 2016; Bate, 2018). Early observations of field star rotation appeared to support this picture (Hale, 1994). However, a rigorous statistical reanalysis of the Hale (1994) data concludes that these data are insufficient to make any claims about spin-alignment (Justesen and Albrecht, 2020). A handful of individual measurements of eclipsing binaries reveal heterogeneous orientations, but with a preference towards alignment (Sybilski et al., 2018). To complicate matters, a myriad of mechanisms can torque multiple star systems into or out of alignment, such as turbulent accretion, magnetized accretion, ejections, inclination oscillations, and damping from the disk (Lubow and Ogilvie, 2000; Valtonen and Karttunen, 2006; Batygin and Adams, 2013; Fielding et al., 2015; Lee et al., 2017b; Jennings and Chiang, 2021).
Observations of forming systems provide a stronger test of the natal spin orientations of multiple systems before dynamical processes affect them. A variety of recent surveys have explored the angular momentum of young multiple systems by using the outflow or disk orientations as a proxy for angular momentum direction. We note that even in these studies, where an angular momentum direction can be robustly measured and assigned to each protostar, such proxies only reflect the current angular moment direction of gas on au radii from the stars and do not directly probe the (proto)stellar spin or system orbit.
Using observations of outflows, Lee et al. (2016) studied the orientations of nine multiple systems in the Perseus cloud with separations au using data from the MASSES survey (Stephens et al., 2019). They found that the relative outflow orientations in these systems were consistent with either random or preferentially perpendicular alignments. For companions with separations less than a few hundred au, however, individual outflows can overlap in projection (e.g., Stephens et al., 2017). Blended outflows are difficult to disentangle and can bias the angular differences toward misalignment (Offner et al., 2016).
To date, there are no systematic studies of protostellar disk alignments. Many protostellar binaries with separations less than a few hundred au have disks with similar inclinations and position angles (see Tobin et al., 2016b; Tobin et al., 2020). This similarity in disk geometries implies aligned angular momentum vectors, in agreement with the simple picture of disk fragmentation. Similarly, several wider multiples have misaligned disks in agreement with turbulent core fragmentation producing random angular momentum vectors, i.e., NGC 1333 IRAS2 (Tobin et al., 2015), IRAS 04191+1523 (Lee et al., 2017a), BHR 71 (Tobin et al., 2019), GSS 30 (Sadavoy et al., 2019), HOPS 182 (Tobin et al., 2020), and HH111 MMS (Lee et al., 2020a).
Nevertheless, some protobinary systems with separations au seem misaligned. Oph-IRS 43 and Oph-IRS 67 are close binaries that appear misaligned with respect to circumbinary disks, whereas the circumstellar disks for the tight binary in L1551 IRS 5 are inclined moderately (\arcdeg) relative to the circumbinary disk and the circumstellar disks in a wider binary, L1551NE, are inclined relative to each other (Brinch et al., 2016; Takakuwa et al., 2017; Artur de la Villarmois et al., 2018; Cruz-Sáenz de Miera et al., 2019). Recent high resolution ALMA observations of the outflow of VLA 1623A show that its tight binary ( au) has misaligned outflows and disks (Hara et al., 2021). Similarly, a disk resolved in the triple system IRAS 16293-2422 exhibits a misalignment with the surrounding circumbinary disk (Maureira et al., 2020). Such misaligned systems may have formed at larger separations via turbulent fragmentation and then migrated inward (see §3) or the system may have been perturbed from an originally aligned orientation by dynamical interactions.
4.4 Environment Around Forming Binaries
4.4.1 Core and envelope properties
Proto-multiple systems are embedded in dense cores and envelopes, which likely provide clues about multiple formation. However, to date there has been few systematic studies of the surrounding environments of such systems. Sadavoy and Stahler (2017) compared the separations of multiple protostellar systems in the Perseus cloud with the properties of their host cores. They found that the projected distance vectors of wide binaries with separations au are preferentially aligned with the long axes of their host cores, whereas tighter systems are more randomly orientated. This correlation suggests core fragmentation proceeds within a preferred plane, possibly due to rotation, magnetic fields, or both (see §3), whereas disk fragmentation or dynamics randomizes the orbit orientation relative to the host core. Luo et al. (2022) examined the binarity and core properties of 43 systems in the Orion cloud. They found that the cores hosting multiple systems tended to have higher column and volume densities and higher Mach numbers than those hosting single stars. Higher densities and Mach numbers promote thermal Jeans fragmentation and turbulent fragmentation, respectively. This result suggests that multiple stars form from cores that are both turbulent and dense, in agreement with the structured detections for starless cores (see Fig. 7).
Magnetic fields can greatly influence the formation of multiple systems, particularly if the field is aligned with the system angular momentum vector (see §3). However, magnetic field observations exist for only a few protobinary system envelopes ( au). L1448 IRS 2 is a Class 0 protobinary system with an inferred envelope magnetic field resembles an hourglass and is aligned with the system rotation axis (Kwon et al., 2019). Models indicate this field geometry enhances magnetic breaking and might produce more compact disks. Nevertheless, L1448 IRS 2 has a circumbinary disk (Tobin et al., 2018). Similar polarization morphologies are seen toward the envelopes or circumbinary material of the protobinaries Per-emb-2 (Cox et al., 2018), BHB07-11 (Alves et al., 2018) VLA 1623A (Sadavoy et al., 2018a), IRAS 16293A (Sadavoy et al., 2018b), and BHR 71 (Myers et al., 2020), although it is unclear whether the polarization uniquely traces pinched fields versus outflow cavities.
Some protobinaries also have complex circum-multiple material. Theoretical studies predict that bridges of dust and gas can connect binary stars, thereby affecting their formation and accretion properties (§3.1.2). At present, only the IRAS 16293-2422 protobinary system shows such a filament of dust and gas connecting young low-mass stars (separated by au Jørgensen et al., 2016). This dust bridge has relatively uniform polarization indicating a structured magnetic field (Sadavoy et al., 2018b), allowing gas to flow freely along the bridge. MHD simulations by Kuffmeier et al. (2019) show that such features occur when binaries form at wider separations (au) and migrate inward. If bridge features are transient, large high-resolution surveys are needed to constrain their properties and lifetimes. Binary interactions may also enhance the degree of bursty accretion and affect gas chemistry (Jørgensen et al., 2022).
4.4.2 Stellar densities
The local density of stars influences the evolution of multiple systems, such that wider members may be dynamically stripped from systems located in dense cluster environments. This process is illustrated by the deficit of Class II and III companions with separations greater than 250 au in the ONC, where the stellar surface density is 770 pc-2 (Reipurth et al., 2007). The companion frequency is higher for field stars and pre-MS stars in Taurus, which have stellar densities down to 35 pc-2 (see right panel of Fig.2).
Kounkel et al. (2016) completed a large Hubble Space Telescope and NASA Infrared Telescope Facility Survey of Class I and Flat Spectrum multiplicity toward protostars in the Herschel Orion Protostar Survey (HOPS, Furlan et al., 2016). They estimated the YSO density around each protostar by combining the HST data with complementary Spitzer and X-ray data. Adopting 45 pc-2 as the boundary between high and low YSO surface density, they find the CF for the 100-1000 au separation range is larger by 50% (0.05 to 0.11) in higher surface density regions.
Building on these results, Tobin et al. (2022) used the ALMA and VLA surveys of Orion to examine the influence of YSO surface density on protostellar multiplicity. They find higher MF and CFs in regions with YSO surface densities above 30 pc-2, confirming the results of Kounkel et al. (2016). They also demonstrated a relationship between stellar density, separation range, and protostellar Class. For a separation range of 20 to 104 au, all protostellar Classes have higher MFs and CFs in higher YSO density regions.
This trend holds for Class I and Flat Spectrum sources with smaller separation ranges of 20 to 103 au and 100 to 103 au. Class 0 protostars, however, have MFs and CFs that are statistically consistent in low and high YSO surface densities over all separation ranges.
These results indicate that YSO surface density impacts multiplicity on scales 1000 au, but that impact is only apparent after the Class 0 phase. Tobin et al. (2022) suggested that the Class 0 results reflect the primordial multiplicity, which does not have a strong dependence on YSO density. In contrast, the elevated MFs for more-evolved protostars are likely produced by the migration of companions from 1000 au to 1000 au (see §3.3). The higher CFs from 20 to 104 au for all Classes at higher YSO density naturally provide a reservoir of companions that can migrate to smaller separations. This is consistent with the turbulent fragmentation model, which predicts companions form at wide separations and then migrate inward (§3.1).
Thus, higher YSO densities may enhance rather than reduce multiplicity. These high YSO densities are likely produced by higher initial gas densities, which may favor fragmentation (Gutermuth et al., 2011). We note, however, that the YSO surface densities in the Orion molecular clouds are lower than the stellar densities in the ONC, which exceed 100 pc-2. Above some threshold, high YSO density likely hinders multiple star formation and the ability of such systems to retain wide companions.
5 IMPACT OF MULTIPLICITY ON PLANET FORMATION AND SYSTEM ARCHITECTURES
The high frequency of multiple systems has the potential to have a strong impact on planet formation, both in terms of the overall frequency of planetary systems and on the architecture of those systems. In this section, we review the connections between multiplicity and planet formation, but we do not attempt a comprehensive review of all observations of protoplanetary disks in multiple systems. Instead, we focus on some specific areas where the observations place particular constraints on planetary system properties, either current or future. After discussing disks in binaries, we summarize the final population statistics for planets in binary systems among field stars, again focusing on aspects that shed light on formation models.
5.1 Raw Material for Planet Formation: Disk Sizes and Masses in Multiple Systems
5.1.1 Disk masses and millimeter fluxes
It has long been known that stellar companions with separations on the order of disk radii ( 10 to 100 au) affect disk structure, reducing disk masses compared to disks around single stars (Beckwith et al., 1990; Osterloh and Beckwith, 1995; Jensen et al., 1996; Harris et al., 2012). Indeed, surveys that start from a sample of young stars without pre-selecting them based on whether or not they host disks find that the overall disk frequency is lower in close binaries than in wider binaries or single stars (e.g., Cieza et al., 2009; Cheetham et al., 2015).
Since Protostars & Planets VI, ALMA observations have added nuance to such studies due to the combination of ALMA’s high spatial resolution and sensitivity, particularly focusing on stars that still retain disks, i.e., the Class II phase, and measuring the properties of those disks that still survive at this age. ALMA has resolved many more binaries at millimeter wavelengths, allowing comparative studies of disk radii, and determining the flux distribution in circumprimary and circumsecondary disks. Increased sensitivity has allowed millimeter-wavelength detection of many more disks around secondary stars in particular, enabling comparisons of disk properties around primary and secondary stars within binary systems. Such studies also extend to much lower stellar masses for both binary and single stars, thus including disks that are arguably more typical of the overall population of young stars.
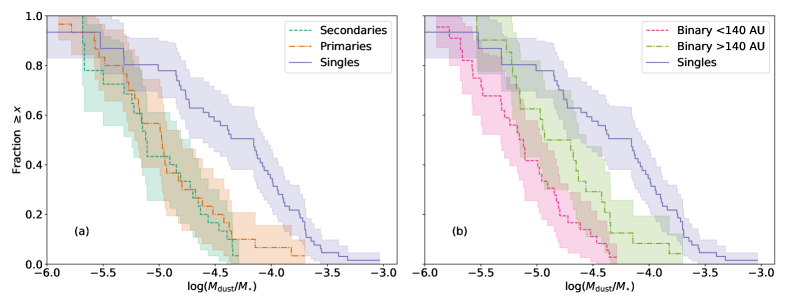
Akeson et al. (2019) combined new ALMA observations with literature data to assemble a sample of Class II binaries in Taurus wider than 30 au and with spectral types of M6 and earlier and compared these to a sample of single stars. To isolate the effects of binarity as cleanly as possible, the single-star sample was required to have high spatial resolution in the optical or IR, and the binary sample was restricted to double systems only, removing the complicating effects of hierarchical systems. As has been seen previously, binaries with a companion closer than 140 au show reduced mm flux, while the mm flux distribution in wider binaries is indistinguishable from that of single stars. However, some interesting new results emerge when the individual stellar masses are taken into account. It is well established that disk mass is correlated with stellar mass (e.g., Andrews et al., 2013; Pascucci et al., 2016). To account for this, Akeson et al. (2019) compared the distributions of in binaries and single stars and found that both primaries and secondaries, in both close and wide binaries, have reduced disk masses (on average) compared to single stars when corrected for stellar mass (Fig. 9a). While the difference between wide binaries and single stars is less than that for close binaries vs. singles (Fig. 9b), this result suggests that even the disks in wider binaries are influenced by membership in a binary system. In addition, after correcting for stellar mass, primaries do not dominate the disk mass in a given binary system; the ratio has about the same distribution for primaries and secondaries. We note here that this and other similar studies assume that the mm continuum emission is largely optically thin, so that the emission traces the total dust mass in the disks.
Zurlo et al. (2020, 2021) studied disks in binaries in Oph and Lupus, combining new adaptive optics observations to search for companions in their sample with previous ALMA observations of disks from the ODISEA survey (Cieza et al., 2019; Williams et al., 2019). They found that the most massive disks are present only around single stars, and they argue that for more typical disks (those with ) the dust mass distributions are similar for single stars and multiple systems.
While the studies discussed above focus on Class II systems in 1–3 Myr old star-forming regions, Barenfeld et al. (2019) find somewhat different results for Class II systems with ages of 5–11 Myr in Upper Sco. Unsurprisingly the 0.88 mm flux density distributions of all groups (close binaries, wide binaries, and single stars) in Upper Sco are shifted to lower values compared to the younger Taurus association. In contrast to Taurus, Upper Sco exhibits no significant difference in the mm flux distributions of these three groups; in particular, close binaries have the same flux distribution as single stars. The stellar mass distributions of the three groups are similar as well, so this appears to be a real difference in the disk properties and not an artifact of different stellar masses.
5.1.2 Disk radii
One notable change in the ALMA era, compared to work with previous millimeter facilities, is the ability to measure (or at least constrain much better) disk radii, not only for the largest and brightest disks, but for more typical disks across a range of stellar masses. Cox et al. (2017), studying a sample of mostly Class II stars in Oph, found that dust disk radii among the binaries in their sample are smaller on average than those of single stars. Manara et al. (2019) found a similar result in Taurus, with the added information that their single-star and binary samples have similar distributions of stellar masses, showing that this result is not a side effect of the single stars in the sample being preferentially more massive. In contrast, Barenfeld et al. (2017) found that dust disks in Upper Sco in general, i.e., in both singles and binaries, are smaller by a factor of 3 than those in similar-stellar-mass samples in Lupus or Taurus and Ophiuchus (Tazzari et al., 2017; Tripathi et al., 2017, see also Hendler et al. 2020). Barenfeld et al. (2019) suggested that much of the difference between the single and multiple-star samples may be due to differing evolution of disk radii; tidal truncation may limit young disk sizes in binaries, but single star disks later “catch up” in reducing their sizes, perhaps by radial drift of dust, photoevaporation, dust fragmentation, and/or viscous accretion (e.g., Gorti et al., 2015).
Both Cox et al. (2017) and Manara et al. (2019) found that the measured dust disk sizes in binary systems are smaller than would be expected from tidal truncation alone, unless all systems had very large eccentricities. However, dust and gas disk sizes need not be the same; Zagaria et al. (2021b) showed that once the faster radial drift of dust expected in binary disks is taken into account, the observed dust disk sizes in binaries are consistent with the expected tidal truncation radii for modest eccentricities. Rota et al. (2022) confirmed this observationally, showing that most of these systems have gas disks that are larger than their dust disks, consistent with radial migration of the dust. There is no discrepancy between the observed gas disk radii and expectations from tidal truncation models, assuming eccentricities consistent with the field eccentricity distribution.
For the older disks in Upper Sco, it is not only curious why the disks in binaries have fluxes similar to those for single stars, but why (at least for the binaries) the disks are there at all. As noted above, at 1–2 Myr ages the binary disks were already small, and both gas dispersal and radial drift of the dust should be faster in binaries, with models predicting that disks in binaries with separations less than 100 au should be depleted completely in just a few Myr (Rosotti and Clarke, 2018; Zagaria et al., 2021a). There is also no evidence of a circumbinary reservoir that is replenishing these disks (see §5.2). Here it is important to note that the studies of Barenfeld et al. (2017) and Barenfeld et al. (2019) (as well as most of the other studies cited above) adopt a target sample containing only Class II systems in order to study why systems with ages similar to Upper Sco still retain some disk material. Thus, the similarity of the disk properties in binaries and singles may reflect similar mechanisms for retaining disks on timescales of 10 Myr in any type of system. If the remaining disks are those that have developed large pressure bumps and/or dust traps, the similar disk properties might suggest that the dust-retention mechanism, rather than multiplicity, is now the dominant force driving disk evolution.
5.2 Circumbinary Disks
Most of the above discussion concerns disks that are circumstellar with a given disk centered around one specific star in the system, but orbital dynamics also allow for circumbinary disks, the presumed birthplace of circumbinary planets, roughly a dozen of which have now been discovered by Kepler (summarized in Martin 2019) and TESS (Kostov et al., 2020, 2021).
While there are some notable examples of Class II circumbinary disks, they are surprisingly rare. Stable circumbinary orbits exist for disk material starting at 2–3 times the binary semi-major axis, depending on eccentricity (Artymowicz and Lubow, 1994). If close binaries only impacted a parent disk via inner tidal truncation, we would easily detect circumbinary disks extended out to au around systems with separations of several tens of au, i.e. those near the peak of the binary period distribution (§2.4). In fact, such disks are uncommon. Czekala et al. (2019) compiled a list of known circumbinary disks around young stars; among the stars with ages of 1–20 Myr, only 4 of the 30 circumbinary disks are around binaries with semi-major axes wider than 10 au. Given the completeness and high-sensitivity of ALMA surveys in nearby star-forming regions, the lack of circumbinary disks around multiples with separations 10–20 au suggests they are truly scarce. Anecdotally, at younger ages there are a number of known circumbinary structures around systems in this separation range (§4.3.2), but it is not clear that the difference in disk frequency is statistically significant. If the difference is real, it could imply the structures seen in the embedded phase are not stable Keplerian disks or that circumbinary disks dissipate rapidly during the final phases of binary formation. As we discuss further in §5.4.2, the reappearance of circumbinary debris disks only deepens this puzzle. In higher order multiples , it may be that confinement of the circumbinary disk due to both the internal binary and an external companion slows its viscous evolution and contributes to a longer lifetime (e.g., HD 98800, Ribas et al. 2018; Ronco et al. 2021; TWA 3, Czekala et al. 2021).
Among closer binaries, there may be an anti-correlation between the binary mass ratio and the likelihood of retaining a circumbinary disk. As noted in §2.4.1, in a large sample of young stars, Kounkel et al. (2019) find that sources with disks are much less likely to be double-lined spectroscopic binaries than those without disks, but that the deficit of binaries is recovered when considering single-lined systems with RV variability. Thus, perhaps the formation of unequal-mass binaries allows or is aided by the presence of a circumbinary disk.
5.3 Orbit-Disk Alignment
Within a given young binary system, the relative orientation of the binary orbital plane and any disks in the system provides constraints on binary formation mechanisms (see §4.3.4). Even if the birth alignment is substantially altered by the time of the Class II phase, disk alignment also provides insight into the architecture of future planetary systems, since the planets will (at least initially) lie near the disk plane. Resolved disk images trace out potential planetary orbits on the sky and thus provide insights into the initial orientation of those orbits, informing our understanding of future (mis)alignment. As in the previous sections, we separate the discussions of circumbinary and circumstellar disks, since their observational constraints differ.
5.3.1 Alignment of circumbinary disks
The only systems for which the binary orbital orientation can be meaningfully constrained on an individual (rather than statistical) basis are those that complete a non-negligible fraction of their orbits on human timescales, i.e., those with periods less than a few hundred years. For low-mass stars, this implies semi-major axes less than tens of au and thus, as discussed above, any remaining disks (and certainly most resolvable disks) tend to be circumbinary rather than circumstellar. Despite their rarity, known circumbinary disk systems are valuable since they allow direct comparison of orbital and disk orientations.
For systems with double-lined spectroscopic orbits and circumbinary disks, the binary orbital inclination can be measured by determining from the orbit and the sum of the stellar masses from the rotation of the disk (Prato et al., 2002; Rosenfeld et al., 2012; Czekala et al., 2016, 2017; Prato et al., 2018). For short-period binaries, measurements of generally agree with the observed disk inclination , strongly suggesting coplanarity of disk and binary orbital planes. Formally, does not require coplanarity since , the position angle of the ascending node of the binary orbit, is unobserved and not guaranteed to be the same as the position angle of the disk. Nonetheless, Czekala et al. (2019) showed observations can constrain the distribution of relative orientation angles . They found that the data are consistent with binaries with days being aligned with their disks to within . Most of these systems also have circular orbits. In one case (V4046 Sgr), coplanarity is confirmed by the detection of eclipse-like shadows cast on the disk surface as the stars orbit (D’Orazi et al., 2019).
For longer-period binaries with circumbinary disks, the situation is dramatically different; most have eccentric orbits and (Czekala et al., 2019). While some recent discoveries follow these patterns (Czekala et al., 2021; Ragusa et al., 2021), notable counterexamples exist, as well; WW Cha ( days) and V892 Tau ( yr) are each aligned with their circumbinary disks to within (GRAVITY Collaboration et al., 2021; Long et al., 2021). Two systems, 99 Her (Kennedy et al., 2012) and HD 98800B (Kennedy et al., 2019), have disks with a polar orientation to the binary orbital plane.
These two populations agree well with predictions from the theory of disk-binary alignment. Short-period systems, particularly those that accrete from a circumbinary disk, are expected to efficiently align the disk and binary orbital planes on timescales shorter than a typical disk lifetime (Foucart and Lai, 2013). Alignment is faster for short-period systems both because it scales with orbital period and because these systems circularize their orbits quickly (Mathieu, 1992); a circular orbit means that the disk inner edge can be closer to the binary (e.g., Artymowicz and Lubow, 1994), increasing the alignment torque (Foucart and Lai, 2014). In contrast, in the presence of sufficient initial eccentricity and misalignment, a variant of the Lidov-Kozai mechanism (Lidov, 1962; Kozai, 1962) can cause an outer low-mass body (in this case, a disk gas or dust parcel) orbiting a massive inner pair to exchange eccentricity for angular momentum, causing its inclination to librate around (Verrier and Evans, 2009; Farago and Laskar, 2010). In a dissipative disk, librations are damped and the disk can settle into a polar configuration (Martin and Lubow, 2017). The higher the eccentricity, the lower the initial misalignment needed for the disk to reach polar alignment (Martin and Lubow, 2018). Some misalignment is required, though, providing a constraint on binary formation theories; the presence of these polar-aligned disks shows that at least some close binaries form with misaligned circumbinary disks.
Finally, we note that a circumbinary disk may not be a single, planar structure. Theory suggests that the disk can be warped or torn into separate rings (Nixon et al., 2013; Facchini et al., 2013, 2018), and these effects are observed in V892 Tau (Long et al., 2021) and the triple system GW Ori (Kraus et al., 2020), respectively.
In some cases the inner circumstellar disk is misaligned with the surrounding circumbinary disk (HD 142507; Price et al., 2018; Claudi et al., 2019), causing shadowing of the outer disk (Fukagawa et al., 2006; Avenhaus et al., 2014). However, it is not clear if all cases of inner/outer disk misalignment are caused by stellar companions since shadows are also present in some systems that lack known companions (Benisty et al., 2018; Pinilla et al., 2018).
5.3.2 Alignment of circumstellar disks
Wider young binary systems, especially those wide enough to host individually-resolvable circumstellar disks, typically have orbital periods that are too long for their orbits to be meaningfully constrained on an individual basis. In such systems the orbital inclination is unknown and cannot be compared to the disk inclination. However, in systems where more than one star has a disk, the orientations of the disks can be compared. If the disk inclinations are similar, there is a high likelihood that they also lie near the binary orbital plane, since the binary orbit has most of the system’s angular momentum, and thus disk orientations tend to be influenced more by the stellar companion than by the other star’s disk (Bate et al., 2000; Lubow and Ogilvie, 2000; Zanazzi and Lai, 2018).
It is clear that disks in young binaries are not all aligned, as numerous examples exist of individual systems with differing disk orientations (Stapelfeldt et al., 1998; Koresko, 1998; Roccatagliata et al., 2011; Jensen and Akeson, 2014; Williams et al., 2014; Fernández-López et al., 2017). The eponymous T Tauri system itself is a clear case of misalignment in a triple system (Beck et al., 2020, and references therein). For constraining binary formation models, however, systematic studies can inform the extent to which disks are aligned, misaligned, or even randomly oriented.
Some early surveys used polarization of unresolved disks to trace disk orientation in binary systems, finding that the two stars in most systems have polarization position angles that are more similar than would be expected from a random distribution (Monin et al., 1998; Jensen et al., 2004; Monin et al., 2006). This suggests a tendency toward disk alignment, though interpretation of the data is complicated by the relatively small polarizations in the unresolved light and possible contamination by interstellar polarization. Studies with resolved disks are clearly the way forward, and the advent of ALMA has made it possible to resolve disks in many more systems. However, the small sizes of disks in binaries (§5.1.2) and the need to resolve both disks in a given system means that it is still challenging to assemble large samples to study this question.
Jensen et al. (2020) combined new ALMA observations with data from the literature to assemble a sample of 8 binary systems (projected separations 100–2000 au) in which both disks are resolved and disk rotation is detected in CO for both components. The latter criterion makes it possible to determine whether disks with similar position angles and inclinations also rotate in the same direction, allowing three-dimensional constraints on the disks’ angular momentum. Indeed, Jensen et al. (2020) found there is a strong tendency for both disks in most systems to have similar orientations, and despite the modest sample size the overall distribution is inconsistent with random relative orientations at a high level of significance. There is no obvious correlation of misalignment angle with projected separation.
5.3.3 Implications for binary formation models
One challenge in connecting observed disk alignment to binary formation models is the uncertainty in how much disk orientations evolve between formation and the 1–2 Myr ages at which they are observed. Provided there is some dissipation in the disk, circumstellar disks should be driven toward alignment with the binary orbit (Lubow and Ogilvie, 2000; Bate, 2000; Zanazzi and Lai, 2018). This evolution means that observed Class II samples are likely to be more co-aligned on average than the systems were at formation. The presence of some systems with misalignments of many tens of degrees, and few systems that are perfectly aligned, thus is consistent with binary formation models (e.g. turbulent fragmentation; §3.1) that preferentially produce systems with disks that are misaligned with the binary orbit, at least for systems wider than a few hundred au. At the same time, theoretical calculations of alignment timescales (e.g., Zanazzi and Lai, 2018) predict significant tilt evolution in 2 Myr for systems with semi-major axes less than 200 au. Thus, the presence of well-aligned systems with separations of order 1000 au and the lack of systems with misalignments at any separation suggest that disk alignment is much faster than currently predicted and/or there is some tendency for binary formation to favor systems with non-random disk orientations. Rapid alignment may be more likely given observations of misaligned outflows and disks during the protostellar phase (§4.3.4). Preliminary evidence of a tendency toward alignment between binary companions and the orbits of close-in planets around one star (Christian et al., 2022; Dupuy et al., 2022) is consistent with the binary-disk alignmentseen at young ages, though there may be some difference in alignment statistics for close-in terrestrial planets and hot Jupiters (Behmard et al., 2022).
Finally, we note that the tendency toward disk-binary alignment means that most planetary systems in binaries will not have a stellar companion with a sufficient relative tilt for Kozai-Lidov oscillations to be effective in driving high-eccentricity migration, at least not for very long.
5.4 Constraints From Planets in Multiple Systems
Theoretical investigations of planet formation and survival in binary systems predate their discovery (Harrington, 1977; Szebehely and McKenzie, 1981; Innanen et al., 1997; Holman and Wiegert, 1999; Quintana et al., 2002; Nelson, 2003; Quintana and Lissauer, 2006). Early RV surveys were strongly biased against the detection of planets in intermediate and close separation binaries. Nevertheless a mass planet was discovered in the Cephei binary in the early 2000s (Hatzes et al., 2003). With a semi-major axis of only 2 au in a binary with semi-major axis of 20 au, it remains among the tightest binaries with a planet in a circumstellar orbit. The first circumbinary planet, Kepler 16b, was discovered by the transit method nearly a decade later (Doyle et al., 2011).
Since these first discoveries, there has been a deluge of new detections of planets in binaries. Some have derived from targeted RV surveys (Eggenberger, 2010), coupling RV with adaptive optics (Wang et al., 2014; Wang et al., 2015b), Kepler and TESS follow-up (Kraus et al., 2016; Wang et al., 2015c; Ziegler et al., 2020), and direct imaging (Wang et al., 2015a). Here, we focus specifically on the statistics and properties of planets in multiple systems in so far as they constrain the dominant formation mechanism of the host stars.
5.4.1 Planet occurrence rates in circumstellar disks
For circumstellar planets, we have robust data sets demonstrating that intermediate-wide separation binaries reduce disk masses and truncate disks, thereby substantially reducing the total mass reservoir available for planet formation (see §5.1.1,5.1.2). Planet occurrence rates in intermediate separation binaries are correspondingly depleted compared to single stars. Moe and Kratter (2021) estimated that between au, planet occurrence rates rise from of the single star rate to . It is noteworthy that both the disk properties and planet occurrence rates seem to converge to the singleton result around au. While there are claims in the literature that Hot Jupiters reside predominantly in intermediate separation binaries (Ngo et al., 2016), these claims are not borne out with revised statistical analyses (Moe and Kratter, 2019).
The connection between disk properties and planets is unsurprising. Binary eccentricity, disk truncation, and overall mass reduction should correlate with a reduced population of observable planets in intermediate separation binaries. Eccentric binaries especially inhibit planet formation by exciting collisional velocities between pebbles and planetesimals, favoring fragmentation over agglomeration (Silsbee and Rafikov, 2015a). Small disks can hinder planet formation even at disk radii well below the truncation radius; outer disks may serve as a vital reservoir for solids that are subject to rapid radial drift (Youdin and Chiang, 2004; Najita and Kenyon, 2014). Starving the inner disks of solids could also yield planets so small that they are mostly undetectable (Dupuy et al., 2016). These results imply that planets in binaries may have distinct mass and semi-major axis distributions. There is only tentative evidence for such a shift, data sets only support an overall reduction (Moe and Kratter, 2021; Hirsch et al., 2021), motivating future dedicated surveys.
Extracting constraints on formation channels from intermediate separation binaries is not straightforward. Disk and planet properties both return to their nominal single star values at the same separations where we expect disk fragmentation to be inefficient and turbulent fragmentation to dominate. It is then tempting to conclude that turbulent fragmentation does not substantially suppress planet formation. The coupled disk and planet trends also suggest that disk material beyond au contributes little to the planetary systems that dominate our data sets, i.e., those with orbits au. Future Gaia studies of slightly wider planets from e.g., astrometric detections, will confirm or refute this claim.
It is unclear whether a deficit of planets at smaller orbital separations indicates a transition between binary formation mechanisms. Both turbulent fragmentation with rapid gas-driven migration and disk fragmentation could create inhospitable environments for planets. Thus we believe the current data is insufficient to conclude that either a majority of closer separation binaries derive from disk fragmentation or that disk fragmentation is inherently less favorable to subsequent planet formation. We nevertheless put forward several hypotheses as to why disk fragmentation may hamper planet formation. Binaries formed via disk fragmentation might consume more of the remnant disk material than single stars – both because the instability drives rapid accretion prior to fragmentation and because of the introduction of a second mass sink. Moreover, as reviewed in other PPVII chapters current disk mass measurements in single stars point towards the very early growth of solids to planetesimal sizes. If gravitational instability prior to fragmentation reduces the survival rate of large grains, these systems might never quickly agglomerate dust into planets before it is lost to the star. Note that the presence of spiral arms due to gravitational instability could enhance solid growth rates in some cases (Rice et al., 2004; Baehr and Zhu, 2021). Finally, disk substructure around single stars due to pressure bumps may be crucial for retaining disk material and growing planets. The maintenance of these delicate structures might similarly be inhibited by both an instability preceding fragmentation and by the subsequent stirring of an embedded, migrating binary. This latter concern would be equally valid for binaries that derive from turbulent fragmentation and migrate to intermediate separations.
5.4.2 Planet occurrence rates in circumbinary disks
The relative rarity of circumbinary disk detections seems at odds with the discoveries from Kepler and TESS (Czekala et al., 2019). The dearth of disks, especially around binaries with au is (at least naively) unsurprising, given the myriad hurdles to survival posed by close binary formation models. Dynamical instability, capture, or secular oscillations like KL cycles would all be very destructive to circumbinary disks (Reipurth and Clarke, 2001; Clarke and Pringle, 1991; Muñoz and Lai, 2015; Hamers et al., 2016; Martin et al., 2015). Even disk fragmentation and subsequent migration might significantly deplete the circumbinary mass reservoir. Circumbinary planet statistics are improving if still limited (Armstrong et al., 2014; Martin, 2019; Kostov et al., 2020, 2021). The uncertainty is driven not only by the ad-hoc nature of most discoveries, e.g., by eye rather than via pipeline, though see Martin and Fabrycky (2021), but due to unknown inclination distributions. As circumbinaries are identified via transit surveys, only those well aligned with an eclipsing binary will be easily discovered. Note that in principle misaligned systems could show single transit events. Thus estimates for the occurrence rates of planets around close binaries range from (Armstrong et al., 2014).
We cannot easily reconcile these statistics with those of circumbinary disks, but ancillary evidence suggests that disk detections underestimate the true underlying reservoir of mass for forming such planets. Both historical and recent surveys of debris disks paint a different picture (Trilling et al., 2007; Yelverton et al., 2019). These studies mirror the dearth of bright disks in intermediate separation binaries but find debris disks in close binaries have a frequency consistent with that of single stars. One interpretation of the dichotomy between protoplanetary disks and debris disks is that the lifetime of the bright, gas-rich phase is very short, but not so short as to preclude planet formation.
Whether circumbinary disks provide a net boost or hindrance to planet formation is an area of active inquiry. Numerous studies conclude that planetesimal formation is more challenging in circumbinary disks due to higher collisional velocities and nodal precession driven by both the disks and binaries (Moriwaki and Nakagawa, 2004; Marzari et al., 2013; Silsbee and Rafikov, 2015b). Bromley and Kenyon (2015) have argued that beyond an inner critical radius that depends on binary properties, planet formation proceeds much like it does around single stars. Formation of planetesimals by the streaming instability could ameliorate the bottleneck even at closer separations (Youdin and Goodman, 2005; Silsbee and Rafikov, 2021). If formation is inhibited in-situ, inward migration must occur. State-of-the-art migration models for more massive planets can often reproduce the observed semi-major axis distribution of the known planets (Penzlin et al., 2021). This corroborates the view that planet scattering and dynamical instability are not responsible for the abundance of planets near the stability boundary set by the binary orbit (Li et al., 2016; Smullen et al., 2016). Though small planets remain undetected as of yet, terrestrial planet formation is also expected to proceed quickly, at least beyond some inner critical radius (Quintana and Lissauer, 2006). Recent models by Childs and Martin (2021) found that terrestrial planet formation can occur on an accelerated timescale in circumbinary systems, although the final masses are typically smaller than those in single star systems. This finding is roughly consistent with the dearth of circumbinary disks. At present all known circumbinary planets are above the terrestrial boundary . While smaller planets are harder to find, the detection limit is thought to be a factor of two smaller (Martin and Fabrycky, 2021). Future surveys will clarify whether the dearth of small planets is genuine or due to selection bias.
6 FUTURE OBSERVATIONS AND OUTLOOK
6.1 Summary of Open Questions
While observations and theory have made great progress advancing our understanding of the origin of multiplicity over the last decade, a variety of open questions remain.
What portion of multiples form via core versus disk fragmentation? Star cluster calculations have demonstrated that a single formation mechanism cannot reproduce observed multiplicity statistics. Obtaining statistics of forming multiples – catching formation sufficiently early that evolution cannot blur the lines between disk and core fragmentation – is an observational challenge for the next decade. This entails making high-resolution observations of Class 0 disks at the earliest possible times and measuring their stability, as well as observing cores while collapse is in progress. More predictive models of gas-driven migration are also necessary to explain the final period distribution, especially for the closest binaries. Only a handful of starless cores have confirmed substructure in either dust continuum or a dense gas tracer, indicating incipient multiple formation (e.g., Kirk et al., 2009; Chen et al., 2010; Nakamura et al., 2012; Lee et al., 2013; Kirk et al., 2017). Future surveys of both line and dust emission are needed to identify and confirm gas substructures and to ascertain whether these peaks represent collapsing regions.
What are the underlying mechanisms responsible for multiple formation in complex numerical simulations? We have reviewed the manner in which multi-physics star-formation simulations do and do not match observed multiplicity statistics. However, the literature often lacks a critical analysis of why. Why did the included physics lead to the observed population of multiples? What channels of formation dominate on different scales or environments? Answering these questions requires tracing the flow of mass and angular momentum for each star formed over the course of the simulation. While attempts at such analysis have been made (Smith et al., 2009; Smullen et al., 2020), it will require methodologies, like tracer particles, that follow the time-evolution of gas parcels and capture all important physical processes (e.g., Grudić et al., 2021). Machine learning algorithms could be leveraged to identify underlying evolutionary trends or mechanisms that depart from the classical analytic constraints highlighted in §3.
How do initial conditions, particularly those in extreme environments, impact multiplicity? Observations of local star-forming regions tentatively find differences in multiplicity properties. Early dynamical evolution, rather than innate differences in the gas conditions, appear to drive some of these differences (Tobin et al., 2022). Simulations suggest that both metallicity and mean magnetic field impact the primordial multiplicity, however, order of magnitude variations in these conditions may be required to detect robust statistical variation. Local star-forming regions, from Taurus to Orion, exhibit relatively modest physical differences. Future studies must push the resolution limits of statistical surveys or develop new techniques to probe multiplicity in more extreme environments. Such observations are required to disentangle the influence of nature (initial conditions) versus nurture (dynamical evolution).
Do high-mass stellar multiples form similarly or differently from low-mass stars? High-mass protostars () are more challenging to observe due to larger distances, higher optical depths, and complex chemistry (Rosen et al., 2020). Only a few high-mass protobinaries have been observed to date (e.g., Beltrán et al., 2016; Beuther et al., 2017b, a; Zhang et al., 2019; Zapata et al., 2019). Models suggest that high-mass protostellar disks are more likely to be gravitationally unstable (Kratter and Matzner, 2006). Observations, however, are inconclusive (Cesaroni, 2005; Chini et al., 2004; Patel et al., 2005; Koumpia et al., 2021; Bosco et al., 2019; Motogi et al., 2019). Robustly linking O-star multiplicity with high-mass star formation requires more high-resolution observations of high-mass protobinaries and their disks properties.
How do the properties and lifetimes of disks in multiple systems vary from those in single star systems? Observations demonstrate that disk properties vary with stellar mass, age, and environment as well as multiplicity. Larger statistical samples are needed to separate these effects and determine exactly how disks form and evolve differently in multiple systems. To date, star cluster calculations have not addressed differences in disk properties in multiple systems. Non-ideal magnetic processes and au-scale resolution are required for future calculations to adequately follow disk formation and evolution.
What are the separation limits and properties of very wide binaries? Previous studies of multiplicity (and multiple-system properties) have been limited at wide separations by the challenges of confirming whether wide systems are bound or only chance projections. With the advent of Gaia, it is much more feasible to identify and characterize the widest bound systems (e.g., El-Badry et al., 2021). Work to date has only begun to mine the available data.
6.2 Next Generation Instruments
A variety of new surveys and observational advances over the coming decade hold significant promise for multiplicity studies. The next generation Very Large Array (ngVLA) is a proposed single-configuration interferometer with 10 times the resolution and sensitivity of the current VLA, which will excel in characterizing close-separation protostellar multiplicity in the youngest systems. It is currently in the design phase with construction tentatively planned to start in 2025. The ngVLA will simultaneously offer au-scale spatial resolution and high sensitivity, enabling searches for closely separated protostellar multiples in nearby star-forming regions at wavelengths of 7 mm and 3 mm. While ALMA can provide comparable spatial resolution, the time available for the highest resolution studies is quite limited. Meanwhile, the high dust opacity of protostellar disks at 1 mm reduces the utility of ALMA for characterizing close-separation multiplicity. ALMA will soon be able to observe at 8 mm wavelengths, though the finest spatial resolution will be less than the VLA currently provides. The longer wavelengths of the ngVLA will enable it to probe multiplicity within protostellar disks at wavelengths where the dust is optically thin.
The higher resolution capabilities of the ngVLA will provide insight into multiplicity in more distant massive star-forming regions and across more diverse environments. The ngVLA sensitivity and resolution in regions a few kpc away will be comparable to that of current studies in nearby clouds. Since most stars in fact form in high-mass environments (e.g., the total number of Class 0 and I protostars within 500 pc is 500 Dunham et al., 2014b), the general conclusions that can be drawn from studies of nearby regions is limited in scope and statistical robustness.
More distant regions, however, do not currently have well-characterized solar-type protostar populations. Accurate classification is critical to identify YSOs and study multiplicity evolution. The James Webb Space Telescope (JWST) will provide some of the needed characterization for wavelengths less than 24 \micron. However, photometry from the near-infrared to the submillimeter is also required and is essential for the youngest sources. Consequently, robust measurements of protostellar multiplicity in distant star-forming regions will require combining data from next generation space-based far-infrared observatories, like the proposed Origins Space Telescope, with data from large ground-based (sub)millimeter telescopes such as the forthcoming Large Millimeter Telescope (LMT) and Fred Young Submillimeter Telescope (FYST) or the proposed Atacama Large Aperture Submillimeter Telescope (AtLAST).
Surveys with large ground-based (sub)millimeter telescopes will enable studies of the environments around proto-multiples. The LMT, FYST, and AtLAST telescopes will achieve resolutions of au in dust continuum and dust polarization in nearby clouds ( pc). Planned surveys with LMT and FYST will resolve large () core populations, enabling robust comparative studies of cores hosting multiple and single systems. Moreover, these facilities will better resolve the material surrounding wide binaries, and in particular, measure magnetic field properties on au scales, constraining the role of magnetic fields in fragmentation and dynamical evolution. While angular resolution will be lower compared to JWST, ALMA, and (ng)VLA making confusion and crowding an issue for characterizing multiple systems, they will be able to study YSOs in nearby star-forming regions with unprecedented angular resolution and observe more distant regions near the current spatial resolution.
Upcoming optical and infrared facilities will probe uncharted regions of the parameter space of MS and pre-MS binaries (Price-Whelan et al., 2019; Schaefer et al., 2019; Rix et al., 2019). JWST, the Roman Space Telescope, GRAVITY+, and the Giant Magellan Telescope will better characterize cool, faint BD/late-M binaries and the disk properties of T Tauri binaries (Fontanive et al., 2021). Ground-based Extremely Large Telescopes will provide the highest resolution NIR imaging of star-forming regions and thus push multiplicity studies significantly ahead from Class II through MS phases. The third full data release of Gaia expected in mid-2022 will include multi-epoch spectroscopy, photometry, and astrometry of billions of stars, yielding a catalog of millions of spectroscopic, eclipsing, astrometric, and visual binaries with full orbital solutions (Eyer et al., 2013, 2015). This catalog will likely reveal hidden trends in multiplicity statistics, such as the relationship between stellar mass and the distributions of triple star periods, mass ratios, and orientations. Finally, the Large Synoptic Survey Telescope at the Vera Rubin Observatory will discover tens of millions of eclipsing binaries (Prša et al., 2011; Geller et al., 2021a), providing insight into how close binary properties vary with stellar properties and environment.
6.3 Challenges for Theoretical Models
While current state-of-the-art simulations reproduce a number of key observables, such as the strong dependence of multiplicity on stellar mass (§3.4), most do not reproduce the observed separation distribution or its evolution over time. In addition, models must also reproduce the observed triple fraction and companion frequency as shown in Fig. 1. Published comparisons often benchmark numerical results using MS field star population statistics, which are inappropriate for simulated sources 0.5 Myr years old. It is critical to make equivalent comparisons by accounting for observational constraints, including sensitivity limits and projected separation (rather than 3D separation or binding energy). Finally, public release of numerical methods and simulation data will increase transparency and encourage broader community participation.
To obtain robust stellar statistics, future numerical studies must capture a dynamic range approaching seven orders of magnitude in spatial scale, while also including all important physical processes. This requires exploiting computational advances in clock speeds and system architectures and developing novel, efficient methods to model star cluster formation. Future star-cluster calculations must also incorporate non-ideal magnetic effects, which are important for modelling disk evolution. Including these processes, together with sub-au resolution, may mitigate current discrepancies with observation and point the way to a fully realized theory of multiple formation.
7 CONCLUSIONS
We have reviewed the formation and evolution of stellar multiplicity from protostellar birth through the main sequence lives of stars. Observations and theory agree that most stars are born in small-order multiple systems. Multiplicity arises primarily from the fragmentation of filaments, dense cores and massive accretion disks. Young stellar systems evolve through dynamical interactions such that multiplicity declines with time. System statistics, such as the fraction of multiple systems, frequency of higher order multiples and median separation, are strong functions of primary stellar mass. These also vary with environment density and metallicity.
While angular momentum misalignment is common during the embedded phase, as indicated by protostellar outflow and disk orientations, older systems more often exhibit orbit-spin alignment and have aligned disks. Protoplanetary disks in multiple systems are on average less massive and more compact than those around single stars, while circumbinary protoplanetary disks are rare. These trends suggest planet formation and planetary architectures differ in multiple systems. Additional high-resolution surveys with existing facilities, such as ALMA and Gaia, as well as data from future facilities such as the JVLA, extended ALMA and JWST, promise significant strides towards addressing the remaining mysteries of multiple star systems.
Acknowledgments SSRO acknowledges support from NSF CAREER grant 1748571 and NSF AST-1812747. JJT acknowledges support from NSF AST-1814762. MM and KMK acknowledge financial support from NASA ATP via grant 80NSSC18K0726. The National Radio Astronomy Observatory is a facility of the National Science Foundation operated under cooperative agreement by Associated Universities, Inc. SIS acknowledges support from the Natural Sciences and Engineering Research Council of Canada (NSERC) Discovery Grant (RGPIN-2020-03981).
References
- Abel et al. (2002) Abel T. et al., 2002 Science, 295, 93.
- Aberasturi et al. (2014) Aberasturi M. et al., 2014 AJ, 148, 6, 129.
- Abt (1965) Abt H. A., 1965 ApJS, 11, 429.
- Abt (1983) Abt H. A., 1983 ARA&A, 21, 343.
- Abt (2006) Abt H. A., 2006 ApJ, 651, 2, 1151.
- Abt et al. (1990) Abt H. A. et al., 1990 ApJS, 74, 551.
- Adams et al. (1987) Adams F. C. et al., 1987 ApJ, 312, 788.
- Adams et al. (1989) Adams F. C. et al., 1989 ApJ, 347, 959.
- Akeson et al. (2019) Akeson R. L. et al., 2019 ApJ, 872, 2, 158.
- Aldoretta et al. (2015) Aldoretta E. J. et al., 2015 AJ, 149, 1, 26.
- Allen et al. (2007) Allen P. R. et al., 2007 AJ, 133, 3, 971.
- Almeida et al. (2017) Almeida L. A. et al., 2017 A&A, 598, A84.
- Alves et al. (2018) Alves F. O. et al., 2018 A&A, 616, A56.
- Alves et al. (2019) Alves F. O. et al., 2019 Science, 366, 6461, 90.
- Ambartsumian (1937) Ambartsumian V. A., 1937 Astron. Zh., 14, 207.
- André et al. (2019) André P. et al., 2019 A&A, 629, L4.
- Andrews et al. (2013) Andrews S. M. et al., 2013 ApJ, 771, 2, 129.
- Apai et al. (2007) Apai D. et al., 2007 ApJ, 655, 484.
- Armstrong et al. (2014) Armstrong D. J. et al., 2014 MNRAS, 444, 2, 1873.
- Artur de la Villarmois et al. (2018) Artur de la Villarmois E. et al., 2018 A&A, 614, A26.
- Artur de la Villarmois et al. (2019) Artur de la Villarmois E. et al., 2019 A&A, 627, A37.
- Artymowicz and Lubow (1994) Artymowicz P. and Lubow S. H., 1994 ApJ, 421, 651.
- Avenhaus et al. (2014) Avenhaus H. et al., 2014 ApJ, 781, 2, 87.
- Badenes et al. (2018) Badenes C. et al., 2018 ApJ, 854, 2, 147.
- Baehr and Zhu (2021) Baehr H. and Zhu Z., 2021 ApJ, 909, 2, 136.
- Baines et al. (2006) Baines D. et al., 2006 MNRAS, 367, 2, 737.
- Bally (2016) Bally J., 2016 ARA&A, 54, 491.
- Banyard et al. (2022) Banyard G. et al., 2022 A&A, 658, A69.
- Bardalez Gagliuffi et al. (2014) Bardalez Gagliuffi D. C. et al., 2014 ApJ, 794, 2, 143.
- Barenfeld et al. (2017) Barenfeld S. A. et al., 2017 ApJ, 851, 2, 85.
- Barenfeld et al. (2019) Barenfeld S. A. et al., 2019 ApJ, 878, 1, 45.
- Basri and Reiners (2006) Basri G. and Reiners A., 2006 AJ, 132, 2, 663.
- Bate (2000) Bate M. R., 2000 MNRAS, 314, 33.
- Bate (2012) Bate M. R., 2012 MNRAS, 419, 3115.
- Bate (2018) Bate M. R., 2018 MNRAS, 475, 4, 5618.
- Bate (2019) Bate M. R., 2019 MNRAS, 484, 2, 2341.
- Bate and Bonnell (1997) Bate M. R. and Bonnell I. A., 1997 MNRAS, 285, 33.
- Bate et al. (2000) Bate M. R. et al., 2000 MNRAS, 317, 773.
- Batygin and Adams (2013) Batygin K. and Adams F. C., 2013 ApJ, 778, 2, 169.
- Beck et al. (2020) Beck T. L. et al., 2020 ApJ, 902, 2, 132.
- Beckwith et al. (1990) Beckwith S. V. W. et al., 1990 AJ, 99, 924.
- Begelman and Cioffi (1989) Begelman M. C. and Cioffi D. F., 1989 ApJ, 345, L21.
- Behmard et al. (2022) Behmard A. et al., 2022 AJ, 163, 4, 160.
- Belloche et al. (2011) Belloche A. et al., 2011 A&A, 527, A145.
- Beltrán et al. (2016) Beltrán M. T. et al., 2016 A&A, 593, A49.
- Benisty et al. (2018) Benisty M. et al., 2018 A&A, 619, A171.
- Bergfors et al. (2010) Bergfors C. et al., 2010 A&A, 520, A54.
- Beuther et al. (2017a) Beuther H. et al., 2017a A&A, 603, A10.
- Beuther et al. (2017b) Beuther H. et al., 2017b A&A, 605, A61.
- Blake et al. (2010) Blake C. H. et al., 2010 ApJ, 723, 1, 684.
- Bodensteiner et al. (2021) Bodensteiner J. et al., 2021 A&A, 652, A70.
- Boley et al. (2010) Boley A. C. et al., 2010 Icarus, 207, 509.
- Bonnell (1994) Bonnell I. A., 1994 MNRAS, 269, 837.
- Bordier et al. (2022) Bordier E. et al., 2022 A&A, 663, A26.
- Borkovits et al. (2016) Borkovits T. et al., 2016 MNRAS, 455, 4, 4136.
- Bosco et al. (2019) Bosco F. et al., 2019 A&A, 629, A10.
- Bouvier et al. (1997) Bouvier J. et al., 1997 A&A, 323, 139.
- Bouy et al. (2003) Bouy H. et al., 2003 AJ, 126, 3, 1526.
- Branch (1976) Branch D., 1976 ApJ, 210, 392.
- Brandner et al. (1996) Brandner W. et al., 1996 A&A, 307, 121.
- Bresnahan et al. (2018) Bresnahan D. et al., 2018 A&A, 615, A125.
- Brinch et al. (2016) Brinch C. et al., 2016 ApJ, 830, 1, L16.
- Bromley and Kenyon (2015) Bromley B. C. and Kenyon S. J., 2015 ApJ, 806, 1, 98.
- Burgasser (2007) Burgasser A. J., 2007 ApJ, 659, 1, 655.
- Burgasser et al. (2003) Burgasser A. J. et al., 2003 ApJ, 586, 1, 512.
- Caballero-Nieves et al. (2020) Caballero-Nieves S. M. et al., 2020 AJ, 160, 3, 115.
- Carney et al. (2005) Carney B. W. et al., 2005 AJ, 129, 4, 1886.
- Caselli et al. (2019) Caselli P. et al., 2019 ApJ, 874, 1, 89.
- Cesaroni (2005) Cesaroni R., 2005 Ap&SS, 295, 5.
- Chacón-Tanarro et al. (2019) Chacón-Tanarro A. et al., 2019 A&A, 623, A118.
- Cheetham et al. (2015) Cheetham A. C. et al., 2015 ApJ, 813, 2, 83.
- Chen et al. (2020) Chen C.-Y. et al., 2020 MNRAS, 494, 3, 3675.
- Chen and Arce (2010) Chen X. and Arce H. G., 2010 ApJ, 720, 2, L169.
- Chen et al. (2010) Chen X. et al., 2010 ApJ, 715, 1344.
- Chen et al. (2013) Chen X. et al., 2013 ApJ, 768, 110.
- Childs and Martin (2021) Childs A. C. and Martin R. G., 2021 MNRAS.
- Chini et al. (2004) Chini R. et al., 2004 Nature, 429, 155.
- Chini et al. (2012) Chini R. et al., 2012 MNRAS, 424, 3, 1925.
- Christian et al. (2022) Christian S. et al., 2022 AJ, 163, 5, 207.
- Cieza et al. (2009) Cieza L. A. et al., 2009 ApJ, 696, L84.
- Cieza et al. (2019) Cieza L. A. et al., 2019 MNRAS, 482, 698.
- Clarke (2009) Clarke C. J., 2009 MNRAS, 396, 1066.
- Clarke and Pringle (1991) Clarke C. J. and Pringle J. E., 1991 MNRAS, 249, 584.
- Claudi et al. (2019) Claudi R. et al., 2019 A&A, 622, A96.
- Close et al. (2002) Close L. M. et al., 2002 ApJ, 567, 1, L53.
- Close et al. (2003) Close L. M. et al., 2003 ApJ, 587, 1, 407.
- Connelley et al. (2008) Connelley M. S. et al., 2008 AJ, 135, 2496.
- Corporon and Lagrange (1999) Corporon P. and Lagrange A. M., 1999 A&AS, 136, 429.
- Cournoyer-Cloutier et al. (2021) Cournoyer-Cloutier C. et al., 2021 MNRAS, 501, 3, 4464.
- Cox et al. (2017) Cox E. G. et al., 2017 ApJ, 851, 2, 83.
- Cox et al. (2018) Cox E. G. et al., 2018 ApJ, 855, 92.
- Cruz-Sáenz de Miera et al. (2019) Cruz-Sáenz de Miera F. et al., 2019 ApJ, 882, 1, L4.
- Csizmadia et al. (2015) Csizmadia S. et al., 2015 A&A, 584, A13.
- Cunningham et al. (2018) Cunningham A. J. et al., 2018 MNRAS, 476, 1, 771.
- Czekala et al. (2016) Czekala I. et al., 2016 ApJ, 818, 2, 156.
- Czekala et al. (2017) Czekala I. et al., 2017 ApJ, 851, 2, 132.
- Czekala et al. (2019) Czekala I. et al., 2019 ApJ, 883, 1, 22.
- Czekala et al. (2021) Czekala I. et al., 2021 ApJ, 912, 1, 6.
- Dabringhausen et al. (2022) Dabringhausen J. et al., 2022 MNRAS, 510, 1, 413.
- Daemgen et al. (2007) Daemgen S. et al., 2007 ApJ, 654, 1, 558.
- De Furio et al. (2019) De Furio M. et al., 2019 ApJ, 886, 2, 95.
- de Mink et al. (2013) de Mink S. E. et al., 2013 ApJ, 764, 2, 166.
- De Rosa et al. (2014) De Rosa R. J. et al., 2014 MNRAS, 437, 2, 1216.
- Deacon and Kraus (2020) Deacon N. R. and Kraus A. L., 2020 MNRAS, 496, 4, 5176.
- Dempsey et al. (2021) Dempsey A. M. et al., 2021 ApJ, 918, 2, L36.
- Diaz-Rodriguez et al. (2022) Diaz-Rodriguez A. K. et al., 2022 ApJ, 930, 1, 91.
- Dieterich et al. (2012) Dieterich S. B. et al., 2012 AJ, 144, 2, 64.
- D’Orazi et al. (2019) D’Orazi V. et al., 2019 Nature Astronomy, 3, 167.
- Dorval et al. (2017) Dorval J. et al., 2017 MNRAS, 465, 2, 2198.
- Doyle et al. (2011) Doyle L. R. et al., 2011 Science, 333, 1602.
- Duchêne and Kraus (2013) Duchêne G. and Kraus A., 2013 ARAA, 51, 1, 269.
- Duchêne et al. (2001) Duchêne G. et al., 2001 A&A, 379, 147.
- Duchêne et al. (2018) Duchêne G. et al., 2018 MNRAS, 478, 2, 1825.
- Dunham et al. (2014a) Dunham M. M. et al., 2014a MNRAS, 444, 887.
- Dunham et al. (2014b) Dunham M. M. et al., 2014b p. 195.
- Dunham et al. (2016) Dunham M. M. et al., 2016 ApJ, 823, 160.
- Dunstall et al. (2015) Dunstall P. R. et al., 2015 A&A, 580, A93.
- Dupuy et al. (2016) Dupuy T. J. et al., 2016 ApJ, 817, 1, 80.
- Dupuy et al. (2022) Dupuy T. J. et al., 2022 MNRAS, 512, 1, 648.
- Duquennoy and Mayor (1991) Duquennoy A. and Mayor M., 1991 A&A, 248, 485.
- Eggenberger (2010) Eggenberger A., 2010 EAS Publications Series, vol. 42 of EAS Publications Series (K. Gożdziewski, A. Niedzielski, and J. Schneider), pp. 19–37.
- Eggleton and Tokovinin (2008) Eggleton P. P. and Tokovinin A. A., 2008 MNRAS, 389, 2, 869.
- El-Badry and Rix (2018) El-Badry K. and Rix H.-W., 2018 MNRAS, 480, 4, 4884.
- El-Badry and Rix (2019) El-Badry K. and Rix H.-W., 2019 MNRAS, 482, 1, L139.
- El-Badry et al. (2019) El-Badry K. et al., 2019 MNRAS, 489, 4, 5822.
- El-Badry et al. (2021) El-Badry K. et al., 2021 MNRAS, 506, 2, 2269.
- Elliott et al. (2014) Elliott P. et al., 2014 A&A, 568, A26.
- Encalada et al. (2021) Encalada F. J. et al., 2021 ApJ, 913, 2, 149.
- Eyer et al. (2013) Eyer L. et al., 2013 Central European Astrophysical Bulletin, 37, 115.
- Eyer et al. (2015) Eyer L. et al., 2015 Living Together: Planets, Host Stars and Binaries, vol. 496 of Astronomical Society of the Pacific Conference Series (S. M. Rucinski, G. Torres, and M. Zejda), p. 121.
- Fabrycky and Tremaine (2007) Fabrycky D. and Tremaine S., 2007 ApJ, 669, 2, 1298.
- Facchini et al. (2013) Facchini S. et al., 2013 MNRAS, 433, 3, 2142.
- Facchini et al. (2018) Facchini S. et al., 2018 MNRAS, 473, 4, 4459.
- Faherty et al. (2020) Faherty J. K. et al., 2020 ApJ, 889, 2, 176.
- Farago and Laskar (2010) Farago F. and Laskar J., 2010 MNRAS, 401, 2, 1189.
- Federrath (2015) Federrath C., 2015 MNRAS, 450, 4, 4035.
- Fernández-López et al. (2017) Fernández-López M. et al., 2017 ApJ, 845, 1, 10.
- Fielding et al. (2015) Fielding D. B. et al., 2015 MNRAS, 450, 3306.
- Fischer and Marcy (1992) Fischer D. A. and Marcy G. W., 1992 ApJ, 396, 178.
- Fischera and Martin (2012) Fischera J. and Martin P. G., 2012 A&A, 547, A86.
- Fisher (2004) Fisher R. T., 2004 ApJ, 600, 769.
- Fontanive et al. (2018) Fontanive C. et al., 2018 MNRAS, 479, 2, 2702.
- Fontanive et al. (2021) Fontanive C. et al., 2021 MNRAS, 501, 1, 911.
- Foucart and Lai (2013) Foucart F. and Lai D., 2013 ApJ, 764, 1, 106.
- Foucart and Lai (2014) Foucart F. and Lai D., 2014 MNRAS, 445, 2, 1731.
- Friesen et al. (2009) Friesen R. K. et al., 2009 ApJ, 697, 1457.
- Friesen et al. (2014) Friesen R. K. et al., 2014 ApJ, 797, 1, 27.
- Friesen et al. (2018) Friesen R. K. et al., 2018 ApJ, 869, 158.
- Fukagawa et al. (2006) Fukagawa M. et al., 2006 ApJ, 636, 2, L153.
- Furlan et al. (2016) Furlan E. et al., 2016 ApJS, 224, 1, 5.
- Gammie (2001) Gammie C. F., 2001 ApJ, 553, 174.
- Geller and Leigh (2015) Geller A. M. and Leigh N. W. C., 2015 ApJ, 808, 1, L25.
- Geller and Mathieu (2012) Geller A. M. and Mathieu R. D., 2012 AJ, 144, 54.
- Geller et al. (2021a) Geller A. M. et al., 2021a ApJ, 919, 2, 83.
- Geller et al. (2021b) Geller A. M. et al., 2021b AJ, 161, 4, 190.
- Georgakarakos (2008) Georgakarakos N., 2008 Celestial Mechanics and Dynamical Astronomy, 100, 2, 151.
- Ghez et al. (1993) Ghez A. M. et al., 1993 AJ, 106, 2005.
- Ghez et al. (1997) Ghez A. M. et al., 1997 ApJ, 481, 1, 378.
- Gizis (2002) Gizis J. E., 2002 ApJ, 575, 484.
- Gizis et al. (2003) Gizis J. E. et al., 2003 AJ, 125, 6, 3302.
- Goodman et al. (1993) Goodman A. A. et al., 1993 ApJ, 406, 528.
- Goodwin et al. (2004) Goodwin S. P. et al., 2004 A&A, 414, 633.
- Gorti et al. (2015) Gorti U. et al., 2015 ApJ, 804, 1, 29.
- Gravity Collaboration et al. (2018) Gravity Collaboration et al., 2018 A&A, 620, A116.
- GRAVITY Collaboration et al. (2021) GRAVITY Collaboration et al., 2021 A&A, 648, A37.
- Grether and Lineweaver (2006) Grether D. and Lineweaver C. H., 2006 ApJ, 640, 2, 1051.
- Grether and Lineweaver (2007) Grether D. and Lineweaver C. H., 2007 ApJ, 669, 2, 1220.
- Grudić et al. (2021) Grudić M. Y. et al., 2021 MNRAS, 506, 2, 2199.
- Gullikson et al. (2016) Gullikson K. et al., 2016 AJ, 152, 2, 40.
- Guszejnov and Hopkins (2015) Guszejnov D. and Hopkins P. F., 2015 MNRAS, 450, 4, 4137.
- Guszejnov et al. (2017) Guszejnov D. et al., 2017 MNRAS, 468, 4, 4093.
- Guszejnov et al. (2020) Guszejnov D. et al., 2020 MNRAS, 496, 4, 5072.
- Guszejnov et al. (2021) Guszejnov D. et al., 2021 MNRAS, 502, 3, 3646.
- Gutermuth et al. (2011) Gutermuth R. A. et al., 2011 ApJ, 739, 2, 84.
- Hale (1994) Hale A., 1994 AJ, 107, 306.
- Hamers and Samsing (2020) Hamers A. S. and Samsing J., 2020 MNRAS, 494, 1, 850.
- Hamers et al. (2016) Hamers A. S. et al., 2016 MNRAS, 455, 3180.
- Hara et al. (2021) Hara C. et al., 2021 ApJ, 912, 1, 34.
- Harju et al. (1993) Harju J. et al., 1993 A&A, 278, 569.
- Harrington (1977) Harrington R. S., 1977 AJ, 82, 753.
- Harris et al. (2012) Harris R. J. et al., 2012 ApJ, 751, 2, 115.
- Harris et al. (2018) Harris R. J. et al., 2018 ApJ, 861, 91.
- Harsono et al. (2011) Harsono D. et al., 2011 MNRAS, 413, 423.
- Hartman and Lépine (2020) Hartman Z. D. and Lépine S., 2020 ApJS, 247, 2, 66.
- Hatzes et al. (2003) Hatzes A. P. et al., 2003 ApJ, 599, 1383.
- Haugbølle et al. (2018) Haugbølle T. et al., 2018 ApJ, 854, 1, 35.
- Heggie (1975) Heggie D. C., 1975 MNRAS, 173, 729.
- Hendler et al. (2020) Hendler N. et al., 2020 ApJ, 895, 2, 126.
- Hirsch et al. (2021) Hirsch L. A. et al., 2021 AJ, 161, 3, 134.
- Holman and Wiegert (1999) Holman M. J. and Wiegert P. A., 1999 Astron. J., 117, 1, 621.
- Hoogerwerf et al. (2001) Hoogerwerf R. et al., 2001 A&A, 365, 49.
- Hoyle (1953) Hoyle F., 1953 ApJ, 118, 513.
- Hsu et al. (2021) Hsu C.-C. et al., 2021 ApJS, 257, 2, 45.
- Hubrig et al. (2001) Hubrig S. et al., 2001 A&A, 372, 152.
- Hwang et al. (2021) Hwang H.-C. et al., 2021 MNRAS, 501, 3, 4329.
- Innanen et al. (1997) Innanen K. A. et al., 1997 AJ, 113, 1915.
- Inutsuka and Miyama (1997) Inutsuka S. and Miyama S. M., 1997 ApJ, 480, 681.
- Inutsuka (2001) Inutsuka S.-i., 2001 ApJ, 559, 2, L149.
- Inutsuka and Miyama (1992) Inutsuka S.-I. and Miyama S. M., 1992 ApJ, 388, 392.
- Jaehnig et al. (2017) Jaehnig K. et al., 2017 ApJ, 851, 1, 14.
- Janson et al. (2012) Janson M. et al., 2012 ApJ, 754, 1, 44.
- Janson et al. (2014) Janson M. et al., 2014 ApJ, 789, 2, 102.
- Jennings and Chiang (2021) Jennings R. M. and Chiang E., 2021 MNRAS, 507, 4, 5187.
- Jensen and Akeson (2014) Jensen E. L. N. and Akeson R., 2014 Nature, 511, 7511, 567.
- Jensen et al. (1996) Jensen E. L. N. et al., 1996 ApJ, 458, 312.
- Jensen et al. (2004) Jensen E. L. N. et al., 2004 ApJ, 600, 2, 789.
- Jensen et al. (2020) Jensen E. L. N. et al., 2020 Five Years After HL Tau: A New Era in Planet Formation, doi:10.5281/zenodo.4300482.
- Jerabkova et al. (2019) Jerabkova T. et al., 2019 A&A, 627, A57.
- Joergens (2008) Joergens V., 2008 A&A, 492, 2, 545.
- Joncour et al. (2017) Joncour I. et al., 2017 A&A, 599, A14.
- Jørgensen et al. (2016) Jørgensen J. K. et al., 2016 A&A, 595, A117.
- Jørgensen et al. (2022) Jørgensen J. K. et al., 2022 Nature, 606, 7913, 272.
- Jumper and Fisher (2013) Jumper P. H. and Fisher R. T., 2013 ApJ, 769, 9.
- Justesen and Albrecht (2020) Justesen A. B. and Albrecht S., 2020 A&A, 642, A212.
- Karoly et al. (2020) Karoly J. et al., 2020 ApJ, 900, 2, 181.
- Kennedy et al. (2012) Kennedy G. M. et al., 2012 MNRAS, 421, 3, 2264.
- Kennedy et al. (2019) Kennedy G. M. et al., 2019 Nature Astronomy, 3, 230.
- Kerr et al. (2019) Kerr R. et al., 2019 ApJ, 874, 2, 147.
- Keto et al. (2015) Keto E. et al., 2015 MNRAS, 446, 3731.
- Kirk et al. (2017) Kirk H. et al., 2017 ApJ, 838, 114.
- Kirk et al. (2009) Kirk J. M. et al., 2009 ApJ, 701, 2, 1044.
- Kobulnicky and Fryer (2007) Kobulnicky H. A. and Fryer C. L., 2007 ApJ, 670, 747.
- Kobulnicky et al. (2014) Kobulnicky H. A. et al., 2014 ApJS, 213, 2, 34.
- Kohler and Leinert (1998) Kohler R. and Leinert C., 1998 A&A, 331, 977.
- Köhler et al. (2006) Köhler R. et al., 2006 A&A, 458, 2, 461.
- Könyves et al. (2015) Könyves V. et al., 2015 A&A, 584, A91.
- Koresko (1998) Koresko C. D., 1998 ApJ, 507, 2, L145.
- Kostov et al. (2020) Kostov V. B. et al., 2020 AJ, 159, 6, 253.
- Kostov et al. (2021) Kostov V. B. et al., 2021 AJ, 162, 6, 234.
- Koumpia et al. (2020) Koumpia E. et al., 2020 A&A, 643, A61.
- Koumpia et al. (2021) Koumpia E. et al., 2021 A&A, 654, A109.
- Kounkel et al. (2016) Kounkel M. et al., 2016 ApJ, 821, 1, 52.
- Kounkel et al. (2019) Kounkel M. et al., 2019 AJ, 157, 5, 196.
- Kouwenhoven et al. (2005) Kouwenhoven M. B. N. et al., 2005 A&A, 430, 137.
- Kouwenhoven et al. (2007) Kouwenhoven M. B. N. et al., 2007 A&A, 464, 581.
- Kozai (1962) Kozai Y., 1962 AJ, 67, 591.
- Kratter and Lodato (2016) Kratter K. and Lodato G., 2016 ARA&A, 54, 271.
- Kratter (2011) Kratter K. M., 2011 Evolution of Compact Binaries, vol. 447 of Astronomical Society of the Pacific Conference Series (L. Schmidtobreick, M. R. Schreiber, and C. Tappert), p. 47.
- Kratter and Matzner (2006) Kratter K. M. and Matzner C. D., 2006 MNRAS, 373, 1563.
- Kratter and Murray-Clay (2011) Kratter K. M. and Murray-Clay R. A., 2011 ApJ, 740, 1.
- Kratter et al. (2008) Kratter K. M. et al., 2008 ApJ, 681, 375.
- Kratter et al. (2010) Kratter K. M. et al., 2010 ApJ, 708, 1585.
- Kraus et al. (2008) Kraus A. L. et al., 2008 ApJ, 679, 1, 762.
- Kraus et al. (2011) Kraus A. L. et al., 2011 ApJ, 731, 1, 8.
- Kraus et al. (2012) Kraus A. L. et al., 2012 ApJ, 745, 1, 19.
- Kraus et al. (2016) Kraus A. L. et al., 2016 AJ, 152, 1, 8.
- Kraus et al. (2017) Kraus S. et al., 2017 ApJ, 835, 1, L5.
- Kraus et al. (2020) Kraus S. et al., 2020 Science, 369, 6508, 1233.
- Kroupa (1995) Kroupa P., 1995 MNRAS, 277, 1507.
- Kroupa (2008) Kroupa P., 2008 The Cambridge N-Body Lectures, vol. 760 of Lecture Notes in Physics, Berlin Springer Verlag (S. J. Aarseth, C. A. Tout, and R. A. Mardling), p. 181.
- Kroupa et al. (2013) Kroupa P. et al., 2013 Planets, Stars and Stellar Systems. Volume 5: Galactic Structure and Stellar Populations, vol. 5 (T. D. Oswalt and G. Gilmore), p. 115.
- Kuffmeier et al. (2018) Kuffmeier M. et al., 2018 MNRAS, 475, 2, 2642.
- Kuffmeier et al. (2019) Kuffmeier M. et al., 2019 A&A, 628, A112.
- Kuznetsova et al. (2020) Kuznetsova A. et al., 2020 ApJ, 893, 1, 73.
- Kwon et al. (2019) Kwon W. et al., 2019 ApJ, 879, 1, 25.
- Lada (2006) Lada C. J., 2006 ApJ, 640, 1, L63.
- Lada and Wilking (1984) Lada C. J. and Wilking B. A., 1984 ApJ, 287, 610.
- Lamb et al. (2016) Lamb J. B. et al., 2016 ApJ, 817, 2, 113.
- Laos et al. (2020) Laos S. et al., 2020 ApJ, 902, 2, 107.
- Larson (1969) Larson R. B., 1969 MNRAS, 145, 271.
- Larson (1972) Larson R. B., 1972 MNRAS, 156, 437.
- Latham et al. (2002) Latham D. W. et al., 2002 AJ, 124, 2, 1144.
- Lattanzi et al. (2020) Lattanzi V. et al., 2020 A&A, 633, A118.
- Lau and Bertin (1978) Lau Y. Y. and Bertin G., 1978 ApJ, 226, 508.
- Law et al. (2008) Law N. M. et al., 2008 MNRAS, 384, 1, 150.
- Lee and Stahler (2011) Lee A. T. and Stahler S. W., 2011 MNRAS, 416, 4, 3177.
- Lee et al. (2019) Lee A. T. et al., 2019 ApJ, 887, 2, 232.
- Lee et al. (2020a) Lee C.-F. et al., 2020a Nature Astronomy, 4, 142.
- Lee et al. (2017a) Lee J.-E. et al., 2017a Nature Astronomy, 1, 0172.
- Lee et al. (2017b) Lee J. W. Y. et al., 2017b ApJ, 834, 2, 201.
- Lee et al. (2013) Lee K. et al., 2013 ApJ, 772, 2, 100.
- Lee et al. (2016) Lee K. I. et al., 2016 ApJ, 820, 1, L2.
- Lee and Hennebelle (2018) Lee Y.-N. and Hennebelle P., 2018 A&A, 611, A89.
- Lee et al. (2020b) Lee Y.-N. et al., 2020b Space Science Reviews, 216, 4, 70.
- Leinert et al. (1993) Leinert C. et al., 1993 A&A, 278, 129.
- Lépine and Bongiorno (2007) Lépine S. and Bongiorno B., 2007 AJ, 133, 889.
- Li et al. (2016) Li G. et al., 2016 ApJ, 831, 96.
- Li et al. (2018) Li P. S. et al., 2018 MNRAS, 473, 3, 4220.
- Lidov (1962) Lidov M. L., 1962 Planet. Space Sci., 9, 719.
- Lim et al. (2016) Lim J. et al., 2016 arXiv:1607.00323.
- Lis et al. (2016) Lis D. C. et al., 2016 ApJ, 827, 2, 133.
- Long et al. (2021) Long F. et al., 2021 ApJ, 915, 2, 131.
- Looney et al. (2000) Looney L. W. et al., 2000 ApJ, 529, 477.
- Lubow and Artymowicz (1996) Lubow S. and Artymowicz P., 1996 Bulletin of the American Astronomical Society, vol. 28 of Bulletin of the American Astronomical Society, pp. 1182–+.
- Lubow and Ogilvie (2000) Lubow S. H. and Ogilvie G. I., 2000 ApJ, 538, 326.
- Lucy and Ricco (1979) Lucy L. B. and Ricco E., 1979 AJ, 84, 401.
- Luo et al. (2022) Luo Q.-y. et al., 2022 ApJ, 931, 2, 158.
- Maíz Apellániz et al. (2019) Maíz Apellániz J. et al., 2019 A&A, 626, A20.
- Manara et al. (2019) Manara C. F. et al., 2019 A&A, 628, A95.
- Mardling and Aarseth (2001) Mardling R. A. and Aarseth S. J., 2001 MNRAS, 321, 398.
- Martin (2019) Martin D. V., 2019 MNRAS, 488, 3, 3482.
- Martin and Fabrycky (2021) Martin D. V. and Fabrycky D. C., 2021 AJ, 162, 3, 84.
- Martin et al. (2015) Martin D. V. et al., 2015 MNRAS, 453, 3554.
- Martin and Lubow (2017) Martin R. G. and Lubow S. H., 2017 ApJ, 835, 2, L28.
- Martin and Lubow (2018) Martin R. G. and Lubow S. H., 2018 MNRAS, 479, 1, 1297.
- Marzari et al. (2013) Marzari F. et al., 2013 A&A, 553, A71.
- Mason et al. (2009) Mason B. D. et al., 2009 AJ, 137, 3358.
- Mathew and Federrath (2021) Mathew S. S. and Federrath C., 2021 MNRAS, 507, 2, 2448.
- Mathieu (1992) Mathieu R. D., 1992 Binaries as Tracers of Star Formation, pp. 155–169.
- Mathieu (1994) Mathieu R. D., 1994 ARA&A, 32, 465.
- Maureira et al. (2020) Maureira M. J. et al., 2020 ApJ, 897, 1, 59.
- Maury et al. (2010) Maury A. J. et al., 2010 A&A, 512, A40.
- Mazzola et al. (2020) Mazzola C. N. et al., 2020 MNRAS, 499, 2, 1607.
- McKee (1999) McKee C. F., 1999 NATO ASIC Proc. 540: The Origin of Stars and Planetary Systems, p. 29.
- Meibom and Mathieu (2005) Meibom S. and Mathieu R. D., 2005 ApJ, 620, 970.
- Melo (2003) Melo C. H. F., 2003 A&A, 410, 269.
- Mignon-Risse et al. (2021) Mignon-Risse R. et al., 2021 A&A, 652, A69.
- Moe and Di Stefano (2013) Moe M. and Di Stefano R., 2013 ApJ, 778, 2, 95.
- Moe and Di Stefano (2015a) Moe M. and Di Stefano R., 2015a ApJ, 801, 2, 113.
- Moe and Di Stefano (2015b) Moe M. and Di Stefano R., 2015b ApJ, 810, 1, 61.
- Moe and Di Stefano (2017) Moe M. and Di Stefano R., 2017 ApJS, 230, 15.
- Moe and Kratter (2018) Moe M. and Kratter K. M., 2018 ApJ, 854, 44.
- Moe and Kratter (2019) Moe M. and Kratter K. M., 2019 arXiv e-prints, arXiv:1912.01699.
- Moe and Kratter (2021) Moe M. and Kratter K. M., 2021 MNRAS, 507, 3, 3593.
- Moe et al. (2019) Moe M. et al., 2019 ApJ, 875, 1, 61.
- Moeckel and Bally (2007) Moeckel N. and Bally J., 2007 ApJ, 661, L183.
- Monin et al. (1998) Monin J. L. et al., 1998 A&A, 339, 113.
- Monin et al. (2006) Monin J. L. et al., 2006 A&A, 446, 1, 201.
- Moriwaki and Nakagawa (2004) Moriwaki K. and Nakagawa Y., 2004 ApJ, 609, 1065.
- Motogi et al. (2019) Motogi K. et al., 2019 ApJ, 877, 2, L25.
- Motte et al. (1998) Motte F. et al., 1998 A&A, 336, 150.
- Muñoz and Lai (2015) Muñoz D. J. and Lai D., 2015 Proceedings of the National Academy of Science, 112, 9264.
- Muñoz et al. (2015) Muñoz D. J. et al., 2015 MNRAS, 446, 2010.
- Muñoz et al. (2019) Muñoz D. J. et al., 2019 ApJ, 871, 1, 84.
- Murillo et al. (2016) Murillo N. M. et al., 2016 arXiv:1604.06123.
- Murphy et al. (2018) Murphy S. J. et al., 2018 MNRAS, 474, 4, 4322.
- Myers et al. (2020) Myers P. C. et al., 2020 ApJ, 896, 2, 163.
- Najita and Kenyon (2014) Najita J. R. and Kenyon S. J., 2014 MNRAS, 445, 3315.
- Nakamura et al. (2012) Nakamura F. et al., 2012 ApJ, 758, 2, L25.
- Nayakshin (2010) Nayakshin S., 2010 MNRAS, 408, L36.
- Nelson (2003) Nelson R. P., 2003 MNRAS, 345, 233.
- Neugent (2021) Neugent K. F., 2021 ApJ, 908, 1, 87.
- Ngo et al. (2016) Ngo H. et al., 2016 ApJ, 827, 1, 8.
- Nielsen et al. (2019) Nielsen E. L. et al., 2019 AJ, 158, 1, 13.
- Niu et al. (2020) Niu H. et al., 2020 ApJ, 903, 2, 93.
- Nixon et al. (2013) Nixon C. et al., 2013 MNRAS, 434, 3, 1946.
- Ochi et al. (2005) Ochi Y. et al., 2005 ApJ, 623, 922.
- Offner and Chaban (2017) Offner S. S. R. and Chaban J., 2017 ApJ, 847, 2, 104.
- Offner et al. (2009) Offner S. S. R. et al., 2009 ApJ, 703, 131.
- Offner et al. (2012a) Offner S. S. R. et al., 2012a ApJ, 753, 98.
- Offner et al. (2012b) Offner S. S. R. et al., 2012b MNRAS, 420, L53.
- Offner et al. (2014) Offner S. S. R. et al., 2014 Protostars and Planets VI (H. Beuther, R. S. Klessen, C. P. Dullemond, and T. Henning), p. 53.
- Offner et al. (2016) Offner S. S. R. et al., 2016 ApJ, 827, L11.
- Öpik (1924) Öpik E., 1924 Publications of the Tartu Astrofizica Observatory, 25, 1.
- Osterloh and Beckwith (1995) Osterloh M. and Beckwith S. V. W., 1995 ApJ, 439, 288.
- Ostriker (1994) Ostriker E. C., 1994 ApJ, 424, 292.
- Ostriker et al. (1999) Ostriker E. C. et al., 1999 ApJ, 513, 259.
- Padoan et al. (2014) Padoan P. et al., 2014 Protostars and Planets VI (H. Beuther, R. S. Klessen, C. P. Dullemond, and T. Henning), p. 77.
- Pan et al. (2017) Pan Z. et al., 2017 ApJ, 836, 2, 194.
- Pascucci et al. (2016) Pascucci I. et al., 2016 ApJ, 831, 2, 125.
- Patel et al. (2005) Patel N. A. et al., 2005 Nature, 437, 109.
- Patience et al. (2002) Patience J. et al., 2002 AJ, 123, 3, 1570.
- Pattle et al. (2015) Pattle K. et al., 2015 MNRAS, 450, 1094.
- Penzlin et al. (2021) Penzlin A. B. T. et al., 2021 A&A, 645, A68.
- Pineda et al. (2011) Pineda J. E. et al., 2011 ApJ, 739, 1, L2.
- Pineda et al. (2015) Pineda J. E. et al., 2015 Nature, 518, 213.
- Pinilla et al. (2018) Pinilla P. et al., 2018 ApJ, 868, 2, 85.
- Pinsonneault and Stanek (2006) Pinsonneault M. H. and Stanek K. Z., 2006 ApJ, 639, L67.
- Pomohaci et al. (2019) Pomohaci R. et al., 2019 MNRAS, 484, 1, 226.
- Prato (2007) Prato L., 2007 ApJ, 657, 1, 338.
- Prato et al. (2002) Prato L. et al., 2002 ApJ, 579, 2, L99.
- Prato et al. (2018) Prato L. et al., 2018 ApJ, 852, 1, 38.
- Price et al. (2018) Price D. J. et al., 2018 MNRAS, 477, 1, 1270.
- Price-Whelan et al. (2019) Price-Whelan A. et al., 2019 BAAS, 51, 3, 206.
- Prša et al. (2011) Prša A. et al., 2011 AJ, 141, 83.
- Quintana and Lissauer (2006) Quintana E. V. and Lissauer J. J., 2006 Icarus, 185, 1, 1.
- Quintana et al. (2002) Quintana E. V. et al., 2002 ApJ, 576, 2, 982.
- Raboud and Mermilliod (1998) Raboud D. and Mermilliod J. C., 1998 A&A, 329, 101.
- Radigan et al. (2009) Radigan J. et al., 2009 ApJ, 698, 1, 405.
- Raghavan et al. (2010) Raghavan D. et al., 2010 ApJS, 190, 1, 1.
- Ragusa et al. (2021) Ragusa E. et al., 2021 MNRAS, 507, 1, 1157.
- Ramírez-Tannus et al. (2021) Ramírez-Tannus M. C. et al., 2021 A&A, 645, L10.
- Rastegaev (2010) Rastegaev D. A., 2010 AJ, 140, 6, 2013.
- Reid et al. (2001) Reid I. N. et al., 2001 AJ, 121, 1, 489.
- Reipurth and Clarke (2001) Reipurth B. and Clarke C., 2001 AJ, 122, 432.
- Reipurth and Zinnecker (1993) Reipurth B. and Zinnecker H., 1993 A&A, 278, 81.
- Reipurth et al. (2007) Reipurth B. et al., 2007 AJ, 134, 2272.
- Reipurth et al. (2014) Reipurth B. et al., 2014 Protostars and Planets VI, pp. 267–290.
- Reynolds et al. (2021) Reynolds N. K. et al., 2021 ApJ, 907, 1, L10.
- Ribas et al. (2018) Ribas Á. et al., 2018 ApJ, 865, 1, 77.
- Rice et al. (2004) Rice W. K. M. et al., 2004 MNRAS, 355, 543.
- Rice et al. (2011) Rice W. K. M. et al., 2011 MNRAS, 418, 1356.
- Rix et al. (2019) Rix H.-W. et al., 2019 BAAS, 51, 3, 104.
- Rizzuto et al. (2013) Rizzuto A. C. et al., 2013 MNRAS, 436, 2, 1694.
- Roberts et al. (2007) Roberts Lewis C. J. et al., 2007 AJ, 133, 2, 545.
- Robitaille et al. (2007) Robitaille T. P. et al., 2007 ApJS, 169, 328.
- Roccatagliata et al. (2011) Roccatagliata V. et al., 2011 A&A, 534, A33.
- Rodriguez et al. (2018) Rodriguez J. E. et al., 2018 ApJ, 859, 2, 150.
- Ronco et al. (2021) Ronco M. P. et al., 2021 ApJ, 916, 2, 113.
- Rosen et al. (2020) Rosen A. L. et al., 2020 Space Sci. Rev., 216, 4, 62.
- Rosenfeld et al. (2012) Rosenfeld K. A. et al., 2012 ApJ, 759, 2, 119.
- Rosotti and Clarke (2018) Rosotti G. P. and Clarke C. J., 2018 MNRAS, 473, 4, 5630.
- Rota et al. (2022) Rota A. A. et al., 2022 A&A, 662, A121.
- Ryu et al. (2017) Ryu T. et al., 2017 MNRAS, 467, 4, 4447.
- Sadavoy and Stahler (2017) Sadavoy S. I. and Stahler S. W., 2017 MNRAS, 469, 3881.
- Sadavoy et al. (2018a) Sadavoy S. I. et al., 2018a ApJ, 859, 165.
- Sadavoy et al. (2018b) Sadavoy S. I. et al., 2018b ApJ, 869, 115.
- Sadavoy et al. (2019) Sadavoy S. I. et al., 2019 ApJS, 245, 2.
- Sana et al. (2012) Sana H. et al., 2012 Science, 337, 444.
- Sana et al. (2013) Sana H. et al., 2013 A&A, 550, A107.
- Sana et al. (2014) Sana H. et al., 2014 ApJS, 215, 15.
- Sana et al. (2017) Sana H. et al., 2017 A&A, 599, L9.
- Satsuka et al. (2017) Satsuka T. et al., 2017 MNRAS, 465, 986.
- Scally et al. (1999) Scally A. et al., 1999 MNRAS, 306, 1, 253.
- Schaefer et al. (2019) Schaefer G. et al., 2019 BAAS, 51, 3, 483.
- Schmiedeke et al. (2021) Schmiedeke A. et al., 2021 ApJ, 909, 1, 60.
- Schnee et al. (2010) Schnee S. et al., 2010 ApJ, 718, 306.
- Schnee et al. (2012) Schnee S. et al., 2012 ApJ, 745, 18.
- Segura-Cox et al. (2018) Segura-Cox D. M. et al., 2018 ApJ, 866, 161.
- Shahaf and Mazeh (2019) Shahaf S. and Mazeh T., 2019 MNRAS, 487, 3, 3356.
- Sharma et al. (2020) Sharma R. et al., 2020 ApJ, 904, 1, 78.
- Shatsky and Tokovinin (2002) Shatsky N. and Tokovinin A., 2002 A&A, 382, 92.
- Shenar et al. (2022) Shenar T. et al., 2022 A&A, 665, A148.
- Shu (1977) Shu F. H., 1977 ApJ, 214, 488.
- Shu et al. (1990) Shu F. H. et al., 1990 ApJ, 358, 495.
- Silsbee and Rafikov (2015a) Silsbee K. and Rafikov R. R., 2015a ApJ, 808, 58.
- Silsbee and Rafikov (2015b) Silsbee K. and Rafikov R. R., 2015b ApJ, 798, 71.
- Silsbee and Rafikov (2021) Silsbee K. and Rafikov R. R., 2021 A&A, 652, A104.
- Smith et al. (2009) Smith R. J. et al., 2009 MNRAS, 396, 830.
- Smullen et al. (2016) Smullen R. A. et al., 2016 MNRAS, 461, 1288.
- Smullen et al. (2020) Smullen R. A. et al., 2020 MNRAS, 497, 4, 4517.
- Sota et al. (2014) Sota A. et al., 2014 ApJS, 211, 1, 10.
- Stahler (2010) Stahler S. W., 2010 MNRAS, 402, 1758.
- Stapelfeldt et al. (1998) Stapelfeldt K. R. et al., 1998 ApJ, 502, 1, L65.
- Stephens et al. (2017) Stephens I. W. et al., 2017 ApJ, 846, 16.
- Stephens et al. (2019) Stephens I. W. et al., 2019 ApJS, 245, 2, 21.
- Sybilski et al. (2018) Sybilski P. et al., 2018 MNRAS, 478, 2, 1942.
- Szebehely and McKenzie (1981) Szebehely V. and McKenzie R., 1981 Celest. Mech., 23, 1, 3.
- Takahashi et al. (2016) Takahashi S. Z. et al., 2016 MNRAS, 458, 4, 3597.
- Takakuwa et al. (2017) Takakuwa S. et al., 2017 ApJ, 837, 1, 86.
- Tazzari et al. (2017) Tazzari M. et al., 2017 A&A, 606, A88.
- Thompson and Stevenson (1988) Thompson C. and Stevenson D. J., 1988 ApJ, 333, 452.
- Tobin et al. (2015) Tobin J. J. et al., 2015 ApJ, 798, 1, 61.
- Tobin et al. (2016a) Tobin J. J. et al., 2016a Nature, 538, 483.
- Tobin et al. (2016b) Tobin J. J. et al., 2016b ApJ, 818, 1, 73.
- Tobin et al. (2018) Tobin J. J. et al., 2018 ApJ, 867, 1, 43.
- Tobin et al. (2019) Tobin J. J. et al., 2019 ApJ, 870, 2, 81.
- Tobin et al. (2020) Tobin J. J. et al., 2020 ApJ, 890, 2, 130.
- Tobin et al. (2022) Tobin J. J. et al., 2022 ApJ, 925, 1, 39.
- Tokovinin (2004) Tokovinin A., 2004 Revista Mexicana de Astronomia y Astrofisica Conference Series Vol. 21, vol. 21 (C. Allen and C. Scarfe), pp. 7–14.
- Tokovinin (2014a) Tokovinin A., 2014a AJ, 147, 4, 86.
- Tokovinin (2014b) Tokovinin A., 2014b AJ, 147, 87.
- Tokovinin (2017) Tokovinin A., 2017 ApJ, 844, 2, 103.
- Tokovinin (2020) Tokovinin A., 2020 MNRAS, 496, 1, 987.
- Tokovinin and Briceño (2020) Tokovinin A. and Briceño C., 2020 AJ, 159, 1, 15.
- Tokovinin and Kiyaeva (2016) Tokovinin A. and Kiyaeva O., 2016 MNRAS, 456, 2, 2070.
- Tokovinin and Moe (2020) Tokovinin A. and Moe M., 2020 MNRAS, 491, 4, 5158.
- Tokovinin et al. (2006) Tokovinin A. et al., 2006 A&A, 450, 681.
- Tokovinin et al. (2020) Tokovinin A. et al., 2020 AJ, 160, 6, 268.
- Tokovinin (2000) Tokovinin A. A., 2000 A&A, 360, 997.
- Tomisaka (2014) Tomisaka K., 2014 ApJ, 785, 1, 24.
- Toomre (1964) Toomre A., 1964 ApJ, 139, 1217.
- Torres et al. (2021) Torres G. et al., 2021 ApJ, 921, 2, 117.
- Trilling et al. (2007) Trilling D. E. et al., 2007 ApJ, 658, 1264.
- Tripathi et al. (2017) Tripathi A. et al., 2017 ApJ, 845, 1, 44.
- Tsitali et al. (2015) Tsitali A. E. et al., 2015 A&A, 575, A27.
- Tsukamoto et al. (2015) Tsukamoto Y. et al., 2015 MNRAS, 446, 2, 1175.
- Tsuribe and Inutsuka (1999) Tsuribe T. and Inutsuka S.-I., 1999 ApJ, 526, 307.
- Turner et al. (2008) Turner N. H. et al., 2008 AJ, 136, 2, 554.
- Tychoniec et al. (2018) Tychoniec Ł. et al., 2018 ApJS, 238, 2, 19.
- Valtonen and Karttunen (2006) Valtonen M. and Karttunen H., 2006 The Three-Body Problem.
- Verrier and Evans (2009) Verrier P. E. and Evans N. W., 2009 MNRAS, 394, 4, 1721.
- Villaseñor et al. (2021) Villaseñor J. I. et al., 2021 MNRAS, 507, 4, 5348.
- Vorobyov and Basu (2005a) Vorobyov E. I. and Basu S., 2005a MNRAS, 363, 1361.
- Vorobyov and Basu (2005b) Vorobyov E. I. and Basu S., 2005b ApJ, 633, L137.
- Wagner et al. (2019) Wagner K. et al., 2019 ApJ, 877, 1, 46.
- Wall et al. (2019) Wall J. E. et al., 2019 ApJ, 887, 1, 62.
- Wang et al. (2014) Wang J. et al., 2014 ApJ, 791, 2, 111.
- Wang et al. (2015a) Wang J. et al., 2015a ApJ, 806, 2, 248.
- Wang et al. (2015b) Wang J. et al., 2015b ApJ, 813, 130.
- Wang et al. (2015c) Wang J. et al., 2015c ApJ, 799, 2, 229.
- Ward-Duong et al. (2015) Ward-Duong K. et al., 2015 MNRAS, 449, 3, 2618.
- Wheelwright et al. (2010) Wheelwright H. E. et al., 2010 MNRAS, 401, 2, 1199.
- Widmark et al. (2018) Widmark A. et al., 2018 ApJ, 857, 2, 114.
- Williams et al. (2014) Williams J. P. et al., 2014 ApJ, 796, 120.
- Williams et al. (2019) Williams J. P. et al., 2019 ApJ, 875, 2, L9.
- Winters et al. (2019) Winters J. G. et al., 2019 AJ, 157, 6, 216.
- Wurster et al. (2019) Wurster J. et al., 2019 MNRAS, 489, 2, 1719.
- Yelverton et al. (2019) Yelverton B. et al., 2019 MNRAS, 488, 3, 3588.
- Youdin and Chiang (2004) Youdin A. N. and Chiang E. I., 2004 ApJ, 601, 1109.
- Youdin and Goodman (2005) Youdin A. N. and Goodman J., 2005 ApJ, 620, 459.
- Young and Clarke (2015) Young M. D. and Clarke C. J., 2015 MNRAS, 452, 3085.
- Zagaria et al. (2021a) Zagaria F. et al., 2021a MNRAS, 504, 2, 2235.
- Zagaria et al. (2021b) Zagaria F. et al., 2021b MNRAS.
- Zanazzi and Lai (2018) Zanazzi J. J. and Lai D., 2018 MNRAS, 477, 4, 5207.
- Zanazzi and Wu (2021) Zanazzi J. J. and Wu Y., 2021 AJ, 161, 6, 263.
- Zapata et al. (2019) Zapata L. A. et al., 2019 ApJ, 872, 2, 176.
- Zhang et al. (2019) Zhang Y. et al., 2019 Nature Astronomy, 3, 517.
- Zhao and Li (2013) Zhao B. and Li Z.-Y., 2013 ApJ, 763, 1, 7.
- Zhao et al. (2020) Zhao B. et al., 2020 Space Sci. Rev., 216, 3, 43.
- Zhu et al. (2012) Zhu Z. et al., 2012 ApJ, 746, 110.
- Ziegler et al. (2020) Ziegler C. et al., 2020 AJ, 159, 1, 19.
- Zúñiga-Fernández et al. (2021) Zúñiga-Fernández S. et al., 2021 A&A, 645, A30.
- Zurlo et al. (2020) Zurlo A. et al., 2020 MNRAS, 496, 4, 5089.
- Zurlo et al. (2021) Zurlo A. et al., 2021 MNRAS, 501, 2, 2305.